tsunamis caused by submarine landslides - · pdf fileoutline; tsunamis caused by submarine...
TRANSCRIPT

Tsunamis caused by submarine landslides
Carl B. Harbitz
Norwegian Geotechnical Institute NGI
International Centre for Geohazards ICG
Understanding Extreme Geohards:
The Science of the Disaster Risk Management Cycle November 28 – December 1, 2011
Sant Feliu de Guixols, Spain

Outline; Tsunamis caused by submarine landslides
Session 2: Preparing for the extreme: quantifying the probabilities and uncertainties of extreme hazards
1. Why are submarine landslide tsunamis extreme? • Governing landslide parameters • Features and characteristics of landslide tsunamis
2. How do we quantify the probabilities? • Where and when do landslide tsunamis occur?
3. How do we address the uncertainties of the extreme events?

Why are submarine landslide tsunamis extreme? • The landslides
• May occur ”anywhere” on the continental margins, also on very gentle slopes
• Have extreme volumes, velocities, and travel distances • ”Unpredictable” ⇒ Unprepared ⇒ Extreme consequences
> 10 m
> 20 m
3-6 m
3-5 m
9-10 m10-12 m
6-7 m
Storegga tsunami deposits Run-up of tsunami deposits
StoreggaSlide
Fig. 1 The 8200 BP Storegga slide Volume: 2400 km3
Max speed: 35 m/s Run-out distance: 150 (800) km

Why are submarine landslide tsunamis extreme?
• The landslides • May occur ”anywhere” on the continental margins • Have extreme volumes, velocities, and travel distances • ”Unpredictable” ⇒ Unprepared ⇒ Extreme consequences
• The tsunami • Severe landslide tsunami impact is most often ”local”, but • for the extreme landslide events the tsunami impact is regional

Most often ”local”: 1998 Papua New Guinea tsunami
• Exceptionally high run-up for the parent earthquake • 10-15 m, 2000 casualties
• Fast decay of run-up with distance along the coast
• Near-field tsunami heights determined by the potential energy of displaced water
• Far-field tsunami heights proportional to displaced water volume above the source
• This immediately suggests a slumping source
• Slump moves less volume than an earthquake, but moves it vertically ~ 100 times as much
Photo: H. Davies
Okal and Synolakis (2003)

Examples of tsunami energy
• Energy of the 8100 BP Storegga Slide tsunami ~10x larger than the 2004 Indian Ocean tsunami or the 1964 Alaska eq tsunami
• Storegga: 0.1 % of slide energy transferred • Indian Ocean: 0.3 % of total radiated earthquake energy
transferred • Large landslides are potentially catastrophic generators

Earthquakes and landslides – different spreading effects in three dimensions
Landslide generated waves Earthquake generated waves
The 8100 BP Storegga Slide tsunami after 30 minutes The 2004 Indian Ocean tsunami after 90 minutes

c
h
a
u
Importance of depth of source, earthquake versus landslide
Earthquake Initial wave length independent of depth, initial period Waves steeper from deep to shallow water (amplification due to shoaling) Seabed displacement in deep water most dangerous
Submarine landslide Wave speed lower in shallow water ⇒ initial wave heights larger Near the coast ⇒ less amplification due to shoaling, but also shorter
waves (favour amplification), and a smaller distance for radial damping (and shorter warning time),
Release in shallow water most dangerous
2/1−∝hT

How do we quantify the probabilities?
• Where and when do landslide tsunamis occur?
• And again: Why so extreme?

> M 8.5
M 8.0-8.5
M 7.5-8.0 < M 7.5
Volcanoes +
Landslides + Unknown/other
* No magnitude
Source location for all recorded tsunamis in the Caribbean – first data from year 1498

Eastern North America
Plenty of evidence that the continental slope of Eastern North America has been subjected to slope instability
1929 Grand Banks landslide and tsunami
Large submarine landslides offshore southeast US during deglaciation(Booth et al. 1993)
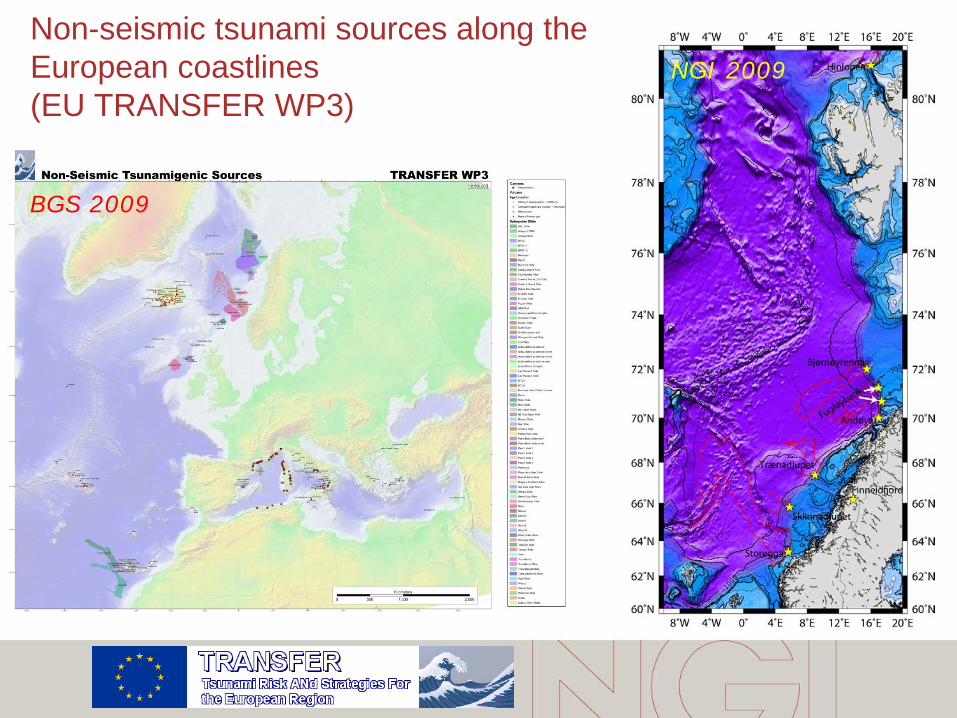
Non-seismic tsunami sources along the European coastlines (EU TRANSFER WP3)
NGI 2009
BGS 2009

The Mediterranean Sea
Urgeles et al. 2008
GIS analayses provide statistics on main landslide parameters

SE Asia
• 20% non-seismic
• ca. 2/3 are volcanic
• and 1/3 landslides, also combined with earthquakes
Source location and year of occurrence for recorded earthquake generated historical tsunamis in South East Asia with source information. Yellow markers indicate non seismic or unknown sources, red markers indicate seismic sources. Large stars magnitudes M ≥ 8.5, small stars 8.5 > M ≥ 8.0, squares 8.0 > M ≥ 7.5, circles M < 7.5, asterisk, no magnitude reported. Upward-pointing triangles indicate volcanoes or combinations of volcanoes and other sources. Downward-pointing triangles indicate landslides or landslides and earthquakes. Diamonds indicate unknown sources.
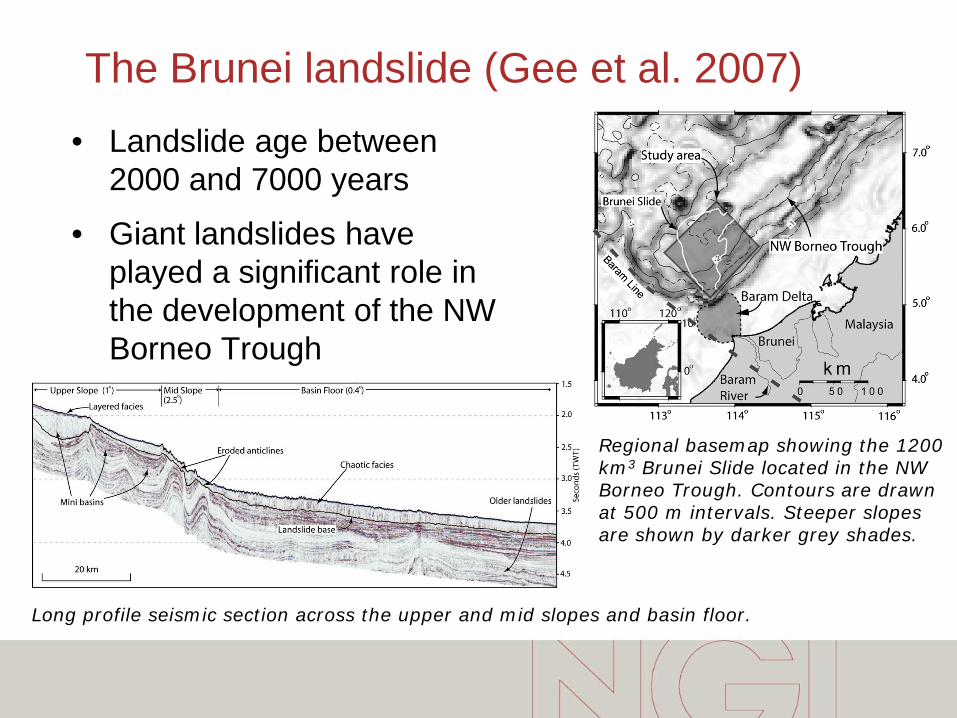
The Brunei landslide (Gee et al. 2007)
Regional basemap showing the 1200 km3 Brunei Slide located in the NW Borneo Trough. Contours are drawn at 500 m intervals. Steeper slopes are shown by darker grey shades.
Long profile seismic section across the upper and mid slopes and basin floor.
• Landslide age between 2000 and 7000 years
• Giant landslides have played a significant role in the development of the NW Borneo Trough
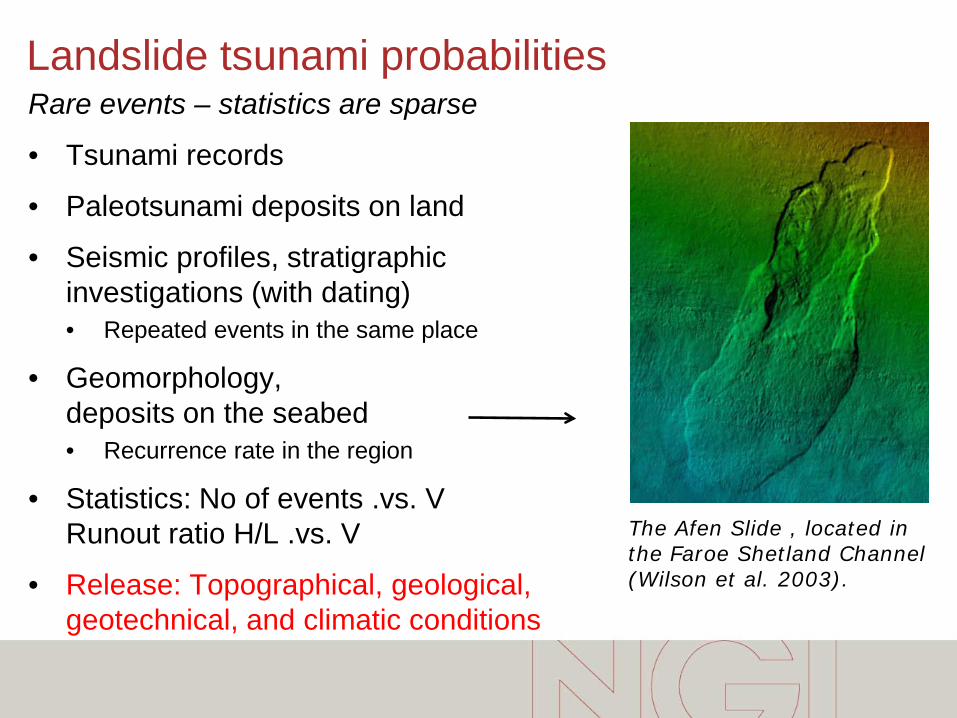
Landslide tsunami probabilities Rare events – statistics are sparse
• Tsunami records
• Paleotsunami deposits on land
• Seismic profiles, stratigraphic investigations (with dating) • Repeated events in the same place
• Geomorphology, deposits on the seabed • Recurrence rate in the region
• Statistics: No of events .vs. V Runout ratio H/L .vs. V
• Release: Topographical, geological, geotechnical, and climatic conditions
The Afen Slide , located in the Faroe Shetland Channel (Wilson et al. 2003).

Basic questions in landslide tsunami hazard assessment
• How similar are the landslides observed in the area,
• how old and how frequent do they seem to be, and
• can similar events occur under today’s conditions? • (or are they related to e.g. (post)-glacial periods, periods of
enhanced isostatic land lift, earthquakes, temperature changes, etc.)

The 8200 BP Storegga Slide Presently low hazard: A new glacial period causing sedimentation and weak layers followed by isostatic landlift and earthquakes is required to trigger new landslides large enough to produce a damaging tsunami

Importance of landslide parameters
Submarine landslides are most often sub-critical
Wave length depends on landslide length
Wave height depends on wave speed (water depth) landslide length!, landslide height initial acceleration
From Jiang and LeBlond 1992
From Bryn et al. 2005

Maximum surface elevation correlates well with slide parametric relations
Ormen Lange analyses: The product of the initial slide acceleration and slide volume acts as a tsunamigenic potential Other combinations gave less consistent results
Correlation seems good over a large range of volumes and dynamical parameters
Results obtained with 2D analytical model strongly supports the parametric relations obtained by the numerical model

The 1856 Djijelli (Algeria) earthquake and tsunami (Roger and Hébert 2008)
• Mw 7.2 earthquake
• A coseismic slip of 1.5 m is consistent with an average convergence rate of about 5–6 mm/yr and a recurrence period of 300–400 years
• For the Balearic Islands: Maximum water heights less than 1 m
• (Bathymetric features are able to produce coastal wave heights larger than 1 to 2m).
• ”This work is a contribution to the study of tsunami hazard in western Mediterranean… and offers a first assessment of the tsunami exposure in the Balearic Islands”
Maximum wave heights with a mean strike of 60o

Balearic Islands: Simulation of the BIG’95 landslide and tsunami 11 500 year BP • Landslide described by Urgeles et al. (2006) • Large waves of more than 10 meters are
produced in the near field • Severe impact on the Balearic Islands and
parts of eastern Spain • Pronounced directivity towards the
Southeast and the Northwest, giving a narrower distribution of maximum surface elevation near the shoreline
• Still, the BIG’95 source could have been capable of generating surface elevations up to 3-5 m in the far-field, at cities like Barcelona and Alicante, as well as along the Algerian coastline
Snapshots of the simulated surface elevation from the BIG’95 landslide near the source area and the Balearic Islands. Top: t = 5 min, bottom: t = 15 min. Vanneste et al. 2011

• On the passive, glacier-fed, northern Svalbard margin • Slope failure about 30 ka (Winkelmann et al. 2006) • Average height of initial slide: about 600 m • Headwall height > 1400 m
The Hinlopen landslide tsunami (Vanneste et al. 2011)
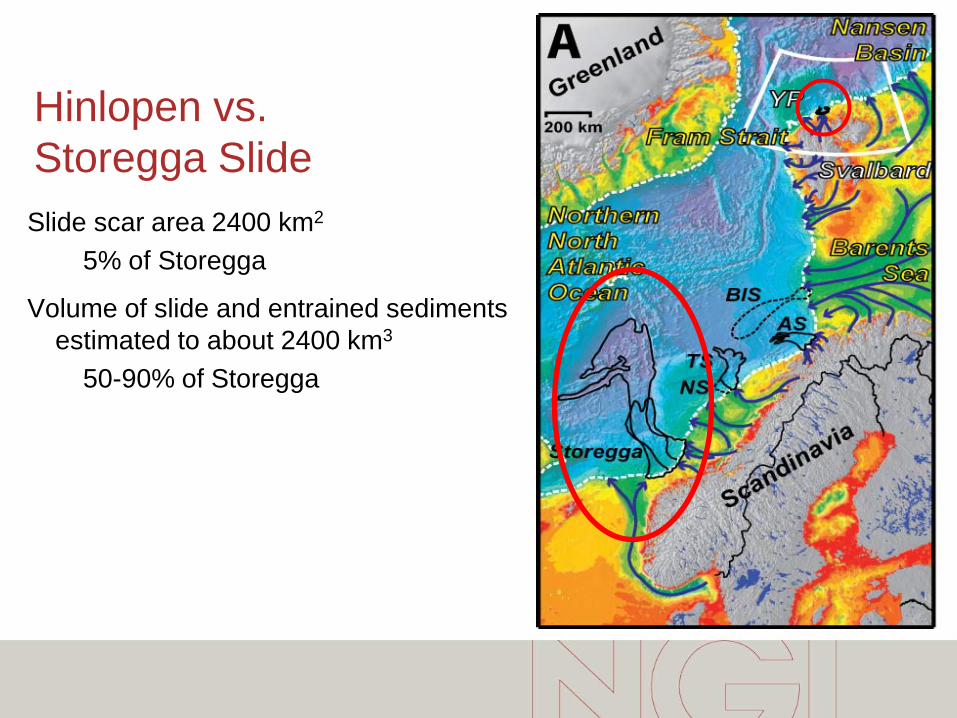
Hinlopen vs. Storegga Slide Slide scar area 2400 km2
5% of Storegga
Volume of slide and entrained sediments estimated to about 2400 km3
50-90% of Storegga

Rafted blocks
• 60 km downslope • Large variation of
dimensions • Largest block 452 m
high, with a volume of 1.89 km3

Hinlopen landslide tsunami; Results • Max. surface elevation for first 6 h
• Surface elevation over 40 m is truncated
• Over 130 m inside generation area
• Over 5-10 m within the entire Arctic Ocean
• Only a few meters in Atlantic/Barents Sea

What about La Cumbre Vieja volcano, La Palma? Ward & Day 2001: Great danger to US East Coast
Wynn & Masson 2003: Danger greatly overestimated - slide volume likely much smaller
Gisler, Weaver & Gittings 2006: Even with maximal slide, danger to US minimal
Løvholt, Pedersen & Gisler 2008: Maximal slide constitutes some danger to US East coast, severe danger to shores of Europe and Africa
• Need to look closer at realistic slide scenarios for La Palma
Ward & Day 2001 Løvholt, Pedersen & Gisler 2008 BGS 2009

How do we address the uncertainties of the extreme events?

For earthquake tsunamis: PTHA – Probabilistic Tsunami Hazard Assessment
Probabilistic method largely inherited from PSHA (Probabilistic Seismic Hazard Assessment)
• Hazard maps produced by Direct applications of the local or regional tsunami statistics Earthquake statistics combined with numerical scenario tsunami
simulations for events with given return periods
Probabilistic tsunami hazard for the northeastern Indian Ocean for three return periods. Preliminary results from Thio et al (2007).

Objections to PTHA (relevant for earthquakes) Still a controversy regarding statistical earthquake models
Probabilities of large tsunamigenic events are associated with large uncertainties Tendency of fixed return periods for mega thrust events Numerical resources needed are higher in PTHA than in PSHA Consequences likely changes rapidly at a certain threshold
Nonlinear relation between metric and consequence, i.e. tsunami loads are “ill-behaving”
Regional PTHA are often constrained to linear models Non-linear PTHA models so far applied to local analysis only
Vulnerability models are few and premature Tsunami risk estimates are anyhow uncertain
The largest and least probable events dominate the risk One source will most often dominate
the probability of the surface elevation exceeding a certain value
The simpler “scenario based
approach” gives the same result
Problems conveying PTHA to landslide generated tsunamis
Searching the risk related to extreme events with limited data bases often calls for “engineering judgment”. Will we than need probabilistic models?
Landslide data usually do not provide equally good statistics as earthquakes
Landslide generated tsunamis are more local than the seismic tsunamis
Local geological and geotechnical settings are crucial
Worst case scenario approach (with upper and lower hazard lines) more suitable for landslide tsunamis
However, the release mechanism is more complex and generally not so well understood, hence not only the frequency/intensity of the source but also the error propagation is important. This calls for random source distributions and stochastic approaches

Prospects for the future
• An increasing area of the seafloor is being mapped
• More contributions from the industry with quality data sets
• Exploration and development in deep water has prompted industrial interest in submarine mass movements • Geohazards • Hydrocarbon traps/reservoirs
• Submarine mass movements and their tsunami potential will acquire a much higher public profile over the next five years
Mosher et al. (2010)