tsx-v : spa | otc : spazf
TRANSCRIPT

TSX-V : SPA | OTC : SPAZF

Certain of the statements and information on this presentation constitute “forward-looking statements” or “forward-looking information”. Forward-looking statements or information are subject to a variety of known and unknown risks, uncertainties and other factors that could cause actual events or results to differ materially from those reflected in the forward-looking statements or information, including, without limitation, risks relating to results from infill and exploration drilling, geotechnical studies, metallurgical studies, planning of tailings facilities, access to power supply, fluctuations in the spot and forward price of gold or certain other commodities, timing of receipt of permits and regulatory approvals, the sufficiency of the Company’s capital to finance the Company’s operations, geological interpretations and potential mineral recovery processes, changes in national and local government legislation, taxation, controls, regulations and political or economic developments in Canada, business opportunities that may be presented to, or pursued by, the Company, operating or technical difficulties in connection with mining activities. In addition, there are risks and hazards associated with the business of gold exploration, development and mining, including environmental hazards, industrial accidents, unusual or unexpected formations, pressures, cave-ins, flooding and gold bullion losses (and the risk of inadequate insurance, or the inability to obtain insurance, to cover these risks). Readers should carefully review the Risk Factors section of the continuous disclosure documents of the Company and the Company’s technical reports available under its profile on the SEDAR website at www.sedar.com for more information on such risks. Although the Company has attempted to identify important factors that could cause actual results to differ materially, there may be other factors that cause results not to be as anticipated, estimated, described or intended. The Company’s forward-looking statements and information are based on the assumptions, beliefs, expectations and opinions of management as of the date of posting on the presentation, and other than as required by applicable securities laws, the Company does not assume any obligation to update forward-looking statements and information if circumstances or management’s assumptions, beliefs, expectations or opinions should change, or changes in any other events affecting such statements or information. For the reasons set forth above, investors should not place undue reliance on forward-looking statements and information.
A Measured or Indicated Mineral Resource is that part of a mineral resource for which quantity, grade or quality, densities, shape and physical characteristics are estimated with sufficient confidence to allow the application of Modifying Factors in sufficient detail to support mine planning and evaluation of the economic viability of the deposit. An Inferred Mineral Resource is that part of a mineral resource for which quantity and grade or quality are estimated on the basis of limited geological evidence and sampling. Geological evidence is sufficient to imply but not verify geological and grade or quality continuity. Mineral Resources are not Mineral Reserves do not have demonstrated economic viability.
International Financial Reporting Standards (IFRS), as issued by the International Accounting Standards Board, are recognized standards for financial reporting in Canada and most jurisdictions. The Company provided certain non-IFRS performance figures for the Project based on guidance issued by the World Gold Council. These non-IFRS measures are intended to provide additional information to evaluate the underlying performance of the Project and should not be considered in isolation or as a substitute for measures of performance prepared in accordance with IFRS. These measures do not have any standardized meaning prescribed under IFRS and therefore may not be comparable with other issuers.
The Company’s measured and indicated resources estimates were prepared in accordance with NI 43-101 by Marc Jutras, P. Eng.; MA Sc. with an effective date of February 3, 2021. Mr. Jutras is a Qualified Person under NI 43-101 and is a consultant who is independent of the Company. Judy Stoeterau, P.Geo., an Officer and Vice-President of Geology of the Company, is a qualified person as defined under National Instrument 43-101. Ms. Stoeterau has reviewed and approved the project’s written technical information presented herein.
TSX-V: SPA | OTC : SPAZF 2

Project
Excellent access & infrastructure in a top-tier mining jurisdiction (British Columbia, Canada)
Modest initial capital cost & low operating cost
Advancing multi-million oz. gold Reserve through critical milestones towards production
Main Zone Mineral Reserve : higher-grade/ near-surface portion of Mineral Resource
Underway: project optimization and environmental assessment
Robust economics shown in Pre-Feasibility Study (2021)
Advanced stage project
>$85m expenditures & >900 drill holes over 180,000 metres
Reserve/ Resource Large & growing resource with ongoing drilling
2.3 Moz Mineral Reserve within 4.7 Moz in M&I Mineral Resource
Allows development flexibility & expansion potential
TSX-V: SPA | OTC : SPAZF 3

Project Attributes
Management Approach
TSX-V: SPA | OTC : SPAZF 4
Renewable Power
Connectivity to hydroelectric power means significantly lowered greenhouse gas emissions
Efficiency
Low power requirements for energy efficient milling process
Communities Empowerment
Long-term thinking and commitments on ESG issues commensurate with a long mine life
Abundance of local labor and suppliers / enhanced local socioeconomic development
Employment Practice
Decades-long practice of hiring employees from First Nations and local communities
First Nations & Communities
Cooperation agreements signed a decade ago with all three First Nations whose traditional territories encompass the project area
Community open houses commenced a decade ago
Prioritize ESG
Direct and hands-on involvement of senior management in social engagement including First Nations & community consultations
Appointment of a senior executive to exclusively focus on sustainability and indigenous affairs
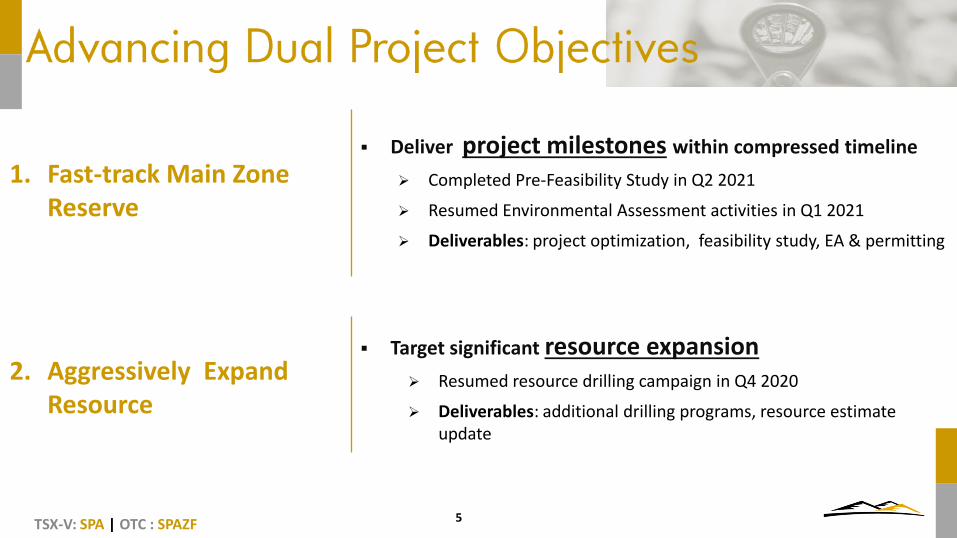
1. Fast-track Main Zone Reserve
Deliver project milestones within compressed timeline
Completed Pre-Feasibility Study in Q2 2021
Resumed Environmental Assessment activities in Q1 2021
Deliverables: project optimization, feasibility study, EA & permitting
2. Aggressively Expand Resource
Target significant resource expansion Resumed resource drilling campaign in Q4 2020
Deliverables: additional drilling programs, resource estimate update
TSX-V: SPA | OTC : SPAZF 5
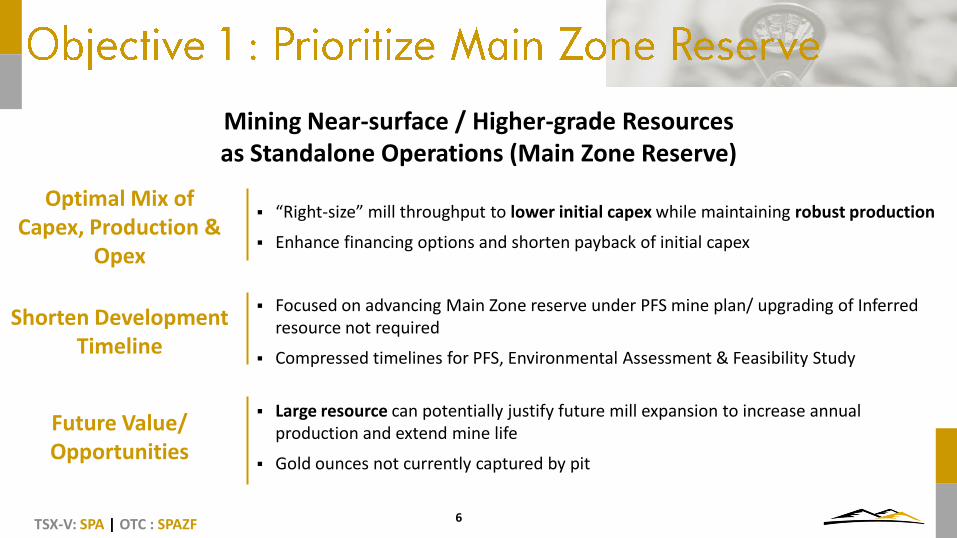
Mining Near-surface / Higher-grade Resources as Standalone Operations (Main Zone Reserve)
Optimal Mix of Capex, Production &
Opex
“Right-size” mill throughput to lower initial capex while maintaining robust production
Enhance financing options and shorten payback of initial capex
Shorten Development Timeline
Focused on advancing Main Zone reserve under PFS mine plan/ upgrading of Inferred resource not required
Compressed timelines for PFS, Environmental Assessment & Feasibility Study
Future Value/ Opportunities
Large resource can potentially justify future mill expansion to increase annual production and extend mine life
Gold ounces not currently captured by pit
TSX-V: SPA | OTC : SPAZF 6

TSX-V: SPA | OTC : SPAZF 7
PFS pit outline
Future Opportunities
Multi-million oz Reserves
Reserve
• Higher grade/ near-surface portion of the large and growing Resource
Mill Feed Profile
Total feed: 96m tonnes
Avg. Au grade: 0.76 g/t (0.88 g/t first 6-yrs)
Total contained gold: 2.34 Moz
Proposed Mine Profile
Throughput: 20ktpd
Initial Capex: C$607m/ US$461m
Mine Life: 14 Years
Avg. Annual Prod’n: >183Koz (1st 6yrs) >150Koz (LOM)
LOM Prod’n: 2.1 Moz

TSX-V: SPA | OTC : SPAZF 8
Tonnage (Mt) Au Grade (g/t) Gold (Moz) Ag Grade (g/t) Silver (Moz)
Proven 40.8 0.79 1.03 0.67 0.88
Probable 55.1 0.74 1..31 0.74 1.30
Total P&P Reserve
95.9 0.76 2.34 0.71 2.18
* See cautionary statements

“Base Case” “Spot Case” “Forward Case”
Pre-tax
NPV@5% C$mm $848 $1,209 $1,570
IRR % 25 31 36
Payback of Initial Capex Years 3.2 2.7 2.4
Post-tax Free Cashflow from Operations (LOM)
C$mm $2,127 $2,670 $3,214
TSX-V: SPA | OTC : SPAZF 9
Gold Price Scenario
8%
13%
18%
23%
28%
33%
38%
43%
48%
$ -
$500
$1,000
$1,500
$2,000
1,400 1,600 1,800 2,000 2,200
Inte
rnal
Rat
e o
f R
etu
rn
NP
V (
C$
Mill
ion
)
Gold Price (US$)
Pre-tax NPV Pre-tax IRR
$ 1B
$1.2B

TSX-V: SPA | OTC : SPAZF 10
Access & Infrastructure
< 100k highway access to Williams Lake (major mining supply centre & labour pool)
Abundance of grid power and BC Hydro substation connectivity
Supplies & labour available from many surrounding communities (low overhead costs)
Year-round access/ accommodating climate/ abundance of water source
Low Milling Cost & Simple Flowsheet
Coarse primary grind of 180 microns
Moderate power consumption—13.8 kwh/t
Cheap hydro power—6.5¢/kwh
Low reagent consumption including 0.1kg/t NaCN

TSX-V: SPA | OTC : SPAZF 11
$906
$1,006 $1,009
$0
$200
$400
$600
$800
$1,000
$1,200
AIS
C p
er
oz
(US$
)
Larg
e P
rod
uce
r
Me
diu
m P
rod
uce
r
Smal
l Pro
du
cer
vs. LOM
Firs
t 6
-yrs
Source: CIBC World Markets/ 2020 actual AISC per Au ounce
Lower-than-average unit cost
Low on global cost curve
Source: BofA Global Research
Spanish Mountain
TSX-V: SPA | OTC : SPAZF 12
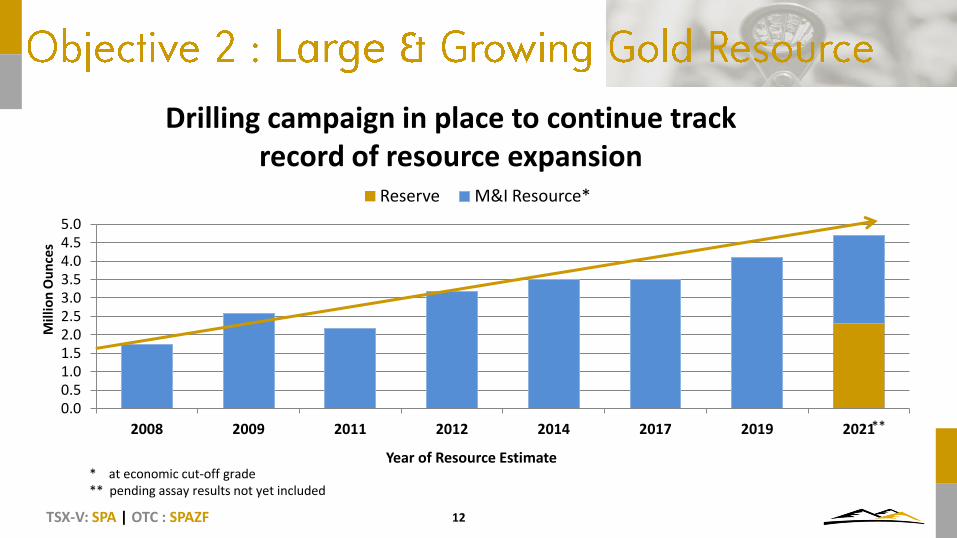
* at economic cut-off grade ** pending assay results not yet included
0.0 0.5 1.0 1.5 2.0 2.5 3.0 3.5 4.0 4.5 5.0
2008 2009 2011 2012 2014 2017 2019 2021
Mill
ion
Ou
nce
s
Year of Resource Estimate
Reserve M&I Resource*
**
Drilling campaign in place to continue track record of resource expansion

TSX-V: SPA | OTC : SPAZF 13
Strategy/ Approach
Tested 4 broad areas in resource with limited historic drilling
Potential to expand resource along strike & at depth
Key Findings
Long intercepts (up to 69m) reported in all 4 tested areas at above economic cut-off grade
13.72m grading 1.04 g/t, including 3.05m grading 2.10 g/t in hole 20SMRC-1256
21.34m grading 0.54 g/t, including 10.67m grading 0.82 g/t in hole 20SMRC-1253
50.29m grading 0.41 g/t, including 1.52m grading 3.68g/t in hole 20SMRC-1233
Significant Potential: Area 1
8 of a total of 9 drill holes return intercepts longer than 10m (up to 32m)
Entire northern resource pit boundary (with strike length > 1 km) shows potential both along strike & at depth
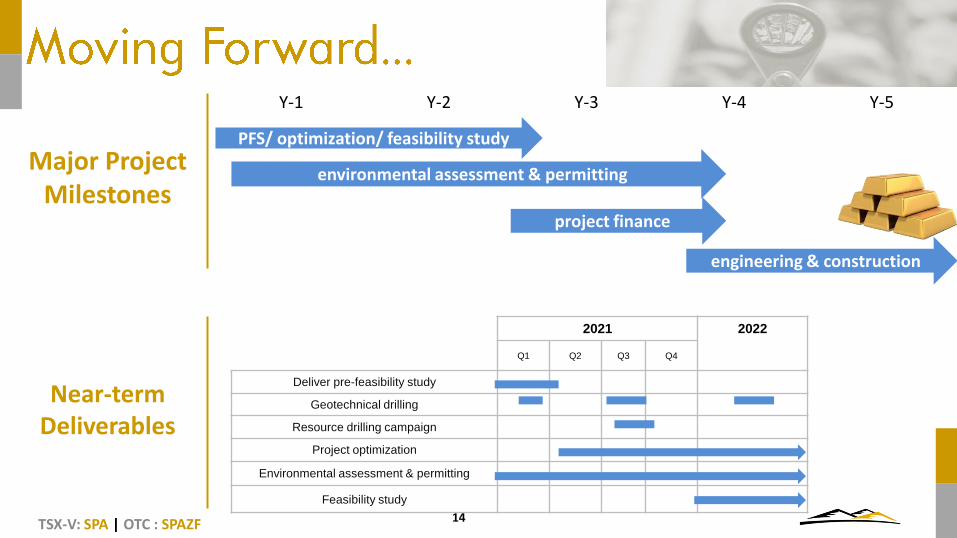
Major Project Milestones
Y-1 Y-2 Y-3 Y-4 Y-5
TSX-V: SPA | OTC : SPAZF 14
PFS/ optimization/ feasibility study
environmental assessment & permitting
project finance
engineering & construction
2021 2022
Q1 Q2 Q3 Q4
Deliver pre-feasibility study
Geotechnical drilling
Resource drilling campaign
Project optimization
Environmental assessment & permitting
Feasibility study
Near-term Deliverables

Jurisdiction/ Location • Mining friendly/ excellent access & infrastructure
Large Reserve/Resource • 2.3 Moz P&P Reserves / 4.6 Moz M&I Resource & growing + Inferred
Accelerated Timeline • Building on detailed work performed over a decade (environmental baseline;
metallurgical; archaeological clearance)
Modest Initial Capex* • Prioritize Main Zone reserve for development/ optimal balance of cost &
benefits
Simple Metallurgy* • Conventional flowsheet & low cost milling / 90% Au Recovery to Doré
Low OpCost* • AISC $801 per oz : excellent Infrastructure & access + hydro grid-power & more
Long Mine Life* • 14 years (Main Zone Reserve alone)
Robust Production* • > Avg 150Koz per year (>180Koz first 6-yrs/ peak production 210Koz)
Strong Economics* • NPV $848M & IRR 25% @ $1600 Au/ NPV $1.2B & IRR 31% @ $1800 Au
TSX-V: SPA | OTC : SPAZF 15
* as demonstrated in 2021 PFS

Marketcap/Net Asset Value*(5% disc.)
<0.15 Production cost*: AISC per oz (LOM avg)
US$801 Marketcap per Reserve* oz
<US$35 Marketcap per Resource oz
<US$15 Post-tax Free cashflow from Operations*
>$120M/Yr or >$1.7 B LOM
Production per year* (First 6-yr avg)
>180K oz (first 6-yrs)
>150 K oz (LOM)
TSX-V: SPA | OTC : SPAZF 16
* @ US$1600 gold price; only includes PFS valuation for Reserves

TSX-V: SPA | OTC : SPAZF 17
Location De-risking Activities Resource
Resource
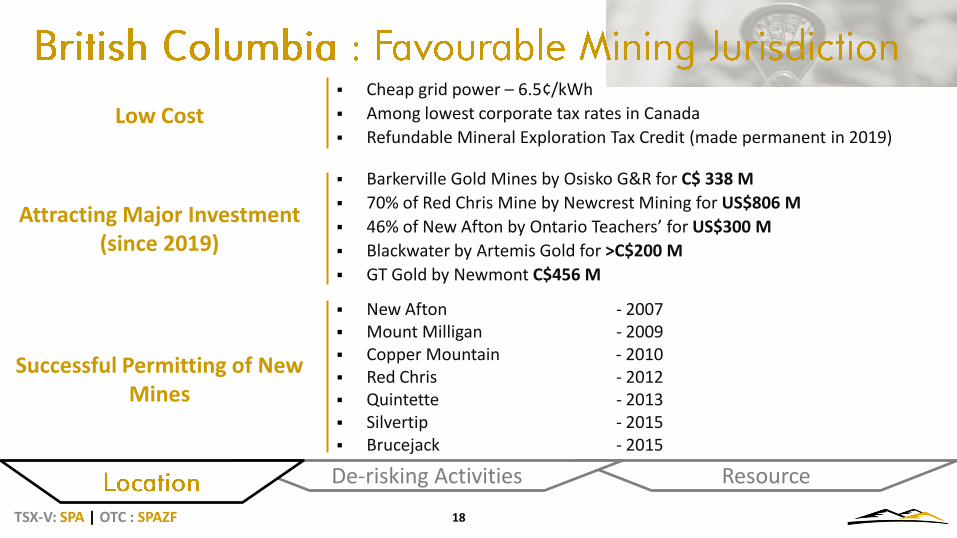
Low Cost Cheap grid power – 6.5¢/kWh
Among lowest corporate tax rates in Canada
Refundable Mineral Exploration Tax Credit (made permanent in 2019)
Attracting Major Investment (since 2019)
Barkerville Gold Mines by Osisko G&R for C$ 338 M
70% of Red Chris Mine by Newcrest Mining for US$806 M
46% of New Afton by Ontario Teachers’ for US$300 M
Blackwater by Artemis Gold for >C$200 M
GT Gold by Newmont C$456 M
Successful Permitting of New Mines
New Afton - 2007 Mount Milligan - 2009 Copper Mountain - 2010 Red Chris - 2012 Quintette - 2013 Silvertip - 2015 Brucejack - 2015
TSX-V: SPA | OTC : SPAZF 18
De-risking Activities

Resource De-risking Activities
TSX-V: SPA | OTC : SPAZF 19
Top-tier Pro-mining Jurisdiction
Low political risks/ strong resource sector
Attracted major in-bound investments in recent years
Solid track record of new mine permitting
Excellent Mining Infrastructure & Access
Close to producing mines – Gibraltar, QR Mine & Mount Polley
Paved highway access directly from supply hubs
Cheap hydroelectric power grid
Year-round support centre in Williams Lake (97km on highway) – labour, CAT Dealership, maintenance & supplies
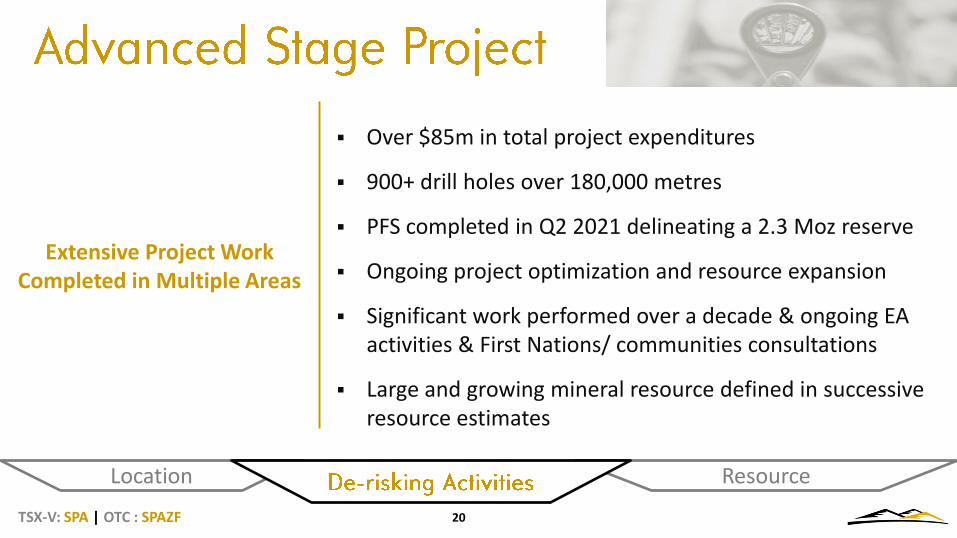
Extensive Project Work Completed in Multiple Areas
Over $85m in total project expenditures
900+ drill holes over 180,000 metres
PFS completed in Q2 2021 delineating a 2.3 Moz reserve
Ongoing project optimization and resource expansion
Significant work performed over a decade & ongoing EA activities & First Nations/ communities consultations
Large and growing mineral resource defined in successive resource estimates
Resource Location
TSX-V: SPA | OTC : SPAZF 20

Resource Location
TSX-V: SPA | OTC : SPAZF 21
Crush & Grind Flotation Regrind CIL
Simple Flowsheet & High Au Recovery
Confirmatory testwork completed at multiple laboratories
Efficient conventional milling – coarse grind, moderate power cost of 13.8 kwh/t and low cyanide consumption of 0.1 kg/t
Overall gold recovery at 90% 90 % overall Au Recovery
+ Ag credit

Community Engagement
Protocol Agreements signed with all three First Nations bands providing a framework towards Benefits Agreements
Long-standing practice of sourcing employees from First Nations and local communities
Environmental Archaeological clearance obtained for critical project areas
Continuing work on environmental baseline studies (initiated in 2009)
Permitting
Environmental assessment process resumed in 2021
Expected permitting timeline: < 2 years after completion of Feasibility Study
Resource Location
TSX-V: SPA | OTC : SPAZF 22

Location
TSX-V: SPA | OTC : SPAZF 23
De-risking Activities
Sediment-Hosted Gold Deposits
One of the first recognized sediment-hosted bulk tonnage gold systems in British Columbia
Gold is finely disseminated within black argillites and siltstones, as well as well local high-grade, gold-bearing quartz veins within siltstones, greywackes and tuff
Sediment-hosted gold deposits are among the largest gold dominant systems in the world. These giants include Muruntau (>100 M oz), Sukhoi Log (>50M oz), Natalka (>48 M oz) and Paracatu (>10M oz).
They tend to be low grade but because of their large size are low cost producers
They form along major tectonic breaks and there are usually multiple deposits
Geology Argillite
Siltstones/ Argillite
Altered Siltstone w/ Mafic Dykes
Tuff – Greywacke w/ Siltstone
Intrusion

PFS delineates Proven & Probable Mineral Reserves totaling
96 million tonnes @ 0.76 g/t = 2,339,000 ounces Au (<50% of M&I resource)
Resource Category Tonnes
(Million)
Gold grade
(g/t)
Gold
(Million oz)
Silver grade
(g/t)
Silver
(Million oz)
Measured 69 0.59 1.3 0.67 1.5
Indicated 226 0.47 3.4 0.73 5.3
M&I Total 294 0.50 4.7 0.72 6.8
Inferred 18 0.63 0.4 0.76 0.4
Location
TSX-V: SPA | OTC : SPAZF 24
De-risking Activities
* See cautionary statements
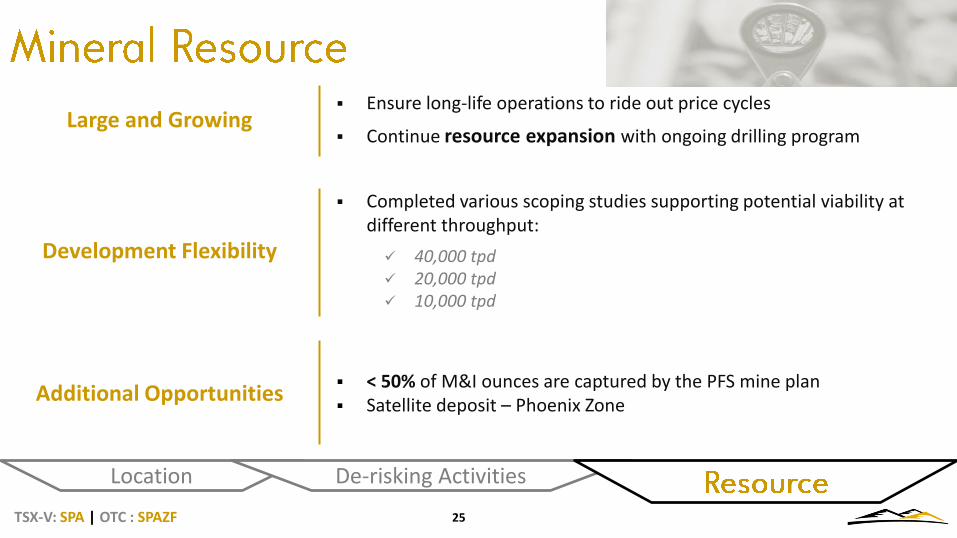
Large and Growing Ensure long-life operations to ride out price cycles
Continue resource expansion with ongoing drilling program
Development Flexibility
Completed various scoping studies supporting potential viability at different throughput:
40,000 tpd 20,000 tpd 10,000 tpd
Additional Opportunities < 50% of M&I ounces are captured by the PFS mine plan Satellite deposit – Phoenix Zone
Location
TSX-V: SPA | OTC : SPAZF 25
De-risking Activities

Location
TSX-V: SPA | OTC : SPAZF 26
De-risking Activities
Phoenix Zone
Strike length over 3.5km in length & less
than 2km from the Main Zone
Preliminary metallurgical testing suggests material is amenable to same processing flowsheet as Main Zone

TSX-V: SPA | OTC : SPAZF 27
52%
18%
30%
Retail
Institutional (Eric Sprott 16%; Others 14%)
Management
Cash & Capital Structure
Net cash $8m
Share issued & outstanding 327m
Warrants 73m
Options 7m
Market capitalization $100m

TSX-V: SPA | OTC : SPAZF 28
Management Expertise Industry & Business
Experience
Larry Yau, CEO M&A, finance >30 yrs
Sharon Ng, CFO finance, accounting >20 yrs
Judy Stoeterau, VP-Geology exploration, geology >30 yrs
Ray Mah, Project Director engineering, project management,
mine construction >30 yrs
Doug Ramsey, Director, Sustainability & Indigenous Affairs
environmental assessment, permitting > 30 yrs
Board of Directors
W. Terry Maclean mine construction, operations >40 yrs
Sara Heston investment, finance >15 yrs
Don Coxe Investment strategist >40 yrs
Christopher Lattanzzi project consulting >40 yrs
Dale Corman Project management, executive >40 yrs
Full biography at: www.spanishmountaingold.com

Spanish Mountain Gold Ltd.
1120-1095 West Pender St. Vancouver, B.C., V6E 2M6 Canada www.spanishmountaingold.com Larry Yau, CEO Email: [email protected] Or Tel:+1 (604) 398-4377
Subscribe for email update:
https://spanishmountaingold.com/contact/subscribe-for-updates/
TSX-V: SPA | OTC : SPAZF 29

TSX-V: SPA | OTC : SPAZF 30

TSX-V: SPA | OTC : SPAZF 31
* PFS base case assumption
Gold Price (USD)
Pre-tax Economics $1,200 $1,400 $1,600 $1,800 $2,000 $2,200 $2,400
NPV(5%) $M $125 $487 $848 $1,209 $1,570 $1,932 $2,293
IRR % 9% 18% 25% 31% 36% 42% 47%
Payback Yrs 5.4 4.0 3.2 2.7 2.4 2.1 1.9
Cumulative Free Cashflow from Operations
$M $1,040 $1,583 $2,127 $2,670 $3,214 $3,758 $4,301
Post-tax Economics
NPV(5%) $M $129 $415 $655 $888 $1,119 $1,350 $1,580
IRR % 9% 16% 22% 27% 31% 36% 39%
Payback Yrs 5.5 4.0 3.3 2.8 2.5 2.2 2.0
Cumulative Free Cashflow from Operations
$M $1,041 $1,454 $1,797 $2,140 $2,484 $2,828 $3,173
TSX-V: SPA | OTC : SPAZF 32
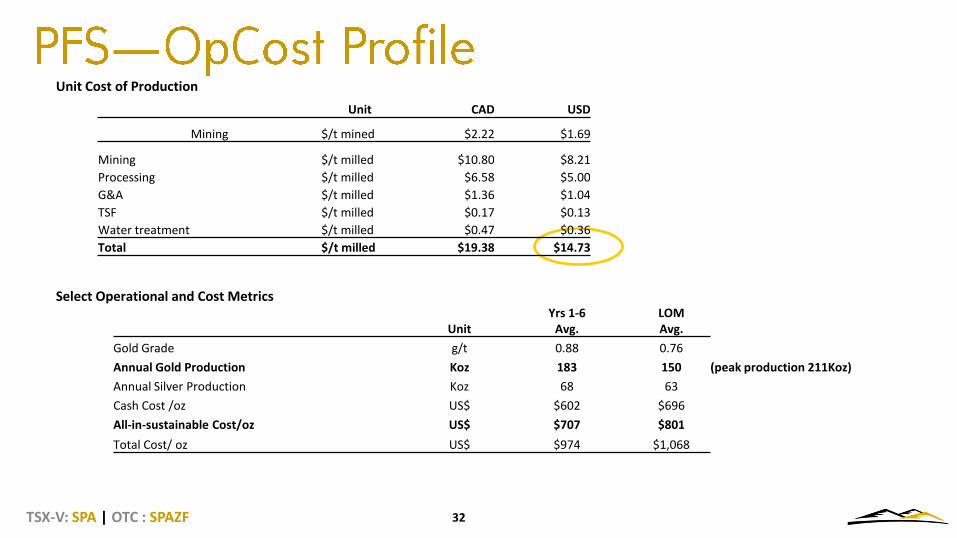
Unit Cost of Production
Unit CAD USD
Mining $/t mined $2.22 $1.69
Mining $/t milled $10.80 $8.21
Processing $/t milled $6.58 $5.00
G&A $/t milled $1.36 $1.04
TSF $/t milled $0.17 $0.13
Water treatment $/t milled $0.47 $0.36
Total $/t milled $19.38 $14.73
Select Operational and Cost Metrics
Unit Yrs 1-6
Avg. LOM Avg.
Gold Grade g/t 0.88 0.76
Annual Gold Production Koz 183 150 (peak production 211Koz)
Annual Silver Production Koz 68 63
Cash Cost /oz US$ $602 $696
All-in-sustainable Cost/oz US$ $707 $801
Total Cost/ oz US$ $974 $1,068
TSX-V: SPA | OTC : SPAZF 33
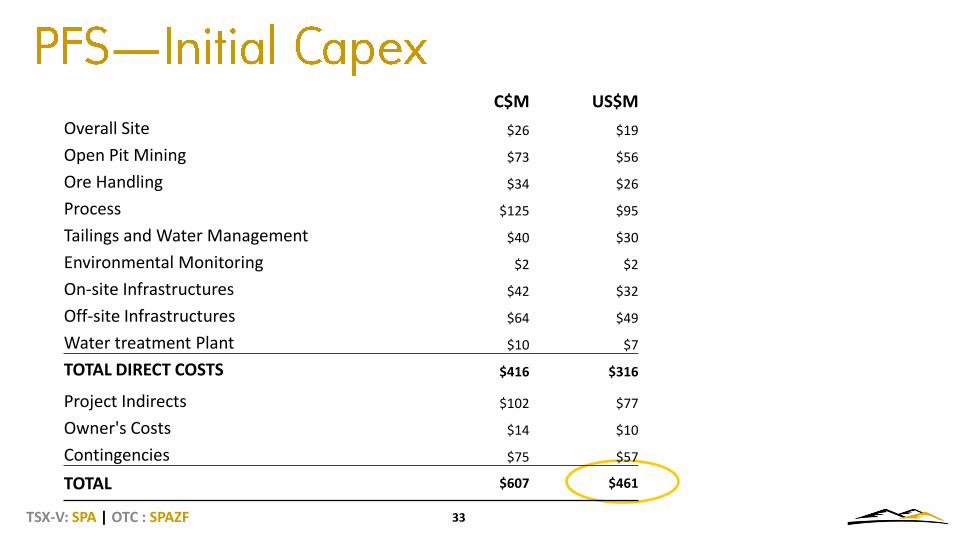
C$M US$M
Overall Site $26 $19
Open Pit Mining $73 $56
Ore Handling $34 $26
Process $125 $95
Tailings and Water Management $40 $30
Environmental Monitoring $2 $2
On-site Infrastructures $42 $32
Off-site Infrastructures $64 $49
Water treatment Plant $10 $7
TOTAL DIRECT COSTS $416 $316
Project Indirects $102 $77
Owner's Costs $14 $10
Contingencies $75 $57
TOTAL $607 $461