tta : annual report 2011
DESCRIPTION
Annual Report 2011TRANSCRIPT

ANNUAL REPORT 2011
ExtendingOur Footprint

2
01 Important Changes and Developments
2011 Soleado acquired a 20% stake in Baria Serece as part of an overall strategy to create an
integrated logistics business in Vietnam.
TTA acquired three dry bulk vessels, two in the second-hand market and one new build
vessel.
Soleado acquired an additional 1.166% ownership in Petrolift Inc. (“Petrolift”) to have 40.0%
ownership.
Soleado acquired 33.33% of Qing Mei Pte. Ltd. (“Qing Mei”) to develop a new coal-mining
project in Indonesia.
TTA redeemed the second tranche of convertible bonds amounting to US$ 34.30 million.
The aggregate principal amount of outstanding bonds as of 30 September 2011 was US$ 34.30
million.
Asia Offshore Drilling Limited (“AOD”) raised US$ 180 million from the international capital
markets and signed contracts to build 3 jack-up rigs worth USD 538 million with Singapore
Keppel FELS Limited (“Keppel FELS”). Mermaid and Seadrill Limited (“Seadrill”) each
own 33.75% of AOD. AOD shares were successfully listed on the Oslo Stock Exchange
on 15 July 2011.
The total owned fleet as of 30 September 2011 consisted of fifteen dry bulk vessels, eight
offshore support vessels, and two tender drilling rigs. Additionally, approximately 5.70 dry bulk
vessels were chartered in to meet client demand.
2010 Soleado acquired a 38.83% stake in Petrolift, a petroleum tanker company in the Philippines.
Mermaid acquired a 100% stake in Subtech Ltd. in Seychelles to expand its subsea engineering
services in the Middle East.
TTA issued unsubordinated and unsecured domestic debentures of Baht 4.0 billion to refinance
existing loans and to increase working capital.
TTA redeemed the first tranche of convertible bonds amounting to US$ 34.30 million. The
aggregate principal amount of outstanding bonds as of 30 September 2010 was US$ 68.60
million.
TTA acquired four dry bulk vessels, three in the second-hand market and one new build vessel.
Mermaid acquired one second-hand and three new build subsea vessels.

2 Thoresen Thai Agencies Public Company Limited
01 Important Changes and Developments
2011 Soleado acquired a 20% stake in Baria Serece as part of an overall strategy to create an
integrated logistics business in Vietnam.
TTA acquired three dry bulk vessels, two in the second-hand market and one new build
vessel.
Soleado acquired an additional 1.166% ownership in Petrolift Inc. (“Petrolift”) to have 40.0%
ownership.
Soleado acquired 33.33% of Qing Mei Pte. Ltd. (“Qing Mei”) to develop a new coal-mining
project in Indonesia.
TTA redeemed the second tranche of convertible bonds amounting to US$ 34.30 million.
The aggregate principal amount of outstanding bonds as of 30 September 2011 was US$ 34.30
million.
Asia Offshore Drilling Limited (“AOD”) raised US$ 180 million from the international capital
markets and signed contracts to build 3 jack-up rigs worth USD 538 million with Singapore
Keppel FELS Limited (“Keppel FELS”). Mermaid and Seadrill Limited (“Seadrill”) each
own 33.75% of AOD. AOD shares were successfully listed on the Oslo Stock Exchange
on 15 July 2011.
The total owned fleet as of 30 September 2011 consisted of fifteen dry bulk vessels, eight
offshore support vessels, and two tender drilling rigs. Additionally, approximately 5.70 dry bulk
vessels were chartered in to meet client demand.
2010 Soleado acquired a 38.83% stake in Petrolift, a petroleum tanker company in the Philippines.
Mermaid acquired a 100% stake in Subtech Ltd. in Seychelles to expand its subsea engineering
services in the Middle East.
TTA issued unsubordinated and unsecured domestic debentures of Baht 4.0 billion to refinance
existing loans and to increase working capital.
TTA redeemed the first tranche of convertible bonds amounting to US$ 34.30 million. The
aggregate principal amount of outstanding bonds as of 30 September 2010 was US$ 68.60
million.
TTA acquired four dry bulk vessels, three in the second-hand market and one new build vessel.
Mermaid acquired one second-hand and three new build subsea vessels.

1Annual Report 2011
01
2009 TTA established Soleado Holdings Pte. Ltd. (“Soleado”) as an investment holding company for
projects, assets, or companies outside of Thailand.
TTA acquired an 89.55% stake in Unique Mining Services Public Company Limited, a coal
logistics company in Thailand, as part of an overall strategy to create an integrated coal
business.
Soleado acquired a 100% stake in Baconco Co., Ltd., a fertiliser company in Vietnam. Soleado
acquired a 21.18% stake in Merton Group (Cyprus) Ltd., which has a coal mining joint venture in
the Philippines.
Mermaid raised SG$ 156 million by way of a rights issue to pursue its business growth.
2008 TTA won Thailand’s Best-Managed Medium-Cap Corporation Award from Asiamoney Magazine.
2007 TTA issued convertible bonds in an amount of US$ 169.80 million to fund a gradual fleet
renewal and expansion plan.
Mermaid raised SG$ 246 million from its initial public offering on the Singapore Exchange
Securities Trading Limited.
2006 TTA stressed greater diversification in its business by increasing its stake in Mermaid to 74.01%
as of 30 September 2006 to increase its exposure in the rapidly expanding offshore oil and gas
markets.
TTA was named one of the 200 best listed companies in Asia with revenues under US$ 1 billion
from Forbes Asia magazine.
2005 TTA won the Best Performance Award in the Service Industry category from the SET.
1995 The ordinary shares of Thoresen Thai Agencies Plc. (“TTA”) were listed on the Stock
Exchange of Thailand (“SET”).
1993 Thoresen Thai Agencies Ltd. became a holding company. It was decided that Thoresen Thai
Agencies Ltd. would own shares of all newly established Thoresen Group companies, including
all vessel owning companies, as the dry bulk fleet started to expand.
1986 In order to separate the ship agency and brokerage businesses from the ship owning business,
Thoresen Thai Offshore Ltd. changed its name to Thoresen Thai Agencies Ltd. on 20 October
1986. All ship agency and brokerage activities were transferred to this company.
1926 Thoresen & Co., Ltd., Hong Kong established a branch office in Thailand to provide ship agency
and brokerage services.

2 Thoresen Thai Agencies Public Company Limited
ExtendingOur Footprint

3Annual Report 2011
1. Important Changes and Developments 1
2. Financial Highlights 4
3. Message from Chairman 5
4. Letter to Shareholders 6
5. Audit Committee’s Report 16
6. Board of Directors 18
7. Executives Officers 20
8. Business Review and Outlook 23
9. Corporate Social Responsibility Policy 62
10. Management Discussion & Analysis 63
11. Statement of the Board of Directors Responsibilities for the Financial Statements 70
12. Consolidated and Company Financial Statements 71
13. Income Structure 142
14. Audit Fees 142
15. Risk Factors 143
16. Shareholdings by Directors/Executives 154
17. Shareholders/Dividend Policy 155
18. Corporate Governance Report 156
19. Inside Information Control 180
20. Related Party Transactions 181
21. Company Investments 183
22. Glossary of Maritime Terms/Coal Terms/Fertiliser Terms 188
23. The Company 194
Contents

4 Thoresen Thai Agencies Public Company Limited
Year Ended 30 September
2011 2010 2009
(Baht in millions, except share, per share data, and ratios)
Income Statement Data:
Voyage revenues 5,430.10 9,272.55 13,842.17
Voyage expenses* 2,819.35 4,885.73 8,115.66
Vessel operating expenses - owner expenses* 1,477.52 2,153.14 2,890.82
Offshore services revenues 5,542.74 3,476.37 5,209.87
Offshore services expenses 3,911.52 2,641.82 3,310.88
Sales 6,249.37 4,667.09 365.80
Cost of sales 5,283.13 3,844.31 320.26
Revenues from service companies and other sources* 782.77 674.90 688.32
Depreciation and amortisation 2,099.52 1,962.03 1,778.93
General and administrative expenses* 1,740.25 1,817.31 1,969.29
Interest expenses 619.61 510.62 378.05
Interest income 139.89 94.65 125.43
Equity income (loss) from associates and joint venture 110.23 80.31 29.88
Foreign exchange gains (losses) 91.78 24.34 (9.87)
Net income 139.47 795.57 1,813.71
Per Share Data:
Net income - basic 0.20 1.12 2.56
Cash dividends declared 0.00 0.26 0.54
Net book value 43.66 44.54 43.91
Balance Sheet Data (at end of year):
Cash and marketable securities 4,781.31 10,414.49 11,822.56
Vessels, rigs, machinery, and equipment - net of depreciation 22,567.21 21,907.37 13,471.96
Total assets 48,130.36 48,873.46 41,640.83
Total liabilities 17,216.42 17,341.32 10,549.39
Issued share capital 708,004,413 708,004,413 708,004,413
Total shareholders’ equity 30,913.94 31,532.14 31,091.44
Other Financial Data:
Net cash flows provided by (used in) operating activities 144.99 1,652.50 5,000.69
Net cash flows provided by (used in) investing activities (3,955.33) (10,883.10) (4,617.08)
Net cash flows provided by (used in) financing activities (884.89) 7,202.92 (1,111.25)
Capital expenditures :
Property, plant and equipment, and intangible assets 4,122.40 8,356.00 4,726.32
Financial Ratios:
Return on shareholders’ equity (%) 0.54% 3.04% 7.06%
Return on total assets (%) 0.29% 1.76% 4.33%
Net profit margin (%) 0.79% 4.44% 9.09%
Total debt to total capitalisation 0.32 0.31 0.18
Net debt (cash) to total net capitalisation 0.24 0.11 (0.18)
Note *: Exclude one-off items
02 Financial Highlights

5Annual Report 2011
03 Message from Chairman
Thoresen Thai Agencies Public Company Limited (“TTA” or the “Company”) formulated a focused diversification strategy four years ago when dry bulk shipping was its predominant business and at an all-time high. In 2011, the benefits of this strategy have become more apparent. TTA’s move into new but related activities of energy and infrastructure has taken concrete form. At the same time, the dry bulk shipping business, which, as foreseen, has declined for three years as a result of massive supply and demand imbalances, has reduced in size, as all older vessels were sold off. Thus, in 2011, TTA was able to achieve a more balanced revenue profile to offset the continuing decline in shipping revenues.
Since the end of 2010, TTA has not made any new investments, as each line of business now has two key businesses. TTA has concentrated its focus on improving the efficiency and performance of its existing investments, and developing and monitoring its coal assets in the Philippines and Indonesia in a prudent and cautious manner. Following an annual review of the Company's strategy, TTA is adopting a philosophy under which companies in the group have more autonomy over key decisions, but are monitored by the parent company under broad
corporate policies. The Board of Directors and management believe that this approach will deliver more efficiency and value to TTA’s shareholders.
With these changes, it is important for the Company to modify and strengthen its framework of corporate governance, risk management, and internal controls. The Board of Directors has adopted a revised corporate governance system to reflect the new holding company structure and has set up a Corporate Governance Committee to oversee its implementation. In addition, TTA realises the need for better communications with all
stakeholders and the public in general, as it has a very large and varied stakeholder base.
In a challenging and difficult year like 2011, TTA has been able to rely on the dedication and professionalism of its management and staff to perform exceptionally well, despite adverse conditions and unconstructive distractions. I would like to thank all of them for their efforts and excellent performance in 2011.
Yours sincerely,
Mr. Aswin Kongsiri Chairman

6 Thoresen Thai Agencies Public Company Limited
04 Letter to Shareholders
five years, TTA focused on global
or regional growth opportunities
in the Asia Pacific region that
emphasised the commodities and
logistics sectors.
Financial strength to invest in
assets or companies: TTA ended
the financial year with Baht
3,797.38 million of cash and a
debt to equity ratio of 0.47:1. High
profits from the dry bulk shipping
boom from 2004 to 2008 allowed
TTA to lower its overall leverage
and increase its cash levels. This
in turn allowed TTA to invest in
assets or companies over the
past three years and to generate
free cash flow at the same time
to meet expenses and pay
dividends to shareholders.
Strong leadership to execute
business plans: As professionals
manage the daily operations of
every business unit, TTA focuses
on the recruitment, development,
and performance management of
the top two levels of each business
unit. TTA primarily works through
each business unit’s Board of
Directors and senior management
to drive strategic priorities and
deliver results.
Centralised services to reduce costs
across business units: TTA’s shared
services focus on information
technology, infrastructures and
standard IT application platforms
and procurement processes for
high cost items that are purchased
by multiple business units. As part
of this centralisation of certain
services, overlapping employees
across business units were
reduced.
Thoresen Thai Agencies Public
Company Limited (“TTA” or the
“Company”) earned Baht 139.47
million in 2011, down 82.47%
from Baht 795.57 million in 2010,
primarily due to difficult dry bulk
shipping conditions. The dry bulk
shipping downturn was
considered a high probability
scenario as early as 2007, and
TTA revised its business plans to
cope with the current dry bulk
shipping downturn.
2009: Beginning of Five-Year
Strategic Plan
To achieve more consistent
revenues and profits and to
improve long-term shareholder
value, TTA embarked on a
five-year strategic plan to invest
in related or adjacent businesses
to dry bulk shipping that have
growth potential. Phase 1 of the
strategic plan, which saw
investments in oil tanker
shipping, coal mining and
logistics, fertilisers, and ports,
has been achieved. Phase 2 of
the strategic plan, which is the
ongoing management and value
creation of our businesses, has
already begun.
The success of TTA’s strategic
plan requires a number of
factors:
Expertise to source, analyse, and
structure investments in a
disciplined manner: As other
economies are expected to have
stronger growth potential than
Thailand over the next three to

7Annual Report 2011
In addition to the above factors,
TTA manages its businesses
with high standards of
professionalism, transparency,
and governance. These standards
are important, because the
Company wants to do things with
class. TTA wants to be ambitious
and has been able to establish
a number of successful
partnerships, because it is
recognised as a reliable partner
and global investor driven by
ethical standards and values.
TTA has been awarded a five-star
corporate governance rating
from the Thai Institute of
Directors (“IOD”) in recognition of
its high governance standards.
Strong Headwinds in 2011
TTA encountered numerous
difficulties or “headwinds” in
2011. In the last twelve months
alone, a hostile attack on TTA was
launched, the Thor Nexus was
captured by Somali pirates, one
facility of Unique Mining Services
Public Company Limited (“UMS”)
was closed due to environmental
protests in Samut Sakorn
province, and the significant
floods in Thailand closed the
other UMS facility in Ayudhya
province and disrupted the lives of
many employees.
Apart from the above difficulties,
many in difficult market conditions.
Freight rates remained low during
2011. The average Baltic Dry
Index (“BDI”) for 2011 was not this
low since 2002. Offshore services
demand only improved in the last
six months. Difficult market
conditions forced all major
business units to analyse and
make tough restructuring
decisions. Business strategy and
internal control reviews occurred,
and headcount has been reduced
across all major businesses.
By following its strategic
plan and making appropriate
management decisions, TTA was
able to produce solid revenues
and normalised operating
results. Total revenues declined
1.98% to Baht 17,565.07 million
in 2011. Even though freight
revenues declined 41.44%,
offshore service revenues and
sales increased 44.80% to offset
the drop in freight revenues.
Normalised EBITDA
but EBITDA of other business
units offset the decline in dry bulk
shipping. The consolidated
EBITDA margin increased to
14.48%. A similar picture is true
at the earnings before interest
and taxes (“EBIT”) level. Dry
bulk shipping produced negative
EBIT, but all other business units
increased their EBIT in 2011
versus 2010. This is clear
evidence that the five-year
strategic plan is achieving results.
TTA has spent more than Baht
5,277.75 million over the past
three years to invest in UMS,
Petrolift Inc., and Baconco Co.,
Ltd. This sum is lower than the
amounts already invested in dry
bulk shipping and Mermaid
Maritime Public Company Limited
(“Mermaid”). Therefore, TTA’s
performance remains dependent
on dry bulk shipping and Mermaid,
while the other businesses are
projected to grow and contribute
more profits in 2013 and beyond.
Transition to Strategic
Investment Company
TTA has become a strategic
investment company focused on
some key investment themes,
including emerging market
growth and commodities. A
capital allocation decision was
made to reduce TTA’s exposure to
dry bulk shipping and invest
further in energy and
infrastructure. TTA has taken a
strategic decision that it does not
need to own 100% of every
business unit.
04
Baht million
0
500
-500
1,000
1,500
2,000
2,500
3,000
3,500
2010 2011
OthersDry bulk shipping
MermaidUMS
Baconco
The graph above demonstrates
that on a normalised basis,
consolidated earnings before
interest, taxes, depreciation, and
amortisation (“EBITDA”) in 2011
rose 1.31% to Baht 2,543.65
million. Dry bulk shipping EBITDA
fell 50.32% to Baht 898.39 million,

8 Thoresen Thai Agencies Public Company Limited
Key business principles include:
• Through financial strength and
diversity of assets, TTA wants to
be in a position to invest when
asset values are low.
• TTA is developing a first class
investment capability across a
range of assets that allows it to
analyse and structure a few of the
many opportunities that
continually arise.
• TTA wants to manage the
business portfolio well so that
dividends can be paid through all
parts of the business cycle and
have both the business portfolio
and dividends grow over time.
By following these principles, TTA
expects to increase long-term
shareholder value. Based on the
current outlook, more than 50%
of TTA’s revenues and cash flow
should come from the Energy
Group alone in the next two years.
Dry bulk shipping looks weak for
the next two years, while offshore
services and coal look promising.
After a few years, dry bulk
shipping should improve, while
other business units could
plateau. Long-term strategic
thinking and balanced and
disciplined capital allocation will
be the key responsibilities of the
Board of Directors and senior
management.
Leadership Requirements
TTA is building a culture of
accountability and long-term
thinking among business
managers. Expectations placed
on business managers are clear:
Execute in the face of change:
Markets are becoming more
volatile, and adjustments need to
be made to cope with different
market conditions.
Stay humble: Managers must
listen well and lean on different
people for advice. Good teamwork
is needed to serve clients, and
humility is an essential ingredient
of good teamwork.
Senior management is a
humbling experience. TTA will
continue to make well-analysed
investments, so managers are
expected to be smart and
disciplined risk takers. We have
made mistakes and learned a lot
over the last five years. We are
more resilient, and to be a senior
manager, you must have a
competitive fire that demands
daily improvement.
Repositioning TTA
Because 2008 was an
unprecedented historical peak for
the dry bulk shipping business,
any comparison between this
peak and the current market
downturn is misleading. A review
of comparable shipping
companies demonstrates that
many have performed similarly or
worse than TTA.
Investments take different times
to gel. Some investments, like
greenfield coal projects, take 3-5
years before showing their full
potential. Other investments, like
Baconco and UMS, require
turnaround. Baconco has turned
around faster than expected,
while UMS has been beset with
various short-term issues, which
its management was under
tremendous pressure to solve
quickly. Others, like Petrolift and
Baria Serece, have yielded solid
results. Thus, the overall portfolio
has performed better than
perhaps has been suggested by
some observers.
Repositioning TTA in volatile
times has demanded patience
from shareholders. There is
strong belief in the five-year
strategic plan at all levels in TTA,
and the results are moving in the
predicted direction. TTA can
compete by being intelligent and
united in its decisions, because it
is very difficult to achieve
consistent results in highly
cyclical businesses.
All major investment decisions
are made only after a great deal
of due diligence, a process that is
undertaken internally, and with
significant assistance from
specialised and experienced
outside advisors. TTA stands by
its investments and believes in
the long-term value they add for
its stakeholders. Courage and
fighting spirit are two admirable
qualities that are needed today.
04

9Annual Report 2011
04
It is part of the job to be
criticised, but the only way to
survive is to show that everyone
is united. If we are not united, the
work done over the past three
years could be wasted.
Closing Summary
The Board of Directors and
management team consider
ourselves fortunate to be here
and remain loyal and committed
to TTA’s success. We also realise
that our positions are based on
your continued support. If
shareholders decide that there
are better people to serve them,
the Board and management are
willing to accept this decision.
But at the same time, it is
also our job to ensure that
shareholders are aware of key
strategic plans and if any
potential takeover attempts
or proxy solicitation battles are
done, what the potential
outcomes could be. This
underscores TTA’s ultimate
responsibility as a listed company
that believes in world-class
corporate governance: everything
must be done to ensure that all
shareholders benefit equally and
not only a small minority.
Right now, TTA has a very good
basic situation. The basics of the
business portfolio and its potential
are right. The truth is that the
diversification investments are
for the most part profitable, and
the greenfield coal projects will
be profitable once their
operations achieve commercial
scale. Many pure play shipping
companies are now losing
money. TTA has a mix of short,
medium, and long-term
investments that have been set
up to create sustainable returns
for shareholders. The feedback
we have had has been
overwhelmingly positive from
shareholders who understand
that these changes do not
happen over night.
TTA has managers and teams
that are ready for a fight, because
we see them in action every day.
A simple message to you is: trust
us, this team has qualities, and
this team will fight. We hope as
well that in many years, people
will look at this period and think
that we have put TTA on the right
track and defended the right
values and think that together
we were not too bad.
Rather than personally
discussing the details of each
business unit, the lines of
business have been asked to
review the 2011 results and to
offer their outlooks. We hope that
you get the same sense that we
do – our businesses have solid
growth opportunities and more
importantly, we are focused on
building quality businesses.
Yours sincerely,
M.L. Chandchutha Chandratat
President & Chief Executive
Officer

10 Thoresen Thai Agencies Public Company Limited
140
120
100
80
60
40
20
0Jan-00 Dec-01 Dec-03 Dec-05 Dec-07 Dec-09 Dec-11
BDI
Jinhui
Navios Golden Ocean Genco Excel
Mercator Norden DryShips CMB Diana Safe Bulkers
U-Ming STX Pan Ocean Pac Basin Precious Sincere TTA
TRANSPORT GROUP
04
The Transport Group made Baht 271.15 million of net profit contribution to TTA in 2011, a 67.93% decrease from 2010. The most significant business is dry bulk shipping, which recently completed its fleet reconfiguration plans. Dry bulk shipping owns a fleet of 15 modern Supramax vessels and recorded gains of Baht 587.04 million on sales of 15 aging vessels, enabling the Transport Group to report a positive net profit for the year.
Dry Bulk Shipping
Freight revenues decreased 41.44% to Baht 5,430.10 million, as the number of vessels and available service days fell. Dry bulk shipping lost Baht 24.93
million on a normalised EBIT basis. Vessel oversupply is a global situation, which will continue to depress dry bulk freight rates over the next 18-24 months, but one that TTA has taken a number of steps to address.
As a point of reference, TTA earned record profits of Baht 8,776.44 million in 2008, which was a year of unprecedented freight rates. The BDI, which assesses freight rates over 26 shipping routes, reached a high of 11,793 points in May 2008 and averaged 8,614 points for the entire year. In 2011, the BDI reached a high of 2,784 points and averaged 1,657 points for the year. Therefore, the revenue
environment for dry bulk shipping has fallen 80.76 % since 2008 due to the vessel oversupply situation.
The performance of TTA shares and a group of 16 peers from 2000 to 2011 is shown below and remains closely correlated to the BDI. The performance and market capitalisation of all dry bulk shipping companies have fallen significantly since 2008. Most dry bulk shipping companies have suffered declines similar to or even more drastic than that of TTA. For example, Diana Shipping and Pacific Basin’s stock is down 80% since that peak in 2008. Star Bulk Carriers is down 90%. This is no surprise, as the BDI has also come down by 80% in the same period.
Market Cap Evolution of Peers
Dry Bulk Peers Vs Baltic Dry Index (Since 2000) Index performance since 2000
Source: Bank of America Merrill Lynch
(1) Change since 2000 or since IPO
Asian Bulkers
BDI U-Ming STX Pan Ocean Pac Basin Precious Sincere TTA Jinhui Mercator
Change Since 2000(1) 45.7% 543.4% (28.6%) 39.6% 3,340.0% 376.2% 2,911.9% 300.0% (80.%)
LTM CHANGE (3.9%) (29.1%) (48.1%) (33.9%) (9.5%) (24.3%) (1.9%) (49.7%) (55.1%)
International Bulkers
Norden Dry ships CMB Diana Safe Bulkers Navios Golden Ocean Genco Excel
Change Since 2000(1) 2,835.4% (88.6%) 65.6% (53.9%) (67.2%) (28.0%) 11.2% (62.5%) 4.0%
LTM CHANGE (29.9%) (60.2%) (29.8%) (37.3%) (25.1%) (23.0%) (48.9%) (45.1%) (64.7%)
(Index)

11Annual Report 2011
04
As shipping has historically been a cyclical industry, stock prices also track that cyclicality. As 2007 and 2008 represented unprecedented highs for the dry bulk business, comparing a historic boom period to today provides a misleading analysis.
Shipping will remain a core business, and further investments will be made as good opportunities arise. Good profits can be made in any cyclical business. The basic strategy is to invest in assets at low prices. Once the market picks up, profits will increase quickly, allowing debt to be repaid. Assets are reduced once the downturn appears, and reinvestment occurs when the market picks up again.
TTA is in the process of separating dry bulk shipping into a separate business unit. All Thai-owned vessels are being transferred to Thoresen Shipping Singapore Pte. Ltd. (“TSS”), a wholly owned subsidiary, and flagged in Singapore, which offers strong tax incentives for the shipping business. All eight remaining Thai-owned vessels shall be transferred to TSS by the end of January 2012. TSS will become the exclusive business unit for the dry bulk shipping business under TTA, at which point TSS can seek outside capital to grow the business in the future.
Another strategic element involves an organisational restructuring. A 20% reduction in headcount was executed in September, as the chartering team was moved to Singapore. Basing the commercial team in
Singapore would allow better relationships with a greater pool of clients, as Singapore is Asia’s leading shipping hub. TTA expects the restructuring move to increase revenues and optimise general and administrative expenses. The current shipping strategy has positioned the dry bulk shipping business to run at a modest profit or breakeven level until market conditions improve.
The expansion of piracy prone trade lanes to include the vast majority of the Indian Ocean created enormous commercial and operational pressure on the dry bulk shipping company. Prior to 2011, Somalian pirates concentrated efforts in the Gulf of Aden. However, by using captured “mother ships”, they were able to expand their activities geographically. As Thoresen has always used the Red Sea/East Mediterranean to Asia trade lane as a primary component of its commercial activity, the organisation was forced to adapt quickly to a new environment. Part of this adaptation was to shed older and slower vessels.
Thoresen’s fleet renewal programme continued with the addition of the Thor Fortune, a sister ship to the Thor Friendship. The Thor Fortune was delivered in June 2011, and immediately began contributing to Thoresen’s aim of lowering its operating costs.
Petrolift
The investment in Petrolift continues to perform as
projected. Petrolift’s contribution to TTA’s net profit increased from Baht 51.86 million in 2010 to Baht 114.50 million in 2011, as the investment was closed in April 2010. On a quarterly basis, Petrolift delivered consecutive quarter on quarter (“qoq”) growth in equity income to TTA in 2011. As most of the Petrolift fleet is on period time charter, results are highly predictable. TTA has received dividends of Baht 77.31 from Petrolift million to date.
With an addition of a new tanker in September 2011, Petrolift currently operates a young (ten-years-old average age) fleet of nine petroleum tankers/barges, including one liquefied petroleum gas tanker. The fleet has a total capacity of approximately 38 million litres, or 230,000 barrels, transporting fuel oil, refined petroleum and LPG products to all major ports and depots in the Philippines.
In 2012, Petrolift is looking to expand its business depending on the success of tender bids. As a policy, Petrolift will not purchase a new tanker unless a period time charter secures it. The return on investment in Petrolift was 12% in 2011 based on profits. Petrolift’s value has grown, and its stable business model has lessened the volatility impact of the dry bulk shipping business.
Yours sincerely,
Mr. David Ames Executive Vice President, Transport
• New Managing Director and Commercial Director of dry bulk shipping business were appointed
• Downsized the organisation by 77 people
• Completed 216 voyages and carried more than 8.07 million tonnes of cargo in dry bulk shipping
• The crew and the Thor Nexus were safely returned after four months under pirate control
2011 Highlights

12 Thoresen Thai Agencies Public Company Limited
The Infrastructure Group made Baht 301.10 million of net profit contribution to TTA in 2011, a 3.51% decrease from 2010. The two significant businesses are Baconco and UMS.
Unique Mining Services
UMS is a major part of TTA’s plan to create an integrated coal business. TTA can mine, ship, and sell coal as part of a single supply chain. Looking at the value of UMS separately to the value of the coal mines is not accurate.
It is no secret that UMS has had issues, both internally and externally. But, UMS’ overall situation is improving. Revenues increased 30.28% to Baht 3,275.62 million, as sales increased to 1.4 million tonnes of coal. Normalised EBITDA increased 22.03% to Baht 273.95 million, as average selling prices increased throughout the year. UMS made Baht 192.29 million on a normalised EBIT basis, an increase of 26.16% from 2010.
UMS had to manage difficult issues in 2011. The Samut Sakorn plant was closed down in July 2011 due to environmental protests that affected all coal operators in the province. After numerous discussions with the Samut Sakorn government and other related parties, the Samut Sakorn plant has been allowed to move its remaining stockpile of 0-5 mm coal out. After the 440,000 tonne stockpile has been removed, UMS can recommence full operations, which is expected by the middle of 2012.
INFRASTRUCTURE GROUP
The Ayudhya plant was closed down in October 2011 due to the flooding situation. Management must be complimented for executing a strong flood response plan that allowed the Ayudhya plant to be the only production facility that was not flooded in the area. The Ayudhya plant plans to ramp up production to 5,500 tonnes per day in January 2012, allowing sales volumes to resume ahead of many competitors.
We must also recognise that despite these issues, UMS operating profitability continues to improve as a result of significant efforts in the past two years to enhance and reorganise the business. For example, headcount has been reduced from 400 to 343 as of December 2011. Outstanding inventories are being reduced to position UMS for greater success and we believe that the fruits of this labour have yet to be fully realised.
The improving results and active response to the challenges UMS faced in 2011 is a direct result of the new management team that was appointed over the past two years. Their unrelenting drive and commitment towards improving processes, driving change, and managing people in the face of adversity is a clear testament that UMS is on a path to achieve its strategic objectives.
For 2012, UMS continues to focus on business process
improvements, coal upgrade technologies, expanding market share across all segments, coal trading in domestic and international markets, and closer integration with TTA’s Transport and Energy Groups.
Baconco and Baria Serece
Baconco continues to perform well. Revenues increased 38.18% to Baht 2,970.48 million, as sales increased to 190,524 tonnes. In Vietnamese Dong (VND) terms, normalised EBITDA increased 10.72% from VND 170,872.07 million to VND 189,193.75 million (or equivalent to Baht 282.90 million), but gross margins fell to 11.89% as raw materials increased rapidly, and Baconco was not able to fully pass through these cost increases. Baconco made Baht 260.03 million on a normalised EBIT basis, an increase of 0.32% from 2010. Based on net profits, TTA’s return on investment in Baconco in 2011 was 58%, and over the past two years, the return on investment was 115%.
Vietnam fertiliser consumption is expected to gradually increase. Raw material prices are expected to rise, so the strategy is to secure long-term agreements with key suppliers, strengthen pesticide sales to offset increasing pressure on fertiliser margins, and continue to develop export business in Indonesia and Thailand.
04

13Annual Report 2011
Another increasing source of profits will be warehouses. Capacity utilisation was 83% in October, and more land was acquired in August to construct another 6,000 square metres of warehouse space by the end of December 2011. These investments are funded by the company’s own cash reserves. Given Baconco’s high profitability, TTA shall receive dividends of Baht 109.58 million in February 2012.
Next door to Baconco is Baria Serece, which contributed Baht 23 million to TTA through equity
income, representing an 8.6% return on investment since December 2010. Dividends of Baht 6.41 million were received on 17 November 2011. Port volume is estimated to be on plan at 4.55 million tonnes in 2011 and expected to increase 24% in 2012. By 2013, the quay will be upgraded to accommodate 80,000 deadweight tonne ("dwt") vessels, financed by own cash reserves. In September 2011, Baria Serece ordered a fifth shore crane.
TTA’s strategy in Vietnam continues to be the integration of the Baria Serece port business
with Baconco’s warehousing business and the ship agency and logistics businesses of Thoresen Vinama Agencies Co., Ltd. TTA is able to provide door to door logistics services with this integration and the throughput volume of Baria Serece is expected to improve, as cargo loading and discharging can be done with higher efficiency.
Yours sincerely,
Mr. Vichai Chuensuksawadi Executive Vice President, Infrastructure
04
2011 Highlights • Ayudhya plant production increased to compensate for stoppage of Samut Sakorn plant • Granular coal production and sales of 49,000 tonnes by UMS
• Marketing of new warehouse facilities resulted in two logistics contracts with multinational firms • Cash subsidies and assistance provided to more than 120 flood-affected staff in UMS
• Baconco registered trademarks in Laos and Cambodia to pursue more export opportunities

14 Thoresen Thai Agencies Public Company Limited
The Energy Group made Baht 110.00 million of net losses contribution to TTA in 2011, a 44.93% improvement from 2010. The most significant business is Mermaid.
Mermaid Maritime
As oil prices stabilised above US$ 80 per barrel, demand for offshore services increased, and Mermaid’s overall situation improved significantly. Revenues increased 59.44% to Baht 5,542.82 million, as subsea fleet utilisation improved to 69%. Normalised EBITDA increased 238.61% to Baht 1,191.08 million, as average day rates increased 10.9% in 2011. Mermaid made Baht 245.44 million on a normalised EBIT basis compared to a loss of Baht 255.11 million in 2010. Excluding non-cash impairment charges, Mermaid would have reported a net profit in 2011.
For 2012, utilisation is expected to remain at 2011 levels, as the supply/demand balance remains tight. The outlook for 2013 onwards is bullish, as growth in fleet sizes is expected to lag spending growth. Mermaid has strengthened its commercial and project management capabilities and aim to secure higher value added work in more offshore areas.
More work is being conducted outside of Thailand, and Mermaid will be focusing on securing work on a global basis through its newly established international marketing office in Singapore as well as its Subtech and Seascape offices in their respective
ENERGY GROUP
territories. In 2011, the subsea group provided services to over 20 clients, with an increasing number of contracts being awarded in the Middle East.
The drilling business had no major changes. MTR-2 was at 95.8% utilisation during 2011 with Chevron (Indonesia), and the contract will expire in March 2012.
MTR-1, on the other hand, was off-hire in 2011. Subsequent to the Macondo accident, it has become increasingly challenging for older rigs of age 20+ years old to get a drilling contract award. However, good progress has been made to deploy MTR-1 as an accommodation work barge in Indonesia.
Asia Offshore Drilling Ltd. (“AOD”) was a major success story. It successfully completed two rounds of fund raising for US$ 180 million, the latter one done in July 2011 under tough market conditions. Seadrill Limited (“Seadrill”), one of the most successful drilling companies in the world, took a 33.75% ownership in AOD, equal to Mermaid. This partnership with Seadrill provides AOD with a strong platform to further develop its business. AOD was successfully listed on the Oslo Stock Exchange in July 2011 as a start up business.
AOD has ordered three high-specification jack-up rigs with Keppel FELS Limited (“KFELS”). In September 2011, AOD decided to increase the water depth capacity for its three jack-up rigs under construction from 350 feet to 400 feet. This investment will
increase the marketability of the rigs, allowing them to successfully operate in more offshore areas. These upgrades will have some impact on the delivery schedule of the first two rigs, as the first rig will now be delivered in the first calendar quarter of 2013 and the second rig will be delivered by the end of the second calendar quarter of 2013. The delivery of the third rig remains unchanged at the end of the third calendar quarter of 2013.
In 2011, the drilling and subsea divisions received significant awards from long-time clients for outstanding operating performance and safety records. These awards are a testament of Mermaid’s strong technical capabilities and emphasis on safety, which will play an increasingly important role in competing for jobs moving forward. During the year, Mermaid made numerous changes to its senior management team to address the challenging market conditions. These changes were necessary in an environment where “business as usual” was clearly not an option, and Mermaid is now cautiously optimistic that the changes will continue to bear fruit with the improving financial performance.
TTA has stated in the past and continues to believe that the Energy Group will drive up to 50% of revenues within the next two years. Coal will be a part of this but still remains a smaller portion of the portfolio compared with Mermaid and dry bulk shipping.
04

15Annual Report 2011
SERI targets to produce 1 million tonnes annually by 2015 from at least two or three mine sites. It is difficult to predict commodity prices four years in advance, but the average price for SERI’s high quality thermal coal thus far in 2011 has been around US$ 94/tonne, net to SERI after transaction costs. Assuming this price, TTA projects revenues from SERI in the neighbourhood of US$ 100 million by 2015.
Merton Group/SERI
Merton Group (Cyprus) Ltd. (“Merton”) primary investment is SKI Energy Resources Inc. (“SERI”), which has not achieved full production yet. Merton produced negligible losses to TTA. SERI is an investment in which TTA has a direct 47.07% economic interest following a recent capital increase. As a comparison point, the recent injection of new equity into SERI, worth US$ 25.3 million, is roughly the cost of a 5-year old second hand Supramax dry bulk vessel.
High growth companies often require additional equity or capital. As production is increasing at the first mine and plans to develop the second and third mines come to fruition, a capital increase at SERI was always planned to supplement the cash flows generated from the first mine. Following this capital increase, SERI will be in a strong financial position to fund its growth plans.
04
2011 Highlights • Mermaid’s balance sheet remained healthy, with a debt to equity ratio of 0.38:1 • Mermaid Offshore Services Ltd. (“MOS”) worked on more than 40 projects in 2011 from full subsea services to vessel charters
• SERI sold 50,000 tonnes of coal in 2011, primarily to domestic clients • Mermaid’s impairment charges of Baht 204 million were taken against MTR-1 and an old MOS project – DPIII.
• Exploration work is well advanced at Qing Mei, and mine reserve estimates will be available in early 2012
Yours sincerely, Mr. John Crane Executive Vice President, Corporate Strategy
Yours sincerely, M.L. Chandchutha Chandratat President & Chief Executive Officer

16 Thoresen Thai Agencies Public Company Limited
Audit Committee’s Report05
The Audit Committee of TTA Group consists of 3 independent directors viz., Prof.Dr. Warapatr Todhanakasem as the Chairman of the Audit Committee, Dr. Siri Ganjarerndee and Mr. Sak Euarchukiati, both, as Audit Committee members. The Audit Committee has performed with total responsibility in compliance with the Audit Committee Charter approved by the Board of Directors and the requirements of the Securities and Exchange Commission and the Stock Exchange of Thailand, which is summarised as follows.
In the year of 2011, meetings of the Audit Committee have been held through the year to review consolidated financial statements of the Company and its subsidiaries and meetings with external auditor were also held every quarter for discussion of the Auditor’s report, financial statements and recommendations of the relevant accounting standards. The Audit Committee is of the opinion that the Company has a proper financial reporting process to disclose its financial information, in which the financial statements are correct, sufficient and credible.
The Audit Committee has considered the independence of Internal Audit Department including the chain of command in order to establish the credibility and independence of Internal Audit Department. The Audit Committee has also discussed with internal auditors the scope of internal auditing, their responsibilities and functions and approved the internal audit plan for the internal audit department. In the year 2011, Internal Audit Department reviewed the internal control activities of all departments and reviewed the operations of shipping business such as the revenue cycle, bunkering, dry docking, crew management, ship management and treasury. Internal auditors also followed up on the results of the aforesaid review. The results of the review and the recommendations were discussed with the related staff and management and reported to the Audit Committee.
The Audit Committee is of the opinion that the Company has proper and adequate internal control systems for the current business operations. With a wider scope of business engagement, the Company is continuously strengthening the efficiency and effectiveness of the internal control system.
The Audit Committee is of the opinion that the Company has been in compliance with laws and regulations to which the operations of the Company are subjected. Principally, these laws are the Public Limited Companies Act, Revenue Code, Thai Vessels Act, SEC Act and regulations of the SET.
Internal Auditors have reviewed the connected transactions according to the Notifications of the Stock Exchange of Thailand Re: The Disclosure of Information and Acts of Listed Companies Concerning Connected Transactions 2003 as amended from time to time and Notification of the Capital Market Supervisory Board No. TorChor. 21/2551 Re: Rules on Connected Transactions and circular letter of the Securities and Exchange Commission about the recommended practice to be followed under section 89/12 (1) of the Securities and Exchange Act (No.4) B.E. 2551. The result of the review of the connected transactions in 2011 has been discussed in the Board of Directors’ Meeting No. 2/2012 held on 21 December 2011. Audit Committee and Board of Directors are of the opinion that the aforesaid transactions are fair and for the full benefit of the Company.
During the year 2011, Internal Auditors reviewed the Asset Disposal Transactions of the Company’s subsidiaries according to the Notification of the Stock Exchange of Thailand (SET) regarding the Disclosure of Information and Other Acts of Listed Companies Concerning the Acquisition and Disposition of Assets 2004 and Notification of the Capital Market Supervisory Board No. TorChor. 20/2551 Re: Rules on Entering into Material Transactions Deemed as Acquisition or Disposal of Assets. The Audit Committee was of the opinion that the asset disposal transactions of the Company’s subsidiaries were reasonable and for the best benefit of the Company.
In the year 2011, the Internal Audit department also commenced the review of the management’s plan for the transition to International Financial Reporting Standards (IFRS), the potential impact on the Company

17Annual Report 2011
05
as well as its financial reports and systems to provide its oversight in order to ensure that management’s transition plan demonstrates clear understanding of the extent of change, identify all key conversion activities, the timetable, the resources required, and education for people throughout the Company who will be affected by the transition. The Executive Vice President, Corporate Finance and Accounting updated the Audit Committee about the progress of management’s implementation of the IFRS transition plan to the Audit Committee every quarter in the Audit Committee Meeting of 2011.
Normally, the Audit Committee Meeting is held before the Board of Directors’ Meeting so that the minutes of the Audit Committee Meeting and discussions with Internal Auditors and external audits without management’s presence in such discussions could be sent to the Board of Directors for acknowledgement, discussions and receiving suggestions from the Board.
The Audit Committee reviewed the scope of internal audit work and its audit plans; reviewed the major findings during the year and management’s responses thereto; and ensured the suitability of the internal audit function as well as the adequacy of TTA’s internal controls. The formal Audit Committee Meeting usually takes around 4 hours. In the year 2011, Audit Committee held 8 regular meetings and 1 special meeting. The record of attendance of the members of Audit Committee is summarised as follows:
Audit Committee Member Position 2011 2010
Regular Meeting
Special meeting
Regular Meeting
Special meeting
1. Mrs. Pratana Mongkolkul Ex-Audit Committee Chairman 6/8 - 9/9 -
2. Prof.Dr. Warapatr Todhanakasem Audit Committee Chairman - 1/1 - -
3. Dr. Siri Ganjarerndee Audit Committee Member 6/8 - 9/9 -
4. Mr. Sak Euarchukiati Audit Committee Member 6/6 1/1 - -
5. Mr. Aswin Kongsiri Ex-Audit Committee Member 2/2 - 9/9 -
Mr. Sak Euarchukiati was appointed to the Audit Committee to replace Mr. Aswin Kongsiri who took the Chairman of the Board position by resolution of the Board of Directors dated on 28 January 2011.
Prof. Dr. Warapatr Todhanakasem has been appointed the Chairman of the Audit Committee to replace Mrs. Pratana Mongkolkul who resigned from the Board of Direcotrs and Chairman of the Audit Committee with effect from 15 August 2011.
Audit Committee Meeting No. 2/2012 held on 19 December 2011 considered the appointment of Auditors and resolved to propose for shareholders’ approval, the appointment of any one of the following auditors of PriceWaterhouseCooper ABAS Limited as the auditor of the Company for the year 2012.
1. Mr. Kajornkiet Aroonpirodkul, License No. 3445, 2. Mr. Chanchai Chaiprasit, License No. 3760 3. Mrs. Nattaportn Phan-Udom, License No. 3430,
PriceWaterhouseCooper ABAS Limited is a reputable independent audit firm, and has shown satisfactory performance according to past records. The meeting also approved to propose for shareholders’ approval, the audit fees of an amount not exceeding Baht 3.24 million for the year 2012 (2011 Fees: Baht 3.16 million).
For and on behalf of the Audit Committee of Thoresen Thai Agencies Public Company Limited
Prof.Dr. Warapatr Todhanakasem Chairman of the Audit Committee

18 Thoresen Thai Agencies Public Company Limited
Mr. Aswin Kongsiri (age 65) Mr. Aswin Kongsiri has been Chairman since November 2010. In 2010, Mr. Kongsiri was appointed as a Governor of the Stock Exchange of
Thailand. In November 2011, Mr. Kongsiri was appointed as a member of the in Monetary Policy Committee of the Bank of Thailand and
Director of Krungthai-Axa Life Insurance Co., Ltd. He serves as Chairman of Thai Orix Leasing Co., Ltd., Ch. Karnchang Plc., and Ton Poh
Thailand Fund, Vice Chairman of Electricity Generating Plc., Director of Bangkok Aviation Fuel Services Plc., OHTL Plc. (Mandarin Oriental
Hotel), Thai Reinsurance Plc., and Padaeng Industry Plc. Mr. Kongsiri holds a B.A. (Honours) in Philosophy, Politics, and Economics from
Oxford University, England. In 2001, he completed the Chairman 2000 Program (Class 5/2001) and the Directors Certification Program (DCP
11/2001) by the Thai Institute of Directors Association.
M.L. Chandchutha Chandratat (age 45) M.L. Chandchutha Chandratat joined in 2005 as the Chief Executive Officer. His professional experience began with Bank of America, where
he served in San Francisco (U.S.A.), Hong Kong, and Bangkok from 1989 to 1994. He joined Bangkok Bank Plc. from 1994 to 2000 and worked
for J.P. Morgan, Hong Kong from 2000 to 2002 and Morgan Stanley Dean Witter Asia (Singapore) Pte. Ltd. from 2002 to 2005. He serves as
Executive Chairman of Mermaid Maritime Plc. and Chairman of Unique Mining Services Plc. He received his M.B.A. from the University of
California at Berkeley in 1989 and his B.S. (magna cum laude) in Economics from the University of Minnesota in 1987. In 2006, he completed
the Directors Certification Program (DCP 70/2006) by the Thai Institute of Directors Association.
Board of Directors06
Mr. Stephen Fordham (age 60) Mr. Stephen Fordham is a trained lawyer, having worked for Norton Rose Botterell & Roche, London from 1974 to 1976, Baker & McKenzie in
Hong Kong from 1976 to 1977 and in Bangkok in 1978, Clifford Turner from 1979 to 1983, and Sinclair Roche & Temperley, where he also
served as Partner from 1986 to 1998. From 1998 to 2000, he was the Managing Director of Argonaut Shipping Pte. Ltd. and from 1998 to 2003,
he was a Consultant at Watson Farley Williams. He serves as Chairman of Masterbulk Pte. Ltd., is a Partner at Wikborg Rein, and sits as an
Independent Director of Total Access Communication Plc. Mr. Fordham holds a M.A. in Jurisprudence from Oxford University.
Dr. Pichit Nithivasin (age 65) Dr. Pichit Nithivasin serves as Managing Director of B.I.G Marketing Co., Ltd. and Bangkok Cogeneration Co., Ltd. He holds directorships at
Huakee Paper Co., Ltd., HMC Polymers Co., Ltd., Polymers Marketing Co., Ltd., Rayong Olefins Co., Ltd., Thai MMA Co., Ltd., Basell Advance
Polyolefins (Thailand) Co., Ltd., and Map Ta Phut Tank Terminal Co., Ltd. He also serves as President of Bangkok Industrial Gas Co., Ltd.,
Bangkok Synthetics Co., Ltd., and BST Elastomers Co., Ltd. and Chairman of Foamtec International Co., Ltd. Dr. Nithivasin holds a PhD in
Operations Research, a M.S. in Electrical Engineering and Computers, a M.S. of Industrial Engineering, and a B. S. in Industrial Engineering,
all from the University of California at Berkeley, USA. In 2003, he completed the Finance for Non-Finance Director Program (FN 4/2003) by
the Thai Institute of Directors Association.
Mr. Sak Euarchukiati (age 62) Mr. Sak Euarchukiati worked for Continental Illinois Thailand Ltd. from 1973 to 1974 before joining Bank of Asia Plc. from 1975 to 1998, where
he rose to be an Executive Vice President. He was the President of the Institute of Internal Audit of Thailand from 2003 to 2004 and the
Compliance and Internal Audit Leader of GE Money Finance Plc. (Thailand) from 2004 to 2005, where he also served as a Director from 2005
to 2006. He serves as Director of Deves Insurance Plc. and Thai Plastic & Chemicals Plc. Mr. Euarchukiati holds a B.S. Management Science
from Colorado State University, USA.
Mr. Aswin Kongsiri (age 65) Chairman, Independent Director Percentage of Shareholding: 0.00
M.L. Chandchutha Chandratat (age 45) President & Chief Executive Officer Percentage of Shareholding: 0.108
Mr. Stephen Fordham (age 60) Non-Executive Director, Member of Nomination and Remuneration Committee Percentage of Shareholding: 0.001
Dr. Pichit Nithivasin (age 65) Independent Director, Chairman of Nomination and Remuneration Committee Percentage of Shareholding: 0.00
Mr. Sak Euarchukiati (age 62) Independent Director, Member of Audit Committee and Nomination and Remuneration Committee Percentage of Shareholding: 0.00

19Annual Report 2011
Dr. Siri Ganjarerndee (age 63) Independent Director, Member of Audit Committee and Nomination and Remuneration Committee Percentage of Shareholding: 0.00
Mr. Peter Stokes (age 61) Independent Director Percentage of Shareholding: 0.00
Mr. Oral Wilson Dawe (age 49) Independent Director Percentage of Shareholding: 0.00
Prof. Dr. Warapatr Todhanakasem (age 62) Independent Director, Chairman of Audit Committee Percentage of Shareholding: 0.00
Prof. Athueck Asvanund (age 60) Independent Director Percentage of Shareholding: 0.00
06
Dr. Siri Ganjarerndee (age 63) Dr. Siri Ganjarerndee served as Assistant Governor, Bank of Thailand from 1992 to 1997 and Senior Assistant Governor in 1998. He serves as
Director of Indorama Ventures Plc., Prasit Patana Plc., The Post Publishing Plc., where he acts as Chairman of the Audit Committee, and Thai
Vegetable Oil Plc., where he acts as Vice Chairman and member of the Audit Committee. He serves as a member of the Bank of Thailand
Board and the Monetary Policy Committee. Dr. Ganjarerndee holds a PhD in Monetary Economics and Econometrics from Monash University
and a M.A. in Economics in Economic Statistics and Monetary Economics and a B.A. in Economics (Honours) from the University of Sydney. Dr.
Ganjarerndee completed the Directors Accreditation Program (DAP 4/2003) in 2003 and the Directors Certification Program (DCP 60/2005) in
2005 by the Thai Institute of Directors Association.
Mr. Peter Stokes (age 61) Mr. Peter Stokes is a Senior Adviser and Head of Shipping at Lazard and also serves as a non-executive director of Avance Gas Holding Ltd.
and U-Sea Bulk Shipping A/S. His professional experiences include serving as the co-founder of and investment adviser to Castalia Partners
Ltd. from 1992 to 1998, the founder and Managing Director of Maritime Consultants Ltd. from 1985 to 1998, and a co-founder and Director of
Bulk Transport Ltd. from 1983 to 1985. He also served as the Head of Shipping and Insurance Research at Greig Middleton & Co. from 1979 to
1983 and a Business Editor at Lloyd’s List from 1974 to 1979.
Mr. Oral Wilson Dawe (age 49) Mr. Oral Wilson Dawe is founder and CEO of Dawe Holdings, with public markets trading and private equity interests in natural resources, real
estate, biotech, and technology. He was the Managing Director and Chief Executive Officer of Asia Pacific Commodities for J.P. Morgan during
2007 - 2010. Based in Singapore, he was responsible for all aspects of J.P. Morgan’s commodity business in the region and was also a
member of JPMorgan’s AsiaPacific Investment Banking Management Committee. He was President of Goldman Sachs, Singapore from
2002- 2007 as well as co-head of Goldman’s AsiaPacific commodity business and immediately prior was Co-head of North American
Commodity Sales based in New York from 1998-2001. From 1984-1996, Oral held finance and trading related positions in North American and
Asian natural resource and banking related firms. He has also lectured on corporate finance and strategic planning.
Prof. Dr. Warapatr Todhanakasem (age 62) Prof. Warapatr Todhanakasem, holds a PhD in Business Economics from the University of Illinois, USA, a M.S. in Economics from the same
university, and M.B.A. in Finance & Marketing from the Kellogg School of Management, Northwestern University. He was the Managing
Director of TRIS Rating Co., Ltd. prior to becoming the Chairman of Prinsiri Plc. and an Executive Advisor of Amata Corporation Plc., In 2000,
he completed the Directors Certification Program (DCP 0/2000) by the Thai Institute of Directors Association.
Prof. Athueck Asvanund (age 60) Prof. Athueck Asvanund, a former partner of Baker & McKenzie, is currently Vice Chairman and Group General Counsel of True
Corporation PCL as well as Group General Counsel of CP Group. Apart from holding a Bachelor of Law (Hons.) from Thammasat University,
Prof. Athueck was appointed under Royal Command as a Professor of Laws of Chulalongkorn University’s Law School. He has written several
legal books and articles. In 2005, he completed the Directors Accreditation Program (DAP CP/2005) by the Thai Institute of Directors
Association.

20 Thoresen Thai Agencies Public Company Limited
07 Executive Officers
M.L. Chandchutha Chandratat (age 45) is the President & Chief Executive Officer of TTA. His biography appears in the section “Board of Directors”.
Mr. David Lawrence Ames (age 46) is the Executive Vice President, Transport. Prior to joining TTA, he was the Chief Executive of Zuellig Pharma, Korea
from 2005 to 2007, General Manager of Metro Drug Inc., Philippines from 2003 to 2005, and Managing Director of
American President Lines (“APL”), Indonesia from 2001 to 2003. Prior to this, Mr. Ames held various positions within
APL in North America and Asia. Mr. Ames holds a B.A. in Political Science from Northwestern University, USA.
He also completed executive education programs in Supply Chain Management Program from Stanford University in
1999 and The Advanced Management from INSEAD, Fontainebleau, France in 2005.
Mr. Vichai Chuensuksawadi (age 54) is the Executive Vice President, Infrastructure. He became a director of Unique Mining Services Plc. in January 2011.
Prior to joining TTA, Mr. Chuensuksawadi worked for United Parcel Service (“UPS”) for 18 years. At UPS, he started in
the position of Managing Director for Thailand and was subsequently promoted to be Managing Director for Malaysia,
Thailand, and Indochina. In 2001, he was appointed as VP, Business Development for UPS Asia Pacific Region. His
latest position at UPS was VP, Region Strategy & Retail, where he was responsible for developing UPS’ retail channels
and providing strategic development recommendations for UPS entities in Asia. Mr. Chuensuksawadi received a B.A. in
Psychology from University of Queensland, Australia in 1979. He also completed the International Executive Program
on Management, Strategy and Operations from INSEAD in 2005.
Mr. John Crane (age 51) is the Executive Vice President, Corporate Strategy. He became a non-executive director of Mermaid Maritime Plc. in
August 2011. He is also directors of other subsidiaries and associates, such as Soleado Holdings Pte. Ltd., Petrolift
Inc., Merton Group (Cyprus) Limited, and Qing Mei Pte. Ltd. His professional experiences include serving as a Director
at Aspire Pacific Ltd., Hong Kong, an advisory firm specialising in strategic consultancy, business development, and
private equity since 2004, and as an executive at JP Morgan in New York, Hong Kong, and Thailand from 1992 to 2004.
Prior to his years at JP Morgan, Mr. Crane held business development positions for United Technologies, Singapore and
Unico (Japan), based in Shanghai. A graduate of the Lauder Institute at University of Pennsylvania, he earned a M.B.A.,
Finance from the Wharton School, and M.A., International Studies, University of Pennsylvania in 1990, and a B.A. in
International Relations from Pomona College in 1983.
M.L. Chandchutha Chandratat (age 45) President & Chief Executive Officer
Mr. David Lawrence Ames (age 46) Executive Vice President, Transport
Mr. Vichai Chuensuksawadi (age 54) Executive Vice President, Infrastructure
Mr. John Crane (age 51) Executive Vice President, Corporate Strategy

21Annual Report 2011
Mr. Prithayuth Nivasabutr (age 53) Executive Vice President Corporate Bussiness Services
Ms. Urai Pluemsomran (age 57) Executive Vice President, Corporate Risk, Internal Audit, and Compliance
Mrs. Thitima Rungkwansiriroj (age 50) Executive Vice President, Corporate Finance and Accounting
Mrs. Penroong Suwannakudt (age 48) Executive Vice President, Corporate Human Resources
07
Mr. Prithayuth Nivasabutr (age 53) is the Executive Vice President, Corporate Business Services. Prior to joining TTA, he was the Managing Director of
Pacific Internet (Thailand) Limited from 2000 to 2007. He was also the Country Director in Thailand for MasterCard
International. He received a M.B.A. from the University of Maryland, U.S.A. in 1987, and a B.S. from George Mason
University, U.S.A. in 1981. In 2004, he completed the Directors Certification Program (DCP 40/2004) by the Thai Institute
of Directors Association.
Ms. Urai Pluemsomran (age 57) is the Executive Vice President, Corporate Risk, Internal Audit, and Compliance. Ms. Pluemsomran worked for the Dow
Chemical Company for 19 years. She started as Country Controller and Corporate Secretary for all Siam Cement-Dow
joint venture companies in Thailand. In 2002, she was promoted to Senior Corporate Audit Manager, leading the audit
teams in performing internal audits on a global basis from Dow’s head office in Michigan. Her last position was
Country Manager - Indonesia. Ms. Pluemsomran received a M.B.A. from Chulalongkorn University in 1977 and a B.S. in
Management and Accounting from Woodbury University, USA in 1975.
Mrs. Thitima Rungkwansiriroj (age 50) is the Executive Vice President, Corporate Finance and Accounting. She became a director of Unique Mining Services
Plc. in October 2009. Prior to TTA, she was the Head of Equity Investment Division at Siam Commercial Bank Public
Company Limited (“SCB”). She served as Group Chief Financial Officer at GMM Grammy Public Company Limited from
2003 to 2006 and also held similar positions with KGI Securities (Thailand) Public Company Limited, The East Asiatic
(Thailand) Public Company Limited and First Asia Securities Public Company Limited. She holds a M.S. in Accounting
from Thammasat University. She completed the Directors Accreditation Program (DAP 66/2007) in 2007 and the
Directors Certification Program (DCP 131/2010) in 2010 by the Thai Institute of Directors Association.
Mrs. Penroong Suwannakudt (age 48) is the Executive Vice President, Corporate Human Resources. She became a director of Unique Mining Services Plc.
in October 2009. Prior to joining TTA, she was Head of Human Resources, Consumer Banking in Standard Chartered
Bank (Thai) Pcl. from 2003 to 2008, and Country Personnel Manager at Bank of America, Thailand from 1993 to 2003.
Mrs. Suwannakudt received a Diploma in Human Resources Management from Sasin Graduate Institute of Business
Administration of Chulalongkorn University in 1999 and a B.A. in Social Work from Thammasat University in 1985. In
2010, she completed the Directors Certification Program (DCP 132/2010) and the Role of the Compensation Committee
Program (RCC 11/2010) by the Thai Institute of Directors Association.

22 Thoresen Thai Agencies Public Company Limited

23Annual Report 2011
2011 Corporate Structure
Corporate Structure
Thoresen Thai Agencies Public Company Limited (“TTA” or the “Company”) is a strategic investment holding company with three primary groups of business - Transport, Energy, and Infrastructure.
Transport Group
TTA and its subsidiaries (the “Group”) have provided shipping-related services since 1904 and dry bulk shipping services since 1985. In 2010, TTA added a small oil and gas tanker services business in the Philippines.
Energy Group
The Group has also provided subsea services since 1995 and offshore drilling services since 2006. In 2009, TTA made an indirect investment in a greenfield coal mining project in the Philippines and subsequently increased its stake in 2011 by also investing directly into the coal mining company itself. Also in 2011, TTA invested in another coal mining
08 Business Review and Outlook
project in Indonesia. These coal mining investments clearly indicate the Group’s strategic intent to increase its exposure to energy businesses with high future growth potential.
Infrastructure Group
TTA’s strategic objectives include the creation of an integrated logistics business in Vietnam and an integrated coal supply chain. To achieve these objectives, TTA invested in a fertiliser production and distribution company located next door to a deep-sea port in Phu My Industrial Estate in South Vietnam, in which TTA bought a stake in 2010. With its logistics licenses, Thoresen-Vinama Agencies Ltd. coordinates the activities of the port and warehouses to deliver a seamless logistics service to clients. With additional warehouse capacity in 2012, the port activities are expected to increase. TTA also invested in a coal logistics company in Thailand, which means that the Group can mine, ship, and sell coal to end clients in an integrated manner.
As TTA diversified and built an investment portfolio, more companies emerged within the Group. Soleado Holdings Pte. Ltd. and Athene Holdings Ltd. have both been set up to organise and hold TTA’s overseas and local investments, respectively, in an orderly manner.
The following chart depicts the Group’s corporate structure under the new business groups.

24 Thoresen Thai Agencies Public Company Limited
08
Thoresen Thai Agencies Plc.
Soleado Holdings Pte. Ltd. Athene Holdings Ltd.
Dry bulk shipping Shipping agency
services in Thailand, Indonesia, Vietnam, and UAE
Ship brokerage Inter-island oil and gas
tankering in the Philippines
Subsea engineering services
Offshore drilling services
Coal mining in the Philippines and
Indonesia
Classified coal distribution in Thailand
Fertiliser production and distribution in Vietnam
Deep-sea port logistics and warehousing
services in Vietnam Third-party logistics,
stevedoring services, and ship supplies
Corporate Structure Under New Business Groups
Competitive strengths of the Group
The Group’s strategic objectives depend on prudent and efficient management of its business groups and their operations in such a manner as to enable it to continuously expand its businesses, improve its service offerings, and service its debt repayments.
The current economic and financial market conditions may affect the timing of any strategic opportunities, but TTA intends to focus on monetising certain non-core assets and investments and allocating cash flows to accelerate our medium-term strategic goals.
The Group has the following competitive strengths:
Increasingly Diversified Business Portfolio: TTA is trying to reduce the cyclicality and uncertainty of its cash flows by finding new investments that counterbalance its existing ones. However, the newer investments have not reached sufficient scale to offset the significant decline in the dry bulk shipping business.
Growing Presence in Emerging Markets and Commodities: TTA is one of the first to focus on professional logistics services in Vietnam and has a first mover advantage by being one of the first players to commence commercial coal production on Cebu in the Philippines. Analysis is being completed to develop the first coal mine in Central Kalimantan in Indonesia. UMS is one of the first to focus on just- in-time coal logistics services in Thailand and has invested in the infrastructure to execute this business. TTA believes that focusing on emerging markets and coal will enable it to maintain its competitive position.
Versatile and High Quality Owned Fleet and Services: The Group owns most of its assets, enabling it to provide excellent customised services to its clients, to maintain better control of its operating costs, and to provide competitive market pricing, resulting in strong brand recognition and long-term client relationships. The Group spends a significant amount of funds to ensure the Group’s vessels are maintained in a condition that exceeds the minimum requirements imposed by the classification societies.
Transport Energy Infrastructure

25Annual Report 2011
08
Client-centric Infrastructure and Service Network: The dry bulk shipping business has developed strong relationships with many international ports, where the Group enjoys priority privileges to conduct its business. The dry bulk shipping business is able to leverage its network of agents and offices and its port relationships to serve its clients, many of whom are long-term and provide repeat business. Mermaid operates a world-class facility in Chonburi, Thailand and has established shore-based support functions in Kuala Lumpur in Malaysia, Jakarta in Indonesia, Singapore, and Qatar in the Middle East to support the expansion of its operations, and has also appointed local agent representatives in its primary client markets, enabling it to develop strong relationships with major oil and gas companies operating in the region.
Expandable Business Model: Since 1904, the Group has demonstrated the adaptability and expandability of its business model by growing its services and operations base. The Group has built a solid operational platform that can be leveraged for further expansion into areas that complement or are natural extensions to our existing businesses.
Strong Financial Position: Even though 2011 was a tough year, the Group still managed total operating revenues of Baht 17,565.07 million and normalised basis consolidated earnings before Interest. taxes, depreciation, and amortisation (“EBITDA”) of Baht 2,543.65 million. The total debt to equity ratio remained a modest 0.47:1. Thus, the Group believes that its strong financial position can take advantage of the declining various business conditions by making acquisitions at favourable prices.

26 Thoresen Thai Agencies Public Company Limited
08
Transport Group The Transport Group provides shipping and shipping-related services through its affiliated and subsidiary companies to trading companies, oil majors, logistics companies, and major vessel owners and operators of all types.
The Transport Group’s two key businesses are dry bulk shipping and Petrolift Inc ("Petrolift"). TTA operates its dry bulk shipping business under the Thoresen brand name. As of 30 September 2011, the dry bulk shipping fleet comprised fifteen (15) owned vessels and one chartered-in vessel through the first quarter of 2012.
Thoresen provides tramp services on a global basis. The vessels operate at the requirements of Thoresen’s clients under medium-term time charters and contracts of affreightment (“COA”) and short-term time charters and voyage charters.
TTA owns a 40% interest in Petrolift, an inter-island petroleum and gas tanker company operating in the Philippines. Petrolift owns and operates nine (9) petroleum tankers/barges, including one liquefied petroleum gas tanker that are primarily used for domestic transport against long-term contracts with major oil and gas companies.
Other businesses in the Transport Group are shipping-related services businesses, including ship agency services in Thailand, Vietnam, Indonesia, and the United Arab Emirates and ship brokerage services for dry cargoes in Thailand, Singapore, and India.
Dry Bulk Shipping Business
Industry Review
The dry bulk shipping industry continues to be plagued with an oversupply situation. Vessel demand growth in 2011 was around 3%, while vessel supply growth was around 10%. Thus, freight rates continued to remain low.
Demand
Prior to 2008, major dry bulk cargos experienced very high trade growth, generating significant additional demand for dry bulk shipping. Subsequent to the financial crisis in 2008, dry bulk trade growth has slowed down to historical norms. The following table and chart illustrate the total seaborne trade in the major dry bulk segments, including iron ore, coal, grains (including wheat, coarse grains, and soybeans), phosphates and bauxite/alumina, for the period from 2005 to 2011.

27Annual Report 2011
08
Table : Dry Bulk Seaborne Trade: 2005 to 2011 (Million tonnes)
2005 2006 2007 2008 2009 2010E 2011E
Coal 710 754 806 834 870 940 968
Iron Ore 652 734 787 845 903 930 958
Grain 309 324 342 351 349 375 386
Bauxite/Alumina 73 78 83 81 78 78 80
Phosphate 30 30 31 31 29 29 30
Total Dry Bulk Seaborne Trade 1,774 1,920 2,049 2,142 2,229 2,352 2,422
YOY Change (RHS) 7.5% 8.3% 6.7% 4.5% 4.1% 5.5% 3.0% Source: Fearnleys
The total seaborne trade in the major dry bulk commodities is estimated to have increased 37 percent in the period between 2005 and 2011. Of the major bulks, iron ore grew the fastest, with an increase of 47 percent, driven mainly by Chinese steel production. The development in tonne-mile dry bulk carrier demand reflects a similar trend, indicated in the following table and chart.
Table : Dry Bulk Carrier Demand: 2005 to 2011 (Million tonne-miles)
2005 2006 2007 2008 2009 2010E 2011E
Coal 3,113 3,540 3,778 3,905 3,518 3,750 3,863
Iron Ore 3,918 4,192 4,544 4,849 5,510 5,650 5,820
Grain 1,688 1,820 1,928 1,930 1,905 2,150 2,215
Bauxite/Alumina 248 267 268 267 265 265 273
Phosphate 154 155 159 159 150 150 155
Total Dry Bulk Carrier Demand 9,121 9,974 10,677 11,110 11,348 11,965 12,324
YOY Change (RHS) 8.1% 9.3% 7.0% 4.1% 2.1% 5.4% 3.0%
Source: Fearnleys
During the last few years, China, and to a lesser extent India, have been the main drivers behind the increase in seaborne dry bulk trade. Chinese production and consumption of steel have created an enormous demand for seaborne trade of iron ore. Scarcity of domestic supply has generated increased import from Australia and Brazil, creating longer distances.
3,000Million tonnes % YOY Change
2,500
2,000
1,500
1,000
500
0
12%
10%
8%
6%
4%
2%
0%2005 2006 2007 2008 2009 2010E 2011E
Total Dry Bulk Seaborne TradeYOY Change (RHS)
Million tonnes-miles % YOY Change14,000
12,000
10,000
8,000
6,000
4,000
2,000
0
12%
10%
8%
6%
4%
2%
0%2005 2006 2007 2008 2009 2010E 2011E
Total Dry Bulk Carrier DemandYOY Change (RHS)

28 Thoresen Thai Agencies Public Company Limited
Table : World Crude Steel Production (Million tonnes)
E U USA Japan China South Korea Taiwan India Others Total
2004 194 99 113 269 48 20 33 280 1,054
2005 187 94 113 349 48 19 38 282 1,129
2006 199 99 116 422 48 20 43 273 1,219
2007 210 97 120 487 51 21 50 281 1,317
2008 198 92 119 501 54 20 55 292 1,330
2009 139 58 88 568 49 16 57 246 1,220
2010 173 81 110 627 58 19 66 262 1,395
9M11 136 65 81 528 51 17 54 205 1,136 Source: Fearnleys
From approximately 269 million tonnes of crude steel output in 2004, Chinese production has seen double digit growth to approximately 487 million tonnes in 2007. In 2009, while global steel production decreased 8.3% to 1.220 billion tonnes due to the global economic slowdown, production in China rebounded strongly and increased to 568 million tonnes.
Over the last five years, steel production in China has had a compounded annual growth rate of 12.4 percent, compared with global production at 4.3 percent per annum. As a result of this growth in steel production, Chinese imports of iron ore have also increased substantially. Thus, Chinese steel production is by far the biggest driver in the dry bulk carrier demand and is expected to reach more than 700 million tonnes by the end of 2011.
Chinese iron ore imports increased almost nine times from 2000 to 2010, and the main suppliers are Australia, Brazil, India, and South Africa. Imports from Brazil have increased over the last few years and increased tonne miles and demand for the larger ships in the bulk fleet. Chinese iron ore imports in the first nine months of 2011 reached 508.5 million tonnes. With a continuation of current import levels, China will reach close to 680 million tonnes, or close to 10 percent up from last year.
Chart : Chinese Iron Ore Imports (Million tonnes)
700
600
500
400
300
200
100
0
2000
2001
2002
2003
2004
2005
2006
2007
2008
2009
2010
9M20
11
Source: FearnleysSupply
At the beginning of October 2011, the world fleet of dry bulk carriers consisted of 8,752 vessels, totalling 593.2 million deadweight tonnes (“dwt”) in capacity. The following table presents the world dry bulk carrier fleet by size category as of the beginning of October 2011. The average age of dry bulk carriers in service in October 2011 was 10.4 years.
08
Million tonnes % China share1,600
1,400
1,200
1,000
800
600
400
200
0
80%
70%
60%
50%
30%
40%
20%
10%
0%2004 2005 2006 2007 2008 2010 9M112009
Total% China share (RHS)
China

29Annual Report 2011
Table : Dry Bulk Carrier Fleet: October 2011
Size Category Deadweight Tonnes (dwt)
Number of Vessels Total Capacity (million dwt)
% of Total Fleet (dwt)
Capesize 100,000+ 1,304 236.6 39.9
Panamax 60,000 – 100,000 1,987 151 25.5
Supramax 50,000 – 60,000 1,412 77.7 13.1
Handymax 40,000 – 50,000 965 43.4 7.3
Handysize 10,000 – 40,000 3,084 84.5 14.2
Total 8,752 593.2 100
Source: Fearnleys
Although the global dry bulk carrier fleet has developed in size to meet the increases in seaborne trade and vessel demand, supply lagged behind demand, creating the shipping boom from 2005 to 2008. This boom created a wave of new orders, and over the last three years, the industry has seen a worsening of the oversupply situation as more vessels are delivered.
The relationship between the total orderbook and the existing fleet is a guide to future levels of supply. As of the beginning of October 2011, the global dry bulk orderbook, with deliveries during 2011 – 2014, amounted to 214.5 million dwt, or 36.2 per cent of the existing dry bulk fleet. This year will be a record year of deliveries, but next year will continue to bring strong fleet growth.
Table : Dry Bulk Carrier Orderbook: October 2011
Size Category Deadweight Tonnes (dwt)
Number of Vessels Total Capacity (million dwt)
% of Total Fleet (dwt)
Capesize 100,000+ 465 93 39.3
Panamax 60,000 – 100,000 863 69.2 45.8
Supramax 50,000 – 60,000 522 29.6 38.1
Handymax 40,000 – 50,000 78 3.6 8.3
Handysize 10,000 – 40,000 584 19.1 22.6
Total 2,512 214.5 36.2 Source: Fearnleys
Freight Market and Rates
Freight rates also fluctuate by varying degrees with vessel size. For example, the volume and pattern of trade in a small number of commodities (major bulks) affect demand for larger vessels. Because demand for larger dry bulk vessels is affected by the volume and pattern of trade in a relatively small number of commodities, freight rates (and vessel values) of larger ships tend to be more volatile. Conversely, trade in a greater number of commodities (minor bulks) drives demand for smaller dry bulk carriers. Accordingly, charter rates and vessel values for those vessels are subject to less volatility.
0
20,000
01, 2
001
07, 2
001
01, 2
002
07, 2
002
01, 2
003
07, 2
003
01, 2
004
07, 2
004
01, 2
005
07, 2
005
01, 2
006
07, 2
006
01, 2
007
07, 2
007
01, 2
008
07, 2
008
01, 2
009
07, 2
009
01, 2
010
07, 2
010
01, 2
011
07, 2
011
40,000
60,000
80,000
100,000
120,000
140,000
160,000
180,000
Handymax PanamaxCapesize 150’ Capesize 170’
Chart : One Year Time Charter Rates (USD per day)
Source: Fearnleys
08

30 Thoresen Thai Agencies Public Company Limited
Capesize Panamax Handymax
01, 2
000
06, 2
000
11, 2
000
04, 2
001
09, 2
001
02, 2
002
07, 2
002
12, 2
002
05, 2
003
10, 2
003
03, 2
004
08,2
004
01,2
005
06, 2
005
11, 2
005
04, 2
006
09, 2
006
02, 2
007
07, 2
007
12, 2
007
05, 2
008
10, 2
008
03, 2
009
08, 2
009
01, 2
010
06, 2
010
11, 2
010
04, 2
011
09, 2
0110
20
40
60
80
100
120
140
160
180
In the time charter market, rates vary depending on the length of the charter period and on vessel specific factors such as age, speed, and fuel consumption. In the voyage charter market, rates are influenced by cargo size, commodity, port dues, and canal transit fees, as well as delivery and redelivery regions.
The collapse in freight rates since the middle of 2008 was an effect of the global economic slowdown that resulted in slower demand growth coinciding with an increasing supply of vessels. In 2011, freight rates have been well below 2010 levels and especially for the larger sizes, even though they picked up after the summer.
Vessel Prices
Newbuilding Prices
In approximate terms, newbuilding prices for bulk carriers more than doubled between the beginning of 2002 and the end of 2008. Since the end of 2008, newbuilding prices have generally fallen as new orders slowed down considerably.
Chart : Dry Bulk Carrier Newbuilding Prices: to 2000 to 2011
Chart : Dry Bulk Carrier Second-hand Prices: 2000 to 2011
Source: Fearnleys
Source: Fearnleys
Second-hand Values
In the second-hand market, prices remained high up until August 2008, before they dropped by about two-thirds to the end of the year. The BDI index dropped from over 11,000 points in June 2008 to mid-600 points in December 2011. In 2011, second-hand values continued to decrease following weaker freight rates.
(Period average of 5-year-old vessels – USD million)
01
,20
00
07
, 2
00
00
1,
20
01
07
, 2
00
10
1,
20
02
07
, 2
00
20
1,
20
03
07
, 2
00
30
1,
20
04
07
, 2
00
40
1,
20
05
07
, 2
00
50
1,2
00
60
7,
20
06
01
, 2
00
70
7,
20
07
01
, 2
00
80
7,
20
08
01
, 2
00
90
7,
20
09
01
, 2
01
00
7,
20
10
01
, 2
01
1
07
, 2
01
1
120
100
80
60
40
20
0
Capesize Panamax Handymax
(USD million)
08

31Annual Report 2011
(Period average of 5-year-old vessels – USD million)
Chart : Dry Bulk Fleet Development Business Review
Thoresen remains one of the largest owners of Handymax and Supramax dry bulk vessels based in Thailand.
As part of its fleet modernisation exercise, Thoresen sold fifteen (15) older vessels and acquired three (3) modern vessels in 2011. Two (2) remaining new-build vessels, each with an average capacity of 53,000 dwt, are scheduled for delivery in 2012. As of 30 September 2011, Thoresen’s fleet had a total cargo carrying capacity of 702,853 dwt, an average size of 43,798 dwt, and a dwt-weighted average age of 10.8 years. The size of the fleet has fallen from forty-eight (48) vessels in 2005 to fifteen (15) vessels as of 30 September 2011, and from a cargo-carrying capacity of 1,230,514 dwt to 702,853 dwt over the same period.
No. of Vessels dwt
501,230,514
1,266,5181,243,273
1,400,000
1,200,000
1,000,000
800,000
600,000
400,000
200,000
0
45
40
35
30
25
20
15
10
5
02006 2007 2008 2009 2010 2011
dwtNumber of Vessels
1,050,839
905,809
702,853
45 4544
36
27
15
Source: TTA
Fleet Management
Thoresen Shipping Singapore Pte. Ltd. (“TSS”) and Thoresen & Company (Bangkok) Limited (“TCB”) have commercial and technical management responsibility of the fleet. The following tables present summary information on the composition of the dry bulk fleet as of 30 September 2011.
Table : Fleet Structure
Number of Vessels
Owned Vessels Period Chartered-in Vessels
New-build Vessels on Order Total
Handymax 9 1 - 10
Supramax 6 - 2 8
TOTAL 15 1 2 18
Dwt-Weighted Average Age of Vessels
Owned Vessels Period Chartered-in Vessels
New-build Vessels on Order Total
Handymax 15.29 12.75 - 15.02
Supramax 5.53 - - 5.53
TOTAL 10.81 12.75 - 10.93
Source: TTA
08

32 Thoresen Thai Agencies Public Company Limited
Table : Dry Bulk Fleet List
BULK CARRIERS
Vessel Name Original Delivery Date
DWT Age Design
1. Thor Dynamic 30/4/1991 43,497 20.43 Standard Bulk >40,000 dwt
2. Thor Jupiter 18/8/1986 36,992 25.13 Box Shape Bulk (Box)
3. Thor Wave 30/7/1998 39,042 13.18 Open Hatch / Box Shape <40,000 dwt
4. Thor Wind 18/11/1998 39,087 12.87 Open Hatch / Box Shape Bulk (Box)
5. Thor Energy 16/11/1994 42,529 16.88 Open Hatch / Box Shape Bulk (Box)
6. Thor Endeavour 11/4/1995 42,529 16.48 Open Hatch / Box Shape Bulk (Box)
7. Thor Enterprise 28/7/1995 42,529 16.19 Open Hatch / Box Shape Bulk (Box)
8. Thor Harmony 21/3/2002 47,111 9.53 Open Hatch / Box Shape Bulk (Box)
9. Thor Horizon 1/10/2002 47,111 9.00 Open Hatch / Box Shape Bulk (Box)
10. Thor Achiever 22/7/2010 57,015 1.73 Standard Bulk> 40,000 dwt
11. Thor Integrity 2/4/2001 52,375 10.50 Standard Bulk > 40,000 dwt
12. Thor Independence 20/12/2010 52,407 9.94 Standard Tess - 52
13. Thor Infinity 21/12/2010 52,383 9.66 Standard Tess - 52
14. Thor Friendship 13/1/2010 54,123 1.71 Semi-Open / Box Shape Oshima - 53
15. Thor Fortune 15/6/2011 54,123 0.29 Semi-Open / Box Shape Oshima - 53
Total Thoresen Fleet : 702,853 Dwt
Source : TTA
Going forward, ownership of all vessels will be transferred to TSS and registered under the Singapore flag to enjoy the stronger tax incentives provided by the Singapore government.
Thoresen’s vessel employment strategy is to optimally service a highly diversified mix of clients and cargoes and aims to achieve a balance of forward-secured revenue through period time charters and COA’s, and voyage charters.
Fleet Services
Tramp Services
Tramp services derive its revenues from:
Voyage, or spot charters, which are charters based on the current market rate; Time charters, whereby vessels are chartered to clients for a fixed period of time at rates that are
generally fixed, but may contain a variable component, such as an inflation adjustment or a current market rate component; and
COA’s, which are forward delivery contracts agreeing to the quantity of cargo to be carried for a client over a specified trade route within a fixed period of time.
08

33Annual Report 2011
The table below illustrates the primary distinctions among the main types of charters and contracts within the shipping industry.
Table : Types of Charters
Voyage Charter Time Charter Bareboat Charter COA
Typical contract length Single voyage One year or more One year or more One year or more
Hire rate basis Varies Daily Daily Typically daily
Voyage expenses Paid by Thoresen Paid by the client Paid by the client Paid by Thoresen
Vessel operating expenses Paid by Thoresen Paid by Thoresen Paid by the client Paid by Thoresen
Off-hire Client does not pay Varies Typically paid by client Typically not paid by client
During 2011, approximately 19.6% of Thoresen’s available capacity was employed on period time charters, and approximately 7.8% of its available capacity for 2012 has been booked on period time charters. The alternative to chartering vessels is to operate them against forward cargo bookings and cargo contracts. In the spot market, it is possible to take advantage of sudden upturns in the market, as well as being exposed to sudden downturns. The number of vessels Thoresen operates in the spot market at any time will vary according to its time charter and liner services.
In connection with the charter of each of its vessels, Thoresen pays commissions to brokers associated with the charter, ranging from 1.25% to 3.75% of the total daily charter hire rate.
Thoresen’s tramp business fluctuates with the supply and demand of dry bulk cargoes for charters on the basis of price, vessel location, size, age, and condition of the vessel, as well as on its reputation as an owner and operator. Thoresen competes with other owners of Handysize and Handymax dry bulk vessels. Ownership of general cargo and dry bulk vessels from 15,000 to 50,000 dwt is highly fragmented and is divided among approximately 1,362 independent owners with 5,364 vessels.
Clients
Thoresen’s strategy is to charter vessels to major trading houses (including commodities traders), publicly traded companies, reputable vessel owners and operators, major producers and government-owned entities, rather than speculative companies.
Thoresen aims to achieve diversified vessel employment for its fleet. For 2011, the ten (10) largest clients accounted for 48.63% of total charter revenues.
Employees
In the past year, Thoresen focused its attention on right-sizing the dry bulk shipping organisation for its current fleet size. Although all efforts were made to reduce resources through attrition, there was a need to retrench approximately 20 positions within Thoresen. This reduction of resources brings Thoresen’s general and administrative expenses in line with other dry bulk owners/operators of this size.
In addition to right-sizing the organisation, Thoresen changed key management positions, including the Managing Director and Commercial Director, and recruited stronger dry-bulk chartering experience in the commercial team. These skill enhancements will provide more focused direction on improving results.
08

34 Thoresen Thai Agencies Public Company Limited
Competition
The dry bulk shipping business is highly competitive, albeit highly fragmented. Thoresen competes with a number of prominent shipping companies in Asia and throughout the world.
Competition in the tramp segment is intense, and may be affected by the availability of vessels in sizes that Thoresen does not currently own but which may also compete in its markets. Due to the large difference in size, Capesize dry bulk carriers rarely compete with Handymax vessels for specific cargoes. Nonetheless, rates for Capesize ships may directly affect charter rates for smaller sized vessels. Given the anticipated 10% increase in tonnage for the coming fiscal year, Thoresen believes that charter rates may encounter further downward pressures.
FY11-FY12: Headwinds and Tailwinds Factors
The most prominent headwind in 2012 remains additional vessels arriving on the market. Although there has been slippage in the delivery of new vessels, supply of ships continues to outpace the increase in demand.
Likewise, demand in China continues as a prominent headwind. As China’s development is a critical driver of dry bulk demand, freight rates will fluctuate in a manner consistent with Chinese production. If Chinese production performs below forecasts in 2012, demand for dry bulk vessels will be lower than expected.
As part of its strategy, Thoresen trimmed its dry bulk fleet to only its newest and most efficient ships. 2012 will see a continued push to reduce operating expenses further.
Thoresen will operate its commercial team out of Singapore in 2012 onwards. As Singapore is a major Asian hub of shipping, this change puts a smaller and more focused commercial effort in the centre of Asian shipping. Contact with key customers, trading houses, banks, vendors, as well as the maritime administrative body in Singapore, will help create a commercial team that is more closely aware of trends and development in the industry.
Inter-island Petroleum and Gas Tankering
In April 2010, TTA invested US$ 27.96 million for 38.83% of Petrolift Inc. (“Petrolift”). Subsequently, in January 2011, TTA further invested US$ 0.84 million bringing its shareholding in Petrolift to 40.00%.
Petrolift is the market leader for double-hulled tankers in the Philippine domestic tanker industry, which is an integral part of the Philippine petroleum transportation infrastructure given the Philippines geographical landscape. It has excellent customers and good charters and generates stable and predictable cash flows. The investment in Petrolift is expected to reduce some of the cyclicality effects of the dry bulk shipping and offshore services businesses. Furthermore, comparatively speaking, the entire investment represents approximately the cost of one modern Supramax vessel.
With the latest additional tanker in September 2011, Petrolift currently owns and operates a young (ten-years-old average age) fleet of nine (9) petroleum tankers/barges, including one liquefied petroleum gas tanker. The fleet trades primarily within Philippine coastal waters and has a total capacity of approximately 38 million litres for transporting fuel products such as refined petroleum, ethanol, and LPG.
The ocean going tankers in the fleet have also traded regionally within Southeast Asia to serve the export and import transport requirements of customers. Petrolift is an accredited contractor for tankering services of the oil majors in the Philippines.
08

35Annual Report 2011
About 90% of Petrolift's existing fleet capacity is contracted under medium to long term charters with oil majors.
Ship Agency
TTA owns four ship agency companies, making it the largest ship agency owner based in Thailand.
First, ISS Thoresen Agencies Ltd. (“ITA”) is one of the largest ship agency companies in Thailand, handling more than 1,091 calls in 2011. The Naxco Group, which is a French-based ship agency and logistics group, owns 51% of ITA while TTA owns 49%.
Second, Gulf Agency Company (Thailand) Ltd. (“GAC”) is a medium-sized ship agency company in Thailand, handling more 500 calls in 2011. GAC is an associate company of TTA, of which TTA and Gulf Agency Company Limited (Liechtenstein), own 51.0% and 49.0%, respectively.
Third, Thoresen Indochina S.A. (“TI”) is a joint venture company in which TTA owns 50% and the remaining 50% is owned by private investors. TI handled more than 385 calls in 2011 and specialises in project cargo handling. In 2011, TI was successful in building its warehouse and logistics services in the Phu My district.
Fourth, PT Peruashaan Pelayaran Equinox (“Equinox”) is a small ship agency company, handling more than 261 calls in 2011. TTA owns 49% of Equinox as of September 2011.
These four companies provide traditional ship agency services: port clearance, berthing, loading and discharging, cargo booking, supplying fuel, water, stores, vessel repairs, and crew changes. In addition, GAC specialises in a comprehensive range of supply chain and logistics solutions, which include air and sea freight, warehousing and distribution, door-to-door transportation, project logistics, international moving, and courier services
Ship Brokerage
Fearnleys (Thailand) Ltd. (“FTL”) is an associate company of which TTA and Fearnleys A/S (“Fearnleys”) of Norway own 49.00% and 51.00%, respectively. Fearnleys is one of the largest ship broking companies in the world with activities in dry cargo, sale and purchase, tanker, gas, offshore, and consultancy. FTL also has a 99.99% owned subsidiary, Fearnleys Shipbroking Private Limited, which provides dry cargo broking services in India, and a 100% owned subsidiary, Fearnleys Dry Cargo (Singapore) Pte. Ltd., which provides dry cargo broking services in Singapore.
08
FTL engages in a competitive ship broking business with different owners and cargo charterers in Southeast Asia, as well as worldwide.

36 Thoresen Thai Agencies Public Company Limited
Middle East Operations
Thoresen Shipping FZE (“TSF”), a wholly-owned subsidiary of TTA, was established to act as Thoresen’s regional office in the Middle East. TSF provides cost effective cargo operations on vessels calling in the United Arab Emirates (“UAE”) and other ports in the Middle East.
TSF attends to vessels in the UAE and coordinates the operation of a similar number of vessels in other Arabian Gulf ports. TSF has developed a special expertise in customs and cargo clearance and has executed over 3,000 cargo delivery jobs to clients in the UAE, Oman, and other nearby destinations.
08

37Annual Report 2011
Energy Group The Energy Group’s two key businesses are offshore oil and gas services and coal mining.
Mermaid Maritime Public Company Limited (“Mermaid”), of which TTA owns 57.14%, is the business unit for offshore oil and gas services. Mermaid provides subsea engineering and drilling services to major oil and gas companies or contractors. Theoretically, Mermaid enjoys higher demand for its services with increasing oil prices. Higher oil prices historically had a dampening effect on dry bulk shipping demand, as a major cost element increases.
Thoresen’s position as a worldwide transporter of commodities provides valuable insights into commodity trends and developments. As early as 2006, coal was envisioned as a future growth driver, and TTA sourced and invested in two greenfield coal mine projects, one in the Philippines and one in Indonesia. As more than 20% of Thoresen’s annual cargo volume is coal, the mining business integrates well with the dry bulk shipping business.
A Brief on Mermaid
Mermaid commenced its operations in 1982 and serves the offshore oil and gas industry globally with its core areas being Southeast Asia and the Middle East. On 16 October 2007, Mermaid was successfully listed on the SGX and raised SG# 246 million from its initial public offering of shares. On 14 October 2009, Mermaid raised gross proceeds of a further SG$ 156 million by way of a rights issue to its existing shareholders.
Today, Mermaid is one of few Asian-based providers of offshore services. It operates principally through two business segments: offshore drilling services and subsea diving & ROV services.
Mermaid Drilling Ltd. (“MDL”), a 95.00%-owned subsidiary of Mermaid, operates two tender drilling rigs and provides drilling related-services in Southeast Asia. MDL’s self erecting tender drilling rigs are designed for use in water depths up to one hundred (100) metres (or 180 metres prelaid) and are capable of drilling to depths of 6,100 meters for MTR-1 with 5” drill pipe and 3,350 meters for MTR-2 with 5” drill pipe (5,500m with 4” drill pipe).
Mermaid sees a significant trend for demand for high-specification rigs, with the clients looking for safe and efficient operations that the new rigs can provide including offline activities, higher deck carrying capacities, and combined jacking and preload capabilities.
Most new bid tenders are stipulating age limitations for rigs, and this was the main driving force to invest in premium jack-up rigs, and being one of the first movers in the recent new-build cycle, Mermaid was able to secure favourable pricing and terms.
08

38 Thoresen Thai Agencies Public Company Limited
Subsea engineering services
Market situation
The demand for subsea and remotely operated vehicles (“ROV”) services is driven primarily by the level of activity in the exploration, development, and production of crude oil and natural gas; the investment level depends on oil companies’ cash flow, revenue and financing, the availability of new areas for exploration and development, and oil and gas prices.
The oil price is expected to increase over the next few years, and E&P spending is expected to follow. Historically, the oil price has been the most important determinant of E&P spending. The correlation is high with a time lag of 6–18 months, as it takes time to adjust investment budgets, projects, and contracts according to the oil price. However, this has not been the case in times of great instability, when oil companies usually react much more swiftly, as shutting down or postponing projects takes less time than initiating projects.
Although Mermaid saw better utilisation rates for its subsea assets in 2011, market conditions are likely to remain challenging throughout 2012, as more subsea vessels are being delivered into the global market. Hence we are cautiously optimistic, as we observe day rates slowly trending upwards.
Emerging economies’ hunger for oil
The main driver for a higher oil price is the gap between forecast demand and production. Non-OECD countries are expected to drive growth in demand and their demand is expected to increase faster than non-OPEC production. This will pile pressure on OPEC production and its spare capacity.
Population growth, continued urbanisation, and a growing middle class look set to fuel demand for oil in non-OECD countries. China and India stand out as the countries that will contribute the most to this increasing demand.
OPEC supply would have to increase by 16 million barrels/day by 2015 if the current trend for global demand and non-OPEC supply continues. This would soak up the current ‘core-OPEC’ spare capacity well before 2015. Higher oil prices would be needed to suppress this demand growth.
Non-OECD Demand GrowthNon-OPEC Supply Growth
1,600mboe/d
1,400
1,200
1,000
800
600
400
200
0 1999 2001 2003 2005 2007 2009
5-year average of annual growth
Chart : Non-OECD consumption outpaces non-OPEC production
08
Source: DnB NOR Markets

39Annual Report 2011
Higher oil price allows oil companies to reassess mature fields
There seems to be a trend in moving the focus back to regions such as North America and Asia Pacific. The higher oil price might have made fields previously assessed as unprofitable attractive again.
Notably, although North America is still the most highly ranked region, Asia Pacific is now considered more attractive. This could be due to among other things, large LNG projects in Australia (e.g. Gorgon project). West Africa is a relatively new and expanding region where companies see the possibility for future growth, especially in deepwater. It appears that the unstable political climate may have dampened the attractiveness of West Africa and the Middle East.
NorthAmerica
AsiaPacific
NorthSea
WestAfrica
FSUSouthAmerica
MiddleEast
NorthAfrica
Arctic
30%
24%
18%
12%
6%
0%
2008
% of votes
2009 20112010
Chart : Focus is still on North America and Asia Pacific
Source: DnB NOR Markets
Source: DnB NOR market, ODS Petrodata, Strategic Offshore Research
Demand and supply dynamics for newbuilds
Despite an increase in E&P spending in 2010, fleet growth in seismic and subsea markets outpaced demand growth and oversupply put pressure on margins. For 2011, fleet growth has not matched increased spending, and prices and utilisation are expected to rise in 2012 in all segments, excluding seismic.
For 2012, a further uptick in utilisation and margins is potentially achievable, as the supply/demand balance continues to tighten. However, as the market is still coping with the oversupply from the beginning of the cycle, this should dampen utilisation and rate growth. The outlook for 2013 onwards is bullish, as growth in fleet sizes continues to lag behind spending growth.
The net effect of increased spending, higher utilisation and increasing margins is a positive outlook for the industry as a whole in the short term.
Chart : Growth rates indicate continued loosening in supply/ demand balance for oil services
2009 2010 2011e 2012e 2013e
-7%
6% 6%6%
8%
10%
7%
15%14%
11%
7% 7%6%
14% 14%
5%
3%
6%
8%7%7%
5%
2%
2%1%
13%
-10
5%
0%
5%
10%
15%
20%
Drilling Fleet Seismic fleetSubsea Fleet E&P Spending
FPS
08

40 Thoresen Thai Agencies Public Company Limited
Outlook for E&P Spending
When analysing the fundamental drivers of E&P spending, the need for increased long-term spending is pressing. Following are key observations:
Global demand for oil is expected to rise at a rate greater than global production. This creates a base for a stable and high oil price.
Oil price is expected to exceed the US$ 100 per barrel trigger level, which could lead to an upward revision in companies’ upstream budgets.
Existing oil fields are expected to show a decline rate of 4.5%. This will need to be replaced by production from newly developed fields and/or enhanced oil recovery.
Oil companies are forced into deeper waters and harsher environments in their search for oil and gas.
The average size of new discoveries is steadily declining, which is likely to force oil companies to develop an increasing number of fields.
Business Review
Subsea engineering services are provided through Mermaid Offshore Services Ltd. (“MOS”), a wholly owned subsidiary of Mermaid. MOS services principally comprise diving and remote intervention by unmanned submersibles (“ROV”). MOS’ fleet includes dynamically positioned vessels with a 300-metre diving capability using saturation diving techniques. MOS’ ROV fleet offers a wide range of capabilities with some systems able to operate to a depth of 2,000 metres. MOS provides varied subsea engineering services, including inspection, repair and maintenance, construction and installation support, and commissioning projects.
As of 30 September 2011, MOS’ fleet consists of eight (8) subsea vessels, and twelve (12) ROV systems including deepwater and ultra-deepwater heavy construction class systems. In addition, Seascape owns one survey/utility vessel that can also be used for diving support. Dive support vessels act as an operational base for divers, ROV’s, and specialised equipment. MOS also sub-contracts up to 400 specialist and marine personnel to work on its subsea engineering projects in addition to a permanent workforce.
Fleet Services
All MOS vessels are classified by DNV or ABS, which are two of the leading classification societies. MOS vessels are subject to regular inspection by class surveyors, in addition to regular dry-docking and other planned maintenance. MOS vessels operate under a class-approved planned maintenance system. MOS provides services to its clients in the upstream offshore oil and gas industry across the entire lifetime of the assets.
1. Exploration services
Pre-installation surveys; rig positioning and installation assistance, subsea equipment maintenance.
2. Development services
Installation of subsea pipelines, flow lines, control umbilicals, manifolds, risers, pipe lay and burial, installation and tie-in of riser and manifold assembly; commissioning, testing, and inspection; and cable and umbilical lay and connection.
08

41Annual Report 2011
3. Production services
Inspection, maintenance, and repair of production structure, risers, pipelines, and subsea equipment.
4. Decommissioning services
Decommissioning and remediation services; plugging and abandonment services; platform salvage and removal services; pipeline abandonment services; and site inspections.
The following table describes the vessels used in Mermaid’s subsea engineering services:
Table : Mermaid Subsea Fleet List
Vessel Name Description Year Built Flag State Lenght
(metres) Berths
Mermaid Commander Purpose-built DPII diving support vessel with sturation systems
1987 Thailand 90 96
Mermaid Performer Utility and diving support vessel 1982 Thailand 49 30
Barrakuda(1) Survery & Inspection vessel 1982 Indonesia 39 26
Mermaid Challenger Multi Purpose Offshore Vessel 2008 Thailand 61 38
Mermaid Siam Construction support vessel with saturation systems
2002 Jamaica 90 142
Mermaid Sapphire ROV and survey support vessel 2010 Panama 63 60
Mermaid Asiana Purpose-built DPII diving support vessel with saturation systems
2010 Marshall Islands
99 100
Mermaid Endurer Purpose-built DPII diving support vessel with saturation systems
2010 Panama 95 86
Note : (1) Previously Mermaid Supporter. Sold by MOS to Seascape in October 2010 and renamed the Barrakuda and reflagged to Indonesia.
Clients
MOS’ clients include major and independent oil and gas producers and suppliers, pipeline transmission companies, and offshore engineering and construction firms. The level of services required by any particular client depends on the size of that client’s capital expenditure budget in a particular year. The top clients of MOS are CUEL Limited, Chevron Thailand Exploration and Production Limited, National Petroleum Construction Company, Mashhor DOF Subsea Sdn. Bhd., PTT Exploration and Production Public Co. Ltd., and CJSC Romona. These account for almost 85% of subsea revenues.
In 2011, MOS provided subsea services to over 20 clients, with an increasing number of contracts being awarded in the Middle East on the back of MOS’ acquisition of Subtech in May 2010.
Employees
MOS relies on the high quality of its workforce. As of 30 September 2011, MOS had over 400 employees on the back of the new and larger vessels that MOS acquired in 2010.
08

42 Thoresen Thai Agencies Public Company Limited
Competition
The marine contracting industry is highly competitive. While price is a factor, the ability to acquire specialised vessels, attract and retain skilled personnel, and demonstrate a good safety record is also important. MOS’ competitors include Global GEO ASA, Hallin Marine Subsea International Plc, and Sarku Engineering Services Sdn. Bhd., as well as larger international companies based in Europe and the U.S., such as the merged entity of Subsea 7 Inc. and Acergy S.A. and Helix Energy Solutions Group Inc. Most of these international companies are major Engineering, Procurement, Installation, and Commissioning (“EPIC”) contractors.
FY11-FY12: Headwinds and Tailwinds Factors
2011 was a difficult year for the subsea industry, as the volatility of the oil price in 2009 caused oil and gas companies to review and cut their investment programmes for 2010 and 2011, while at same time a significant number of new vessels were added to the fleet as orders made in 2008 completed construction.
Looking to the future, 2012 could be affected by over-capacity in the subsea fleet. However, in the medium term, we expect conditions for the subsea industry to improve, as the stable oil prices throughout 2011 provide a better investment climate for the oil and gas companies, enabling them to invest in new projects, and to sanction inspection, repair and maintenance (“IRM”) work for existing facilities.
Overall, the industry is moving to a place where new sources of oil and gas are increasingly costly and difficult to extract, while at the same time it is expected that regulatory pressures will continue to increase. These factors are expected to lead both to a continued requirement to squeeze economic value from existing facilities, increasing the need for subsea services to provide IRM type work, as well as a further increase in exploration and production activity in more challenging and remote areas of the world, again requiring services to assist in subsea construction and engineering.
With the acquisitions made in 2010, Mermaid now has modern vessels that meet the strictest global regulatory requirements and are also well able to operate in physically challenging environments, such as the North Sea and Sakhalin. As Mermaid continues to build its technical capabilities and to expand outside of Southeast Asia into new markets through 2011, new seasoned and experienced management to lead and further develop the subsea business have been recruited.
Offshore drilling services
Market situation
Although the cost of moving a rig and the availability to rig moving vessels may cause the balance between supply and demand to vary between regions, significant variations do not tend to exist long term because of rig mobility. Consequently, MDL operates in a single, global offshore drilling market.
In recent years, there has been increased emphasis by oil companies on exploring hydrocarbons in deeper waters. This deepwater focus is due, in part, to technological developments that have made such exploration more feasible and cost effective. Therefore, water depth capability is a key component in determining rig suitability for a particular drilling project. MDL generally views the deepwater market sector as that which begins in water depths of approximately 4,500 feet and extends to the maximum water depths in which rigs are capable of drilling, which is currently 12,000 feet. MDL views the midwater market sector as that which covers water depths of about 300 feet to 4,500 feet.
08

43Annual Report 2011
The global jack-up and tender assisted drilling market sector extends to water depths of 400 feet. This sector has been developed to a significantly greater degree than the deepwater market sector, because the shallower water depths have made it much more accessible than the deeper water market sectors.
The international jack-up market is unusual in that many units were built during the building boom of the 1970s and 1980s; as a result, many rigs are more than 25 years old. Day rates globally for the international jack-up market are now stable at around US$ 130,000-180,000/day for premium modern jack-ups. Utilisation for premium modern jack-ups now stands at 94% versus 80% for older jack-ups built before 1990.
- Utilisation for new rigs (less than 10 yrs old) bottomed out October 2009
- Current 94% utilisation healthy for dayrates-new rigs entering the market replaces old units if not incremental demand is present
Source: Pareto Research, ODS-Petrodata
- Utilisation for older jackups have not recovered since financial risis started
- Incremental demand ofr older units cand pick up, especially if call-on-Opec increases
- However, demeand from oil cmpanies have shifted towards newer equipment in general
Chart: New jackup utilisation Chart: Old jackup utilisation
Jan-09Jan-01 Jan-03 Jan-05 Jan-07 Jan-110
25
50
75
100
125
Utilisation effective%
80
84
88
92
96
100
Demand & Supply
Effective supply
Demand
Effective Utilisation
Total supply
Utilisation effective%Demand & Supply
70
76
82
94
100
75
100
125
150
175
Jan-09Jan-01 Jan-03 Jan-05 Jan-07 Jan-11
Effective supply
Demand
Effective Utilisation
Total supply
IC JU's > 300 feet built affer 1990 IC JU's > 300 feet built before 1990
In Asia, shallow and midwater units dominate the market; some midwater units are, due to size and quality issues, only available for work in the region. Nonetheless, activity in midwater, deepwater, and ultra-deepwater has improved throughout the year, with, for example, midwater utilisation for the past few months has stabilised at 88%.
Firmer oil prices, greater oil company activity and new rig availability offer good potential for Asian operators over the medium-term. As with the segment for jack-up rigs, new, high-specification rigs will find contracts quicker than those in an aging fleet. As utilisation has increased, the market is showing stronger signs of new-building activity.
The market for rig drilling services is both cyclical and volatile, ranging from the highly volatile exploration sector to the more stable oil and gas production services market. However, tender rig drilling and subsea engineering services, the two main business lines of Mermaid, cater to the more stable high-end niche of the oil and gas production market.
08

44 Thoresen Thai Agencies Public Company Limited
08
Types of Drilling Units
Tender rigs
A tender rig is a barge moored alongside a platform and contains crew quarters, mud tanks, mud pumps,
and power generation systems. The only equipment transferred to the platform for drilling operations is
the drilling equipment set. A tender rig carries its own drilling equipment and has a crane capable of
erecting the derrick on the platform, thereby eliminating the need for a separate derrick barge and related
equipment.
The tender rig was developed for production from a central platform, which serves a number of smaller
wellhead platforms. A tender rig is able to move from platform to platform using its own drilling equipment
set. A typical tender barge has dimensions of 300 feet by 80 feet with a gross tonnage of about 4,500
tonnes. Typical water depths it can operate in are between 30 to 400 feet. Tender rigs can also be moored in
up to 6,500 feet by use of a pre-laid mooring arrangement. Accommodation is in excess of 100 beds.
Furthermore, tender rigs have their own demand niche where jack-ups cannot be used, such as areas
restricted by subsea congestion preventing safe jack-up leg penetration, areas comprising deep layers of
soft soil or mud which makes it difficult for a jack-up’s legs to find a firm foundation or to remove its legs
upon completion, or areas with greater water depth beyond the physical length leg penetration capability of
a jack-up but which a tender rig can access through use of pre-laid mooring. Notwithstanding this,
contracted day rates in the tender rig market generally track rates in the jack-up market, as both these
market segments are driven by cycles in the oil and gas industry.
Jack-up rigs
A jack-up rig is a mobile self-elevating drilling platform equipped with legs that can be lowered to the
ocean floor until a foundation is established to support the platform. Once a foundation is established, the
drilling platform is then elevated up the legs so that it is above the highest expected waves. When the rig is
relocating, the platform is lowered to sea level and towed by a supply vessel to its next location.
A modern jack-up rig will normally have the ability to move its drill floor aft of its own hull (cantilever), so
that multiple wells can be drilled without re-positioning the rig. Ultra premium jack-up rigs have
capabilities enabling them to work in water depths in excess of 300 feet.
Semi-submersible rigs
A semi-submersible rig is a floating vessel that can be submerged by a water ballast system such that the
lower hulls are below the water surface during drilling operations. This reduces the rig’s exposure to ocean
conditions (waves, winds, and currents) and increases its stability. A semi-submersible rig is capable of
maintaining its position over the well through the use of an anchoring system or a computer controlled
dynamic positioning (“DP”) thruster system. Some semi-submersible rigs are self-propelled and move
between locations under their own power, although supply vessels relocate most rigs.

45Annual Report 2011
Drillships
Drillships are generally self-propelled and shaped like conventional vessels, and are the most mobile of the major rig types. Drilling operations are conducted through openings in the hull (“moon pools”). Drillships normally have a higher load capacity than semi-submersible rigs and are well suited to offshore drilling in remote areas due to their mobility and high load capacity. Like semi-submersible rigs, drillships can be equipped with conventional mooring systems or DP systems to maintain position over a well.
08
Barge
Platform
Tender rig Jack-up Tender rig Semisub moored Semisub DP Drilling DP
Business Review
MDL is an international provider of offshore contract drilling services for oil and gas wells. As of 30 September 2010, MDL had majority ownership of two tender assist drilling units. Only one tender rig, MTR-2, is on contract with Chevron Indonesia until March 2012. MTR-1 is currently off-hire but seeking a contract to provide accommodation barge service. Nonetheless, as the two tender rigs are approaching the end of their useful lives, Mermaid has worked out a plan to renew its drilling fleet with new and high-tech drilling units.
In December 2010, a new drilling company, Asia Offshore Drilling Ltd. (“AOD”), was set up. Mermaid invested US$ 49 million, equivalent to 49% of AOD, in December 2010. The remaining 51% was raised from institutional investors. Subsequently, AOD signed a newbuild program with Keppel FELS for two MOD-V B Class high-specification jack-up rigs at US$ 177 million per rig. The build program includes options to build two (2) additional jack-up rigs at Keppel FELS. The payment terms are 20% down payment on contract signing and 80% payment on delivery. Through its 95% owned subsidiary MDL, Mermaid entered into Technical and Commercial Management Agreements for the project management, operational readiness, and operations of the jack–up rigs for AOD.
In July 2011, AOD successfully raised an additional US$ 80 million. The proceeds of the placement were used to exercise the first of the two options for the construction of AOD’s third jack-up rig with Keppel FELS for a price of US$ 184 million. Similar to the first two rigs, the payment terms are 20% down payment on contract signing and 80% payment on delivery. The rest of the proceeds were for project management expenses, working capital and selling, general and administrative expenses related to the purchase of the rigs.

46 Thoresen Thai Agencies Public Company Limited
In the said private placement, Mermaid subscribed US$ 14.8 million. In addition, Seadrill Limited (“Seadrill”), a leading offshore drilling company in the world, was invited and subscribed US$ 54 million. This gives Mermaid and Seadrill equal 33.75% ownership of AOD. And given Seadrill’s much larger presence in the worldwide drilling industry, the existing management agreements with Mermaid were transferred to Seadrill.
On 15 July 2011, Mermaid announced that AOD was successfully listed in Oslo Axess under ticker ‘AOD’ and is classified as a listed company under the “Oil & Gas Drilling sector.
Table : Drilling Rig Fleet List
Rig name Year built/ Last upgrade
Classification Society
Water depth rating
(metres)
Drilling depth rating (metres)
with 5” DP
Quarters or Accommodation
MTR-1 1978/1988/2006 ABS 100 6,100 112 persons
MTR-2 1981/1997/2007 BV 100 3,350 126 persons
Source: TTA
The tender drilling rigs require classification from a recognised classification society, which classify them based on structural integrity and safety. The tender drilling rigs are classified by international bodies such as Det Norske Veritas (“DNV”), American Bureau of Shipping (“ABS”), or Bureau Veritas (“BV”). MTR-1 is classified by ABS, and MTR-2 is classified by BV. The classification authorities inspect the tender drilling rigs annually. The tender drilling rigs are dry docked every five years and subject to a special periodical survey by these classification societies.
Fleet Services
MDL’s contracts to provide offshore drilling services are individually negotiated and vary in their terms and provisions. MDL obtains most of its contracts through competitive bidding against other contractors. Drilling contracts generally provide for payment on a day rate basis, with higher rates while the drilling unit is operating and lower rates for periods of mobilisation or when drilling operations are interrupted or restricted by equipment breakdowns, adverse environmental conditions, or other conditions beyond MDL’s control.
Drilling contracts are awarded through competitive bidding or on a negotiated basis. The contract terms vary depending on geographical area, geological formation to be drilled, the equipment and services supplied, on-site drilling conditions, and the anticipated duration of the work to be performed.
A day rate drilling contract generally extends over a period of time covering either the drilling of a single well or group of wells or covering a stated term. Certain of MDL’s contracts with clients may be cancellable at the option of the client upon payment of an early termination payment. Such payments may not, however, fully compensate MDL for the loss of the contract. Contracts also customarily provide for either automatic termination or termination at the option of the client typically without payment of any termination fee under various circumstances, such as non-performance, in the event of downtime or impaired performance caused by equipment or operational issues, or sustained periods of downtime due to force majeure events. Many of these events are beyond MDL’s control. The contract term may in some instances be extended by the client exercising options for the drilling of additional wells or for an additional term.
08

47Annual Report 2011
In some areas of the world, local customs and practice or governmental requirements necessitate the formation of joint ventures with local participation, which MDL may or may not control.
Clients
MDL engages in offshore drilling for the leading international oil companies and government-controlled and independent oil companies. In 2011, MDL’s only significant client was Chevron Indonesia Company. As of 30 September 2011, the MTR-1 was warm stacked, following cessation of the contract with Cudd Pressure Control Inc. as an accommodation work barge and MTR-2 continues work under its renewal contract with Chevron Indonesia until April 2012.
Employees
MDL requires highly skilled personnel to operate its drilling rigs. As a result, MDL conducts extensive personnel recruiting, training and safety programmes. At 30 September 2011, MDL had one hundred and sixty-eight (168) staff and personnel.
Competition
MDL’s primary competitors include global or regional offshore drilling companies, including Seadrill Limited and Global Geo Services ASA. Price is often the primary factor in determining which contractor among those with suitable rigs is awarded a job. Other competitive factors include rig availability, safety performance record, reputation for quality, crew experience, and condition of equipment and efficiency.
The following table summarises the ownership of all tender drilling rigs.
Table : Tender Drilling Rig Market
Owner Name Owned Under Construction Total
Seadrill Limited 16 4 20
Triumph 4 0 4
KCA Deutag 3 0 3
Mermaid Drilling Ltd. 2 0 2
BassDrill 1 1 2
Others 4 1 5
Total 30 6 36
Source: Fearnley Offshore
FY 2011 – 2012: Headwinds and Tailwinds Factors
While much of the world is focused on the deep water drilling market, this market is highly capital intensive and is dominated by a few major clients, most notably Petrobras.
There remain many other attractive opportunities in the offshore drilling market for new and modern rigs, as clients increasingly desire faster, safer, more flexible and more capable rigs to meet their needs. As a result, we are increasingly seeing restrictions placed by clients on the age of rigs able to be bid, and even when that is not the case, the technical specifications set by clients effectively can only be met by modern rigs.
08

48 Thoresen Thai Agencies Public Company Limited
This is most clearly seen in the jack-up market where rates and utilisation for older jack-ups have dropped, and continue to drop, while those for new modern jack-ups enjoy high utilisation and increasing rates.
Mermaid’s investment in AOD and its modern high specification jack-up rigs is therefore a significant step towards meeting the demands of our clients going forward, and we are confident therefore that we shall be successful in procuring attractive long-term contracts for these rigs prior to their delivery.
Coal mining business
Given the critical importance of coal as a fuel source for developing Asia, and TTA’s existing involvement in coal transport, the Company has invested in two early stage / start-up coal projects: one in the Philippines and another in Indonesia. Dynamics of the coal market over the past two years, and outlook for coal going forward, suggests that this sector will continue to enjoy strong performance.
Philippines Mine
In 2009, TTA acquired a minority interest of 21.18% in the Merton Group (Cyprus) Ltd. (“Merton”), a Hong Kong based group founded by a veteran mining/metals industry professional to pursue early stage/start-up coal projects. Merton acquired certain coal concessions in Cebu, Philippines, which were subsequently merged with concessions of its local partner, SKI Group, to form SKI Energy Resources Inc. (“SERI”).
Merton’s major asset at the time of TTA’s investment was a 50% economic interest in SERI, which in turn controls 12,000 hectares of coal concessions in Cebu. SERI proceeded to build the first commercial scale underground coal mine in the Philippines, which commenced production in mid-2010, and sold its first shipment of coal in December 2010. In June 2011, Merton undertook a capital increase in which TTA participated, increasing its shareholding to 24.31%. This capital increase was primarily to fund Merton participation in an Indonesian coal project in which TTA is also an investor; this is discussed in detail below.
Also in 2011, TTA acquired, through conversion of an outstanding credit facility into equity, a direct interest in SERI. Through this investment, TTA acquired a 47.07% direct interest in SERI in addition to its indirect holding via Merton. This investment was undertaken in view of the strong outlook for coal in the Philippines as well as the substantial upside potential of the as yet undeveloped concession area controlled by SERI.
Philippines coal market
The Philippines consumed 11.5m tonnes of coal in 2009, two-thirds of which are consumed for power generation. About 20% is for cement production and the rest for other industrial processes. Coal energy is the country's biggest source of energy, accounting for 35% of the country's total gross energy generation in 2010. Given the tight power supply situation, the share of coal as a key energy source is likely to increase as it is cheaper to build compared with other sources and much more stable in terms of power generation.
Cement Power generation Industrial/direct processes
14,000,000
12,000,000
10,000,000
800,000
600,000
400,000
200,000
01999 2000 2001 2002 2003 2004 2005 2006 2007 2008 2009
Philippine Coal Consumption, 1999 – 2009 (unit: tonnes)
08

49Annual Report 2011
08
Chart : Coal consumption breakdown by sector Chart : Gross Generation Mix
Cement 21%
Power generation 73%
Industrial/direct processes 6%
Coal 35%
Biomass 0.04%
Wind 0.07%
Solar 0.02%
Hydro 12%
Geothermal 15%
Oil-based 9%
Natural Gas 29%
Source: Dept. of Energy Source: Dept. of Energy
Of the 11.5 million tonnes of consumption in 2009, about 64% was sourced from imports with the remaining from local production. In terms of local production, Semirara remains the undisputed biggest coal producer, cornering 90% of the production volume consistently since 1999. The other smaller players are MG Mining and Energy Corp. and PNOC-Exploration Corp. Coal imports by the Philippines are primarily from China, Indonesia, and Australia.
Table : Philippine coal imports by country of origin
1999 2000 2001 2002 2003 2004 2005 2006 2007 2008 2009
China 15% 28% 41% 50% 54% 47% 26% 12% 13% 13% 90%
Indonesia 43% 43% 41% 37% 40% 41% 61% 71% 72% 78% 2%
Australia 39% 26% 14% 9% 0% 5% 8% 10% 8% 4% 8%
Others 3% 3% 4% 4% 7% 7% 6% 6% 6% 5% 0%
Source: Dept. of Energy
For 2010, coal consumption was 13.31 million tonnes, of which 72.5% was utilised for power generation. Domestic production of coal was 7.33 million tonnes, of which 7.02 million tonnes was produced by Semirara. Coal imports totalled 10.97 million tonnes, of which 10.6 million was sourced from Indonesia.
Domestic coal demand is expected to remain strong given the heavy reliance on coal for power generation and the current and projected shortage of power supply. An approximate 1,300 MW in additional capacity has been committed, but this is a fraction of anticipated demand growth. If economic growth is higher than expected, this will only exacerbate shortages. Accordingly domestic sources of thermal quality coal will find a ready market.
Chart : Philippine coal consumption by imports and local production, 1999-2009
Imports Local
14,000,000
12,000,000
10,000,000
800,000
600,000
400,000
200,000
0 1999 2000 2001 2002 2003 2004 2005 2006 2007 2008 2009
in tons
Source: Dept. of Energy

50 Thoresen Thai Agencies Public Company Limited
In the first quarter of 2012, the Department of Energy will be holding a tender for 30 additional coal blocks in central and northern Philippines, with the objective of increasing domestic supply and reducing dependence on imports. The Energy Undersecretary for the Philippine stated that development of these blocks will likely require investment of approximately US$ 600 million (source: IB Times).
Business Review FY11
2011 was a challenging year for SERI. The company was in its first year of commercial production and inevitably challenges and difficulties arose. SERI has created an entirely new industry with its first ever underground coal operation in the Philippines. SERI has become a major employer in Cebu.
Early in the year, the mine encountered some challenges with consistency of coal specifications. The challenges were overcome by the installation of a screening facility to remove mudstone, which was adhering to the coal. In June and July, production was interrupted by an incident of spontaneous combustion in a previously mined area. This was contained and resolved. The production could resume, but production levels were impacted by the shut down period.
That said, SERI has demonstrated that it can successfully mine good quality thermal coal (with an average of 5,600 Kcal gross as received), and its coal is establishing itself as a known commodity among coal buyers. For its initial mine site, coal is being sold under an offtake contract with Glencore, and as production ramps up to higher levels, there is no lack of demand both domestically and regionally for this product.
SERI sold 50,000 tons of coal and earned US$ 4.67 million in FY11. The business has not yet reached breakeven but is expected to turn cash flow positive in 2012 as volumes ramp up.
Competitors
At present the only significant domestic coal producer is Semirara, which conducts an open pit mining operation producing coal of lower calorific value than that mined by SERI. Given the differing product specification, SERI is not competing directly with Semirara. In fact, Semirara exports a substantial amount of its production to China and elsewhere, whereas SERI is selling domestically to power generation and cement industry customers.
FY12-FY13: Headwinds and Tailwinds Factors
The geology of its initial mine site location in Danao is challenging. Coping with this has required adaptive and imaginative mine planning and underground techniques. SERI’s challenge in 2012 will be to ramp up to its target levels of approximately 20,000 tonnes monthly on mine-site 1, while identifying and planning for mine-site 2 and 3.
While these challenges are real, the domestic demand outlook is robust, particularly for thermal coal of the quality that SERI can provide. As its initial mine site occupies only a small fraction of its concession area, and preliminary drilling has indentified additional coal seams of even higher quality in other SERI controlled areas. Development of additional mine sites will be the key to boosting SERI’s value.
The experience and learning acquired in the construction of mine-site 1 will allow faster and more efficient construction of additional mine sites while leveraging the existing infrastructure and human resource base which SERI has developed.
Finally, an additional 6,000 hectares of concessions are expected to be awarded imminently, adding to the resource base of SERI.
08

51Annual Report 2011
Indonesian Mine
In March 2011, TTA entered into a strategic partnership to establish a new company, Qing Mei Pte. Ltd. (“Qing Mei”) to develop a new coal-mining project in Indonesia. The partnership includes TTA/Soleado, Merton, and Britmar (Asia) Pte. Ltd. (“Britmar”). Each partner holds an equal 33.3% share of approximately US$ 4.8 million initial capital of Qing Mei.
Qing Mei acquired a 70% interest in four coal concessions, totalling 33,000 hectares (206,250 rai) in Central Kalimantan. Sizes of the 4 blocks are as follows: • Block1: 6,800 hectares • Block2: 10,000 hectares • Block3: 10,000 hectares • Block4: 6,500 hectares
Indonesian coal market
Indonesia is currently the largest thermal coal exporter with around 39% share of total coal trade in 2009. According to the Australian Bureau of Agricultural and Resource Economics (“ABARE”), the thermal coal spot price is expected to remain at high levels throughout 2011 and will remain above the historical average price of US$ 65 per ton in the long term given growing demand from Asia, and rising production costs, as coal deposits will be deeper and further away from existing infrastructure.
The two most significant demand drivers for Indonesia coal have been Chinese imports and domestic consumption. Given the domestic infrastructure impediments, which still hamper fuller exploitation of Chinese domestic reserves, demand for lower cost Indonesian coal has remained strong. This strong demand for import to China has helped to keep Indonesian pricing strong as can be seen by its outperformance of Newcastle benchmark.
08
0
90
100
110
120
130
140
Jan-10 Mar-10 May-10 Jul-10 Sep-10 Nov-11 Jan-11 May-11
Chart : Australia Coal (6700 kc, S/tonne) Chart : Indonesia Coal (6700 kc, S/tonne)
Source: Bloomberg Source: Bloomberg
85
95
105
115
125
135
Feb-10 Apr-10 Jun-10 Aug-10 Oct-10 Dec-11 Feb-11 Jun-11
Domestically, the ongoing program to add an additional 10,000 MW of power generation capacity is driving expansion of domestic demand. The initial phases of this program are anticipated to add 5,200 MW in 2011 and a further 2,500 MW in 2012, adding incremental domestic coal demand of approximately 18 million tonnes and 9 million tonnes, respectively. While some market observers believe that this increasing domestic demand will slow Indonesia exports, others argue that additional production commencing will support export levels.

52 Thoresen Thai Agencies Public Company Limited
08
One clear trend is that the volume of lower grade coal being exported is increasing. Wood Mackenzie estimate that lower rank coals will comprise over 60% of supply volume by 2025. Much of the new power generation capacity being added in the region (e.g. in India and Vietnam) is being built to utilise these lower rank coals.
Business Review FY11
Following completion of an extensive legal due diligence and confirmation of all required approvals and permits, Qing Mei has embarked upon further exploratory drilling. This is to supplement work done previously by the Indonesian partner, as well as for logistical and commercial studies.
To date, drilling and exploration works have focused on Block 1, where previous drilling had preliminarily indentified 110 million tonnes of resources in an area of 4,147 hectares of Block 1. The ongoing drilling programme is targeted at confirming resource size and coal quality. Qing Mei coal is low rank sub-bituminous, with calorific value of 3,400 Kcal gross as received or 4,800-5,000 Kcal air-dried.
The exploration and Joint Ore Reserves Committee (“JORC”) compliant resource reports for Block 1 are expected to be completed in early 2012 (calendar year). In addition, some preliminary drilling is being undertaken in the remaining blocks to obtain initial indication of coal quality and extent of resource across the concession area.
FY12-FY13: Headwinds and Tailwinds Factors
As noted above, a growing percentage of Indonesian coal exports are lower rank coal such as that which is present in the Qing Mei concessions. UMS, another Group company, currently imports coals of similar quality, and regionally the market for such coal is growing.
The Qing Mei concessions are, however, some 400 kilometres upriver from the coast, adding a significant logistical challenge and cost to utilising this coal as an export product. While the quality is sufficient for domestic consumption, given the logistical cost component, benefication (drying, upgrading) of this coal would be required to make it a viable export product. Qing Mei is evaluating established drying technologies and believes that this can be done cost effectively. Interestingly, other projects with similar coal quality and logistical challenges have been well received in raising funds from capital markets with as yet to be proven logistical and coal benefication plans.
For 2012, the Group and its partners in Qing Mei will, based upon the results of the current exploration work and commercial studies and evaluation of coal upgrading technologies, determine the best strategy to extract value from this project for the long term.

53Annual Report 2011
Infrastructure Group The Infrastructure Group is represented by a number of businesses that are ultimately engaged in logistics. The two key businesses are Unique Mining Services Public Company Limited (“UMS”) and Baconco Co., Ltd. These businesses have a number of integrations with both the Transport Group and the Energy Group.
Coal logistics business
UMS provides end-to-end and just-in-time coal logistics sales and distribution services in Thailand. It owns two (2) coal blending facilities and warehouses, twelve (12) barges, and fifteen (15) owned trucks to serve the increasing local coal demand of small and medium-sized industrial clients, which use coal-fired boilers. UMS is an integral part of TTA’s strategic plan to build an integrated coal business. This integration with the Transport Group includes the use of Fearnley’s Thailand as one of its primary brokers and the use of Thoresen’s vessels to transport coal from Indonesia to Thailand.
UMS’ core clients typically use low calorific value (sub-bituminous 4,000 – 4,200 calorific value, gross as received) coal, which are secured from no less than six (6) reputable suppliers in Indonesia. This supply model ensures that UMS receives regular shipments of coal and is able to guarantee consistent supply to all clients, regardless of weather conditions in Thailand or Indonesia.
UMS sells coal to several domestic industries, including pulp and paper, textile, food processing, and cement. UMS’ coal import strategies have been adapted to match the engineering specifications of the boilers used by each industry. The strategic objective is to be the leader in domestic coal distribution for medium and small sized manufacturers.
UMS continues to see the potential to expand its client base and market share within the SME segment. While a major concentration of coal fired boilers are based in Samut Sakorn and Ayudhya provinces, there are also opportunities in South, South East, and Northern Thailand. Combined with the number of gas and fuel oil boilers in those areas, greater penetration is possible. However, this is not a simple undertaking based on a number of factors, including transportation expenses and the likelihood of converting fuel and gas boilers to coal. These factors are not insurmountable. The key to this approach and direction is to ensure the highest standards of environmental and community protection, including closed transportand covered facilities, beyond that of standard governmental regulations.
Another strategic objective in 2012 will be to increase coal trading activities domestically and internationally. We will likely focus on higher calorific value (sub–bituminous 5,000 to 6,000 calorific value, gross as received) coal. Potential clients include the various power producers (IPP’s, SPP’s and VSPP’s) in Thailand, those in neighbouring countries such as Vietnam, as well as major importers of coal, such as China. With UMS’ strong reputation, its existing Indonesian suppliers as well as new suppliers would welcome the increased activity. In a few years’ time, there is a strong potential to buy coal directly from the Energy Group’s coal mines in the Philippines and Indonesia, thereby creating a fully integrated coal business, including transport.
Since 2010, UMS has embarked on a gradual restructuring program, commencing initially with identification of key organisational function changes, employee assessments, salary restructuring, and recruitment of key management positions. Throughout 2011, all key management positions were filled, business processes were reviewed for improvements, and won going enhancements are being made to production and port facilities. The key priorities in 2012 are to implement and execute the processes, train and develop employees, which will culminate in the achievement of stated objectives indicated above.
08

54 Thoresen Thai Agencies Public Company Limited
Market Situation
The chart below provides a summary of the various coal types and reserves, general properties and typical usage:
Coal Types: Reserves, General Properties and Typical Usage
Low Rank Coals 47%
Lignite 17%
Largely Power Generation
Power, Cement & Industrial
Power, Cement & Industrial
Iron & Steel Production
Domestic & Industrial including
smokeless fuel
Sub-Bituminous 30%
Hard Coal 53%
Bituminous 52%
Thermal Steam Coal
Metallurgical Coking Coal
Anthracite 1%
% o
f Wor
ld R
eser
ves
U
ses
Carbon/Energy Content of Coal
Moisture Content of Coal HIGH
HIGH
Source : World Coal Institute
Based on a new report of Wood Mackenzie Research May 2011 on South East Asia’s future energy sources, coal is tipped to be the fossil fuel of choice by 2020 compared to natural gas and fuel oil. Coal’s cost advantages, abundance of supply and accessibility, coupled with ongoing improvements in “clean coal” technologies, will make it a popular choice for the region, where power demand is set to triple by 2030.
Local gas reserves in Java, Sumatra, the Gulf of Thailand, and the Malay basin are maturing. In Thailand’s case, the Energy Planning Office, Ministry of Energy estimates that natural gas reserve to production availability is estimated to be 12 years only.
08

55Annual Report 2011
Chart : Coal Imported into Thailand
Oil Natural Gas Coal
140
120
100
80
60
40
20
0Oil Natural Gas Lignite-Coal
80
70
60
50
40
30
20
10
0
Chart : World Reserve to Production Ratio: 2010 (Years) Chart : Thailand Reserve to Production Ratio: 2010 (Years)
It is clear that with Thailand’s projected economic growth, supply of natural gas and oil will be a continuing challenge. Coal demand in Thailand has been significantly lower than most South East Asian and North Asian countries. However, given the facts mentioned, Thailand is expected to be a larger consumer of coal in the future.
Chart : Actual and Projected Coal Demand in Thailand
1986
Total
1989 1992 1996 1999 2002 2005 2005 2011 2014 2017 2021
80Million Tonnes
70
50
30
20
10
0
Electricity Industry
The combined factors of fossil fuel supply and availability, the advantage that coal has from a price perspective compared with fuel oil and gas, results in the continued upward trend of imported coal that will likely significantly exceed more than half of the demand within 2020. For example, in 2010, coal demand was approximately 37 million tonnes, while imports reached 16.9 million tonnes – already almost half of consumption.
0
2
4
6
8
10
12
14
16
18Million Tonnes
2001 2002 2003 2004 2005 2006 2007 2008 2009 2010
4.955.59
7.11 7.558.57
11.22
14.41
15.98 16.39 16.9
Source : Bangkok Post
Source : EGAT
08
Source : Energy Policy Planning Office Ministry of Energy Source : Energy Policy Planning Office Ministry of Energy
As seen in the following diagram, Thailand’s coal demand for both industry and electricity generation is set to increase significantly from 2011 through 2020.

56 Thoresen Thai Agencies Public Company Limited
In real terms, use of coal as an energy source can significantly reduce production costs and there appears to be an increasing trend in manufacturing to convert from fuel oil to coal in order to enhance competitiveness in the long-term. The chart below provides an example of the number of fuel oil boilers nationwide. If these were converted to coal fired boilers, a significant increase in coal consumption can be seen. Clearly not all boilers can or will be converted but the fact remains that coal demand and use will increase and be the fuel of choice as outlined earlier.
There are 3,613 fuel oil boilers nationwide, translating to potential coal consumption of approximately 2 million tons/month.
Source: Ministry of Industry
100.01-500.00
Number of Boiler Solid Fuel Consumption (Ton per Month)
Size of boiler (Ton/Hr.)
Boiler Investment(Baht Million)
100% 363,613 2,008,563 34,43346
2,313
1,218
420,966
921,197
225,400
441,0000 7,560
3,864
15,792
7,217
90%
80%
70%
60%
50%
30%
40%
20%
10%
0
50.01-100.00 5.01-50.00 1.00-5.00
Business Review
The outlook and market for coal in Thailand can be considered as positive. As one of the pioneers of the coal logistics business in Thailand, UMS continues to enjoy a strong reputation domestically and overseas, where sourcing is done.
UMS reported sales volumes of over 1.4 million tons in 2011, up 21% from FY10. The company continues to make enhancements to its existing coal classification production and port facilities, with specific emphasis on environmental and community protection.
Competition
Thailand’s coal distribution business has approximately 20 operators. Of these, approximately 15 compete directly with UMS in the small and medium sized (SME) segment. UMS is the market leader in this area with approximately 35% market share.
FY12-FY13: Headwinds and Tailwinds Factors
As indicated earlier, there is an increasing trend for the manufacturing industry to convert from fuel oil to coal as an energy source. UMS continues to encourage clients to make this move by providing consultative guidance regarding coal use, technical specifications of coal fired boilers, and provision of consistent and quality supply.
Coal prices trended upwards in 2011, however, in recent months this has stabilised with a potential for a gradual decline in the first half of 2012. This is a positive trend for coal operators.
At the same time, the impact of the floods in 2011 is likely to be beneficial to cement manufacturers, as there is a high likelihood for increased re-construction work (apart from existing building projects). On the other hand, with many manufacturing facilities having been affected, there is potential for a slowdown in coal imports at the start of 2012, but demand is likely to increase significantly in the second half of the year, once production facilities are at full capacity.
08

57Annual Report 2011
Finally, the coal industry and operators need to adhere to the highest standards of compliance for both environmental and community protection, especially when the country’s energy source is likely to be coal going forward. This means continuous enhancements to meet and exceed the requirements of government agencies, as well as significant and continued engagement with the communities where facilities exist. Only with the highest standards will all concerned parties accept coal.
Port operations business
In November 2010, Soleado acquired a 20% stake in Baria Joint Stock Company of Service for Import and Export of Agro Forestry Products and Fertilisers (“Baria Serece”) from Yara Asia Pte Ltd. Baria Serece owns and operates Phu My port in South Vietnam.
Phu My port is situated on the Thi Vai River, approximately 17 miles from the open sea and is adjacent to Phu My industrial park. The port is Vietnam’s largest dry cargo deep-water port and will be able to receive up to 7 million tonnes of agricultural products, coal, and fertilisers, once the fifth crane is installed in 2012 and the quay upgrade project is completed in 2013 to receive vessels up to 80,000 dwt.
The port is able to handle vessels with draft up to 12 meters and displacement of 60,000 dwt. As such, the facility is favoured among Handymax, Supramax and Panamax operators, as no lightering is needed prior to arrival.
Fertiliser and warehousing business
Baconco Co., Ltd. (“Baconco”) was the first strategic move to build an integrated logistics business in Vietnam.
Baconco is located on a 56,000-square-metre site in Phu My and is adjacent to Baria Serece. Besides fertiliser production, Baconco provides warehousing services and has invested in new warehouses that will open in early 2012.
Baconco operates a 300,000 metric tonne per annum blending and NPK fertiliser granulation production unit. In addition to the sale and distribution of own production, it also exports and is a supplier of pesticides and seeds. As the plant is located besides Phu My, Baconco’s existing warehouse and newly built capacity may be utilised to capture volumes that require storage in transit that cannot be handled presently by the port itself. With TTA’s acquisition of a 20% stake in Baria Serece, Baconco has emerged as a strong partner to Phu My port.
Baconco can lease out warehouse capacity of 4,000 square metres – with 2,000 square metres each for bulk and bagged cargo (up to 16,000 tonnes combined). In 2011, Baconco purchased an additional piece of land within Phu My and is building a warehouse of 6,000 sq. meters for a capacity of 24,000 tons. This warehouse will be completed by December 2011, and some clients have already signed agreements for 2012.
Thoresen (Indochina) S.A.’s subsidiary company, Thoresen-Vinama Agencies Co., Ltd. having the necessary logistics licenses, has become Baconco’s third party logistics provider. As such, there is almost complete integration of the entire supply chain. As an example, cargo from a client’s factory was picked by TVA’s trucks and trailers, stored in Baconco’s warehouse, loaded onto a vessel at Baria Serece, with TVA’s labor and with ship’s agency services provided by Thoresen (Indochina) S.A..
08

58 Thoresen Thai Agencies Public Company Limited
Market Situation: Fertiliser Business
It is estimated that Vietnam needs 8-9 million tonnes of fertiliser per annum and industry experts believe that this demand will remain stable for the next 2-3 years, with modest increases of 2-3 percent.
Domestic production can only meet about 50% of national demand. For urea alone, Vietnam is able to produce 50% of domestic demand from Petro Vietnam’s 750,000 tonnes/annum Phu My plant and Vinachem Group’s 180,000 tonnes/annum Hac Bac plant. For DAP (Diammonium phosphate), SA (Ammonium sulphate) and kali (potassium), Vietnam needs to import 80-85%, 100% and 100%, respectively. These are important input materials for the production of NPK. The majority of these imports
come from China. With China imposing a 110% tax on fertiliser exports, prices are expected to remain firm and, as a result, production costs and domestic retail prices of imported products will be higher than prices of domestically produced products. Total imports of DAP, SA, and Kali in 2011 will reach 2.5 million tonnes.
The major ingredients of fertiliser are nitrogen, phosphate and potassium: Nitrogen (N) – used to produce leafy growth and formation of stems and branches; Phosphate (P) – essential for seed germination and root development, needed particularly by young plants to form their root systems and by fruit and seed crops; Potassium (K) – promoting flower and fruit production and is vital for maintaining growth and helping plants resist diseases.
Vietnam Fertiliser Consumption
0
1,000,000
2,000,000
3,000,000
4,000,000
5,000,000
6,000,000
7,000,000
8,000,000
9,000,000Tonnes
20052002
Total fertiliser Total NPK
2006 2007 2008 2009 2010 2011
Market Situation: Warehousing Business
The industrial market in Vietnam is divided into three key economic zones, the Northern Key Economic Region (NKER), the Central Key Economic Region (CKER) and the Southern Key Economic Region (SKER). There are 194 industrial parks in Vietnam, employing 1.5 million people. The greatest concentration of parks is found in the SKER. In 2010, the industrial sector attracted 8,500 projects worth over US$ 70 billion. There are 68 industrial parks in the NKER, 34 in the CKER and 92 in the SKER. Within the SKER, there are 10 industrial parks in Ba Ria – Vung Tau, with 3 in Phu My.
Vietnam’s port systems are going through significant upgrading, especially those that are state owned. Many, however, are still old and out-of-date, with limited infrastructure. Therefore, some limitations exist for yards and warehousing systems to accommodate both containers and bulk cargos. So far, participation of the private sector in port management has been limited, with only Baria Serece, VICT, and Interflour present.
Warehouse development and availability, plus professional logistics management, will be a key factor in supporting Vietnam’s port infrastructure and industrial sector. It comes as no surprise then that warehouse rental rates in Vietnam are classified into 2 to 3 “types” with those that are located near Industrial Parks/Export Processing Zones and strategic locations such as CBD, airports, ports and easy accessibility of transportation – commanding higher rental rates. For example, within the SKER according
08

59Annual Report 2011
to Colliers International VN, warehouses with said strategic locations, of good quality and well managed can command in excess of US$ 5.00 per square meter per month excluding VAT and other fees. This is in comparison to warehouses with fair quality, local management and long transport distance/non-strategic locations – generating US$ 1.5 to 2.5 per square meter per month only.
Business Review
With respect to the fertiliser business, the market and industry outlook will continue to be favourable to Baconco in many ways. It is a 16 year old company distributing its own production, with a reputation and brand image (The STORK) that is synonymous with reliability and quality. With increasing exports of its product, Baconco has completed the registration of its brand in Cambodia, Laos and Indonesia.
Single fertiliser sales (e.g. Urea only) are not Baconco’s objective. Instead, Baconco engages in five production processes compared to other companies who produce NPK only by bulk blending. Baconco continues to innovate and diversify its products utilising chemical, physical and biological processes in fertiliser production. At this time, Baconco has over 55 different formulas.
In 2011, Baconco produced 190,524 tons of fertiliser and continues to implement a cash-only payment policy both domestically and in the export market. Clearly, this is a direct result of the product’s reputation for quality. Baconco continued to monitor and orientate its efforts on the best-paying formulas and continuously renewing the range of products. At the same time, marketing efforts focused at all levels – farmers, retailers and wholesalers.
RAW MATERIALS Nitrogen, Phosphorus, Potassium, Sulfur, Calcium, Magnesium, Micronutrients, Organic Matter
GRANULATION COMPACTION
Bio Stimulant
BULK BLENDING
FINISHED PRODUCT 50 NPK formulas for Rice, Coffee, Tea, Rubber, Sugar Cane, Fruit Trees & Vegetables
USP
Baconco Fertiliser Production Processes
08

60 Thoresen Thai Agencies Public Company Limited
Clients
Baconco continues to consolidate its wholesaler network to approximately 200 wholesalers and 4,000 retailers.
Competition
Competition is significant in the Vietnam market. As indicated previously, there are over 500 producers. Many of these are state owned companies, the largest being Petro Vietnam. Petro Vietnam has completed the building its large urea production facility in Phu My industrial park and has plans to build a NPK facility with capacity of 400,000 tonnes. While this is scheduled in 2012, there has been no evidence that the NPK plant has commenced construction.
FY12-FY13: Headwinds and Tailwinds Factors
Imported raw material prices have shown a clear upward trend. These increases are mainly for DAP and potash, which are in turn driven by high crop prices and generally low inventory levels. This will in the short to medium term result in higher cost of sales. Baconco will monitor closely these developments and may look to increase inventory levels to offset the higher raw material process. Nonetheless, Baconco has been able to maintain its cash sales policies, thereby allowing it to continue to pass on some of the higher costs by adjusting prices.
Baconco expects to slightly increase its production levels in 2012. Exports sales will help reduce production costs. The cash sales policies will be maintained. Quality enhancements continue to be a major goal and direction.
Finally, given the proximity to the Phu My port, the company continues to expand its logistical and warehousing capabilities through additional land acquisition within Phu My industrial park and building new warehouses to support Baria Serece volume throughput.
Ship Supplies, Logistics, Ship Stevedoring and Transportation
Chidlom Marine Services & Supplies Ltd. (“CMSS”), a wholly-owned subsidiary of TTA, provides ship supplies and logistics services, including supply of ship stores, cargo dunnage materials, cargo lashing and securing equipment, cargo handling equipment, tally and checker services, forklift rental/services, warehouses and storage spaces for rental, material procurement, management, and distribution. CMSS also provides ship stevedoring and transportation services, including cargo loading and unloading, cargo handling, and transportation.
Third Party Logistics Services
In October 2006, GAC Thoresen Logistics Ltd. (“GTL”) was established for the domestic logistics business. TTA owns 51.00% of GTL, with the remaining 29.00% and 20.00% owned by GACL (for purposes of compliance with warehouse regulations) and Mr. Lars Safverstrom, the president of the Gulf Agency Company, respectively. The company owns a 10,000 square meter warehouse facility at Amata Nakorn
08

61Annual Report 2011
Industrial Estate and leases a 6,000 square meter warehouse facility at Bang Pa in Industrial Zone.
GTL is a third party logistics service provider (“3PL”) that engages in warehousing, warehouse management, and domestic distribution for both local and multinational clients. The company operates in a niche environment and has secured mid to long-term contracts with a selected number of clients. The warehouse facilities have operated at full capacity throughout 2011.
08

62 Thoresen Thai Agencies Public Company Limited
Corporate Social Responsibility Policy09
TTA is determined to uphold its status as a good corporate citizen and has always operated with good governance as its core principle. We have defined clear standards for good governance, and there are procedures in place for tracking, evaluating, and improving what we do. Our goal is to integrate the concept of social responsibility into every aspect of our operations, covering all internal and external activities.
We believe that social responsibility cannot be defined simply as the act of organising activities for the benefits of our society. Rather, we see it as a vital part of our corporate culture, which is structured around the core values of morality, excellence, teamwork and commitment. In turn, these values have given us a solid base for good governance.
Additionally, TTA provides full support for all subsidiaries in the transport, energy and infrastructure business groups in the organisation of activities designed to help communities that are within the vicinity of their operations. We remain fully dedicated to the betterment of society in every aspect, including education, environmental management, health and hygiene or community development.
CSR Activities in 2011
Education: TTA has been supplying students with scholarships on an annual basis. Scholarship recipients include the sons and daughters of our ship crews as well as students of the Merchant Marine Training Center, Kasetsart University, and Burapha University. Our staff members have also delivered lectures on the merchant marine business for college and university students, while many educational institutions have received our contributions of funds, learning aids, and sporting equipment.
Environmental Management: TTA places great importance on environmental management across all business groups. For instance, Thoresen’s and Mermaid’s fleets regularly replace older vessels with new ones that utilise advanced technologies, allowing us to accurately determine and control each ship’s emission levels. UMS, meanwhile, has received ISO 14000 certificate for environmental management standards for its factory in Samut Sakorn and has planted trees in many communities around the facility. The entire TTA Group actively promotes the conservation of natural resources and energy through regular routines, including turning the air conditioning and lights on and off at set times during the day and the use of high efficiency lights and air conditioners and more paperless meetings and approval processes.
Health and Hygiene: We regularly conduct safety, hygiene, and environmental inspections to keep our employees healthy. Each inspection is done by the Safety, Hygiene, and Environment Office, which is responsible for compiling thorough reports on workplace environments and providing suggestions on faults and improvements.
Community Development: Many activities encourage employees to step up and become volunteers. These include training sessions, corporate outings, and disaster relief operations. Our employees actively volunteered to make donations, prepared emergency survival kits, and delivered aid to victims of the flood crisis alongside units from the Royal Thai Army.
TTA intends to promote regular contributions to society among employees by engendering a sense of responsibility not only for themselves but also for the company, customers, communities, and society at large, and we hope that our actions can help Thai society and local communities achieve sustainable growth in the long run.

63Annual Report 2011
Management Discussion & Analysis10
TTA reported a net profit of Baht 139 million and earnings per share of Baht 0.20 for the year that ended on 30 September 2011. This compares with net profit and earnings per share of Baht 796 million and Baht 1.12, respectively for the year that ended on 30 September 2010.
2011 was the third year of a five-year strategic plan to transform TTA into a more diversified business group.
In some respects, the 2011 results indicate that our strategic plan is working. Total revenues decreased by 2% to Baht 17,565 million. Revenues, however, are well balanced across the three lines of businesses. The 41% drop in freight charges was offset by a 59% improvement in offshore services income and a 34% growth in revenues from coal and fertiliser sales.
At the operating level, combined normalised EBITDA from the three lines of business decreased only 4% to Baht 2,700 million, while the BDI fell 45% on average.
Strong subsea engineering demand propelled Mermaid’s results in the second half of 2011, resulting in a 244% improvement in the Energy Group’s normalised EBITDA. The Infrastructure Group generated respectable EBITDA growth of Baht 25 million, considering one of UMS’ two plants shut down for one quarter, and Baconco’s fertiliser gross margins fell due to rising raw material costs.
Extraordinary gains, excluded from normalised EBITDA, consisted of Baht 401 million gains on cross currency swap transactions on new vessel acquisitions. Gains on disposals of fixed assets, mostly old vessels, totalled another Baht 589 million during 2011.
Restructuring across many businesses, with an aim to lower their future costs, resulted in reorganisation charges of Baht 50 million. Excluding asset impairment charges of Baht 554 million, net profit was Baht 693 million. With the impairment charges, net profit was Baht 139 million.
Baht million
2010 2011
TransportInfrastructureEnergy
2,500
2,000
1,500
1,000
500
3,000
0352
1,892
576
601
890
1,209
5,000
10,000
15,000
20,000
Baht million
02010 2011
4,667
3,476
9,273
5,543
6,249
5,430
Sales
Service and commission Income Offshore services income Freight charges
Revenues
Normalised EBITDA

64 Thoresen Thai Agencies Public Company Limited
Transport Group
In Brief:
The Transport Group provided Baht 271 million of profits, a 68% decrease year-on-year (“yoy”). The main reasons for the decrease included: 1) low freight rates resulted in operating losses, and 2) non-cash impairment charges of Baht 243 million, which were offset by Baht 587 million gains on sales of 15 old vessels.
Baht million
FY10 FY11
800
600
400
200
1,000
0
845
271
Continued down cycle for dry bulk shipping in FY11
From October 2010 to September 2011, dry bulk shipping continued to experience a weak freight rate environment. The Baltic Dry Index (“BDI”) averaged 3,011 points in 2010 and 1,657 points in 2011, a 45% decrease yoy.
In fact, the BDI was averaging only 1,372 points from January to June 2011 and only exceeded 2,000 points in October 2011. Global vessel supply growth continues to outpace demand growth, which is also being affected by the global economic downturn.
Lower TCE rates and higher costs resulted in operating losses
The down cycle undoubtedly impacts all operators negatively. Time Charter Equivalent (“TCE”) rates for all vessel sizes fell. During 2011, even though the Baltic TCE averages for the Handysize and Supramax sectors fell 34% and 36%, respectively, Thoresen’s TCE average fell only 7%. This result was achieved through the sale of all older and smaller vessels and retaining only the larger and more competitive Supramax vessels. Thus, Thoresen’s TCE average is converging towards Supramaxes.
Average Daily Operating Results (US$/Day)
US$/Day FY10 FY11 %yoy
US$/THB Rate (Daily Average) 32.56 30.24 -7%
Time charter equivalent (TCE Rate)* $12,619 $11,713 -7%
TCE Rate of Owned Fleet $13,032 $12,133 -7%
TCE Rate of Chartered-In -$413 -$420 -2%
Vessel operating expenses (owner expenses) $4,806 $5,378 12%
Dry-docking expenses $1,378 $1,254 -9%
General and administrative expenses $1,520 $1,736 14%
Financial costs $141 $236 67%
Depreciation $2,977 $4,144 39%
Operating earnings* $1,796 -$1,036 -158%
Note: *The per day basis is calculated based on available service days.
Profit Contribution
10

65Annual Report 2011
In 2011, the shipping business sold 15 vessels and added 3 Supramax vessels, resulting in a 29% drop in available service days. Because operating expenses were divided by lower service days, some per-day expenses rose sharply despite efforts to reduce them. Furthermore, the piracy incident resulted in higher operating expenses, including extra security people on board for piracy-prone routes and higher insurance premiums. In September, we took a restructuring charge of Baht 26 million to downsize the organisation by 20%. Some employees in certain functions were transferred to a centralised services unit to reduce overlaps across the TTA group. The per-day general and administrative expenses will fall in 2012 and beyond.
On a positive note, the high cost chartered-in vessels completed their contracts and were returned to their owners, so there is no significant cost overhang in 2012. While the daily operating results show a loss, the TCE average of US$ 11,713 per day was sufficient to cover all cash expenses (operating, administrative, and interest expenses).
Baht 224 million of impairment charges on assets under construction at a supplier were taken. In November 2007, an order for four main engines was made as part of a cancelled newbuild vessel programme. Approximately US$ 15 million was paid to the supplier in instalment payments. The sub-contractor of the supplier, however, has run into financial difficulties and has not been able to build and deliver the engines as agreed upon. While Thoresen intends to claim the entire payment back, the resolution is under negotiation. Conservatively, 50% of the entire payment was impaired during 2011.
As of 30 September 2011, Thoresen had an owned fleet of 15 vessels, 43,798 average dwt, and 10.8 year-old average age. The owned fleet is more competitive today than one year ago. Deliveries of two new Supramax vessels are expected in 2012, while addition of second-hand vessels could be possible when prices come down to a feasible level.
26,401
43,798 40.5
15.7 19.2
10.8
0 5 10 15 20 25 30 35 40 45 50
0 5,000
10,000 15,000 20,000 25,000 30,000 35,000 40,000 45,000 50,000
1Q F
Y09
2Q F
Y09
3Q F
Y09
4Q F
Y09
1Q F
Y10
2Q F
Y10
3Q F
Y10
4Q F
Y10
1Q F
Y11
2Q F
Y11
3Q F
Y11
4Q F
Y11
Avg DWTAvg age (years) RHS
Avg #vessels (owned fleet) RHS
DWT: Dead Weight Tonnes # Vessels or Years
Fleet data summary
FY10 FY11 %yoy
Average DWT 29,444 43,798 49% Calendar days for owned fleet (1) 11,113 8,118 -27% Available service days for owned fleet (2) 10,430 7,368 -29% Operating days for owned fleet (3) 10,227 7,308 -29% Owned fleet utilisation (4) 98.1% 99.2% 1% Voyage days for chartered-in fleet 3,096 2,081 -33% Average number of vessels (5) 36.5 25.7 -30%
Note: (1) Calendar days are the total calendar days Thoresen owned
the vessels in its fleet for the relevant period, including off hire days associated with major repairs, dry dockings, or special or intermediate surveys.
(2) Available service days are calendar days(1) less planned off hire days associated with major repairs, dry dockings, or special or intermediate surveys.
(3) Operating days are the available days(2) less unplanned off-hire days, which occurred during the service voyage.
(4) Fleet utilisation is the percentage of time that Thoresen's vessels generated revenues and is determined by dividing operating days by available service days for the relevant period.
(5) Average number of vessels is the number of vessels that constituted Thoresen's fleet for the relevant period, as measured by the total operating days for owned fleet plus voyage days for chartered in fleet during the period divided by the number of calendar days in the relevant period.
10

66 Thoresen Thai Agencies Public Company Limited
Thoresen booked a respectable normalised EBITDA of Baht 898 million and a negative 25 million normalised EBIT in 2011.
Continuous profit contribution growth from Petrolift
Petrolift continues to deliver on plan with consecutive quarter on quarter (“qoq”) growth in equity income to TTA throughout 2011. With its stable business model, Petrolift has lessened the volatility impact of the dry bulk shipping business. The return on investment, including dividends, is 26% to date.
Energy Group
In Brief:
The Energy Group contributed Baht 110 million of losses in 2011, 45% less than 2010. Mermaid staged a strong turnaround in the second half of 2011 with about Baht 140 million of profits to the Energy Group versus Baht 230 million of losses in the first half. Subsea engineering demand has resumed, as oil prices stabilised above US$ 80 per barrel.
Mermaid’s total service income increased 59% from 2010
Mermaid’s total service income for 2011 was Baht 5,543 million, a 59% increase from 2010. The increase in revenues was significantly driven by the subsea business, where asset utilisation increased to 69.1% in 2011 from 39.5% in 2010. Average day rates also increased by 10.9% in US Dollar terms.
Gross profits were Baht 754 million, a 226% increase from 2010. Of the Baht 754 million gross profits, Baht 386 million was contributed by the subsea segment (9.7% margin), Baht 208 million from the drilling segment (20.0% margin), and Baht 161 million from the survey segment (31.2% margin).
Administrative expenses were Baht 719 million, a 29% increase from 2010. The key reasons were 1) higher expenses related to the management of Asia Offshore Drilling Limited (“AOD”) of Baht 57.3 million, 2) a provision for doubtful debt of Baht 33.2 million, 3) write off withholding taxes of Baht 21.2 million, and 4) restructuring charges of Baht 17.7 million to downsize the organisation.
Mermaid’s normalised EBITDA of Baht 1,209 million rebounded strongly in 2011 and normalised EBIT increased 196% to Baht 245 million.
Subsea engineering recovery continued for two consecutive quarters
Despite an increase in E&P spending in 2010, fleet growth in seismic and subsea outpaced demand growth and oversupply put pressure on margins. For 2011, fleet growth did not match increased spending, and utilisation is expected to remain at similar levels in 2012. The subsea business will continue to experience seasonality, with the low season from November to February and the high season from March to October. The outlook for 2013 onwards is bullish, as growth in fleet sizes is expected to lag spending growth.
MTR-2 on contract, MTR-1 further impaired, and new jack-up rigs under construction
On the offshore drilling side, MTR-2 was at 95.8% utilisation during 2011 with Chevron (Indonesia), and the contract will expire in March 2012.
Baht million
-50
-100
-150
-200
0
-250
FY10
-200
-110
FY11
Profit Contribution
10

67Annual Report 2011
MTR-1 was off-hire in 2011. Given that MTR-1 has been offhire for more than one year, Mermaid decided to take an impairment charge of US$ 4.3 million (Baht 135 million) in 2011. Impairing aging assets is general industry practice for drilling companies.
AOD paid Baht 148 million of management fees to Mermaid in 2011 before management was transferred to Seadrill. Since the three jack-up rigs are still under construction, AOD had no revenues and only expenses. TTA recognised Baht 24 million as its share of AOD’s losses.
Ramping up coal production in the Philippines
The coal mining operation in the Philippines is not yet at breakeven level. SERI remains in the ramp up phase. TTA recognised Baht 19 million of losses through our stake in Merton. As production increases in 2012, Merton and SERI are expected to generate positive results.
Infrastructure Group
In Brief:
The Infrastructure Group provided Baht 301 million of profits, down 4% yoy. The decline was due to a combination of adverse incidents that severely affected UMS operations and its efforts to aggressively reduce its 0-5 mm coal inventory, resulting in lower margins. However, Baconco continued its strong performance, while the 20%-owned Baria Serece, contributed Baht 23 million in 2011.
A Year of Challenges for UMS
In 2011, a series of incidents adversely affected UMS’ business. The Samut Sakorn government shut down all coal operators in the province since July 2011, thereby causing SG&A expenses to rise as only one site operated. The severe flooding situation stopped production at the Ayudhya plant from October to early November. Thus, UMS had no production in October and part of November 2011. Thus, UMS is expected to incur a loss in the first quarter of 2012.
Even with the extraordinary incidents, UMS performed better than 2010. Total coal sales volume during 2011 was about 1.4 million tonnes, or 21% higher than 2010. Capacity at the Ayudhya plant was increased to compensate for the shortfall in production at Samut Sakorn before the floods hit.
Of the total sales volume, 734,000 tonnes of both old and new 0-5 mm coal were sold in 2011. About 684,000 tonnes were sold to cement companies, while nearly 50,000 tonnes were used in the granular production. The high proportion of 0-5 mm sales had some impact on margins. SG&A also increased due to coal being trucked from Ayudhya to Samut Sakorn, although some of the increased expenses were passed on to customers. Lastly, Baht 25 million additional income taxes were paid due to misinterpretation of certain tax rules in the past. The additional income taxes were the main reason why UMS contributed less net profit during the year. Otherwise, at the operating profit level, UMS generated healthy normalised EBITDA and EBIT of Baht 274 million and Baht 192 million.
UMS went through an organisational restructuring, took Baht 6 million of reorganisation charges, and reduced headcount by 10% in the head office.
Profit Contribution
FY 10 FY 11
300
250
200
150
350Baht Million
100
312 301
10

68 Thoresen Thai Agencies Public Company Limited
The overall situation is improving. First, the Ayudhya plant is now up and running and should ramp up to 5,500 tonnes per day in January 2012. Second, after multiple discussions with the Samut Sakorn government and other related parties, the Samut Sakorn plant has been allowed to move its 440,000-ton coal stockpile out. After the stockpile removal, UMS can recommence full operations at its Samut Sakorn plant.
Baconco remaining as strong profit contributor and high-return investment
Baconco recorded another profitable year with Baht 2,970 million of revenues and net profits of Baht 219 million in 2011. The total amount for the Baconco acquisition was fully recovered after 22 months of management. Fertiliser demand was strong in Vietnam, driven by high agricultural products prices and the upward trend of raw materials caused wholesalers to increase purchases through August. The rising raw material costs however decreased gross margins. Although Baconco was able to pass through some of the raw material price increases to clients, the gross margins fell to 11.9% of revenues. The normalised EBITDA and EBIT were Baht 283 million and Baht 260 million, respectively.
In 2011, Baconco sold 190,524 tonnes of fertilisers, a 25% yoy growth. Some export opportunities increased production and reduced VND currency exposure.
Warehouse bookings back in the third quarter of 2011 were only at 30% of capacity, as the main warehouse underwent major maintenance during the period. After the re-opening in July, however, the capacity utilisation rose back up to 83% in August. More land was acquired in August for construction of 6,000 square metres of warehouse space by the end of December 2011. These investments are funded by Baconco’s own cash reserves.
Baria Serece making good contributions
Port volume is estimated to be 4.55 million tonnes in 2011. Baria Serece contributed Baht 23 million to TTA’s bottom line through equity income, representing an 8.6% return on investment to date.
Corporate Group
Corporate group’s operations using the Cost Method
TTA’s corporate represents the holding companies (including Soleado Holdings Pte. Ltd. and Athene Holdings Ltd.), which provide support in terms of finance, accounting, human resources, IT, administration, and other services. The following table provides the Company’s statement of income for the financial years as indicated.
10
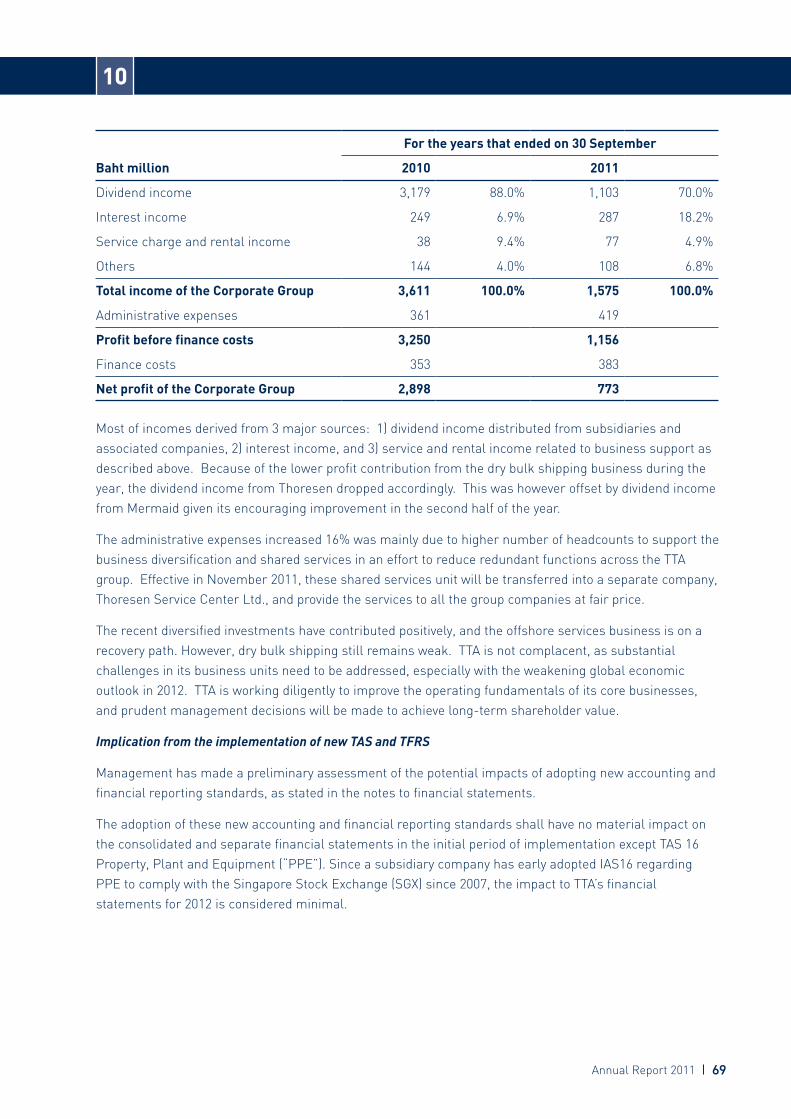
69Annual Report 2011
Baht million
For the years that ended on 30 September
2010 2011
Dividend income 3,179 88.0% 1,103 70.0%
Interest income 249 6.9% 287 18.2%
Service charge and rental income 38 9.4% 77 4.9%
Others 144 4.0% 108 6.8%
Total income of the Corporate Group 3,611 100.0% 1,575 100.0%
Administrative expenses 361 419
Profit before finance costs 3,250 1,156
Finance costs 353 383
Net profit of the Corporate Group 2,898 773
Most of incomes derived from 3 major sources: 1) dividend income distributed from subsidiaries and associated companies, 2) interest income, and 3) service and rental income related to business support as described above. Because of the lower profit contribution from the dry bulk shipping business during the year, the dividend income from Thoresen dropped accordingly. This was however offset by dividend income from Mermaid given its encouraging improvement in the second half of the year.
The administrative expenses increased 16% was mainly due to higher number of headcounts to support the business diversification and shared services in an effort to reduce redundant functions across the TTA group. Effective in November 2011, these shared services unit will be transferred into a separate company, Thoresen Service Center Ltd., and provide the services to all the group companies at fair price.
The recent diversified investments have contributed positively, and the offshore services business is on a recovery path. However, dry bulk shipping still remains weak. TTA is not complacent, as substantial challenges in its business units need to be addressed, especially with the weakening global economic outlook in 2012. TTA is working diligently to improve the operating fundamentals of its core businesses, and prudent management decisions will be made to achieve long-term shareholder value.
Implication from the implementation of new TAS and TFRS
Management has made a preliminary assessment of the potential impacts of adopting new accounting and financial reporting standards, as stated in the notes to financial statements.
The adoption of these new accounting and financial reporting standards shall have no material impact on the consolidated and separate financial statements in the initial period of implementation except TAS 16 Property, Plant and Equipment (“PPE”). Since a subsidiary company has early adopted IAS16 regarding PPE to comply with the Singapore Stock Exchange (SGX) since 2007, the impact to TTA’s financial statements for 2012 is considered minimal.
10

70 Thoresen Thai Agencies Public Company Limited
Statement of the Board of Directors Responsibilities for the
Financial Statements
11
21 December 2011
To the Shareholders of Thoresen Thai Agencies Public Company Limited
The Board of Directors realises the significance of its duties and responsibilities in supervising TTA’s business to ensure good management with integrity and prudence in accordance with laws, detailed objectives, Articles of Association, and resolutions of the shareholders meetings. The Board of Directors protects the benefits of the company and its stakeholders by ensuring that TTA’s financial report contains accurate and full accounting records that reflect its actual financial status and operational results.
The Board of Directors has established the Audit Committee comprising independent directors fully qualified in accordance with the requirements of the Stock Exchange of Thailand to review and ensure accuracy and sufficiency of the financial report, to review the internal control systems including compliance with securities law, regulations of the Stock Exchange of Thailand or laws relating to the business of the company. In this regard, the Audit Committee has already reported its performance to the Board of Directors.
The Board of Directors is of the opinion that the financial statements for the year 2011 of TTA and its subsidiaries, which have been reviewed by the Audit Committee in conjunction with the management, and audited by TTA’s auditor, accurately reflect the financial status and operational results in all material aspects in accordance with generally accepted accounting standards.
Mr. Aswin Kongsiri M.L. Chandchutha Chandratat Chairman of the Board of Directors President & Chief Executive Officer

12
71Annual Report 2011
AUDITOR'S REPORT
To the Shareholders of Thoresen Thai Agencies Public Company Limited
I have audited the accompanying consolidated and company balance sheets as at 30 September2011 and 2010, and the related consolidated and company statements of income, changes inshareholdersí equity, and cash flows for the years then ended of Thoresen Thai Agencies PublicCompany Limited and its subsidiaries, and of Thoresen Thai Agencies Public Company Limited.The Companyís management is responsible for the correctness and completeness of informationin these financial statements. My responsibility is to express an opinion on these financialstatements based on my audits.
I conducted my audits in accordance with generally accepted auditing standards. Thosestandards require that I plan and perform the audit to obtain reasonable assurance aboutwhether the financial statements are free of material misstatement. An audit includes examining,on a test basis, evidence supporting the amounts and disclosures in the financial statements.An audit also includes assessing the accounting principles used and significant estimatesmade by management, as well as evaluating the overall financial statement presentation.I believe that my audits provide a reasonable basis for my opinion.
In my opinion, the consolidated and company financial statements referred to above presentfairly, in all material respects, the consolidated and company financial positions as at 30 September2011 and 2010, and the consolidated and the company results of operations and cash flows forthe years then ended of Thoresen Thai Agencies Public Company Limited and its subsidiaries,and of Thoresen Thai Agencies Public Company Limited, in accordance with generally acceptedaccounting principles.
Kajornkiet AroonpirodkulCertified Public Accountant (Thailand) No. 3445PricewaterhouseCoopers ABAS Ltd.
Bangkok28 November 2011
Auditor’s Report

12
72 Thoresen Thai Agencies Public Company Limited
Thoresen Thai Agencies Public Company Limited
As at 30 September 2011 and 2010
Balance Sheets
Thoresen Thai Agencies Public Company LimitedThoresen Thai Agencies Public Company LimitedThoresen Thai Agencies Public Company LimitedThoresen Thai Agencies Public Company Limited
Balance SheetsBalance SheetsBalance SheetsBalance Sheets
As at 30 September 2011 and 2010As at 30 September 2011 and 2010As at 30 September 2011 and 2010As at 30 September 2011 and 2010
2011201120112011 2010201020102010 2011201120112011 2010201020102010
NotesNotesNotesNotes BahtBahtBahtBaht BahtBahtBahtBaht BahtBahtBahtBaht BahtBahtBahtBaht
AssetsAssetsAssetsAssets
Current assetsCurrent assetsCurrent assetsCurrent assets
Cash and cash equivalents 5 3,797,377,842 8,458,186,441 765,714,754 1,737,995,202
Short-term investments 6 983,931,626 1,956,302,332 291,919,327 892,051,504
Trade accounts receivable, net 7 2,719,102,606 1,652,583,734 - -
Amounts due from related parties 31.2 206,745,484 403,243 434,193,192 120,393,052
Short-term loans to related parties 31.4 - - 5,356,407,461 3,703,287,317
Current portion of long-term
loans to related parties 31.4 34,253,000 4,000,000 174,422,999 163,635,982
Inventories, net 8 2,263,912,692 1,999,580,533 - -
Vessel supplies and spareparts, net 382,179,158 634,896,460 - -
Prepayments 142,632,521 177,507,593 5,754,560 4,838,301
Other current assets, net 9 1,105,631,211 538,523,903 38,396,925 16,427,133
Total current assetsTotal current assetsTotal current assetsTotal current assets 11,635,766,140 15,421,984,239 7,066,809,218 6,638,628,491
Non-current assetsNon-current assetsNon-current assetsNon-current assets
Long-term loans to related parties 31.4 586,030,720 368,315,000 4,746,157,675 4,835,416,407
Investments in subsidiaries, net 10 - - 15,723,960,446 15,863,624,005
Investments in associates 11 3,675,470,002 1,182,453,051 53,581,170 11,213,000
Investment in joint venture 12 63,893,035 54,315,153 8,771,110 8,771,110
Property, plant, and equipment, net 14 26,799,740,883 26,042,041,447 232,278,726 255,706,903
Goodwill, net 13 3,817,459,991 3,834,040,193 - -
Intangible assets, net 15 607,527,231 704,219,713 125,566,204 139,981,854
Other assets, net 16 944,474,112 1,266,094,317 1,676,288 44,231,758
Total non-current assetsTotal non-current assetsTotal non-current assetsTotal non-current assets 36,494,595,974 33,451,478,874 20,891,991,619 21,158,945,037
Total assetsTotal assetsTotal assetsTotal assets 48,130,362,114 48,873,463,113 27,958,800,837 27,797,573,528
For Director ……………………………………………………….
The accompanying notes are an integral part of these consolidated and company financial statements.
CompanyCompanyCompanyCompanyConsolidatedConsolidatedConsolidatedConsolidated
2
2011BahtNotes
2010Baht
2011Baht
2010Baht
Consolidated Company
The accompanying notes are an integral part of these consolidated and company financial statements.

12
73Annual Report 2011
Thoresen Thai Agencies Public Company Limited
As at 30 September 2011 and 2010
Balance Sheets
Thoresen Thai Agencies Public Company LimitedThoresen Thai Agencies Public Company LimitedThoresen Thai Agencies Public Company LimitedThoresen Thai Agencies Public Company Limited
Balance SheetsBalance SheetsBalance SheetsBalance Sheets
As at 30 September 2011 and 2010As at 30 September 2011 and 2010As at 30 September 2011 and 2010As at 30 September 2011 and 2010
2011201120112011 2010201020102010 2011201120112011 2010201020102010
NotesNotesNotesNotes BahtBahtBahtBaht BahtBahtBahtBaht BahtBahtBahtBaht BahtBahtBahtBaht
Liabilities and shareholders’ equityLiabilities and shareholders’ equityLiabilities and shareholders’ equityLiabilities and shareholders’ equity
Current liabilitiesCurrent liabilitiesCurrent liabilitiesCurrent liabilities
Bank overdrafts 17 2,292,200 5,544,249 - -
Short-term loans 18 1,410,276,698 1,605,982,823 - -
Trade accounts payable - others 838,129,723 923,547,922 30,474,311 22,561,685
Amounts due to related parties 31.3 7,173,391 9,582,861 19,271,033 2,054,158
Other accounts payable 139,149,422 143,840,557 1,238,861 8,330,058
Advances from customers 375,787,029 424,951,640 - -
Short-term loans from
related parties 31.4 4,500,000 7,500,000 4,367,527,094 3,384,762,234
Current portion of bonds 22 1,205,740,748 1,047,259,096 1,205,740,748 1,047,259,096
Current portion of long-term loans 19 1,062,214,742 1,106,259,935 - -
Current portion of finance
lease liabilities 20 4,271,792 24,150,856 - -
Current portion of employee
benefit obligations 21 61,030,823 66,150,976 - -
Accrued income taxes 151,281,872 132,389,433 - -
Accrued expenses 887,365,116 930,346,308 55,504,946 51,652,742
Other current liabilities 268,757,921 373,207,154 8,563,585 14,361,794
Total current liabilitiesTotal current liabilitiesTotal current liabilitiesTotal current liabilities 6,417,971,477 6,800,713,810 5,688,320,578 4,530,981,767
Non-current liabilitiesNon-current liabilitiesNon-current liabilitiesNon-current liabilities
Bonds, net 22 3,994,284,092 5,207,264,541 3,994,284,092 5,207,264,541
Long-term loans 19 6,693,963,469 5,220,979,022 - -
Finance lease liabilities 20 3,879,778 12,957,004 - -
Employee benefit obligations 21 106,321,105 99,406,889 16,366,550 11,692,726
Total non-current liabilitiesTotal non-current liabilitiesTotal non-current liabilitiesTotal non-current liabilities 10,798,448,444 10,540,607,456 4,010,650,642 5,218,957,267
Total liabilitiesTotal liabilitiesTotal liabilitiesTotal liabilities 17,216,419,921 17,341,321,266 9,698,971,220 9,749,939,034
The accompanying notes are an integral part of these consolidated and company financial statements.
ConsolidatedConsolidatedConsolidatedConsolidated CompanyCompanyCompanyCompany
3
2011BahtNotes
2010Baht
2011Baht
2010Baht
Consolidated Company
The accompanying notes are an integral part of these consolidated and company financial statements.

12
74 Thoresen Thai Agencies Public Company Limited
Thoresen Thai Agencies Public Company Limited
As at 30 September 2011 and 2010
Balance SheetsThoresen Thai Agencies Public Company LimitedThoresen Thai Agencies Public Company LimitedThoresen Thai Agencies Public Company LimitedThoresen Thai Agencies Public Company Limited
Balance SheetsBalance SheetsBalance SheetsBalance Sheets
As at 30 September 2011 and 2010As at 30 September 2011 and 2010As at 30 September 2011 and 2010As at 30 September 2011 and 2010
2011201120112011 2010201020102010 2011201120112011 2010201020102010
NotesNotesNotesNotes BahtBahtBahtBaht BahtBahtBahtBaht BahtBahtBahtBaht BahtBahtBahtBaht
Liabilities and shareholders’ equityLiabilities and shareholders’ equityLiabilities and shareholders’ equityLiabilities and shareholders’ equity (Continued)
Shareholders’ equityShareholders’ equityShareholders’ equityShareholders’ equity
Share capital
Registered share capital
- ordinary shares
833,004,413 shares of par Baht
1 each (2010: 933,004,413
shares of par Baht 1 each) 23 833,004,413 933,004,413 833,004,413 933,004,413
Issued and paid-up share capital
- ordinary shares
708,004,413 shares of paid-up Baht
1 each (2010: 708,004,413
shares of paid-up Baht 1 each) 708,004,413 708,004,413 708,004,413 708,004,413
Premium on ordinary shares 23 1,540,410,208 1,540,410,208 1,540,410,208 1,540,410,208
Capital reserves - adjustment arising
under pooling of interest (50,029,892) (50,029,892) - -
Excess of carrying value over purchase
consideration of acquisition
under common control 10 - - - 124,542,422
Premium on ordinary shares
in subsidiary 2,564,206,648 2,564,206,648 - -
Translation adjustments for investments
in overseas subsidiaries (781,493,331) (901,356,705) - -
Fair value reserves 6 (4,716,647) 50,971,727 (10,696,309) 12,916,568
Retained earnings
Appropriated - legal reserves 28 93,500,000 93,500,000 93,500,000 93,500,000
Unappropriated 21,490,998,606 21,888,632,476 15,928,611,305 15,568,260,883
Total parent’s shareholders’ equityTotal parent’s shareholders’ equityTotal parent’s shareholders’ equityTotal parent’s shareholders’ equity 25,560,880,005 25,894,338,875 18,259,829,617 18,047,634,494
Minority interests 5,353,062,188 5,637,802,972 - -
Total shareholders’ equityTotal shareholders’ equityTotal shareholders’ equityTotal shareholders’ equity 30,913,942,193 31,532,141,847 18,259,829,617 18,047,634,494
Total liabilities and shareholders’ Total liabilities and shareholders’ Total liabilities and shareholders’ Total liabilities and shareholders’
equityequityequityequity 48,130,362,114 48,873,463,113 27,958,800,837 27,797,573,528
The accompanying notes are an integral part of these consolidated and company financial statements.
ConsolidatedConsolidatedConsolidatedConsolidated CompanyCompanyCompanyCompany
4
2011BahtNotes
2010Baht
2011Baht
2010Baht
Consolidated Company
The accompanying notes are an integral part of these consolidated and company financial statements.

12
75Annual Report 2011
Thoresen Thai Agencies Public Company Limited
For the years that ended on 30 September 2011 and 2010
Statements of Income
Thoresen Thai Agencies Public Company LimitedThoresen Thai Agencies Public Company LimitedThoresen Thai Agencies Public Company LimitedThoresen Thai Agencies Public Company Limited
Statements of Income Statements of Income Statements of Income Statements of Income
For the years that ended on 30 September 2011 and 2010For the years that ended on 30 September 2011 and 2010For the years that ended on 30 September 2011 and 2010For the years that ended on 30 September 2011 and 2010
2011201120112011 2010201020102010 2011201120112011 2010201020102010
NotesNotesNotesNotes BahtBahtBahtBaht BahtBahtBahtBaht BahtBahtBahtBaht BahtBahtBahtBaht
RevenuesRevenuesRevenuesRevenues
Revenues from services
Freight charges 5,430,099,724 9,272,551,048 - -
Offshore service income 5,542,740,233 3,476,365,397 - -
Service and commission income 342,862,854 503,454,116 - -
Revenues from sales 6,249,367,256 4,667,088,201 - -
Total revenuesTotal revenuesTotal revenuesTotal revenues 17,565,070,067 17,919,458,762 - -
CostsCostsCostsCosts
Cost of providing services
Vessel operating expenses 5,211,091,122 7,932,525,157 - -
Offshore service expenses 4,785,936,590 3,230,503,176 - -
Service and commission expenses 119,281,887 126,244,833 - -
Cost of sales 5,370,879,415 3,935,385,938 - -
Total costsTotal costsTotal costsTotal costs 15,487,189,014 15,224,659,104 - -
Gross profitsGross profitsGross profitsGross profits 2,077,881,053 2,694,799,658 - -
Other operating income 30 1,660,281,745 1,110,308,679 1,575,193,251 3,611,426,495
Profits before expensesProfits before expensesProfits before expensesProfits before expenses 3,738,162,798 3,805,108,337 1,575,193,251 3,611,426,495
Selling expenses 265,972,503 227,579,306 - -
Administrative expenses 2,254,146,235 1,965,904,892 322,611,395 278,132,277
Management and directors remuneration 182,886,026 167,007,786 96,100,057 82,825,000
Total expensesTotal expensesTotal expensesTotal expenses 2,703,004,764 2,360,491,984 418,711,452 360,957,277
Operating profitsOperating profitsOperating profitsOperating profits 25 1,035,158,034 1,444,616,353 1,156,481,799 3,250,469,218
Share of profits in associates
and joint venture 11, 12 110,228,847 80,305,584 - -
Profits before financial costs Profits before financial costs Profits before financial costs Profits before financial costs
and income taxesand income taxesand income taxesand income taxes 1,145,386,881 1,524,921,937 1,156,481,799 3,250,469,218
Finance costs (733,938,058) (602,366,235) (383,566,563) (352,682,105)
Profits before income taxesProfits before income taxesProfits before income taxesProfits before income taxes 411,448,823 922,555,702 772,915,236 2,897,787,113
Income taxes 26 (342,276,902) (255,847,516) - -
Net profits for the yearNet profits for the yearNet profits for the yearNet profits for the year 69,171,921 666,708,186 772,915,236 2,897,787,113
Attributable to:Attributable to:Attributable to:Attributable to:
Shareholders of the parent 139,473,366 795,573,570 772,915,236 2,897,787,113
Minority interests (70,301,445) (128,865,384) - -
69,171,921 666,708,186 772,915,236 2,897,787,113
Basic earnings per share for profits Basic earnings per share for profits Basic earnings per share for profits Basic earnings per share for profits
attributable to the shareholders of attributable to the shareholders of attributable to the shareholders of attributable to the shareholders of
the parentthe parentthe parentthe parent BahtBahtBahtBaht BahtBahtBahtBaht BahtBahtBahtBaht BahtBahtBahtBaht
Basic earnings per share 27 0.20 1.12 1.09 4.09
The accompanying notes are an integral part of these consolidated and company financial statements.
ConsolidatedConsolidatedConsolidatedConsolidated CompanyCompanyCompanyCompany
5
2011BahtNotes
2010Baht
2011Baht
2010Baht
Consolidated Company
The accompanying notes are an integral part of these consolidated and company financial statements.

12
76 Thoresen Thai Agencies Public Company Limited
Th
ore
sen
Th
ai A
ge
nci
es
Pu
bli
c C
om
pa
ny
Lim
ite
d
Th
ore
sen
Th
ai A
ge
nci
es
Pu
bli
c C
om
pa
ny
Lim
ite
d
Th
ore
sen
Th
ai A
ge
nci
es
Pu
bli
c C
om
pa
ny
Lim
ite
d
Th
ore
sen
Th
ai A
ge
nci
es
Pu
bli
c C
om
pa
ny
Lim
ite
d
Sta
tem
en
ts o
f C
ha
ng
es
in S
ha
reh
old
ers
’ Eq
uit
yS
tate
me
nts
of
Ch
an
ge
s in
Sh
are
ho
lde
rs’ E
qu
ity
Sta
tem
en
ts o
f C
ha
ng
es
in S
ha
reh
old
ers
’ Eq
uit
yS
tate
me
nts
of
Ch
an
ge
s in
Sh
are
ho
lde
rs’ E
qu
ity
Fo
r th
e y
ea
rs t
ha
t e
nd
ed
on
30
Se
pte
mb
er
2011
an
d 2
010
Fo
r th
e y
ea
rs t
ha
t e
nd
ed
on
30
Se
pte
mb
er
2011
an
d 2
010
Fo
r th
e y
ea
rs t
ha
t e
nd
ed
on
30
Se
pte
mb
er
2011
an
d 2
010
Fo
r th
e y
ea
rs t
ha
t e
nd
ed
on
30
Se
pte
mb
er
2011
an
d 2
010
Ba
ht
Ba
ht
Ba
ht
Ba
ht
Ca
pit
al
Ca
pit
al
Ca
pit
al
Ca
pit
al
rese
rve
s -
rese
rve
s -
rese
rve
s -
rese
rve
s -
Tra
nsl
ati
on
Tra
nsl
ati
on
Tra
nsl
ati
on
Tra
nsl
ati
on
ad
just
me
nt
ad
just
me
nt
ad
just
me
nt
ad
just
me
nt
ad
just
me
nts
ad
just
me
nts
ad
just
me
nts
ad
just
me
nts
Issu
ed
an
dIs
sue
d a
nd
Issu
ed
an
dIs
sue
d a
nd
Pre
miu
m
Pre
miu
m
Pre
miu
m
Pre
miu
m
ari
sin
g u
nd
er
ari
sin
g u
nd
er
ari
sin
g u
nd
er
ari
sin
g u
nd
er
Pre
miu
m o
nP
rem
ium
on
Pre
miu
m o
nP
rem
ium
on
for
inve
stm
en
tsfo
r in
vest
me
nts
for
inve
stm
en
tsfo
r in
vest
me
nts
pa
id-u
p s
ha
rep
aid
-up
sh
are
pa
id-u
p s
ha
rep
aid
-up
sh
are
on
ord
ina
ryo
n o
rdin
ary
on
ord
ina
ryo
n o
rdin
ary
po
oli
ng
of
po
oli
ng
of
po
oli
ng
of
po
oli
ng
of
ord
ina
ry s
ha
res
ord
ina
ry s
ha
res
ord
ina
ry s
ha
res
ord
ina
ry s
ha
res
in o
vers
ea
sin
ove
rse
as
in o
vers
ea
sin
ove
rse
as
Fa
ir v
alu
eF
air
va
lue
Fa
ir v
alu
eF
air
va
lue
Ap
pro
pri
ate
d -
Ap
pro
pri
ate
d -
Ap
pro
pri
ate
d -
Ap
pro
pri
ate
d -
Min
ori
tyM
ino
rity
Min
ori
tyM
ino
rity
No
tes
No
tes
No
tes
No
tes
ca
pit
al
ca
pit
al
ca
pit
al
ca
pit
al
sha
res
sha
res
sha
res
sha
res
inte
rest
inte
rest
inte
rest
inte
rest
in s
ub
sid
iary
in s
ub
sid
iary
in s
ub
sid
iary
in s
ub
sid
iary
sub
sid
iari
es
sub
sid
iari
es
sub
sid
iari
es
sub
sid
iari
es
rese
rve
sre
serv
es
rese
rve
sre
serv
es
le
ga
l re
serv
es
le
ga
l re
serv
es
le
ga
l re
serv
es
le
ga
l re
serv
es
Un
ap
pro
pri
ate
dU
na
pp
rop
ria
ted
Un
ap
pro
pri
ate
dU
na
pp
rop
ria
ted
inte
rest
sin
tere
sts
inte
rest
sin
tere
sts
To
tal
To
tal
To
tal
To
tal
Be
gin
nin
g b
ala
nce
as
at
1 O
cto
be
r 20
10
Be
gin
nin
g b
ala
nce
as
at
1 O
cto
be
r 20
10
Be
gin
nin
g b
ala
nce
as
at
1 O
cto
be
r 20
10
Be
gin
nin
g b
ala
nce
as
at
1 O
cto
be
r 20
10
708,
004,
413
1,54
0,41
0,20
8(5
0,02
9,89
2)2,
564,
206,
648
(901
,356
,705
)50
,971
,727
93,5
00,0
0021
,888
,632
,476
5,63
7,80
2,97
231
,532
,141
,847
Tra
nsl
ati
on
ad
just
me
nts
fo
r
inve
stm
en
ts in
ove
rse
as
sub
sid
iari
es
--
--
119,
863,
374
--
-30
,711
,340
150,
574,
714
Ad
dit
ion
al
min
ori
ty in
tere
sts
--
--
--
--
12,8
63,3
7512
,863
,375
De
con
soli
da
tio
n o
f su
bsi
dia
ry10
--
--
--
--
(62,
940,
704)
(62,
940,
704)
Fa
ir v
alu
e r
ese
rve
s6
--
--
-(5
5,68
8,37
4)-
--
(55,
688,
374)
Ne
t p
rofi
ts (
loss
es)
fo
r th
e y
ea
r-
--
--
--
139,
473,
366
(70,
301,
445)
69,1
71,9
21
Div
ide
nd
s p
aid
29-
--
--
--
(537
,107
,236
)(1
95,0
73,3
50)
(732
,180
,586
)
En
din
g b
ala
nce
as
at
30 S
ep
tem
be
r 20
11
En
din
g b
ala
nce
as
at
30 S
ep
tem
be
r 20
11
En
din
g b
ala
nce
as
at
30 S
ep
tem
be
r 20
11
En
din
g b
ala
nce
as
at
30 S
ep
tem
be
r 20
11
708,
004,
413
1,54
0,41
0,20
8(5
0,02
9,89
2)2,
564,
206,
648
(781
,493
,331
)(4
,716
,647
)93
,500
,000
21,4
90,9
98,6
065,
353,
062,
188
30,9
13,9
42,1
93
Be
gin
nin
g b
ala
nce
as
at
1 O
cto
be
r 20
09B
eg
inn
ing
ba
lan
ce a
s a
t 1
Oct
ob
er
2009
Be
gin
nin
g b
ala
nce
as
at
1 O
cto
be
r 20
09B
eg
inn
ing
ba
lan
ce a
s a
t 1
Oct
ob
er
2009
708,
004,
413
1,54
0,41
0,20
8(5
0,02
9,89
2)2,
611,
057,
091
(38,
150,
433)
25,6
30,1
2493
,500
,000
21,4
72,4
78,4
424,
728,
540,
160
31,0
91,4
40,1
13
Tra
nsl
ati
on
ad
just
me
nts
fo
r
inve
stm
en
ts in
ove
rse
as
sub
sid
iari
es
--
--
(863
,206
,272
)-
--
(108
,012
,507
)(9
71,2
18,7
79)
Acq
uis
itio
n o
f su
bsi
dia
ry-
--
--
--
-1,
701,
523,
192
1,70
1,52
3,19
2
Dis
po
sal
of
sub
sid
iari
es
--
--
--
--
(564
,664
,802
)(5
64,6
64,8
02)
Exp
en
ses
rela
tin
g t
o t
he
rig
hts
issu
e
of
a s
ub
sid
iary
--
-(4
6,85
0,44
3)-
--
-9,
282,
313
(37,
568,
130)
Fa
ir v
alu
e r
ese
rve
s6
--
--
-25
,341
,603
--
-25
,341
,603
Ne
t p
rofi
ts (
loss
es)
fo
r th
e y
ea
r-
--
--
--
795,
573,
570
(128
,865
,384
)66
6,70
8,18
6
Div
ide
nd
s p
aid
29-
--
--
--
(379
,419
,536
)-
(379
,419
,536
)
En
din
g b
ala
nce
as
at
30 S
ep
tem
be
r 20
10E
nd
ing
ba
lan
ce a
s a
t 30
Se
pte
mb
er
2010
En
din
g b
ala
nce
as
at
30 S
ep
tem
be
r 20
10E
nd
ing
ba
lan
ce a
s a
t 30
Se
pte
mb
er
2010
708,
004,
413
1,54
0,41
0,20
8(5
0,02
9,89
2)2,
564,
206,
648
(901
,356
,705
)50
,971
,727
93,5
00,0
0021
,888
,632
,476
5,63
7,80
2,97
231
,532
,141
,847
Th
e a
cco
mp
an
yin
g n
ote
s a
re a
n in
teg
ral
pa
rt o
f th
ese
co
nso
lid
ate
d a
nd
co
mp
an
y fi
na
nci
al
sta
tem
en
ts.
Re
tain
ed
ea
rnin
gs
Re
tain
ed
ea
rnin
gs
Re
tain
ed
ea
rnin
gs
Re
tain
ed
ea
rnin
gs
Co
nso
lid
ate
d
Co
nso
lid
ate
d
Co
nso
lid
ate
d
Co
nso
lid
ate
d
6
Stat
emen
ts o
f C
han
ges
in S
har
ehol
ders
’ Equ
ity
Thor
esen
Thai
Age
nci
es P
ublic
Com
pan
y Li
mited
For
the
year
s th
at e
nded
on 3
0 Se
pte
mber
201
1 an
d 2
010
The
acco
mpan
ying n
otes
are
an in
tegra
l par
t of
thes
e co
nso
lidat
ed a
nd c
ompan
y finan
cial
sta
tem
ents
.

12
77Annual Report 2011
Th
ore
sen
Th
ai A
ge
nci
es
Pu
bli
c C
om
pa
ny
Lim
ite
d
Th
ore
sen
Th
ai A
ge
nci
es
Pu
bli
c C
om
pa
ny
Lim
ite
d
Th
ore
sen
Th
ai A
ge
nci
es
Pu
bli
c C
om
pa
ny
Lim
ite
d
Th
ore
sen
Th
ai A
ge
nci
es
Pu
bli
c C
om
pa
ny
Lim
ite
d
Sta
tem
en
ts o
f C
ha
ng
es
in S
ha
reh
old
ers
’ Eq
uit
yS
tate
me
nts
of
Ch
an
ge
s in
Sh
are
ho
lde
rs’ E
qu
ity
Sta
tem
en
ts o
f C
ha
ng
es
in S
ha
reh
old
ers
’ Eq
uit
yS
tate
me
nts
of
Ch
an
ge
s in
Sh
are
ho
lde
rs’ E
qu
ity
Fo
r th
e y
ea
rs t
ha
t e
nd
ed
on
30
Se
pte
mb
er
2011
an
d 2
010
Fo
r th
e y
ea
rs t
ha
t e
nd
ed
on
30
Se
pte
mb
er
2011
an
d 2
010
Fo
r th
e y
ea
rs t
ha
t e
nd
ed
on
30
Se
pte
mb
er
2011
an
d 2
010
Fo
r th
e y
ea
rs t
ha
t e
nd
ed
on
30
Se
pte
mb
er
2011
an
d 2
010
Ba
ht
Ba
ht
Ba
ht
Ba
ht
Exc
ess
of
carr
yin
gE
xce
ss o
f ca
rryi
ng
Exc
ess
of
carr
yin
gE
xce
ss o
f ca
rryi
ng
valu
e o
ver
pu
rch
ase
valu
e o
ver
pu
rch
ase
valu
e o
ver
pu
rch
ase
valu
e o
ver
pu
rch
ase
Issu
ed
an
dIs
sue
d a
nd
Issu
ed
an
dIs
sue
d a
nd
Pre
miu
mP
rem
ium
Pre
miu
mP
rem
ium
con
sid
era
tio
n o
fco
nsi
de
rati
on
of
con
sid
era
tio
n o
fco
nsi
de
rati
on
of
Ap
pro
pri
ate
d -
Ap
pro
pri
ate
d -
Ap
pro
pri
ate
d -
Ap
pro
pri
ate
d -
pa
id-u
p s
ha
rep
aid
-up
sh
are
pa
id-u
p s
ha
rep
aid
-up
sh
are
on
ord
ina
ryo
n o
rdin
ary
on
ord
ina
ryo
n o
rdin
ary
acq
uis
itio
n u
nd
er
acq
uis
itio
n u
nd
er
acq
uis
itio
n u
nd
er
acq
uis
itio
n u
nd
er
Fa
ir v
alu
eF
air
va
lue
Fa
ir v
alu
eF
air
va
lue
leg
al
leg
al
leg
al
leg
al
No
tes
No
tes
No
tes
No
tes
ca
pit
al
ca
pit
al
ca
pit
al
ca
pit
al
sha
res
sha
res
sha
res
sha
res
com
mo
n c
on
tro
lco
mm
on
co
ntr
ol
com
mo
n c
on
tro
lco
mm
on
co
ntr
ol
rese
rve
sre
serv
es
rese
rve
sre
serv
es
re
serv
es
re
serv
es
re
serv
es
re
serv
es
Un
ap
pro
pri
ate
dU
na
pp
rop
ria
ted
Un
ap
pro
pri
ate
dU
na
pp
rop
ria
ted
To
tal
To
tal
To
tal
To
tal
Be
gin
nin
g b
ala
nce
as
at
1 O
cto
be
r 20
10B
eg
inn
ing
ba
lan
ce a
s a
t 1
Oct
ob
er
2010
Be
gin
nin
g b
ala
nce
as
at
1 O
cto
be
r 20
10B
eg
inn
ing
ba
lan
ce a
s a
t 1
Oct
ob
er
2010
708,
004,
413
1,54
0,41
0,20
812
4,54
2,42
212
,916
,568
93,5
00,0
0015
,568
,260
,883
18,0
47,6
34,4
94
Dis
po
sal
of
a s
ub
sid
iary
10-
-(1
24,5
42,4
22)
--
124,
542,
422
-
Fa
ir v
alu
e r
ese
rve
s6
--
-(2
3,61
2,87
7)-
-(2
3,61
2,87
7)
Ne
t p
rofi
ts f
or
the
ye
ar
--
--
-77
2,91
5,23
677
2,91
5,23
6
Div
ide
nd
s p
aid
29
--
--
-(5
37,1
07,2
36)
(537
,107
,236
)
En
din
g b
ala
nce
as
at
30 S
ep
tem
be
r 20
11E
nd
ing
ba
lan
ce a
s a
t 30
Se
pte
mb
er
2011
En
din
g b
ala
nce
as
at
30 S
ep
tem
be
r 20
11E
nd
ing
ba
lan
ce a
s a
t 30
Se
pte
mb
er
2011
708,
004,
413
1,54
0,41
0,20
8-
(10,
696,
309)
93,5
00,0
0015
,928
,611
,305
18,2
59,8
29,6
17
Be
gin
nin
g b
ala
nce
as
at
1 O
cto
be
r 20
09B
eg
inn
ing
ba
lan
ce a
s a
t 1
Oct
ob
er
2009
Be
gin
nin
g b
ala
nce
as
at
1 O
cto
be
r 20
09B
eg
inn
ing
ba
lan
ce a
s a
t 1
Oct
ob
er
2009
708,
004,
413
1,54
0,41
0,20
812
4,54
2,42
26,
387,
091
93,5
00,0
0013
,049
,893
,306
15,5
22,7
37,4
40
Fa
ir v
alu
e r
ese
rve
s6
--
-6,
529,
477
--
6,52
9,47
7
Ne
t p
rofi
ts f
or
the
ye
ar
--
--
-2,
897,
787,
113
2,89
7,78
7,11
3
Div
ide
nd
s p
aid
29-
--
--
(379
,419
,536
)(3
79,4
19,5
36)
En
din
g b
ala
nce
as
at
30 S
ep
tem
be
r 20
10E
nd
ing
ba
lan
ce a
s a
t 30
Se
pte
mb
er
2010
En
din
g b
ala
nce
as
at
30 S
ep
tem
be
r 20
10E
nd
ing
ba
lan
ce a
s a
t 30
Se
pte
mb
er
2010
708,
004,
413
1,54
0,41
0,20
812
4,54
2,42
212
,916
,568
93,5
00,0
0015
,568
,260
,883
18,0
47,6
34,4
94
Th
e a
cco
mp
an
yin
g n
ote
s a
re a
n in
teg
ral
pa
rt o
f th
ese
co
nso
lid
ate
d a
nd
co
mp
an
y fi
na
nci
al
sta
tem
en
ts.
Re
tain
ed
ea
rnin
gs
Re
tain
ed
ea
rnin
gs
Re
tain
ed
ea
rnin
gs
Re
tain
ed
ea
rnin
gs
Co
mp
an
yC
om
pa
ny
Co
mp
an
yC
om
pa
ny
7
Stat
emen
ts o
f C
han
ges
in S
har
ehol
ders
’ Equ
ity
Thor
esen
Thai
Age
nci
es P
ublic
Com
pan
y Li
mited
For
the
year
s th
at e
nded
on 3
0 Se
pte
mber
201
1 an
d 2
010
The
acco
mpan
ying n
otes
are
an in
tegra
l par
t of
thes
e co
nso
lidat
ed a
nd c
ompan
y finan
cial
sta
tem
ents
.

12
78 Thoresen Thai Agencies Public Company Limited
Statements of Cash Flows
Thoresen Thai Agencies Public Company Limited
For the years that ended on 30 September 2011 and 2010
Thoresen Thai Agencies Public Company Limited Thoresen Thai Agencies Public Company Limited Thoresen Thai Agencies Public Company Limited Thoresen Thai Agencies Public Company Limited
Statements of Cash FlowsStatements of Cash FlowsStatements of Cash FlowsStatements of Cash Flows
For the years that ended on 30 September 2011 and 2010For the years that ended on 30 September 2011 and 2010For the years that ended on 30 September 2011 and 2010For the years that ended on 30 September 2011 and 2010
2011201120112011 2010201020102010 2011201120112011 2010201020102010
NotesNotesNotesNotes BahtBahtBahtBaht BahtBahtBahtBaht BahtBahtBahtBaht BahtBahtBahtBaht
Net cash receipts (payments) from operatingNet cash receipts (payments) from operatingNet cash receipts (payments) from operatingNet cash receipts (payments) from operating
activitiesactivitiesactivitiesactivities 24 144,991,642 1,652,497,878 (446,668,440) (414,363,785)
Cash flows from investing activitiesCash flows from investing activitiesCash flows from investing activitiesCash flows from investing activities
Purchases of property, plant, and equipment
and intangible assets (4,122,402,443) (8,356,001,501) (26,850,660) (100,923,784)
Payments for dry-docking (303,666,459) (255,322,174) - -
Payments for short-term loans to
related parties - - (6,581,146,963) (4,448,129,219)
Payments for long-term loans to
related parties 31.4 (232,062,810) (390,668,400) - (5,045,796,970)
Payments for investments in subsidiaries
and associates 10,11 (2,376,517,691) (5,301,227,532) (5,635,000) (1,333,997,513)
Dividends received from short-term investments 4,021,900 11,914,175 4,021,900 3,775,250
Dividends received from subsidiaries 10 - - 580,821,718 973,362,320
Dividends received from associates 11 33,924,374 - - -
Dividends received from joint venture 12 6,726,657 7,822,268 6,726,657 7,822,268
Proceeds from sales of property, plant, and
equipment and intangible assets 2,199,247,464 1,386,982,616 66,233 2,103
Net proceeds (payments) from short-term investments 797,916,029 (869,432,924) 579,147,895 (536,974,299)
Proceeds from returns of capital from subsidiaries
and sales of investments in subsidiaries 10 33,480,000 2,135,049,364 33,480,000 -
Proceeds from sales of investments
in associates - 743,780,794 - -
Proceeds from settlement of short-term loans
to related parties - - 5,021,849,798 2,270,636,949
Proceeds from settlement of long-term loans
to related parties 31.4 4,000,000 4,000,000 102,622,182 553,669,756
Net cash payments from investing activitiesNet cash payments from investing activitiesNet cash payments from investing activitiesNet cash payments from investing activities (3,955,332,979) (10,883,103,314) (284,896,240) (7,656,553,139)
Cash flows from financing activitiesCash flows from financing activitiesCash flows from financing activitiesCash flows from financing activities
Proceeds from short-term loans from
related parties - - 1,560,431,975 5,238,970,246
Proceeds from long-term loans from financial
institutions 19 4,210,109,288 6,684,969,790 - 2,601,528,180
Proceeds from Thai Baht bonds 22 - 4,000,000,000 - 4,000,000,000
Proceeds from minorities for issuance of
new shares in subsidiaries 12,863,375 1,568,987,479 - -
Net proceeds (repayments) of short-term loans
from financial institutions (192,742,036) 147,251,345 - -
Repayments of short-term loans from
related parties (3,000,000) - (104,135,537) (2,541,340,860)
Repayments of long-term loans and
finance lease liabilities (2,985,618,702) (3,243,967,332) - (2,581,332,739)
Payments for arrangement fee of
Thai Baht bonds 22 - (7,243,900) - (7,243,900)
Payments for convertible bond redemption 22 (1,194,287,799) (1,162,455,140) (1,194,287,799) (1,162,455,140)
Payments for convertible bond cancellation 22 - (358,293,277) - (358,293,277)
Dilution in share premium in a subsidiary - (46,850,443) - -
Dividends paid from a subsidiary to minorities (195,073,350) - - -
Dividends paid to shareholders 29 (537,143,446) (379,475,828) (537,143,446) (379,475,828)
Net cash receipts (payments) from financing Net cash receipts (payments) from financing Net cash receipts (payments) from financing Net cash receipts (payments) from financing
activitiesactivitiesactivitiesactivities (884,892,670) 7,202,922,694 (275,134,807) 4,810,356,682
The accompanying notes are an integral part of these consolidated and company financial statements.
ConsolidatedConsolidatedConsolidatedConsolidated CompanyCompanyCompanyCompany
8
2011BahtNotes
2010Baht
2011Baht
2010Baht
Consolidated Company
The accompanying notes are an integral part of these consolidated and company financial statements.

12
79Annual Report 2011
Statements of Cash Flows
Thoresen Thai Agencies Public Company Limited
For the years that ended on 30 September 2011 and 2010
The accompanying notes are an integral part of these consolidated and company financial statements.
Thoresen Thai Agencies Public Company Limited Thoresen Thai Agencies Public Company Limited Thoresen Thai Agencies Public Company Limited Thoresen Thai Agencies Public Company Limited
Statements of Cash FlowsStatements of Cash FlowsStatements of Cash FlowsStatements of Cash Flows
For the years that ended on 30 September 2011 and 2010For the years that ended on 30 September 2011 and 2010For the years that ended on 30 September 2011 and 2010For the years that ended on 30 September 2011 and 2010
2011201120112011 2010201020102010 2011201120112011 2010201020102010
NotesNotesNotesNotes BahtBahtBahtBaht BahtBahtBahtBaht BahtBahtBahtBaht BahtBahtBahtBaht
Net decrease in cash and cash equivalentsNet decrease in cash and cash equivalentsNet decrease in cash and cash equivalentsNet decrease in cash and cash equivalents (4,695,234,007) (2,027,682,742) (1,006,699,487) (3,260,560,242)
Cash and cash equivalents at the beginning of the year 8,452,642,192 10,718,892,581 1,737,995,202 5,094,123,584
3,757,408,185 8,691,209,839 731,295,715 1,833,563,342
Effect of deconsolidation 10 (36,652,929) - - -
Effect of exchange rate changes on cash 74,330,386 (238,567,647) 34,419,039 (95,568,140)
Cash and cash equivalents at the end of the year 3,795,085,642 8,452,642,192 765,714,754 1,737,995,202
Cash and cash equivalents as at 30 September comprise:Cash and cash equivalents as at 30 September comprise:Cash and cash equivalents as at 30 September comprise:Cash and cash equivalents as at 30 September comprise:
Cash and cash equivalents 5 3,797,377,842 8,458,186,441 765,714,754 1,737,995,202
Bank overdrafts (2,292,200) (5,544,249) - -
3,795,085,642 8,452,642,192 765,714,754 1,737,995,202
Non-cash transactionsNon-cash transactionsNon-cash transactionsNon-cash transactions
Significant non-cash transactions during the years that ended on 30 September 2011 and 2010 are as follows:
2011201120112011 2010201020102010 2011201120112011 2010201020102010
BahtBahtBahtBaht BahtBahtBahtBaht BahtBahtBahtBaht BahtBahtBahtBaht
Unpaid liabilities from dry-docking 8,574,850 26,716,899 - -
Unpaid liabilities from purchase of fixed assets
and intangible assets 21,834,356 37,506,361 1,238,862 11,221,558
Unpaid liabilities from finance lease agreements - 1,835,461 - -
Dividend receivables from an associates 54,914,893 21,818,442 - -
Dividend income offsetting with short-term
loans from subsidiaries - - 511,002,773 2,193,897,549
Dividend payables 4,078,865 4,115,075 4,078,865 4,115,075
The accompanying notes are an integral part of these consolidated and company financial statements.
ConsolidatedConsolidatedConsolidatedConsolidated CompanyCompanyCompanyCompany
ConsolidatedConsolidatedConsolidatedConsolidated CompanyCompanyCompanyCompany
9
2011BahtNotes
2010Baht
2011Baht
2010Baht
Consolidated Company

12
80 Thoresen Thai Agencies Public Company Limited
Thoresen Thai Agencies Public Company LimitedNotes to Consolidated and Company Financial StatementsFor the years that ended on 30 September 2011 and 2010
10
1 General information
Thoresen Thai Agencies Public Company Limited (the ì Companyî ) is a public limited company and isincorporated in Thailand. The address of its registered office is as follows:
26/26-27 Orakarn Building, 8th FloorSoi Chidlom, Ploenchit RoadLumpinee, PathumwanBangkok 10330
The Companyís ordinary shares and convertible bonds are listed on the Stock Exchange of Thailandand the Singapore Exchange Securities Trading Limited (SGX-ST), respectively. For reporting purposes, theCompany and its subsidiaries, associates, and a joint venture are referred to as the ì Groupî .
The principal business operations of the Company and its subsidiaries (the ì Groupî ) involve the ownership ofdry bulk vessels, certain shipping services, offshore oil and gas services, sales of fertilisers, coal trading, andlogistics. The Groupís activities can be separated into four main categories, namely transport, infrastructure,energy, and the holding company.
These consolidated and Company financial statements are authorised for issue by the Board of Directorson 28 November 2011.
2 Accounting policies
The principal accounting policies adopted in the preparation of these consolidated and Companyfinancial statements are set out below.
2.1 Basis of preparation
The consolidated and Company financial statements have been prepared in accordance with Thaigenerally accepted accounting principles under the Accounting Act B.E. 2543, being those Thai AccountingStandards (TAS) issued under the Accounting Profession Act B.E. 2547, and the financial reportingrequirements of the Securities and Exchange Commission (ì SECî ) under the Securities and Exchange Act.
The consolidated and Company financial statements have been prepared under the historical costconvention, except certain short-term investments and employee benefits as disclosed in theaccounting policies below.
The preparation of financial statements in conformity with Thai generally accepted accountingprinciples requires management to make estimates and assumptions that affect the reportedamounts of assets and liabilities, the disclosure of contingent assets and liabilities at the date of thefinancial statements and the amounts of revenues and expenses in the reported periods. Althoughthese estimates are based on managementís best knowledge of current events and actions, actualresults may differ from those estimates.
Where necessary, comparative figures have been adjusted to conform with changes in presentation inthe current year.
An English version of the consolidated and Company financial statements has been prepared fromthe statutory financial statements that are issued in the Thai language. In the event of a conflict or adifference in interpretation between the two languages, the Thai language statutory financial statementsshall prevail.
Thoresen Thai Agencies Public Company Limited
For the years that ended on 30 September 2011 and 2010
Notes to Consolidated and Company Financial Statements

12
81Annual Report 2011
Thoresen Thai Agencies Public Company LimitedNotes to Consolidated and Company Financial StatementsFor the years that ended on 30 September 2011 and 2010
11
2 Accounting policies (Continued)
2.2 New accounting standards, new financial reporting standards, amendments to accountingstandards and accounting framework
a) Accounting framework
The amendment of accounting framework is effective on 26 May 2010.
b) New accounting standards, new financial reporting standards, and amendments to accountingstandards
The following new accounting standards, new financial reporting standards, and amendments toaccounting standards which are considered having impact to the Group:
Effective for the periods beginning on or after 1 January 2011TAS 1 (Revised 2009) Presentation of Financial StatementsTAS 16 (Revised 2009) Property, Plant and EquipmentTAS 23 (Revised 2009) Borrowing CostsTAS 24 (Revised 2009) Related Party DisclosuresTAS 27 (Revised 2009) Consolidated and Separate Financial StatementsTAS 28 (Revised 2009) Investments in AssociatesTAS 40 (Revised 2009) Investment PropertyTFRS 3 (Revised 2009) Business Combinations
Effective for the periods beginning on or after 1 January 2013TAS 12 Income taxesTAS 21 (Revised 2009) The Effects of Changes in Foreign Exchange Rates
TAS 1 (Revised 2009), the revised standard requires an entity to present the statement ofcomprehensive income and an entity can choose to present one statement (the statement ofcomprehensive income) or two statements (the income statement and statement ofcomprehensive income). Where entities restate or reclassify comparative information, they willbe required to present a restated statement of financial position as at the beginningcomparative period in addition to the current requirement to present a statement of financialposition at the end of the current period and comparative period. However, for the financialstatements whose period begins on or after 1 January 2011 and are the first period apply thisstandard, an entity can choose to present a statement of financial position only without thestatement of financial position as at the beginning comparative period. The Group will applyTAS 1 (Revised 2009) from 1 October 2011. It is likely that both income statement and statementof comprehensive income will be presented as one statement.
TAS 12 deals with taxes on income, comprising current tax and deferred tax. Current tax assetsand liabilities are measured at the amount expected to be recovered from or paid to thetaxation authorities, using tax rates and tax law that have been enacted or substantivelyenacted by the end of the reporting period. Deferred taxes are measured by based on thetemporary difference between the tax base of an asset or liability and its carrying amount in thefinancial statements and using the tax rates that are expected to apply to the period when theasset is realised or the liability is settled, based on tax rates and tax law that have been enactedor substantively enacted by the end of the reporting period. The Group will apply this standardfrom 1 October 2013 retrospectively with an expectation to incur deferred tax account andchanges in retained earnings and income tax expense. The management is currently assessingthe impact of applying this standard.
12
82 Thoresen Thai Agencies Public Company Limited
Thoresen Thai Agencies Public Company LimitedNotes to Consolidated and Company Financial StatementsFor the years that ended on 30 September 2011 and 2010
12
2 Accounting policies (Continued)
2.2 New accounting standards, new financial reporting standards, amendments to accountingstandards and accounting framework (Continued)
b) New accounting standards, new financial reporting standards, and amendments to accountingstandards (Continued)
TAS 16 (Revised 2009), the revised standard requires the entity to include in the cost ofproperty, plant, and equipment, an initial estimate of the costs of dismantling and removing theitem and restoring the site on which it is located, when the entity has an obligation to do so. Anentity requires that an item of property, plant, and equipment with a cost that is significant inrelation to the total cost of the item shall be depreciated separately. The revised standard alsorequires an entity to review useful life, residual value, and depreciation method at least at eachfinancial year-end. The Group will apply this standard from 1 October 2011. The management iscurrently assessing the impact of applying this standard.
TAS 21 (Revised 2009) requires an entity to determine its functional currency which is acurrency of the primary economic environment in which the entity operates. Foreign currencytransactions are required to be translated into the functional currency using the exchangerates prevailing at the dates of the transaction. Foreign exchange gains and losses resultingfrom the settlement of such transactions and from translation at year-end exchange rate ofmonetary items denominated in foreign currency are recognised in profit or loss. The results andfinancial position of all the group entities that have a functional currency difference from thepresentation currency are translated in the presentation currency by a) assets and liabilities aretranslated at the closing rate at the date of that statement of financial position b) income andexpenses are translated at exchange rate at the date of the transactions, and c) all resultingexchange differences are recognised in the statement of comprehensive income. The Groupwill apply this standard from 1 October 2013. The application of the standard will be accountedfor retrospectively. The management is currently assessing the impact of applying thisstandard.
TAS 23 (Revised 2009), the revised standard requires an entity to capitalise borrowing costsdirectly attributable to the acquisition, construction or production of a qualifying asset as partof the cost of that asset. The option of immediately expensing those borrowing costs will beremoved. The Group will apply this standard prospectively from 1 October 2011.
TAS 24 (Revised 2009), the definition of related party has been expanded include parties withjoint control over the entity, joint venture in which the entity is a venturer and post-employmentbenefit plan for the benefit of employees of an entity. The Group will apply the revised standardfrom 1 October 2011 which may impact only to the disclosure of related parties information inthe notes to financial statements.
TAS 27 (Revised 2009), the revised standard requires the effects of all transactions with non-controlling interests to be recorded in equity if there is no change in control and thesetransactions will no longer result in goodwill or gains and losses. The standard also specifiesthe accounting when control is lost. Any remaining interest in the entity is re-measured to fairvalue, and gain or loss is recognised in profit or loss. The Group will apply the standardprospectively to transactions with non-controlling interests from 1 October 2011.
TAS 28 (Revised 2009), on the loss of significant influence, the entity shall measure a remaininginvestment at fair value and recognise any gain or loss in profit or loss. The Group will apply therevised standard from 1 October 2011.

12
83Annual Report 2011
Thoresen Thai Agencies Public Company LimitedNotes to Consolidated and Company Financial StatementsFor the years that ended on 30 September 2011 and 2010
13
2 Accounting policies (Continued)
2.2 New accounting standards, new financial reporting standards, amendments to accountingstandards and accounting framework (Continued)
b) New accounting standards, new financial reporting standards, and amendments to accountingstandards (Continued)
TAS 40 (Revised 2009), the standard has specific presentation and measurement requirements forinvestment property. The entity has to present an investment property separately in the statement offinancial position. The entity can choose to measure it either cost model or fair value model. Under fairvalue model, any changes in fair value are recognised in profit or loss. The entity will apply thestandard from 1 October 2011.
TFRS 3 (Revised 2009), the revised standard continues to apply the acquisition method to businesscombinations, with some significant changes. For example, all payments to purchase a business areto be recorded at fair value at the acquisition date, with contingent payments classified as debtsubsequently re-measured through profit or loss. There is a choice on an acquisition-by-acquisitionbasis to measure the non-controlling interest in the acquiree either at fair value or at the non-controlling interestís proportionate share of the acquireeís net assets. All acquisition-related costsshould be expensed. The Group will apply the revised standard prospectively to all businesscombination from 1 October 2011.
The Groupís management has determined that the new accounting standards, new financial reportingstandards, and amendments to accounting standards will not significantly impact the financialstatements being presented.
2.3 Critical accounting estimates, assumptions, and judgements
Estimates, assumptions, and judgements are continually evaluated and are based on historical experienceand other factors, including expectations of future events that are believed to be reasonable underthe circumstances.
2.3.1 Allowance for inventories
Management estimates allowance for slow-moving of coals by considering average historical pricesand trend of future selling prices. The expected selling price in the future may vary based on coalmarket price, market demand and domestic competition circumstance.
2.3.2 Property, plant, and equipment and intangible assets
Management determines the carrying value of property, plant, and equipment and intangible assetsbased on estimates, assumptions, and judgments in respect of remaining useful lives and residualvalues of these assets. These estimates, assumptions, and judgments reflect both historicalexperience and expectations regarding future operations, utilisation, and performance.
2.3.3 Impairment of property, plant, and equipment and intangible assets
The Group assesses impairment of property, plant, and equipment and intangible assetswhenever events or changes in circumstances indicate the carrying amount of assets may notbe recoverable in accordance with the accounting policies stated in Note 2.12 and 2.14. Therecoverable amount is estimated by management.

12
84 Thoresen Thai Agencies Public Company Limited
Thoresen Thai Agencies Public Company LimitedNotes to Consolidated and Company Financial StatementsFor the years that ended on 30 September 2011 and 2010
14
2 Accounting policies (Continued)
2.3 Critical accounting estimates, assumptions, and judgements (Continued)
2.3.4 Impairment of goodwill
The Group tests annually whether goodwill has suffered any impairment in accordance with theaccounting policy stated in Note 2.13. The recoverable amounts of cash-generating units havebeen determined based on value-in-use calculations. These calculations require the use ofestimates by management.
2.3.5 Employee benefits
The Group has a commitment to pay benefits to employees on retirement. The present value ofemployee benefit liabilities recognised in the balance sheet is determined on an actuarial basisutilising various assumptions. The assumptions used in determining the net period cost foremployee benefits include the discount rate, the rate of salary inflation, and employee turnover.Any changes in these assumptions will impact the net periodic cost recorded for employeebenefits. On an annual basis, the Group determines the appropriate discount rate, whichrepresents the interest rate that should be used to determine the present value of future cashflows currently expected to be required to settle the employee benefits. In determining theappropriate discount rate, the Group considers the interest rates of government bonds that aredenominated in the currency in which the benefits will be paid.
2.4 Investments in subsidiaries, associates, and joint ventures
Investments in subsidiaries
Subsidiaries are all entities (including special purpose entities) over which the Group has the powerto govern the financial and operating policies and generally means a shareholding of more than onehalf of the entity. The existence and effect of potential voting rights in another entity are consideredwhen assessing whether the Group controls that entity. Subsidiaries are consolidated from the date onwhich control is transferred to the Group and are no longer consolidated from the date that controlceases.
The purchase method of accounting is used to account for the acquisition of subsidiaries by theGroup. The cost of an acquisition is measured as the fair value of the assets given, equityinstruments issued and liabilities incurred or assumed at the date of exchange, plus costs directlyattributable to the acquisition. Identifiable assets acquired and liabilities and contingent liabilitiesassumed in a business combination are measured initially at their fair values at the acquisition date,irrespective of the extent of any minority interest.
The excess of the cost of acquisition over the fair value of the Groupís share of the identifiable netassets acquired is recorded as goodwill. If the cost of acquisition is less than the fair value of the netassets of the subsidiary acquired, the difference is considered negative goodwill and recogniseddirectly in the statements of income. See Note 2.13 for the accounting policy on goodwill.
Intercompany transactions, balances, and unrealised gains on transactions between groupcompanies are eliminated; unrealised losses are also eliminated unless costs cannot be recovered.Where necessary, accounting policies of subsidiaries have been changed to ensure consistency withthe policies adopted by the Group.
In the Companyís separate financial statements, investments in subsidiaries are reported by usingthe cost method.

12
85Annual Report 2011
Thoresen Thai Agencies Public Company LimitedNotes to Consolidated and Company Financial StatementsFor the years that ended on 30 September 2011 and 2010
15
2 Accounting policies (Continued)
2.4 Investments in subsidiaries, associates, and joint ventures (Continued)
Investments in subsidiaries (Continued)
Business combination under common control is accounted for using the carrying value of the acquiree,and the excess of carrying value over the purchase consideration of an acquisition under commoncontrol is shown in shareholdersí equity on the balance sheet.
A list of the Groupís principal subsidiaries and the financial effects of the acquisitions and disposalsof subsidiaries are shown in Note 10.
Investments in associates
Associates are all entities over which the Group has significant influence but not outright control. Theequity method of accounting for associate companies is adopted in the consolidated financialstatements. In applying the equity method, the Groupís share of accumulated retained earnings andmovements in reserves from the effective date on which the company became an associate and up tothe effective date of disposal is recorded in the consolidated financial statements.
Goodwill arising on the acquisition of associates is included in the carrying amount of the investment inassociates and is treated in accordance with the Groupís accounting policy for goodwill. The share ofassociated retained earnings and reserves is generally determined from the associateís latest annualfinancial statements or interim financial statements when appropriate. Dividends received fromassociates are deducted from the carrying value of the investment. Where the Groupís share oflosses of an associate exceeds the carrying amount of the associate, the associate is carried at zerovalue. Additional losses are only recognised to the extent that the Group has incurred obligations ormade payments on behalf of the associates.
In the Companyís separate financial statements, investments in associates are accounted using thecost method.
A list of the Groupís principal associates and the financial effects of acquisitions and disposals ofassociates are shown in Note 11.
Investments in joint ventures
The Group has accounted for the investment in a joint venture by using the equity method in theconsolidated financial statements.
In the Companyís separate financial statements, investments in joint ventures are accounted forusing the cost method.
The excess of the cost of the acquisition over the fair value of the Companyís share of the net assetsof the acquired joint controlled entity represents goodwill, which is included in the investment amount.
A list of the Groupís principal joint ventures and the financial effects of acquisitions and disposals ofthe joint ventures are shown in Note 12.

12
86 Thoresen Thai Agencies Public Company Limited
Thoresen Thai Agencies Public Company LimitedNotes to Consolidated and Company Financial StatementsFor the years that ended on 30 September 2011 and 2010
16
2 Accounting policies (Continued)
2.5 Foreign currency transactions
Items included in the financial statements of each entity in the Group are measured using the reportingcurrency of each entityís country of incorporation. The consolidated and Company financial statementsare presented in Thai Baht.
Transactions denominated in foreign currencies are translated into the entityís reporting currency atthe rates of exchange prevailing on the transaction dates. Realised gains and losses on foreignexchange transactions are recognised in the statements of income as incurred. Monetary assets andliabilities at the balance sheet date denominated in foreign currencies are translated into Thai Baht atthe rate prevailing on that date. Unrealised gains and losses on foreign exchange are recognised inthe statements of income as incurred.
Statements of income and cash flows of foreign entities are translated into the Groupís reportingcurrency at the average exchange rates for the year, and balance sheets are translated at theexchange rates prevailing on the balance sheet date. Currency translation differences arising from theretranslation of the net investment in foreign entities are part of shareholdersí equity. On disposal ofa foreign entity, accumulated exchange differences are recognised in the statements of income aspart of the gain or loss on sale.
Goodwill and fair value adjustments arising on the acquisition of a foreign entity are translated at theexchange rates prevailing on the balance sheet date.
2.6 Cash and cash equivalents
Cash and cash equivalents comprise cash on hand, deposits held at call with banks but do not includedeposits with banks which are held to maturity, and other short-term highly liquid investments withmaturities of three months or less from the date of acquisition and bank overdrafts (if any). Bankoverdrafts are included in current liabilities on the balance sheet.
2.7 Short-term investments
Short-term investments are classified as available-for-sale investments. The classification isdependent on the purpose for which the investments were acquired. Management determines theappropriate classification of its investments at the time of the purchase and re-evaluates suchdesignation on a regular basis.
Available-for-sale investments represent investments intended to be held for an indefinite period oftime, which may be sold in response to liquidity needs. Available-for-sale investments are included innon-current assets unless management has expressed the intention of holding the investment forless than 12 months from the balance sheet date or unless they will be needed to be sold to raiseoperating capital, in which case they are included in current assets. Management determines theappropriate classification of its investments at the time of the purchase and re-evaluates such designationon a regular basis.

12
87Annual Report 2011
Thoresen Thai Agencies Public Company LimitedNotes to Consolidated and Company Financial StatementsFor the years that ended on 30 September 2011 and 2010
17
2 Accounting policies (Continued)
2.7 Short-term investments (Continued)
Investments in marketable equity securities which are classified as available-for-sale securities are fairvalued annually at the balance sheet date. Fair value is determined by reference to the Stock Exchange ofThailandís quoted bid price. For other investments, fair value is estimated by reference to the currentmarket value of similar instruments. The unrealised gains and losses of available-for-sale investmentsare recognised in equity.
When disposing part of the Groupís holding of a particular investment in equity securities, thecarrying amount of the disposed part is determined by the weighted average carrying amount of thetotal holding of the investment.
Investments in non-marketable equity securities are classified as general investments and carried atcost. A test for impairment is carried out when there is a factor indicating that such investmentsmight be impaired. If its recoverable amount is less than the carrying value of the investment, animpairment loss is charged to the statements of income.
2.8 Trade accounts receivable
Trade accounts receivable are carried at original invoice amount and subsequently measured at theremaining amount less an allowance for doubtful receivables based on a review of all outstandingamounts at year end. The amount of the allowance is the difference between the carrying amount ofthe receivable and the amount expected to be collected. Bad debts are written off during the year inwhich they are identified and recognised in the statements of income within administrative expenses.
2.9 Inventories
Inventories mainly represent materials, goods, and supplies relating to fertiliser, pesticide, and coalproducts which are stated at the lower of cost or net realisable value. Cost is determined by theweighted average method. The cost of purchase comprises both the purchase price and costsdirectly attributable to the acquisition of the inventory, such as import duties and transportationcharges, less all attributable discounts, allowances, or rebates. The cost of finished goods and workin progress comprises raw materials, direct labour, other direct costs, and related productionoverheads (based on normal operating capacity), but excludes borrowing costs. Net realisable valueis the estimate of the selling price in the ordinary course of business, less the costs of completion andselling expenses. Allowance is made, where necessary, for obsolete, slow moving, and defectiveinventories.
2.10 Vessel supplies and spare parts
Vessel supplies and spare parts mainly comprise bunker, vessel supplies, and spare parts. Bunkersupplies are stated at cost, determined on the first-in, first-out basis. Vessel supplies and vesselspare parts are stated at cost, determined on the weighted-average basis. Rig supplies and rig spareparts are stated at historical cost, determined on the specific identification basis. The rig supplies andrig spare parts purchased to replace those used during the year are reported as offshore serviceexpenses in the statements of income.

12
88 Thoresen Thai Agencies Public Company Limited
Thoresen Thai Agencies Public Company LimitedNotes to Consolidated and Company Financial StatementsFor the years that ended on 30 September 2011 and 2010
18
2 Accounting policies (Continued)
2.11 Long-term investments
Long-term investments which are classified as general investments are carried at cost less impairment(if any).
Management determines the appropriate classification of its investments at the time of the purchaseand re-evaluates such designation on a regular basis.
A test for impairment by the Group is carried out when there is a factor indicating that suchinvestment might be impaired. If the carrying value of the investment is lower than its recoverableamount, an impairment loss is charged to the statements of income.
On disposal of an investment, the difference between the net disposal proceeds and the carryingamount is charged to the statements of income.
When disposing part of the Groupís holding of a particular investment in equity securities, thecarrying amount of the disposed part is determined from the weighted average carrying amount ofthe total holding of the investment.
If an investment with fair value adjustments in equity is sold or impaired, accumulated fair valueadjustments are included in the statements of income.
2.12 Property, plant, and equipment
The Group accounting policy with respect to property, plant, equipment, and depreciation is as follows:
Property, plant, and equipment are recorded at cost. Cost is measured by the cash or cashequivalent price of obtaining the asset and bringing it to the location and condition necessary for itsintended use. Property, plant, and equipment, except land, are presented in the balance sheet at costless accumulated depreciation and impairments (if any).
Depreciation is calculated using the straight-line method over the estimated useful lives of therelated assets. The estimated useful lives are as follows:
Buildings and factories 20 yearsBuilding improvements 3 - 20 yearsNew build support vessels 5 - 30 yearsOcean vessels (second-hand and new) 7 - 25 yearsSecond-hand support and supply vessels 5 - 16 yearsSecond-hand tender rigs 1 - 20 yearsMachinery and equipment 5 - 15 yearsFurniture, fixtures, and office equipment 3 - 10 yearsMotor vehicles 5 - 6 yearsMotor launches 10 yearsBarges 5 - 10 years
The estimated useful lives of ocean vessels, support and supply vessels, tender rigs, and barges arebased on the remaining useful lives at the acquisition date. Depreciation is calculated on the cost ofthe vessels, support and supply vessels, tender rigs, or barges less their estimated residual values.

12
89Annual Report 2011
Thoresen Thai Agencies Public Company LimitedNotes to Consolidated and Company Financial StatementsFor the years that ended on 30 September 2011 and 2010
19
2 Accounting policies (Continued)
2.12 Property, plant, and equipment (Continued)
The Group records depreciation as an expense for the period. When a long-term asset is retired, theGroup will write-off both the asset and the related accumulated depreciation from the accounts andrecognise any gain or loss from retirement of the asset in the statements of income.
Where the carrying amount of an asset is greater than its estimated recoverable amount, it is writtendown immediately to its recoverable amount.
Repairs and maintenance are charged to the statements of income during the financial period inwhich they are incurred. The cost of major renovations is included in the carrying amount of theasset when it is probable that future economic benefits in excess of the originally assessed standardof performance of the existing asset will flow to the Group.
Gains and losses on disposals are determined by comparing proceeds with the carrying amount andare included in operating profits.
The borrowing costs to finance the construction of property, plant, and equipment are capitalised aspart of cost of the asset, during the period of time required to complete and prepare the property forits intended use.
2.13 Goodwill
Goodwill represents the excess of the cost of an acquisition over the fair value of the Groupís share ofthe net identifiable assets of the acquired subsidiary or associate at the date of acquisition. Goodwill onacquisitions of subsidiaries is reported as a separate line in the consolidated balance sheet. Goodwill onacquisitions of associates is included in investments in associates and is tested for impairment as partof the overall balance.
Separately recognised goodwill is tested annually for impairment and carried at cost less accumulatedimpairment losses. Impairment losses on goodwill are not reversed. Gains and losses on the disposalof an entity include the carrying amount of goodwill relating to the entity sold.
Goodwill is allocated to cash generating units for the purpose of impairment testing. The allocation ismade to those cash generating units or group of cash generating units that are expected to benefit fromthe business combination in which the goodwill arose.

12
90 Thoresen Thai Agencies Public Company Limited
Thoresen Thai Agencies Public Company LimitedNotes to Consolidated and Company Financial StatementsFor the years that ended on 30 September 2011 and 2010
20
2 Accounting policies (Continued)
2.14 Intangible assets
Computer software
Acquired computer software licences are capitalised on the basis of the costs incurred to acquire andbring to use the specific software. Amortisation is calculated using the straight-line method toallocate the cost of computer software over their estimated useful lives (3, 5, and 7 years).
Other intangible assets
Trademarks and customer relationships acquired in a business combination are recognised at fair valueat the acquisition date. Trademarks and customer relationships have a finite useful life and are carried atcost less accumulated amortisation and impairment (if any). Amortisation is calculated using the straight-line method over their estimated or expected useful lives (5 - 20 years).
Assets are reviewed for impairment whenever events or changes in circumstances indicate that thecarrying amount may not be recoverable. An impairment loss is recognized for the amount by which thecarrying amount of the assets exceeds its recoverable amount which is the higher of an assetís fairvalue less costs to sell and value in use.
2.15 Other assets
Other assets mainly comprise deferred dry-docking expenses, insurance claims and prepaidlong-term leases of land use rights. Deferred dry-docking expenses and prepaid long-term leases ofland use rights are amortised to the statements of income on a straight line basis over a period of 2 - 5years and 11 - 20 years, respectively.
Dry-docking is an expenditure incurred during inspections and major repairs of the vessels. Dry-dockingis recognised in the carrying amount of other assets and is amortised over the period until the nextscheduled dry-docking, up to a maximum of 5 years. When significant specific dry-docking costs areincurred prior to the expiry of the amortisation periods, the remaining costs of the previous dry-dockingare written off immediately.

12
91Annual Report 2011
Thoresen Thai Agencies Public Company LimitedNotes to Consolidated and Company Financial StatementsFor the years that ended on 30 September 2011 and 2010
21
2 Accounting policies (Continued)
2.16 Accounting for leases
Where the Group is the lessee
Leases of assets, which substantially transfer all the risks, and rewards of ownership to the lesseeare classified as finance leases. Finance leases are capitalised at the inception of the lease at thelower of the fair value of the leased assets or the present value of the minimum lease payments.Each lease payment contains principal and interest charges to achieve a constant rate on the financebalance outstanding. The outstanding rental obligations, net of finance charges, are included inlong-term payables. The interest element of the finance cost is charged to the statements of incomeover the lease period so as to achieve a constant periodic rate of interest on the remaining balance ofthe liability for each period. The asset acquired under finance leases is depreciated over the shorterof the useful life of the asset or the lease period.
Leases not transferring a significant portion of the risks and rewards of ownership to the lessee areclassified as operating leases. Lease expenses (net of any incentive received from the lessor), whichare primarily rental and interest expenses, are charged to the statements of income on a straight-line basis over the lease period.
When an operating lease is terminated before the lease period has expired, any payment required tobe made to the lessor by way of penalty is recognised as an expense in the period in which terminationtakes place.
Where the Group is the lessor
Assets leased out under operating leases are included in property, plant, and equipment in thebalance sheet. They are depreciated over their expected useful lives on a basis consistent with othersimilar property, plant, and equipment owned by the Group. Rental income (net of any incentivesgiven to lessees) is recognised on a straight-line basis over the lease term.
2.17 Bonds
Bonds and convertible bonds are recognised initially at the proceeds amount, net of transaction costsincurred, and are subsequently stated at their amortised cost. Convertible bonds with settlementoptions by the Company are classified purely as financial liabilities.
2.18 Provisions
Provisions, which exclude the provisions relating to employee benefits, are recognised when theGroup has a present legal or constructive obligation as a result of past events, it is probable that anoutflow of resources will be required to settle the obligation, and a reliable estimate of the amountcan be made. Where the Group expects a provision to be reimbursed, for example, under an insurancecontract, the reimbursement is recognised as a separate asset but only when the reimbursement isvirtually certain.

12
92 Thoresen Thai Agencies Public Company Limited
Thoresen Thai Agencies Public Company LimitedNotes to Consolidated and Company Financial StatementsFor the years that ended on 30 September 2011 and 2010
22
2 Accounting policies (Continued)
2.19 Share capital
Ordinary shares are classified as equity.
Incremental external costs directly attributable to the issue of new shares, other than in connectionwith business combination, are shown in equity as a deduction from the proceeds. Share issue costsincurred directly in connection with a business combination are included in the cost of acquisition.
Where the Company or its subsidiaries purchases the Companyís equity share capital, the considerationpaid including any attributable incremental external costs net of income taxes is deducted from totalshareholdersí equity as treasury shares until they are cancelled. Where such shares are subsequentlysold or reissued, any consideration received is included in shareholdersí equity.
2.20 Revenue recognition
Revenue comprises the fair value of the consideration received or receivable for the sale of goods andservices net of output tax, rebates, and discounts, and after eliminating sales within the Group for theconsolidated financial statements. The Group recognises revenue when the amount of revenue canbe reliably measured, it is probable that future economic benefits will flow to the entity, and specificcriteria have been met for each of the Groupís activities as described below.
Rendering of services
Freight charges of each voyage are generally recognised as revenues at the completion of the voyage.Where a voyage is incomplete as of the balance sheet date, freight charges are recognised asrevenue in proportion to the lapsed time of the voyage. Freight charges shown in the statements ofincome represent the net freight charges after deduction of related commissions.
Offshore service income is recognised as services are performed based upon (a) contracted day ratesand the number of operating days during the period or (b) agreed service charges. When thearrangement contains a lease obligation, revenues are evenly recognised over the contract period.
Activities to mobilise a rig from one geographic area to another and linked to the underlying contractsare classified as mobilisation activities. Certain contracts include mobilisation fees paid at the start ofthe contracts. Where the mobilisation fee covers a general or specific upgrade of a rig or equipment,the fee is recognised as revenue over the contract period. In cases where the fee covers specificoperating expenses at the start up of the contract, the fee is recognised in the same period as theexpenses.
Commissions for services rendered to vessels and service income are generally recognised asrevenues when services are completed and billed.
Sales of goods
Revenue from sales of goods is recognised when significant risks and rewards of ownership of thegoods are transferred to the buyer.

12
93Annual Report 2011
Thoresen Thai Agencies Public Company LimitedNotes to Consolidated and Company Financial StatementsFor the years that ended on 30 September 2011 and 2010
23
2 Accounting policies (Continued)
2.20 Revenue recognition (Continued)
Interest income
Interest income is recognised on a time proportion basis, taking account of the principal outstanding andthe effective rate over the period of maturity, when it is determined that such income will be accrued to theGroup.
Rental income
Rental income is recognised as revenue on an accrual basis at the amount as specified under eachlease agreement.
Dividend income
Dividend income is recognised when the right to receive payment is established.
2.21 Dividend distribution
Dividend to the Companyís shareholders is recognised as a liability in the consolidated and Companyfinancial statements in the period in which the interim dividends are approved by the Board ofDirectors and the annual dividends are approved by the Companyís shareholders.
2.22 Employee benefits
(a) Provident fund
The Group operates a provident fund, being a defined contribution plan, the asset for which isheld in a separate trustee-administered fund. The provident fund is funded by payments fromemployees and by the Group.
The Groupís contributions to the provident fund are charged to the statements of income in theyear to which they relate.
(b) Retirement benefits
The retirement benefit is a defined benefit plan that an employee will receive on retirementaccording to Thai Labour Law depending on age and years of service.
The liability of retirement benefits is recognised in the consolidated and Company balancesheet using the present value of the obligations at the balance sheet date and past servicecosts. The retirement benefit is calculated by an independent actuary using the projected unitcredit method. The present value of the benefit obligations is determined by discounting theestimated future cash outflows using interest rates of referred government bonds that aredenominated in the currency in which the benefits will be paid and that have terms to maturityapproximating to the terms of the related retirement liabilities. Actuarial gains and lossesarising from experience adjustments and changes in actuarial assumptions are charged or creditedto the statements of income.

12
94 Thoresen Thai Agencies Public Company Limited
Thoresen Thai Agencies Public Company LimitedNotes to Consolidated and Company Financial StatementsFor the years that ended on 30 September 2011 and 2010
24
2 Accounting policies (Continued)
2.22 Employee benefits (Continued)
(c) Retention incentives
The drilling companies provide retention incentives to certain employees. The entitlement tothese incentives is conditional on the staff remaining in service up to the completion of theminimum entitlement service periods. The expected costs of these incentives are accrued over theperiod of the entitlement service periods without discount to their present value, as there is nosignificant impact from a discounted value calculation approach.
2.23 Income taxes
The Group does not recognise income taxes payable or receivable in future periods in respect oftemporary differences arising from differences between the tax base of assets and liabilities and theircarrying amounts in the financial statements.
2.24 Segment reporting
Business segments provide products or services that are subject to risks and returns that aredifferent from those of other business segments.
2.25 Financial instruments
The Groupís financial assets carried on the balance sheet include cash and cash equivalents, short-terminvestments, trade accounts receivable, and loans to related parties. The Groupís financial liabilitiescarried on the balance sheet include bank overdrafts and short-term loans, trade accounts payable,loans from related parties, and long-term loans. The particular recognition methods adopted aredisclosed in the individual policy statements associated with each item.
The Group is a party to financial instruments that reduce its exposure to fluctuations in interest rates,foreign exchange, and fuel oil prices. These instruments, which are cross currency and interest rateswap contracts, foreign currency forward contracts, and foreign currency collar contracts,respectively, are not recognised in the financial statements on inception.
Cross currency and interest rate swap contracts protect the Group from movements in exchangerates and interest rates. Any differential to be paid or received on a currency and interest rate swapcontracts is recognised as a component of interest revenue or expense over the period of thecontracts. Gains and losses on early termination of currency and interest rate swaps or onrepayment of the borrowing are taken to the statements of income.
Foreign currency forward contracts protect the Group from movements in exchange rates byestablishing the rate at which a foreign currency asset and liability will be settled. Gains or lossesfrom the foreign currency forward contracts will be recognised in the statements of income on thesettlement date.
Foreign currency collar contracts are entered to protect the Group from movements in exchangerates by limiting the rate at which a foreign currency liability will be settled. Any payment to bereceived from the contracts will be recognised in the statements of income on the settlement date.

12
95Annual Report 2011
Thoresen Thai Agencies Public Company LimitedNotes to Consolidated and Company Financial StatementsFor the years that ended on 30 September 2011 and 2010
25
3 Capital risk management
The Groupís objectives when managing capital are to safeguard the Groupís ability to continue as agoing concern in order to provide returns for shareholders and benefits for other stakeholders and tomaintain an optimal capital structure to reduce the cost of capital.
In order to maintain or adjust the capital structure, the Group may adjust the amount of dividendspaid to shareholders and issue new shares or bonds.
4 Business segment information
Segment information of the Groupís business activities is as follows:
Consolidated Bahtí000For the year that ended on 30 September 2011
Elimination ofinter-segment
Transport Infrastructure Energy Holding transaction Total
Revenues from operations 5,860,359 6,487,686 5,542,823 700,570 (1,026,368) 17,565,070Revenues from inter-segment (325,715) - (83) (700,570) 1,026,368 -
Revenues from outside customers 5,534,644 6,487,686 5,542,740 - - 17,565,070
Operating profits (losses) 343,000 471,300 185,707 1,584,420 (1,549,269) 1,035,158
Share of profits in associatesand joint venture 110,229
Finance costs (733,938)Income taxes (342,277)
Net profits for the year 69,172
Property, plant, and equipment andintangible assets, net 14,007,488 1,472,870 10,996,874 928,013 2,023 27,407,268
Total assets 48,130,362
Consolidated Bahtí000For the year that ended on 30 September 2010
Elimination ofinter-segment
Transport Infrastructure Energy Holding transaction Total
Revenues from operations 10,524,907 4,897,248 3,476,365 515,918 (1,494,979) 17,919,459Revenues from inter-segment (958,426) (20,635) - (515,918) 1,494,979 -
Revenues from outside customers 9,566,481 4,876,613 3,476,365 - - 17,919,459
Operating profits (losses) 962,706 455,443 (180,273) 3,478,527 (3,271,787) 1,444,616
Share of profits in associatesand joint venture 80,306
Finance costs (602,366)Income taxes (255,848)
Net profits for the year 666,708
Property, plant, and equipment andintangible assets, net 12,396,940 1,509,519 11,777,535 1,052,539 9,728 26,746,261
Total assets 48,873,463

12
96 Thoresen Thai Agencies Public Company Limited
Thoresen Thai Agencies Public Company LimitedNotes to Consolidated and Company Financial StatementsFor the years that ended on 30 September 2011 and 2010
26
5 Cash and cash equivalents
Consolidated Company2011 2010 2011 2010
Bahtí000 Bahtí000 Bahtí000 Bahtí000
Cash on hand 6,391 6,739 92 58Deposits at banks 3,290,987 8,451,447 265,623 1,737,937Bills of exchange 500,000 - 500,000 -
Cash and cash equivalent 3,797,378 8,458,186 765,715 1,737,995
As at 30 September 2011, deposits held at call with banks bear interest at the rates between 0% to14% per annum (2010: 0.10% to 6.86% per annum). A one-month bill of exchange bears interest at therate of 3.62% per annum.
6 Short-term investments
Consolidated Company2011 2010 2011 2010
Bahtí000 Bahtí000 Bahtí000 Bahtí000
Equity securities 421,114 386,817 110,418 83,893Debt securities 175,000 888,098 175,000 777,961Fixed deposits 375,338 613,135 - -Other investments 17,197 17,280 17,197 17,281
988,649 1,905,330 302,615 879,135Changes in fair value (4,717) 50,972 (10,696) 12,917
Short-term investments 983,932 1,956,302 291,919 892,052
7 Trade accounts receivable, net
Consolidated Company2011 2010 2011 2010
Bahtí000 Bahtí000 Bahtí000 Bahtí000
Trade accounts receivable,gross 2,526,579 1,698,647 - -
Accrued income 373,840 225,278 - -
2,900,419 1,923,925 - -Less Allowance for doubtful
accounts (181,316) (271,341) - -
Trade accounts receivable, net 2,719,103 1,652,584 - -

12
97Annual Report 2011
Thoresen Thai Agencies Public Company LimitedNotes to Consolidated and Company Financial StatementsFor the years that ended on 30 September 2011 and 2010
27
7 Trade accounts receivable, net (Continued)
Trade accounts receivable as at 30 September can be analysed as follows:
Consolidated Company2011 2010 2011 2010
Bahtí000 Bahtí000 Bahtí000 Bahtí000
Current 1,372,511 1,073,017 - -Overdue below 3 months 795,534 223,109 - -Overdue 3 - 6 months 6,140 44,051 - -Overdue 6 - 12 months 197,857 40,000 - -Overdue more than 12 months 154,537 318,470 - -
Total 2,526,579 1,698,647 - -Less Allowance for doubtful
accounts (181,316) (271,341) - -
2,345,263 1,427,306 - -
Full provision has been made for all trade accounts receivable which are classified as non-collectible.
8 Inventories, net
Consolidated Company2011 2010 2011 2010
Bahtí000 Bahtí000 Bahtí000 Bahtí000
Raw materials 181,787 162,983 - -Raw materials in transit 123,962 33,095 - -Finished goods 2,036,783 1,889,980 - -Semi-finished goods 23,364 18,560 - -Tools and supplies 28,525 26,091 - -
Total 2,394,421 2,130,709 - -Less Allowance for slow-moving
and obsolete inventories -finished goods (130,508) (131,128) - -
Inventories, net 2,263,913 1,999,581 - -
As at 30 September 2011, a subsidiary mortgaged its inventories to a bank to secure its loan for a totalvalue of Baht 1,028 million as mentioned in Note 19 (2010: Nil).

12
98 Thoresen Thai Agencies Public Company Limited
Thoresen Thai Agencies Public Company LimitedNotes to Consolidated and Company Financial StatementsFor the years that ended on 30 September 2011 and 2010
28
9 Other current assets, net
Consolidated Company2011 2010 2011 2010
Bahtí000 Bahtí000 Bahtí000 Bahtí000
Advances for business expenses 377,517 249,135 - -Other account receivables 175,766 37,147 26,834 591Value added tax refundable 151,693 145,822 8,792 10,608Prepaid income taxes 48,857 23,726 1,495 3,526Advances to employees 23,153 44,129 171 48Accrued interest income 78,609 49,633 878 667Restricted deposit at a financial
institution due within 1 year 206,484 - - -Other current assets 76,094 33,242 227 987
1,138,173 582,834 38,397 16,427Less Allowance for impairment (32,542) (44,310) - -
Other current assets, net 1,105,631 538,524 38,397 16,427
The restricted deposit at a financial institution, which matures in September 2012, is pledgedagainst the interest swap contract provided by that financial institution.
10 Investments in subsidiaries, net
Investments in subsidiaries as at 30 September comprise investments in the followingcompanies:
Nature of Country of % Ownership interestName of subsidiaries business incorporation 30 September 2011 30 September 2010
Holdings- Soleado Holdings Pte. Ltd. Holding company Singapore 100.0 100.0
With subsidiaries as follows:- EMC Gestion S.A.S. î France- Atlantis Offshore Construction î Singapore
Pte. Ltd.- Baconco Co., Ltd. Fertiliser production VietnamWith associates as follows:- Qing Mei Pte. Ltd. Coal mining Singapore- Baria Serece Port operations Vietnam- Petrolift Inc. Maritime
transportationservices
Philippines
- Athene Holdings Ltd. Holding company Thailand 99.9 99.9

12
99Annual Report 2011
Thoresen Thai Agencies Public Company LimitedNotes to Consolidated and Company Financial StatementsFor the years that ended on 30 September 2011 and 2010
29
10 Investments in subsidiaries, net (Continued)
Nature of Country of % Ownership interestName of subsidiaries business incorporation 30 September 2011 30 September 2010
Transport- Thoresen & Company (Bangkok) Limited Ship management Thailand 99.9 99.9- Thor Dynamic Shipping Co., Ltd. International maritime Thailand 99.9 99.9
transportation- Thor Endeavour Shipping Co., Ltd. î Thailand 99.9 99.9- Thor Energy Shipping Co., Ltd. î Thailand 99.9 99.9- Thor Enterprise Shipping Co., Ltd. î Thailand 99.9 99.9- Thor Harmony Shipping Co., Ltd. î Thailand 99.9 99.9- Thor Integrity Shipping Co., Ltd. î Thailand 99.9 99.9- Thor Jupiter Shipping Co., Ltd. î Thailand 99.9 99.9- Thor Wind Shipping Co., Ltd. î Thailand 99.9 99.9- Thor Wave Shipping Co., Ltd. î Thailand 99.9 99.9- Thoresen Shipping Singapore Pte. Ltd. î Singapore 100.0 100.0
With subsidiaries as follows:- Thor Friendship Shipping Pte. Ltd. î Singapore- Thor Fortune Shipping Pte. Ltd. î Singapore- Thor Horizon Shipping Pte. Ltd. î Singapore
- Thoresen Chartering (HK) Ltd. î Hong Kong 99.9 99.9- Thoresen Shipping Germany GmbH î Germany 100.0 100.0- Thor Orchid Shipping Co., Ltd.* î Thailand 99.9 99.9- Thor Mercury Shipping Co., Ltd.* î Thailand 99.9 99.9- Thor Mariner Shipping Co., Ltd.* î Thailand 99.9 99.9- Thor Merchant Shipping Co., Ltd.* î Thailand 99.9 99.9- Thor Navigator Shipping Co., Ltd.* î Thailand 99.9 99.9- Thor Captain Shipping Co., Ltd. * î Thailand 99.9 99.9- Hermes Shipping Co., Ltd.* î Thailand 99.9 99.9- Thor Pilot Shipping Co., Ltd. * î Thailand 99.9 99.9- Thor Master Shipping Co., Ltd.* î Thailand 99.9 99.9- Thor Commander Shipping Co., Ltd.* î Thailand 99.9 99.9- Thor Transporter Shipping Co., Ltd. * î Thailand 99.9 99.9- Thor Nereus Shipping Co., Ltd. * î Thailand 99.9 99.9- Herakles Shipping Co., Ltd.* î Thailand 99.9 99.9- Heron Shipping Co., Ltd.* î Thailand 99.9 99.9- Thor Nectar Shipping Co., Ltd. * î Thailand 99.9 99.9- Thor Jasmine Shipping Co., Ltd.* î Thailand 99.9 99.9- Thor Champion Shipping Co., Ltd. * î Thailand 99.9 99.9- Thor Star Shipping Co., Ltd.* î Thailand 99.9 99.9- Thor Skipper Shipping Co., Ltd.* î Thailand 99.9 99.9- Thor Sailor Shipping Co., Ltd.* î Thailand 99.9 99.9- Thor Sun Shipping Co., Ltd. * î Thailand 99.9 99.9- Thor Sky Shipping Co., Ltd. * î Thailand 99.9 99.9- Thor Spirit Shipping Co., Ltd.* î Thailand 99.9 99.9- Thor Sea Shipping Co., Ltd.* î Thailand 99.9 99.9- Thor Lotus Shipping Co., Ltd. * î Thailand 99.9 99.9- Thor Trader Shipping Co., Ltd.* î Thailand 99.9 99.9- Thor Traveller Shipping Co., Ltd.* î Thailand 99.9 99.9- Thor Venture Shipping Co., Ltd.* î Thailand 99.9 99.9- Thor Triumph Shipping Co., Ltd.* î Thailand 99.9 99.9- Thor Guardian Shipping Co., Ltd.* î Thailand 99.9 99.9- Thor Confidence Shipping Co., Ltd. * î Thailand 99.9 99.9- Thor Nautica Shipping Co., Ltd. * î Thailand 99.9 99.9- Thor Neptune Shipping Co., Ltd. * î Thailand 99.9 99.9- Thor Nexus Shipping Co., Ltd. * î Thailand 99.9 99.9- Thor Tribute Shipping Co., Ltd.* î Thailand 99.9 99.9- Thor Alliance Shipping Co., Ltd.* î Thailand 99.9 99.9- Thor Nautilus Shipping Co., Ltd. * î Thailand 99.9 99.9- Thor Transit Shipping Co., Ltd. * î Thailand 99.9 99.9- PT Perusahaan Pelayaran Equinox Maritime
transportationservices
Indonesia 49.0 49.0
With an associate as follows:- PT Usaha Putra Bersama Land
transportationIndonesia
- ISS Thoresen Agencies Ltd. ** Ship agency Thailand 49.0 99.9- Fearnleys (Thailand) Ltd.*** Ship brokerage Thailand 49.0 51.0
With subsidiaries as follows:- PT. Fearnleys Indonesia* î Indonesia- Fearnleys Shipbroking Private Limited î India- FearnleysDryCargo (Singapore)Pte.Ltd. î Singapore
- Thoresen Chartering (PTE) Ltd.* î Singapore 100.0 100.0- T.S.C. Maritime Ltd.* Ship spare parts
andThailand 99.9 99.9
equipment repairand maintenance
- Asia Coating Services Ltd.* Coating services Thailand 99.9 99.9- Thoresen Shipping FZE Ship agency UAE 100.0 100.0
With an associate as follows:- Sharjah Ports Services LLC Port operations UAE

12
100 Thoresen Thai Agencies Public Company Limited
Thoresen Thai Agencies Public Company LimitedNotes to Consolidated and Company Financial StatementsFor the years that ended on 30 September 2011 and 2010
30
10 Investments in subsidiaries, net (Continued)
Nature of Country of % Ownership interestName of subsidiaries business incorporation 30 September 2011 30 September 2010
Energy- Mermaid Maritime Public Company Limited Offshore services
investmentsThailand 57.1 57.1
With subsidiaries as follows:- Mermaid Offshore Services Ltd. Turn-key diving
ROVThailand
and NDT servicesto offshore industries
With subsidiaries as follows:- Nemo Subsea AS Vessel owner Norway- Nemo Subsea IS î Norway- Seascape Surveys (Thailand) Ltd. Test and explore
environmentalimpact ofpetroleum
exploration andtelecommunication
Thailand
- Seascape Surveys Pte. Ltd. î SingaporeWith a subsidiary as follows:- PT Seascape Surveys Indonesia î Indonesia
- Subtech Ltd. Diving and subsea Seychellescontractor
With subsidiaries as follows:- Subtech Qatar Diving and
Marine Services LLC Diving Services Qatar- Subtech Saudi Arabia Limited î Saudi Arabia
- Mermaid Offshore ServicesPTY LTD
Turn-key diving ROV Australia
and NDT servicesto offshore industries
- Mermaid Offshore Services Pte.Ltd.
î Singapore
- Mermaid Drilling Ltd. Production andexploration drilling
services and supportto offshoreindustries
Thailand
With subsidiaries as follows:- MTR-1 Ltd. Drilling services Thailand- MTR-2 Ltd. î Thailand- Mermaid Drilling (Malaysia) Sdn. Bhd. î Malaysia- MTR-1 (Singapore) Pte. Ltd. î Singapore- MTR-2 (Singapore) Pte. Ltd.**** î Singapore
- Mermaid Drilling (Singapore) Pte. Ltd. Production andexploration drilling
services and supportto offshoreindustries
Singapore
With a subsidiary as follows:- MTR-3 (Singapore) Pte. Ltd. î Singapore
- Mermaid Training and TechnicalServices Ltd.*
Sub-sea engineeringtraining andexamination
services
Thailand
With an associate as follows:- Asia Offshore Drilling Limited Drilling services Bermuda 33.8
With subsidiaries as follows:- Asia Offshore Rig 1 Limited î î- Asia Offshore Rig 2 Limited î î- Asia Offshore Rig 3 Limited î î- Asia Offshore Drilling Pte. Ltd. î Singapore

12
101Annual Report 2011
Thoresen Thai Agencies Public Company LimitedNotes to Consolidated and Company Financial StatementsFor the years that ended on 30 September 2011 and 2010
31
10 Investments in subsidiaries, net (Continued)
Nature of Country of % Ownership interestName of subsidiaries business incorporation 30 September 2011 30 September 2010
Infrastructure- Chidlom Marine Services & Supplies Supply cargo Thailand 99.9 99.9
Ltd. lashing materials- GAC Thoresen Logistics Ltd. Warehousing Thailand 51.0 51.0- Unique Mining Services Public Company
Limited (invested by AtheneHoldings Ltd.)
Sale of coal Thailand 88.7(1) 89.6
With subsidiaries as follows:- UMS Coalbriquette Co., Ltd. Sale of coal briquette Thailand- UMS Lighter Co., Ltd. Boat conveyance Thailand- UMS Transport Co., Ltd. Road transport Thailand- UMS Port Services Co., Ltd. Port service Thailand
- Baconco Co., Ltd. *****(invested by Soleado Holdings Pte.Ltd.)
Fertiliser production Vietnam 100.0 100.0
* Ceased operation as of 30 September 2011.
** On 18 March 2011, the Company entered into a Share Sale and Purchase Agreement with third parties to sell and transfer51% ownership of ISS Thoresen Agencies Ltd. After this sale, ISS Thoresen Agencies Ltd. is classified as an associatecompany (Note 11).
*** On 19 November 2010, the Company entered into a Share Sale and Purchase Agreement with its partner, Fearnleys A/S, tosell and transfer 2% shares of Fearnleys (Thailand) Ltd. After this sale, Fearnleys (Thailand) Ltd. is classified as an associatecompany (Note 11).
**** On 29 November 2010, Mermaid Maritime Public Company Limited (ì MMPLCî ) entered into a Share Sale and PurchaseAgreement with Mermaid Drilling Ltd. to sell and transfer shares of MTR-2 (Singapore) Pte. Ltd.
***** In April 2011, Baria Vung Tau Industrial Zone Authority approved the change of investor in the investment license of BaconcoCo., Ltd. from EMC Gestion S.A.S. to Soleado Holdings Pte. Ltd. (ì Soleadoî ) EMC Gestion S.A.S was liquidated on27 September 2011.
(1) On 6 November 2010, the warrants of UMS expired. There were 1,293,162 shares issued on the last exercise date of thewarrants. Thus, the ownership in UMS by Athene Holdings Limited reduced from 89.6% to 88.7%.
The movement of investments in subsidiaries during the years that ended on 30 September is asfollows:
Company2011 2010
Bahtí000 Bahtí000
Opening balance 15,863,624 14,529,626Additional investments 5,635 1,333,998Disposals (26,099) -Changes of investments from subsidiaries to associates (Note 11) (42,368) -
15,800,792 15,863,624Less Allowance for impairment (76,832) -
Closing balance 15,723,960 15,863,624

12
102 Thoresen Thai Agencies Public Company Limited
Thoresen Thai Agencies Public Company LimitedNotes to Consolidated and Company Financial StatementsFor the years that ended on 30 September 2011 and 2010
32
10 Investments in subsidiaries, net (Continued)
Significant additional investments during the year that ended on 30 September 2011 are asfollows:
Subsidiaries - MMPLC
On 28 March 2011, Mermaid Offshore Services Ltd. (ì MOSî ), a subsidiary of MMPLC, subscribed to100 ordinary shares with a par value of USD 1 constituting 100% of the total issued and paid-upshare capital of Mermaid Offshore Services Pte. Ltd. The total subscription value was USD 100.
On 26 May 2011, Subtech Ltd., a subsidiary of MMPLC, subscribed to 3,500 ordinary shares with apar value of SAR 100 constituting 70% of the total issued and paid-up share capital of SubtechSaudi Arabia Limited. The total subscription value was SAR 350,000.
Significant additional investments during the year that ended on 30 September 2010 are asfollows:
The Company
On 13 November 2009, the Company and a subsidiary, Soleado Holdings Pte. Ltd., subscribed for86,221,201 ordinary shares and 52,941,870 ordinary shares, respectively, of MMPLCís rights issue.The payments of Baht 1,334 million and Baht 803 million were made on 19 November 2009 by theCompany and Soleado Holdings Pte. Ltd., respectively.
Subsidiaries - Athene Holdings Ltd.
On 26 October 2009, Athene Holdings Ltd., a wholly owned subsidiary, acquired 73,649,166ordinary shares, representing 48.46% of paid-up capital of Unique Mining Services PublicCompany Limited (ì UMSî ), a company listed in Market for Alternative Investment (ì MAIî ), fromtwo major shareholders at Baht 23 per share. On the same date, the subsidiary also acquiredUMSís 3,222,100 units of warrants, representing 5.55% of total remaining warrants at Baht14.6579 per unit. This acquisition required Athene Holdings Ltd. to make a mandatory tenderoffer for all shares held by remaining shareholders and all warrants held by remaining warrantholders.
As the result of the tender offer due on 14 December 2009, Athene Holdings Ltd. acquired anadditional 62,433,875 ordinary shares, representing another 41.08% of paid-up capital of UMS,and an additional 53,231,119 units of warrants, representing 91.65% of total remaining warrants.
Subsidiaries - MMPLC
On 26 October 2009, MOS, a subsidiary of MMPLC, entered into Sale and Purchase Agreementswith the shareholders of Nemo Subsea IS and Nemo Subsea AS for the purchase of the shares.Total purchase values were Baht 376.6 million.
On 12 March 2010, MOS purchased the entire issued shares of Subtech Ltd. for USD 7.5 millionfrom Subtech (Proprietary) Ltd.
On 1 April 2010, MMPLC entered into shares sale and purchase agreements with MermaidDrilling (Singapore) Pte. Ltd., (ì MDSî ) a subsidiary of MMPLC, for the purchase of the shares inMTR-1 (Singapore) Ltd., and MTR-2 (Singapore) Ltd.

12
103Annual Report 2011
Thoresen Thai Agencies Public Company LimitedNotes to Consolidated and Company Financial StatementsFor the years that ended on 30 September 2011 and 2010
33
10 Investments in subsidiaries, net (Continued)
Disposals of investments during the year that ended on 30 September 2011 are as follows:
The Company
On 19 November 2010, the Company entered into a Share Sale and Purchase Agreement with itspartner, Fearnleys A/S, to sell and transfer 2% shares of Fearnleys (Thailand) Ltd. Consequently,Fearnleys (Thailand) Ltd. is classified as an associate company and its financial statements have beendeconsolidated accordingly.
Details of the disposal are as follows:
19 November 2010Consolidated Company
Bahtí000 Bahtí000
Sales consideration 2,880 2,880Net book value of investments in subsidiary 2,365 600
Gains on disposal of investments in subsidiary 515 2,280
On 18 March 2011, the Company entered into a Share Sale and Purchase Agreement with thirdparties to sell and transfer 51% shares of ISS Thoresen Agencies Ltd. Consequently, ISS ThoresenAgencies Ltd. is classified as an associate company and its financial statements have been deconsolidatedaccordingly.
Details of the disposal are as follows:
18 March 2011Consolidated Company
Bahtí000 Bahtí000
Sales consideration 30,600 30,600Net book value of investments in subsidiary 31,601 25,499
Gains (losses) on disposal of investments in subsidiary (1,001) 5,101
From this change of shareholding structure, the excess of carrying value over purchase considerationof acquisition under common control amounting to Baht 124.5 million was recognised throughretained earnings during the year.
Subsidiaries - MMPLC
On 29 November 2010, MMPLC entered into a Share Sale and Purchase Agreement withMermaid Drilling Ltd., a subsidiary of MMPLC, to sell MTR - 2 (Singapore) Pte. Ltd. (ì MTR2 - Sî ) 1share with a par value of USD 1, constituting 100% of the total issued and paid-up share capital ofMTR2 - S. The total purchase value was USD 1.

12
104 Thoresen Thai Agencies Public Company Limited
Thoresen Thai Agencies Public Company LimitedNotes to Consolidated and Company Financial StatementsFor the years that ended on 30 September 2011 and 2010
34
10 Investments in subsidiaries, net (Continued)
Disposals of investments during the year that ended on 30 September 2010 are as follows:
Subsidiaries - MMPLC
During the year that ended on 30 September 2010, MDS, a subsidiary of MMPLC, sold itsinvestments in an associate and subsidiaries which were Kencana Mermaid Drilling Sdn. Bhd., anassociate, Mermaid Kencana Rig 1 Pte. Ltd., and Mermaid Kencana Rigs (Labuan) Pte. Ltd. for aloss of Baht 180.9 million.
Dividend income
During the year that ended on 30 September 2011, the Company received dividend income fromsubsidiaries amounting to Baht 1,085.7 million (2010: Baht 3,167.3 million).

12
105Annual Report 2011
Thoresen Thai Agencies Public Company LimitedNotes to Consolidated and Company Financial StatementsFor the years that ended on 30 September 2011 and 2010
35
11 Investments in associates
Investments in associates as at 30 September in the consolidated and Company financial statementscomprise investments in the following companies:
% Ownership interestNature of Country of 30 September 30 September
Name of associates business incorporation 2011 2010
Company financial statements
Transport- Gulf Agency Company (Thailand) Ltd. Ship agency Thailand 51.0* 51.0*
Consolidated financial statements
Transport- PT Usaha Putra Bersama (invested by PT Land Indonesia 25.6 25.6
Perusahaan Pelayaran Equinox) transportation- Sharjah Ports Services LLC (invested by Port UAE 49.0 49.0
Thoresen Shipping FZE) operations- Petrolift Inc. (invested by Soleado Maritime Philippines 40.0 38.8
Holdings Pte. Ltd.) transportationservices
- Baria Serece (invested by Soleado Port Vietnam 20.0 -Holdings Pte. Ltd.) operations
- Fearnleys (Thailand) Ltd. Ship brokerage Thailand 49.0** -With subsidiaries as follows:- PT. Fearnleys Indonesia î Indonesia- Fearnleys Shipbroking Private Limited î India- Fearnleys Dry Cargo (Singapore)
Pte. Ltd. î Singapore- ISS Thoresen Agencies Ltd. Ship agency Thailand 49.0** -
Energy- Asia Offshore Drilling Limited Drilling Bermuda 33.8 -
(invested by MMPLC) servicesWith subsidiaries as follows:- Asia Offshore Rig 1 Limited î î- Asia Offshore Rig 2 Limited î î- Asia Offshore Rig 3 Limited î î- Asia Offshore Drilling Pte. Ltd. î Singapore
- Merton Group (Cyprus) Ltd. Coal mining Philippines 24.3 21.2(invested by Soleado Holdings Pte. Ltd.)
- Qing Mei Pte. Ltd.(invested by Soleado Holdings Pte. Ltd.)
î Singapore 33.3 -
* Gulf Agency Company (Thailand) Ltd. is classified as an associate company, because the Companydoes not have control although the Company holds equity interest of 51 percent. The equitymethod of accounting is applied to this investment in the consolidated financial statements.
** Reclassification as the result of shares disposal (Note 10).

12
106 Thoresen Thai Agencies Public Company Limited
Thoresen Thai Agencies Public Company LimitedNotes to Consolidated and Company Financial StatementsFor the years that ended on 30 September 2011 and 2010
36
11 Investments in associates (Continued)
The movement of investments in associates during the years that ended on 30 September is as follows:
Consolidated Company2011 2010 2011 2010
Bahtí000 Bahtí000 Bahtí000 Bahtí000
Opening balance 1,182,453 656,181 11,213 11,213Adjustments - (9,459) - -Additional investments 2,376,517 904,521 - -Changes of investments fromsubsidiaries to associates (Note 10) 88,266 - 42,368 -
Disposal investments - (407,747) - -Share of profits in associates 93,924 60,775 - -Dividends received (65,690) (21,818) - -
Closing balance 3,675,470 1,182,453 53,581 11,213
Significant additional investments during the year that ended on 30 September 2011 are asfollows:
Subsidiaries - Soleado Holdings Pte. Ltd.
On 19 November 2010, Soleado acquired 407,816 ordinary shares, representing 20% of paid-upcapital of Baria Serece, a company incorporated in Vietnam, for USD 11.0 million, or Baht 331.3million.
On 25 January 2011, Soleado acquired an additional 14,684,025 shares, representing 1.2%ownership in Petrolift, from an existing shareholder at a total purchase price of USD 839,520, orBaht 25.2 million.
On 22 March 2011, Soleado together with Merton Group (Cyprus) Ltd., an associate, entered into astrategic partnership with a business partner, Britmar (Asia) Pte. Ltd. (ì Britmarî ), to establish anew company, Qing Mei Pte. Ltd. (ì Qing Meiî ). Soleado, Merton Group (Cyprus) Ltd., and Britmareach invested 33.33% or USD 1.6 million, which is equivalent to Baht 48.3 million, in Qing Mei. On24 May 2011, all parties participated in rights offering of Qing Mei. Soleado subscribed for anadditional 500,000 ordinary shares of Qing Mei at a total purchase price of USD 500,000, or Baht15.1 million. The ownership in Qing Mei remains the same.
On 24 June 2011, Soleado participated in rights offering of Merton Group (Cyprus) Ltd.. Soleadoacquired an additional 1,019 ordinary shares, representing 3.1% ownership in Merton Group(Cyprus) Ltd., at a total purchase price of USD 1,528,500, or Baht 46.2 million. The percentage ofshareholdings by Soleado in Merton Group (Cyprus) Ltd. increased from 21.18% to 24.31%.

12
107Annual Report 2011
Thoresen Thai Agencies Public Company LimitedNotes to Consolidated and Company Financial StatementsFor the years that ended on 30 September 2011 and 2010
37
11 Investments in associates (Continued)
Significant additional investments during the year that ended on 30 September 2011 are asfollows: (Continued)
Subsidiaries - MMPLC
On 1 November 2010, MMPLC subscribed to 100 ordinary shares in Asia Offshore Drilling Limited(ì AODî ) with a par value of USD 1 per share, at a subscription price of USD 1 per share, totallingUSD 100 or Baht 2,983.8. On 16 November 2010, MMPLC acquired another 9,800,000 ordinaryshares in AOD with a par value of USD 1 per share, at a subscription price of USD 5 per share,totalling USD 49.0 million or Baht 1,456.6 million. The total subscribed shares represent 49% ofthe total paid-up share capital of AOD.
On 1 November 2010, AOD subscribed to each of 100 ordinary shares with a par value of USD 1constituting 100% of the total issued and paid-up share capital of Asia Offshore Rig 1 Limited("AOR1") and Asia Offshore Rig 2 Limited ("AOR2"). The total subscription value was USD 100each for AOR1 and AOR2.
On 28 March 2011, AOD subscribed to 100 ordinary shares with a par value of USD 1 constituting100% of the total issued and paid-up share capital of Asia Offshore Drilling Pte. Ltd. The totalsubscription value was USD 100.
On 30 March 2011, AOD subscribed to each of 35,999,900 ordinary shares with a par value of USD1 constituting 100% of the total issued and paid-up share capital of AOR1 and AOR2. The totalsubscription value was USD 35,999,900 each for AOR1 and AOR2.
On 1 July 2011, AOD subscribed to 100 ordinary shares with a par value of USD 1 constituting100% of the total issued and paid-up share capital of Asia Offshore Rig 3 Limited (ì AOR3î ). Thetotal subscription value was USD 100.
On 1 July 2011, AOD issued 20,000,000 new shares of which the subscription price is USD 4 pershare through the Private Placement. MMPLC subscribed for an additional 3,700,000 sharestotalling USD 14.8 million or equivalent to Baht 447.2 million in AOD, resulting in MMPLCísshareholding in AOD to be reduced from 49% to 33.75%.
On 15 July 2011, AODís shares were listed on the Oslo Axess in Norway.

12
108 Thoresen Thai Agencies Public Company Limited
Thoresen Thai Agencies Public Company LimitedNotes to Consolidated and Company Financial StatementsFor the years that ended on 30 September 2011 and 2010
38
11 Investments in associates (Continued)
Significant additional investments during the year that ended on 30 September 2010 are asfollows:
Subsidiaries - Soleado Holdings Pte. Ltd.
On 2 April 2010, Soleado Holdings Pte. Ltd., the wholly owned subsidiary, acquired 489,056,155ordinary shares, representing 38.83% of the paid-up capital of Petrolift Inc., a company incorporatedin the Philippines amounting to USD 28.0 million or Baht 900.1 million.
Disposals of investments during the year that ended 30 September 2010 are as follows:
Subsidiaries - MMPLC
On 10 June 2010, MMPLC acquired 9,007,407 ordinary shares in Worldclass Inspiration Sdn. Bhd.(ì WCIî ) from its subsidiary, MOS, with a par value of RM 1 per share, at a subscription price of RM4.6 per share, totalling RM 41.7 million, or equivalent to Baht 410 million. The subscribed sharesrepresent 25% of the total paid-up share capital of WCI. On 9 July 2010, MMPLC subsequentlysold its entire investment in WCI to a third party for a gain of Baht 343.3 million.
On 21 June 2010, MDS, a subsidiary, sold its entire investment in Kencana Mermaid Drilling Sdn.Bhd. to a third party for a gain of Baht 0.4 million.
The Groupís share of the result of its principal associates, all of which are unlisted, and its share ofthe assets including goodwill and liabilities are as follows:
2011% Profit (loss)
Assets Liabilities Revenues Profit (loss) Interest sharingName Bahtí000 Bahtí000 Bahtí000 Bahtí000 held Bahtí000
Gulf Agency Company (Thailand) Ltd. 139,747 117,590 806,785 1,636 51.0 834Petrolift Inc. 3,563,789 1,632,689 1,078,446 287,690 40.0 114,496Merton Group (Cyprus) Ltd. 1,021,667 568,720 69,450 (96,240) 24.3 (19,416)Baria Serece 1,015,362 283,897 434,356 116,715 20.0 23,343Asia Offshore Drilling Limited 5,502,059 263,284 - (117,252) 33.8 (41,773)
77,484Add Minor indirect investments 16,440
93,924

12
109Annual Report 2011
Thoresen Thai Agencies Public Company LimitedNotes to Consolidated and Company Financial StatementsFor the years that ended on 30 September 2011 and 2010
39
11 Investments in associates (Continued)
The Groupís share of the result of its principal associates, all of which are unlisted, and its share ofthe assets including goodwill and liabilities are as follows: (Continued)
2010% Profit (loss)
Assets Liabilities Revenues Profit (loss) Interest sharingName Bahtí000 Bahtí000 Bahtí000 Bahtí000 held Bahtí000
Gulf Agency Company (Thailand) Ltd. 162,265 140,112 943,105 (9,962) 51.0 (5,081)Petrolift Inc. 3,259,760 1,530,761 451,194 133,542 38.8 51,860Merton Group (Cyprus) Ltd. 819,222 380,857 - (27,307) 21.2 (5,783)
40,996Add Minor indirect investments 19,779
60,775
12 Investment in joint venture
The joint venture entity is:% Ownership interest
Name of joint ventureNature ofbusiness
Country ofincorporation
30 September2011
30 September2010
Thoresen (Indochina) S.A. Ship agency Panama 50.0 50.0
With a subsidiary as follows:- Thoresen-Vinama Ship agency and Vietnam
Agencies Co., Ltd. related services
The joint venture engages in the business of shipping agency and provides related services operatingin Vietnam. The share of assets, liabilities, revenues, and results of the joint venture is not disclosed,since it is not material to the consolidated financial statements.
The movement of investment in the joint venture during the years that ended on 30 September is asfollows:
Consolidated Company2011 2010 2011 2010
Bahtí000 Bahtí000 Bahtí000 Bahtí000
Opening balance 54,315 42,606 8,771 8,771Share of profits in joint venture 16,305 19,531 - -Dividends received (6,727) (7,822) - -
Closing balance 63,893 54,315 8,771 8,771
The investment in the joint venture in the consolidated and Company financial statements includes anet goodwill amounting to Baht 3.8 million (2010: Baht 3.8 million) in respect of the acquisition of thejoint venture.

12
110 Thoresen Thai Agencies Public Company Limited
Thoresen Thai Agencies Public Company LimitedNotes to Consolidated and Company Financial StatementsFor the years that ended on 30 September 2011 and 2010
40
13 Goodwill, net
The movements of goodwill during the years that ended on 30 September are as follows:
Consolidated2011 2010
Bahtí000 Bahtí000
Opening net book value 3,834,040 933,374Additions - 2,900,666
3,834,040 3,834,040Less: Allowance for impairment (16,580) -
Closing net book value 3,817,460 3,834,040
Impairment loss of goodwill in 2011 was due to the fact that the recoverable amount of the investmentis less than its net book value amount.
The additional goodwill in 2010 arose in connection with the acquisitions of shares in Subtech Ltd.and Unique Mining Services Public Company Limited.

12
111Annual Report 2011
Thor
esen
Thai
Age
ncie
sP
ublic
Com
pany
Lim
ited
Not
esto
Con
solid
ated
and
Com
pany
Fina
ncia
lSta
tem
ents
For
the
year
sth
aten
ded
on30
Sep
tem
ber
2011
and
2010
41
14P
rope
rty,
plan
t,an
deq
uipm
ent,
net
Con
solid
ated
(Bah
tí00
0)Fu
rnit
ure,
Oce
anve
ssel
s,fix
ture
s,su
ppor
tve
ssel
s,m
achi
nery
,B
uild
ings
Bui
ldin
gsu
pply
vess
els,
and
Mot
orM
otor
Con
stru
ctio
nLa
ndan
dfa
ctor
ies
impr
ovem
ents
and
tend
erri
gseq
uipm
ent
vehi
cles
laun
ches
Bar
ges
inpr
ogre
ssTo
tal
At
30S
epte
mbe
r20
10C
ost
622,
891
1,20
8,83
016
2,00
127
,144
,470
3,30
0,25
815
5,47
83,
868
138,
574
2,20
5,35
534
,941
,725
Less
Accu
mul
ated
depr
ecia
tion
-(3
35,8
32)
(90,
558)
(7,3
16,9
64)
(1,2
20,3
98)
(87,
956)
(3,5
92)
(27,
905)
-(9
,083
,205
)Al
low
ance
for
impa
irm
ent
(2,0
15)
--
--
--
--
(2,0
15)
Net
book
valu
e62
0,87
687
2,99
871
,443
19,8
27,5
062,
079,
860
67,5
2227
611
0,66
92,
205,
355
25,8
56,5
05Ad
dD
epos
itsfo
rpu
rcha
ses
ofoc
ean
vess
els
--
-18
5,53
6-
--
--
185,
536
620,
876
872,
998
71,4
4320
,013
,042
2,07
9,86
067
,522
276
110,
669
2,20
5,35
526
,042
,041
For
the
year
that
ende
don
30S
epte
mbe
r20
11O
peni
ngne
tboo
kva
lue
620,
876
872,
998
71,4
4320
,013
,042
2,07
9,86
067
,522
276
110,
669
2,20
5,35
526
,042
,041
Addi
tions
-11
,858
2,57
31,
720,
971
172,
218
10,8
0852
8-
2,17
0,12
24,
089,
078
Dec
onso
lidat
ion
due
todi
spos
als
ofin
vest
men
tsin
subs
idia
ries
--
--
(3,7
62)
(1,1
80)
(249
)-
-(5
,191
)Tr
ansf
er-i
n(o
ut)
-11
,099
14,6
141,
569,
611
37,2
2448
41,
112
-(1
,634
,144
)-
Dis
posa
ls,n
et-
--
(1,2
12,9
42)
(38,
447)
(16,
560)
(116
)-
(964
)(1
,269
,029
)D
epre
ciat
ion
char
ge-
(62,
777)
(15,
999)
(1,5
23,1
39)
(350
,242
)(2
3,01
0)(5
24)
(10,
775)
-(1
,986
,466
)Im
pair
men
tcha
rge
(1,1
49)
--
(132
,082
)-
--
-(2
26,1
63)
(359
,394
)Tr
ansl
atio
nad
just
men
ts-
(11,
052)
138
238,
907
(4,0
13)
(720
)19
0-
65,2
5228
8,70
2
Clo
sing
netb
ook
valu
e61
9,72
782
2,12
672
,769
20,6
74,3
681,
892,
838
37,3
441,
217
99,8
942,
579,
458
26,7
99,7
41
At
30S
epte
mbe
r20
11C
ost
622,
891
1,21
5,16
917
9,77
726
,917
,184
3,31
9,87
111
5,92
72,
209
138,
574
2,81
0,83
235
,322
,434
Less
Accu
mul
ated
depr
ecia
tion
-(3
93,0
43)
(107
,008
)(6
,106
,662
)(1
,427
,033
)(7
8,58
3)(9
92)
(38,
680)
-(8
,152
,001
)Al
low
ance
for
impa
irm
ent
(3,1
64)
--
(136
,154
)-
--
-(2
31,3
74)
(370
,692
)
Net
book
valu
e61
9,72
782
2,12
672
,769
20,6
74,3
681,
892,
838
37,3
441,
217
99,8
942,
579,
458
26,7
99,7
41

12
112 Thoresen Thai Agencies Public Company Limited
Thor
esen
Thai
Age
ncie
sP
ublic
Com
pany
Lim
ited
Not
esto
Con
solid
ated
and
Com
pany
Fina
ncia
lSta
tem
ents
For
the
year
sth
aten
ded
on30
Sep
tem
ber
2011
and
2010
42
14P
rope
rty,
plan
t,an
deq
uipm
ent,
net
(Con
tinue
d)
Com
pany
(Bah
tí00
0)Fu
rnit
ure,
Bui
ldin
gfix
ture
s,an
dM
otor
Land
Bui
ldin
gsim
prov
emen
tseq
uipm
ent
vehi
cles
Tota
l
At
30S
epte
mbe
r20
10C
ost
82,8
4720
1,84
690
,547
60,0
243,
380
438,
644
Less
Accu
mul
ated
depr
ecia
tion
-(1
00,6
63)
(53,
024)
(27,
632)
(1,6
18)
(182
,937
)
Net
book
valu
e82
,847
101,
183
37,5
2332
,392
1,76
225
5,70
7
For
the
year
that
ende
don
30S
epte
mbe
r20
11O
peni
ngne
tboo
kva
lue
82,8
4710
1,18
337
,523
32,3
921,
762
255,
707
Addi
tions
--
-7,
013
-7,
013
Dep
reci
atio
nch
arge
-(1
0,09
2)(7
,559
)(1
1,93
0)(8
60)
(30,
441)
Clo
sing
netb
ook
valu
e82
,847
91,0
9129
,964
27,4
7590
223
2,27
9
At
30S
epte
mbe
r20
11C
ost
82,8
4720
1,84
690
,547
67,0
373,
380
445,
657
Less
Accu
mul
ated
depr
ecia
tion
-(1
10,7
55)
(60,
583)
(39,
562)
(2,4
78)
(213
,378
)
Net
book
valu
e82
,847
91,0
9129
,964
27,4
7590
223
2,27
9

12
113Annual Report 2011
Thoresen Thai Agencies Public Company LimitedNotes to Consolidated and Company Financial StatementsFor the years that ended on 30 September 2011 and 2010
43
14 Property, plant, and equipment, net (Continued)
The depreciation charges during the years that ended on 30 September are classified by function asfollows:
Consolidated Company2011 2010 2011 2010
Bahtí000 Bahtí000 Bahtí000 Bahtí000
Depreciation charge:- cost providing services
- vessel operations 913,282 990,022 - -- offshore services 866,903 584,781 - -- service expenses 15,136 20,225 - -
- costs of sales 87,748 87,848 - -- selling expenses 675 976 - -- administrative expenses 102,722 159,506 30,441 32,133
1,986,466 1,843,358 30,441 32,133
Property, plant, and equipment as of 30 September 2011 used as collateral for loan facilities can besummarised as follows:
Two ocean vessels have been mortgaged with financial institutions as collateral for loan facility ata total value of USD 396 million (2010: USD 396 million).
Five ocean vessels of subsidiaries have been mortgaged with financial institutions as collateralfor their loans at a total value of USD 93.0 million (2010: USD 40.7 million).
Two subsea vessels, one saturation diving system, a tender rig, and three remotely operatedvehicles are mortgaged with various banks as collateral for bank overdraft and loan facilities fora total value of Baht 1,353.0 million and USD 117.6 million (2010: Baht 2,515.7 million and USD115.5 million).
Twelve barges of a subsidiary have been mortgaged with a bank as collateral for its bank overdraftsand long-term loans for a total value of Baht 125.0 million (2010: Baht 125.0 million).
Certain land and buildings of the Group have been mortgaged with various banks as collateral forloan facilities, bank overdraft facilities, and letters of guarantee for a total value of Baht925.0 million (2010: Baht 935.4 million).

12
114 Thoresen Thai Agencies Public Company Limited
Thoresen Thai Agencies Public Company LimitedNotes to Consolidated and Company Financial StatementsFor the years that ended on 30 September 2011 and 2010
44
15 Intangible assets, net
Consolidated
Customerrelationship
Otherintangible
assetsComputer
software
Computersoftware
underinstallation Total
Bahtí000 Bahtí000 Bahtí000 Bahtí000 Bahtí000
At 30 September 2010Cost 564,895 35,758 227,655 93,829 922,137Less Accumulated amortisation (65,179) (28,337) (112,049) - (205,565)
Allowance for impairment - - (12,352) - (12,352)
Net book value 499,716 7,421 103,254 93,829 704,220
For the year that ended on30 September 2011
Opening net book value 499,716 7,421 103,254 93,829 704,220Additions - - 10,550 9,580 20,130Deconsolidation due to disposals
of investments in subsidiaries - - (56) - (56)Transfer in (out) - - 76,696 (76,696) -Disposals, net - - (2,308) - (2,308)Amortisation charge (69,984) (1,114) (42,035) - (113,133)Translation adjustments (800) (464) (62) - (1,326)
Closing net book value 428,932 5,843 146,039 26,713 607,527
At 30 September 2011Cost 563,852 8,255 303,452 26,713 902,272Less Accumulated amortisation (134,920) (2,412) (145,061) - (282,393)
Allowance for impairment - - (12,352) - (12,352)
Net book value 428,932 5,843 146,039 26,713 607,527

12
115Annual Report 2011
Thoresen Thai Agencies Public Company LimitedNotes to Consolidated and Company Financial StatementsFor the years that ended on 30 September 2011 and 2010
45
15 Intangible assets, net (Continued)Company
Computersoftware
Computersoftware under
installation TotalBahtí000 Bahtí000 Bahtí000
At 30 September 2010Cost 88,288 93,829 182,117Less Accumulated amortisation (29,783) - (29,783)
Allowance for impairment (12,352) - (12,352)
Net book value 46,153 93,829 139,982
For the year that ended on 30 September 2011Opening net book value 46,153 93,829 139,982Additions 274 9,580 9,854Transfer in (out) 76,696 (76,696) -Amortisation charge (24,270) - (24,270)
Closing net book value 98,853 26,713 125,566
At 30 September 2011Cost 165,259 26,713 191,972Less Accumulated amortisation (54,054) - (54,054)
Allowance for impairment (12,352) - (12,352)
Net book value 98,853 26,713 125,566
16 Other assets, netConsolidated Company2011 2010 2011 2010
Bahtí000 Bahtí000 Bahtí000 Bahtí000
Deferred dry docking expenses 865,297 1,551,119 - -Less Accumulated amortisation (562,083) (981,124) - -
Allowance for impairment (2,800) - - -
Deferred dry dockingexpenses, net 300,414 569,995 - -
Prepaid long-term leases -land use rights, net 12,964 17,638 - -
Insurance claims 431,452 449,173 - -Deferred arrangement fee
for loan - 67,479 - 42,552Restricted deposit at a financial
institution over 1 year 124,110 - - -Other assets 75,534 161,809 1,676 1,680
Total other assets 944,474 1,266,094 1,676 44,232
The restricted deposit at a financial institution, which matures over one year from now, is pledgedagainst long-term loans with a local financial institution. The restricted deposit must be maintained in aminimum amount of the next two principals and interest payments after the two-year grace periodexpires.

12
116 Thoresen Thai Agencies Public Company Limited
Thoresen Thai Agencies Public Company LimitedNotes to Consolidated and Company Financial StatementsFor the years that ended on 30 September 2011 and 2010
46
17 Bank overdrafts
Bank overdraft facilities of the Group amounting to Baht 274 million (2010: Baht 254 million) areguaranteed by the Company and subsidiaries, and a mortgage of the Groupís land and buildings (Note14).
As at 30 September 2011, the Group has unused bank overdraft facilities amounting to Baht 271.7million (2010: Baht 248 million).
18 Short-term loans
Consolidated Company2011 2010 2011 2010
Bahtí000 Bahtí000 Bahtí000 Bahtí000
Short-term loans 164,000 503,000 - -Trust receipts 1,246,277 1,102,983 - -
Total short-term loans 1,410,277 1,605,983 - -
As at 30 September 2011, UMS, a subsidiary, has unused facilities of unsecured short-term loans inthe form of promissory notes and bills of exchange from local financial institutions and trust receiptsamounting to Baht 365.0 million and Baht 1,412.7 million, respectively. (2010: Baht 172.0 million, andBaht 1,553.5 million, respectively).
19 Long-term loans, net
The movements of long-term loans during the years that ended on 30 September are as follows:
Consolidated Company2011 2010 2011 2010
Bahtí000 Bahtí000 Bahtí000 Bahtí000
Beginning balance 6,327,239 2,835,529 - -Acquisition of subsidiaries (Note 10) - 770,187 - -Additions during the year 4,210,109 6,684,970 - 2,601,528Decrease from disposals of investments
in subsidiaries (Note 10) - (517,482) - -Repayments during the year (2,951,197) (3,204,559) - (2,577,387)Realised gains on exchange rate (16,390) (33,171) - (24,141)Unrealised (gains) losses on
exchange rate 87,110 (167,093) - -Translation adjustments 99,307 (41,142) - -
Ending balance 7,756,178 6,327,239 - -

12
117Annual Report 2011
Thoresen Thai Agencies Public Company LimitedNotes to Consolidated and Company Financial StatementsFor the years that ended on 30 September 2011 and 2010
47
19 Long-term loans, net (Continued)
Maturity of long-term loans is as follows:
Consolidated Company2011 2010 2011 2010
Bahtí000 Bahtí000 Bahtí000 Bahtí000
Within 1 year 1,062,215 1,106,260 - -
Between 1 year and 5 years 3,316,181 3,064,368 - -After 5 years 3,377,782 2,156,611 - -
Long-term portion 6,693,963 5,220,979 - -
7,756,178 6,327,239 - -
Long-term loans comprise the following:
a) Loans for the purchases and constructions of ocean vessels, tender rigs, vessel equipment, andbarges
- Loans for the purchase and construction of ocean vessels are granted by foreignsyndicated banks and are denominated in US Dollars with a total outstanding balance ofUSD 92.7 million as at 30 September 2011 (2010: USD 40.7 million) with repayment termswithin 12-17 years from the vessel delivery date. As at 30 September 2011, interest ratesand securities on the loans are as follows:
The loan balance of USD 39.3 million (30 September 2010: USD 20.0 million): bothfixed rate and BBA - LIBOR plus a certain margin and is secured by a mortgage ofthe vessels and a corporate guarantee given by the Company.
The loan balance of USD 53.4 million (30 September 2010: USD 20.7 million): LIBORplus a certain margin and is secured by mortgages of two of the Groupís oceanvessels and subsequently by the newbuild or second-hand vessels that have beenacquired, assignment of insurance for the collateral vessels, pledge or change overbank accounts, and a corporate guarantee by the Company.
- Loans for the purchase of support vessels and equipment are granted by local commercialbanks and are denominated in Thai Baht and US Dollars, having a total outstanding balance ofBaht 653.9 million and USD 97.6 million as at 30 September 2011 (30 September 2010: Baht945.6 million and USD 91.0 million) with repayment terms within 5 - 10 years. As at 30September 2011, interest rates on the Thai Baht loans and US Dollar loans are as follows:
The loan balance of Baht 653.9 million (30 September 2010: Baht 945.6 million): three-month fixed deposit rates plus a certain margin.
The loan balance of USD 97.6 million (30 September 2010: USD 91.0 million): USD-LIBORplus a certain margin.
These loans are currently secured by mortgages of vessel equipment as mentioned in Note 14and are guaranteed by a subsidiary.

12
118 Thoresen Thai Agencies Public Company Limited
Thoresen Thai Agencies Public Company LimitedNotes to Consolidated and Company Financial StatementsFor the years that ended on 30 September 2011 and 2010
48
19 Long-term loans, net (Continued)
a) Loans for the purchases and constructions of ocean vessels, tender rigs, vessel equipment, andbarges (Continued)
- Loans for the purchase of barges are granted by a local commercial bank and aredenominated in Thai Baht with a total outstanding balance of Baht 45.4 million as at 30September 2011 (2010: Baht 84.3 million) with repayment term within 7 years. This loanbears interest at the rate of MLR minus certain margins, and is secured by mortgages ofbarges as mentioned in Note 14.
- Loan for the purchase of a tender rig is granted by a local commercial bank and is denominatedin US Dollars with a total outstanding balance of USD 8.2 million as at 30 September 2011(2010: USD 18.5 million) with repayment term within 9 years. This loan bears interest at therate of USD-LIBOR plus a certain margin, is secured by mortgages of the tender rig asmentioned in Note 14, and guaranteed by the two subsidiaries.
According to a condition of the loan agreements, the Company and its subsidiaries are notallowed to create any encumbrance on the assets which are used as collateral, exceptobtaining prior consent of the banks and permitted liens. The Company and its subsidiariesmust comply with other conditions and restrictions stated in the term loan agreements.
b) Loans for the construction of a building and warehouse are granted by local commercial banksand are denominated in Thai Baht with a total outstanding balance of Baht 122.6 million as at30 September 2011 (2010: Baht 149.9 million) and repayment terms within 6.5 - 8 years. As at30 September 2011, interest rates and the detail of mortgages are as follows:
The loan balance of Baht 96.9 million (2010: Baht 112.4 million): MLR minus a certainmargin. The loans are secured by mortgages of the subsidiaryís land & buildings andguaranteed by the Company.
The loan balance of Baht 25.7 million (2010: Baht 37.5 million): the 1 - year fixed depositrate for personal account plus a certain margin. The loans are secured by mortgages of thesubsidiaryís land & buildings and guaranteed by the Company.
c) Loans for the purchase of land and construction of a building are granted by a local commercialbank and are denominated in Thai Baht with no outstanding balance as at 30 September 2011(2010: Baht 36.0 million).
d) Loans for the construction of machine and warehouses and working capital are granted bylocal commercial banks and are denominated in Thai Baht with a total outstanding balance ofBaht 734.1 million as at 30 September 2011 (2010: Baht 533.9 million) and repayment termswithin 3-7 years. These loans bear interest at the rate of MLR minus certain margins, aresecured by mortgages of subsidiaryís partial land and construction on that land and a part ofUMSís inventories as mentioned in Note 8.
As at 30 September 2011, the Company in capacities as a guarantor for loans undertaken bysubsidiaries and MMPLCís subsidiary and UMS as borrowers had breached loan covenants. TheCompany and MMPLCís subsidiary have obtained lendersí written consents to the waiver of financialcovenants with the next testing date for the covenants of 30 September 2012. The status of discussionbetween UMS and the relevant banks is on process. The Companyís management is of the opinionthat the outcome will not result in a material adverse effect.

12
119Annual Report 2011
Thoresen Thai Agencies Public Company LimitedNotes to Consolidated and Company Financial StatementsFor the years that ended on 30 September 2011 and 2010
49
19 Long-term loans, net (Continued)
The carrying amounts of the long-term loans are denominated in the following currencies:
Consolidated Company2011 2010 2011 2010
Bahtí000 Bahtí000 Bahtí000 Bahtí000
Currency- USD 6,200,213 4,577,536 - -- Baht 1,555,965 1,749,703 - -
7,756,178 6,327,239 - -
The interest rate risk of the long-term loans of the Group is as follows:
Consolidated Company2011 2010 2011 2010
Bahtí000 Bahtí000 Bahtí000 Bahtí000
At fixed rates 612,193 304,549 - -At floating rates 7,143,985 6,022,690 - -
Total loans 7,756,178 6,327,239 - -
Credit facilities
As at 30 September 2011, the available credit facilities from financial institutions are USD 401.8million, which will mainly be used for acquisitions of ocean vessels (2010: USD 570.4 million).
20 Finance lease liabilitiesConsolidated Company2011 2010 2011 2010
Bahtí000 Bahtí000 Bahtí000 Bahtí000
Finance lease liabilities 9,023 40,323 - -Less Deferred interest expenses (871) (3,215) - -
Total finance lease liabilities 8,152 37,108 - -
Maturities of finance lease liabilities are as follows:
Current portion of financelease liabilities 4,272 24,151 - -
Long-term portion of financelease liabilities 3,880 12,957 - -
8,152 37,108 - -
As at 30 September 2011, finance lease liabilities arising from purchases of motor vehicles, computerequipment, and warehouse equipment carry fixed interest rates (2010: fixed interest rates). The leaseshave periods within 3 to 5 years without guarantee.

12
120 Thoresen Thai Agencies Public Company Limited
Thoresen Thai Agencies Public Company LimitedNotes to Consolidated and Company Financial StatementsFor the years that ended on 30 September 2011 and 2010
50
21 Employee benefit obligations
Maturities of employee benefit obligations are as follows:
Consolidated Company2011 2010 2011 2010
Bahtí000 Bahtí000 Bahtí000 Bahtí000
Current portion of employeebenefit obligations 61,031 66,151 - -
Long-term portion of employeebenefit obligations 106,321 99,407 16,367 11,693
Employee benefit obligations 167,352 165,558 16,367 11,693
Charge to statement of income 80,185 123,443 8,118 9,948
Consolidated Company2011 2010 2011 2010
Bahtí000 Bahtí000 Bahtí000 Bahtí000
Balance sheet obligations for:Retirement benefits 106,321 89,475 16,367 11,693Retention incentives 61,031 76,083 - -
167,352 165,558 16,367 11,693
a) Retirement benefits
The movement in the defined benefit obligations over the year is as follows:
Consolidated Company2011 2010 2011 2010
Bahtí000 Bahtí000 Bahtí000 Bahtí000
Beginning balance 89,475 78,769 11,693 1,745Additional from investments in
a new subsidiary - 6,569 - -Deconsolidation due to disposals
of investments in subsidiaries (8,735) - - -Current service costs 29,392 17,523 7,783 486Interest costs 2,241 2,849 335 80Actuarial (gains) losses (1,201) 27,275 - 9,382Benefits paid (7,575) (41,748) (3,444) -Translation adjustment 2,724 (1,762) - -
Ending balance 106,321 89,475 16,367 11,693

12
121Annual Report 2011
Thoresen Thai Agencies Public Company LimitedNotes to Consolidated and Company Financial StatementsFor the years that ended on 30 September 2011 and 2010
51
21 Employee benefit obligations (Continued)
The amounts recognised in the statements of income are as follows:
Consolidated Company2011 2010 2011 2010
Bahtí000 Bahtí000 Bahtí000 Bahtí000
Current service costs 29,392 17,523 7,783 486Interest costs 2,241 2,849 335 80Amortisation of actuarial (gains)
losses (1,201) 27,275 - 9,382
Total (included in staff costs) 30,432 47,647 8,118 9,948
The principal actuarial assumptions used were as follows:
Consolidated Company2011 2010 2011 2010
Discount rate 3.5% - 13% 3.5% - 13% 3.5% 3.5%Future salary increases 6% - 15% 6% - 15% 6% 6%Mortality rate 0.01% - 1.48% 0.01% - 1.48% 0.11% - 1.48% 0.11% - 1.48%Resignation rate 0% - 50% 0% - 50% 0% - 20% 0% - 20%
b) Retention incentives
The amounts recognised in the balance sheet are determined as follows:
Consolidated Company2011 2010 2011 2010
Bahtí000 Bahtí000 Bahtí000 Bahtí000
Present value of obligations 61,031 76,083 - -
The movement in the retention incentive obligations during the year is as follows:
Consolidated Company2011 2010 2011 2010
Bahtí000 Bahtí000 Bahtí000 Bahtí000
Beginning of the year 76,083 137,694 - -Current service cost 49,753 75,796 - -Paid during the year (66,354) (121,572) - -Effects from disposal of
investments in subsidiaries - (3,335) - -Realised gains on exchange rate (251) - - -Unrealised (gains) losses on
exchange rate 1,800 (12,500) - -
Ending balance 61,031 76,083 - -

12
122 Thoresen Thai Agencies Public Company Limited
Thoresen Thai Agencies Public Company LimitedNotes to Consolidated and Company Financial StatementsFor the years that ended on 30 September 2011 and 2010
52
21 Employee benefit obligations (Continued)
The amounts recognised in the statements of income are as follows:
Consolidated Company2011 2010 2011 2010
Bahtí000 Bahtí000 Bahtí000 Bahtí000
Current service cost 49,753 75,796 - -
These amounts are included in service, selling, and administrative expenses.
22 Bonds, net
Initial bonds comprise the following:
Consolidated and CompanyConvertible bonds Thai Baht bonds Total
Bahtí000 Bahtí000 Bahtí000
Bonds 5,808,858 4,000,000 9,808,858Less Issuing costs (179,314) (7,244) (186,558)
Bonds, net 5,629,544 3,992,756 9,622,300
Convertible bonds
On 24 September 2007, the Company issued unsecured convertible bonds of USD 169.80 million. Theconvertible bonds were listed for trading on the SGX-ST on 25 September 2007. The convertible bondswere offered to non-US persons outside the United States in reliance of Regulation S under theSecurities Act of Singapore.
The convertible bonds were issued at par with a face value of USD 300,000 per bond. Interest ispayable semi-annually in arrears at an annual interest rate of 2.50%. Each bond is convertible at anytime up to maturity at an initial conversion ratio at 171,535.8932 shares per bond (a fixed exchangerate of 34.25 Baht per 1 USD and initial conversion price of 59.90 Baht). The conversion period is from30 October 2007 onwards. The Company may, at its option, elect to make the cash settlement amountto the relevant bondholder in lieu of delivering shares of a converting bondholder.
The nominal value of the bond will be amortised as follows:
Date Redemption amount
1st Redemption Amount 24 September 2010 USD 109,6402nd Redemption Amount 24 September 2011 USD 113,2203rd Redemption Amount 24 September 2012 USD 117,000
The Company has an option, at redemption, to settle the redemption amount in form of ordinaryshares or in cash.

12
123Annual Report 2011
Thoresen Thai Agencies Public Company LimitedNotes to Consolidated and Company Financial StatementsFor the years that ended on 30 September 2011 and 2010
53
22 Bonds, net (Continued)
Convertible bonds (Continued)
The movement of convertible bonds during the years that ended on 30 September is as follows:
Consolidated and Company2011 2010
Bahtí000 Bahtí000
Opening net balance 2,261,482 4,001,485Redemption (1,194,288) (1,162,455)Convertible bonds cancellation - (341,246)Reversal on premium accruals and issuing costs - (26,681)Premium 59,959 105,603Amortisation of issuing cost 20,060 30,467Realised gains on exchange rates (98,752) (108,141)Unrealised (gains) losses on exchange rates 157,280 (237,550)
Closing net balance 1,205,741 2,261,482
Convertible bonds are due for redemption as follows:Redemption within one year 1,205,741 1,047,259Redemption after one year - 1,214,223
1,205,741 2,261,482
Interest expenses on the convertible bonds are calculated using the effective interest method byapplying the effective interest rate of 6.3% per annum, inclusive of bond issuing costs.
Bond cancellation and redemption
In July 2010, the Company repurchased and cancelled a portion of the outstanding bonds amounting toUSD 10.5 million, representing 9.26% of the outstanding principal amount of the bonds. The aggregateprincipal amount of the convertible bonds outstanding after the repurchase and cancellation of theconvertible bonds is USD 102.9 million with the conversion price of Baht 51.41 per share.
In September 2010, the Company redeemed one-thirds of the outstanding principal amount of USD 102.9million or USD 34.3 million by cash at the redemption price of USD 109,640 per bond. Therefore, the initialprincipal amount of each bond after the first redemption is USD 200,000. The aggregate principal amountof the convertible bonds after the first redemption is USD 68.6 million with the conversion price of Baht51.41 per share.
In September 2011, the Company redeemed a half of the outstanding principal amount of USD 68.6 millionor USD 34.3 million by cash at the redemption price of USD 113,220 per bond. Therefore, the initialprincipal amount of each bond after the second redemption is USD 100,000. The aggregate principalamount of the convertible bonds after the second redemption is USD 34.3 million with the conversion priceof Baht 50.35 per share.

12
124 Thoresen Thai Agencies Public Company Limited
Thoresen Thai Agencies Public Company LimitedNotes to Consolidated and Company Financial StatementsFor the years that ended on 30 September 2011 and 2010
54
22 Bonds, net (Continued)
Thai Baht bonds
In July 2010, the Company issued and sold two tranches of unsubordinated and unsecured Thai Bahtbonds at face value worth Baht 4 billion. The details of bonds are as follows:
Bond No. Number of unitsFace value /unit
(Baht)Interest rate
(% per annum) Maturity dated
Tranche 1 2,000,000 1,000 3.60% 9 July 2015Tranche 2 2,000,000 1,000 3.82% 29 June 2017
The Thai Baht bonds were issued at par with a face value of Baht 1,000 per unit. The term of the firsttranche is five years from issue date and the term of the second tranche is six years, eleven monthsand twenty days from the issue date. The Company will pay interest every three months and will paythe entire principal amount at the maturity date.
The movement of Thai Baht bonds during the years that ended on 30 September is as follows:
Consolidated and Company2011 2010
Bahtí000 Bahtí000
Opening net balance 3,993,042 -Addition - 4,000,000Deferred issuing costs - (7,244)Amortisation on deferred issuing costs 1,242 286
Closing net balance 3,994,284 3,993,042
Thai Baht bonds are due for redemption in years 2015 and 2017.
23 Share capital and premium on share capital
Registeredshares
(Number of
Issued andpaid-upshares
Sharepremium Total
share) (Bahtí000) (Bahtí000) (Bahtí000)
At 1 October 2009 933,052,865 708,004 1,540,410 2,248,414Reduction of registered shares (50,048,452) - - -Increase of registered shares 50,000,000 - - -
At 30 September 2010 933,004,413 708,004 1,540,410 2,248,414Reduction of registered shares (150,000,000) - - -Increase of registered shares 50,000,000 - - -
At 30 September 2011 833,004,413 708,004 1,540,410 2,248,414

12
125Annual Report 2011
Thoresen Thai Agencies Public Company LimitedNotes to Consolidated and Company Financial StatementsFor the years that ended on 30 September 2011 and 2010
55
23 Share capital and premium on share capital (Continued)
Share capital
At the Annual General Meeting of Shareholders held on 2 March 2011, shareholders approved thefollowing matters:
- Reduction of registered share capital from Baht 933,004,413 to Baht 783,004,413 by cancellingthe 50,000,000 unissued shares reserved for private placement shares and 100,000,000authorised but unissued shares which have been reserved for the conversion of some portion ofthe existing convertible bonds issued in 2007 that have been repurchased and cancelled as wellas redeemed by the Company and an amendment to Clause 4 of the Memorandum of Associationregarding this matter.
- An increase of registered share capital from Baht 783,004,413 to Baht 833,004,413, an increase of50,000,000 shares with a par value of Baht 1 per share, to be reserved for private placementshares and an amendment to Clause 4 of the Memorandum of Association regarding this matter.
- Allocation of new 50,000,000 ordinary shares to be reserved for private placement.
- The issue and offer up to 4,000,000 free warrants to directors and employees of Mermaid MaritimePublic Company Limited (ì MMPLCî ) or its subsidiaries under ESOP Scheme.
The registrations of share capital reduction and increase were completed on 10 March 2011 and11 March 2011, respectively.
At the Annual General Meeting of Shareholders held on 29 January 2010, shareholders approved thefollowing matters:
- Reduction of registered share capital from Baht 933,052,865 to Baht 883,004,413 by cancellingthe 50,000,000 unissued shares reserved for private placement shares and 48,452 unallocatedstock dividends shares and an amendment to Clause 4 of the Memorandum of Associationregarding this matter.
- An increase of registered share capital from Baht 883,004,413 to Baht 933,004,413, an increase of50,000,000 shares, to be reserved for private placement shares and an amendment to Clause 4 ofthe Memorandum of Association regarding this matter.
- Allocation of new 50,000,000 ordinary shares to be reserved for private placement.
- The issue and offer up to 4,000,000 free warrants to directors and employees of MermaidMaritime Public Company Limited (ì MMPLCî ) or its subsidiaries under ESOP 2010 pursuant to itsterms as required by the notification No. Tor Jor 32/2551 of the Securities and ExchangeCommission of Thailand.
The registrations of share capital reduction and increase were completed on 9 February 2010 and10 February 2010, respectively.
As at 30 September 2011, the total authorised share capital of the Company is Baht 833,004,413divided into 833,004,413 ordinary shares (2010: 933,004,413 shares) with a par value of Baht 1 pershare (2010: Baht 1 per share). The paid-up share capital is Baht 708,004,413 divided into 708,004,413ordinary shares (2010: 708,004,413 shares) with a par value of Baht 1 per share (2010: Baht 1 per share).

12
126 Thoresen Thai Agencies Public Company Limited
Thoresen Thai Agencies Public Company LimitedNotes to Consolidated and Company Financial StatementsFor the years that ended on 30 September 2011 and 2010
56
24 Cash flows from operating activities
Reconciliation of net profit to cash flows from operating activities is as follows:
For the years that ended on 30 SeptemberConsolidated Company2011 2010 2011 2010
Notes Bahtí000 Bahtí000 Bahtí000 Bahtí000
Profits before income taxes 411,449 922,556 772,915 2,897,787Adjustments for:
Depreciation charges 14 1,986,466 1,843,358 30,441 32,133Amortisation on intangible assets 15 113,133 118,668 24,270 13,633Amortisation on deferred dry-docking expenses 391,772 577,000 - -Amortisation on prepayments 3,571 7,076 - -Amortisation and write-off of deferred arrangement fee
for loan 65,440 28,504 42,602 28,504Additional allowance for doubtful accounts
and provision for unrecoverable value added tax (97,189) 156,084 - -Impairment on vessels supplies and spare parts 16,761 - - -Impairment on property, plant, and equipment 359,395 - - -Impairment (reverse) on intangible assets - (753) - (753)Impairment on investment - - 76,831 -Impairment on goodwill 13 16,580 - - -Impairment on deferred dry-docking expenses 2,717 - - -Convertible bond interest expenses 141,922 243,487 141,922 243,487Losses from adjustment of investment in an associate 11 - 9,459 - -Interest expenses 477,685 267,128 177,182 109,195Losses from write-off of property, plant, and equipment 2,677 4,871 - -Losses from write-off of pending for insurance claim
and deposit 94,248 - - -Net (gains) losses from sales of property, plant,
and equipment and intangible assets 30 (588,566) (499,805) (66) 2Dividend income from short-term investments (4,022) (11,914) (4,022) (3,775)Dividends income from subsidiaries, associates,
and joint venture - - (1,098,551) (3,175,082)Gains from convertible bonds cancellation 30 - (9,634) - (9,634)Net (gains) losses from sales of investments in
subsidiaries 30 486 180,942 (7,380) -Net gains from sales of investment in associates 30 - (343,682) - -Net gains from sales of short-term investments (4,955) (33,456) (4,955) (33,456)Share of profits of associates and a joint venture 11, 12 (110,229) (80,306) - -Unrealised (gains) losses on exchange
rates from cash, short-term investments, loans,and convertible bonds 149,067 (106,997) 49,869 (12,193)
Realised gains on exchange rates fromloans, and convertible bonds (114,803) (106,699) (105,966) (132,815)
Exchange difference from conversionof overseas companies (58,581) (270,235) - -
Changes in operating assets and liabilities(excluding the effects of acquisition and disposal)
- Trade accounts receivable (1,090,159) 674,243 - -- Amounts due from related parties (151,881) 4,989 (313,800) (111,829)- Inventories (264,332) (164,976) - -- Vessel supplies and spare parts 74,194 (32,833) - -- Prepayments 28,746 (23,472) (916) (303)- Other current assets (579,359) (338,948) (14,706) (4,386)- Other assets (111,607) (50,582) 1,195 (70,526)- Trade accounts payable (32,033) (465,577) 7,912 6,321- Amounts due to related parties (10,692) (9,628) 17,217 (1,040)- Other accounts payable 39,904 (287,417) 89 (15)- Advances from customers (48,165) 119,518 - -- Accrued income taxes 115,402 77,217 - -- Accrued expenses (47,951) 102,010 (15,291) (14,039)- Other current liabilities (76,441) (154,011) 1,410 681- Employee benefit obligations 11,037 (57,475) 4,674 9,948
Cash generated from operations 1,111,687 2,288,710 (217,124) (228,155)- Interest paid (533,186) (323,960) (224,524) (182,683)- Income taxes paid (433,509) (312,252) (5,020) (3,526)
Net cash receipts (payments) from operating activities 144,992 1,652,498 (446,668) (414,364)

12
127Annual Report 2011
Thoresen Thai Agencies Public Company LimitedNotes to Consolidated and Company Financial StatementsFor the years that ended on 30 September 2011 and 2010
57
25 Operating profits
The following significant expenses, classified by nature, other than those already disclosed in thestatements of income were charged to arrive at operating profits (losses):
Consolidated Company2011 2010 2011 2010
Bahtí000 Bahtí000 Bahtí000 Bahtí000
Expenses included in vesseloperating expenses
Vessel supplies and sparepartsexpenses and repair andmaintenance expenses 805,841 1,089,671 - -
Crew and staff costs 461,447 637,721 - -Charter hire 1,201,299 2,334,377 - -
Expenses included in offshoreservice expenses
Vessel supplies and sparepartsexpenses and repair andmaintenance expenses 974,535 786,063 - -
Crew, staff costs, andsubcontractor costs 2,534,713 1,737,176 - -
Charter hire and equipment rental 263,320 177,875 - -
Expenses included in costs of salesCost of raw materials 5,154,320 3,762,649 - -Supplies and spare parts expenses
and repair and maintenance expenses 37,540 23,982 - -Staff costs 45,078 40,877 - -
Expenses included in service, selling,and administrative expenses
Staff costs 847,838 1,025,726 112,967 163,732
26 Corporate income tax
Income taxes as shown in the consolidated and Company statements of income are calculated basedon net taxable income from non-BOI activities using a principal tax rate for operations in Thailand andspecific tax rates applicable to each respective country for overseas operations. Non-BOI activitiescomprise shipping related services such as agency, drilling services outside Thailand, other offshorerelated services, and production and trading of fertiliser and coal.

12
128 Thoresen Thai Agencies Public Company Limited
Thoresen Thai Agencies Public Company LimitedNotes to Consolidated and Company Financial StatementsFor the years that ended on 30 September 2011 and 2010
58
27 Earnings per share
Basic earnings per share are calculated by dividing the net profits attributable to shareholders by theweighted average number of ordinary shares issued during the year.
Consolidated Company2011 2010 2011 2010
Net profits attributable toshareholders (Baht) 139,473,366 795,573,570 772,915,236 2,897,787,113
Weighted average number ofordinary shares in issue (Shares) 708,004,413 708,004,413 708,004,413 708,004,413
Basic earnings per share (Baht) 0.20 1.12 1.09 4.09
There was no potential dilution in earnings per share from the convertible bonds, because the averageshare price during this year was lower than the exercise price.
28 Legal reservesConsolidated Company
2011 2010 2011 2010Bahtí000 Bahtí000 Bahtí000 Bahtí000
Opening balance 93,500 93,500 93,500 93,500Appropriation during the year - - - -
Closing balance 93,500 93,500 93,500 93,500
Under the Public Limited Company Act., B.E. 2535, the Company is required to set aside as legalreserve at least 5% of its annual net profit after accumulated deficits brought forward (if any) until thereserve is not less than 10% of the registered capital. The legal reserve is non-distributable.
29 Dividends paid
a) For the year that ended on 30 September 2011
The Company
At the Annual General Meeting of Shareholders which was rescheduled on 2 March 2011, theshareholders approved the annual dividend payment from the net income of the Company forthe year that ended on 30 September 2010 of Baht 0.26 per share amounting to Baht 183.4million. The annual dividend payment was made on 23 March 2011. However, dividends ofBaht 674,295 were not paid to certain shareholders due to disqualification.
At the Board of Directors Meeting held on 20 June 2011, the Company approved an interimdividend payment from the retained earnings of the Company as at 31 March 2011 of Baht 0.50per share amounting to Baht 353.7 million. The interim dividend payment was made on 18 July2011. However, dividends of Baht 301,822 were not paid to certain shareholders due todisqualification.
As a result of the dividend payment, the conversion price of convertible bonds was adjusted toBaht 50.35 per share (previously Baht 51.41 per share). The adjusted conversion price waseffective from 5 July 2011.

12
129Annual Report 2011
Thoresen Thai Agencies Public Company LimitedNotes to Consolidated and Company Financial StatementsFor the years that ended on 30 September 2011 and 2010
59
29 Dividends paid (Continued)
a) For the year that ended on 30 September 2011 (Continued)
MMPLC
The Board of Directors Meeting of MMPLC held on 11 February 2011 approved to pay an interimdividend in respect of the retained earnings as at 31 December 2010 of Baht 0.58 per shareamounting to Baht 455.2 million. The dividend was paid to the shareholders on 11 March 2011.
b) For the year that ended on 30 September 2010
The Company
At the Annual General Meeting of Shareholders held on 29 January 2010, shareholdersapproved the annual dividend payment from the net income of the Company for the year that endedon 30 September 2009 at Baht 0.54 per share amounting to Baht 379.4 million. The annual dividendpayment was made on 23 February 2010. However, dividends of Baht 2,902,848 were not paidto certain shareholders due to disqualification.
As a result of the cash dividend payment, the conversion price of convertible bonds was adjustedto Baht 51.41 per share (previously Baht 51.43 per share) with effective from 9 February 2010.
30 Other operating incomeFor the years that ended on 30 September
Consolidated Company2011 2010 2011 2010
Bahtí000 Bahtí000 Bahtí000 Bahtí000
Dividend income 4,022 11,914 1,102,573 3,178,857Gains on convertible bonds
cancellations - 9,634 - 9,634Realised gains on currency and
cross currency swap agreements 400,627 157,325 4,088 -Gains on oil hedging contracts 21,444 - 21,444 -Gains on sales of fixed assets
and intangible assets 588,566 499,805 66 -Net gains (losses) on sale of
investments in subsidiariesand associates (486) 162,740 7,380 -
Gain on sales of marketablesecurities 4,955 33,456 4,955 33,456
Interest income 139,891 94,654 287,508 249,568Gains on exchange rates 91,777 24,336 61,807 97,123Reversal of allowance for
doubtful accounts 34,969 - - -Insurance claim received 53,074 3,584 - -Management fee income 147,601 - 5,280 2,931Compensation for agreement
termination 76,986 - - -Service charge and office and
office equipment rental income 20,920 2,895 77,173 38,434Other income 75,936 109,966 2,919 1,423
Total other operating income 1,660,282 1,110,309 1,575,193 3,611,426

12
130 Thoresen Thai Agencies Public Company Limited
Thoresen Thai Agencies Public Company LimitedNotes to Consolidated and Company Financial StatementsFor the years that ended on 30 September 2011 and 2010
60
31 Related parties
Enterprises and individuals that directly or indirectly through one or more intermediaries, control, orare controlled by, or are under common control with, the Company, including holding companies,subsidiaries, and fellow subsidiaries are related parties of the Company. Associates and individualsowning, directly or indirectly, an interest in the voting power of the Company that gives themsignificant influence over the enterprise, key management personnel, including directors and officersof the Company and close members of the family of these individuals and companies associated withthese individuals, also constitute related parties.
In considering each possible related party relationship, attention is directed to the substance of therelationship and not merely the legal form.
31.1 Related party transactions
Significant related party transactions between the Company and its subsidiaries and associates areas follows:
a) Transactions with subsidiaries during the years that ended on 30 September are as follows:Company
2011 2010Bahtí000 Bahtí000
IT service and office and office equipment rental income 64,195 38,100Management fee income 5,280 2,931Interest income 275,649 242,926Interest expenses 28,782 37,492
b) Transactions with associates and a joint venture during the years that ended on 30 Septemberare as follows:
Consolidated Company2011 2010 2011 2010
Bahtí000 Bahtí000 Bahtí000 Bahtí000
IT service and office and officeequipment rental income 18,178 1,834 6,681 -
Management fee income 147,601 - - -Compensation for agreement
termination 76,986 - - -Interest income 89,990 50,001 357 636Vessel operating expenses 33,398 - - -Offshore service expenses 25,910 39,097 - -Management and
administrative fee 15,624 17,637 - -
The Groupís policy for related party transactions is as follows:
- Service income is transacted at prices normally charged to a third party.- Office and office equipment rental income is transacted at prices normally charged by a third party.- Management and administrative fee is transacted at cost plus margin.- Vessel operating expenses and offshore service expenses are transacted at prices normally charged
to a third party.- The interest rates charged on short-term borrowings are at 1.25% per annum (2010: 1.25% per annum).- The interest rates charged on long-term loans are based on approximate the borrowing costs of
the lender.

12
131Annual Report 2011
Thoresen Thai Agencies Public Company LimitedNotes to Consolidated and Company Financial StatementsFor the years that ended on 30 September 2011 and 2010
61
31 Related parties (Continued)
31.2 Amounts due from related parties
Amounts due from related parties as at 30 September in the consolidated and Company financialstatements comprise the following:
Consolidated Company2011 2010 2011 2010
Bahtí000 Bahtí000 Bahtí000 Bahtí000
Associate and a joint venture 206,745 403 3,035 89Subsidiaries - - 431,158 120,304
206,745 403 434,193 120,393
Amounts due from associate and a joint venture include advances for share subscription in SKIEnergy Resources Inc. (ì SERIî ) totalling USD 5 million (2010: Nil).
31.3 Amounts due to related parties
Amounts due to related parties as at 30 September in the consolidated and Company financial statementscomprise the following:
Consolidated Company2011 2010 2011 2010
Bahtí000 Bahtí000 Bahtí000 Bahtí000
Associates and a joint venture 7,173 9,583 - -Subsidiaries - - 19,271 2,054
7,173 9,583 19,271 2,054
31.4 Loans to/from related parties
a) Loans to related parties as at 30 September in the consolidated and Company financialstatements comprise the following:
Consolidated Company2011 2010 2011 2010
Bahtí000 Bahtí000 Bahtí000 Bahtí000
Short-term loansSubsidiaries - - 5,356,407 3,703,287Associate - - - -
- - 5,356,407 3,703,287
Short-term loans to subsidiaries can be called at any time and are unsecured. The loansmainly bear interest at 1.25% per annum (2010: 1.25% per annum).

12
132 Thoresen Thai Agencies Public Company Limited
Thoresen Thai Agencies Public Company LimitedNotes to Consolidated and Company Financial StatementsFor the years that ended on 30 September 2011 and 2010
62
31 Related parties (Continued)
31.4 Loans to/from related parties (Continued)
a) Loans to related parties as at 30 September in the consolidated and Company financialstatements comprise the following: (Continued)
Consolidated Company2011 2010 2011 2010
Bahtí000 Bahtí000 Bahtí000 Bahtí000
Long-term loansSubsidiaries - - 4,917,258 4,991,729Associates and joint venture 620,284 372,315 3,323 7,323
620,284 372,315 4,920,581 4,999,052
Maturity of long-term loans to related parties is as follows:
Consolidated Company2011 2010 2011 2010
Bahtí000 Bahtí000 Bahtí000 Bahtí000
Within 1 year 34,253 4,000 174,423 163,636Between 1 year and 5 years 586,031 368,315 4,746,158 4,835,416
620,284 372,315 4,920,581 4,999,052
Consolidated
On 14 August 2009, Soleado Holdings Pte. Ltd., a wholly owned subsidiary of the Company(ì Soleadoî ), entered into a loan facility agreement with Merton Investments NL BV (ì Mertonî ) toprovide a loan up to USD 15 million to Merton at a fixed interest rate. The maturity date of theloan is three years after the first drawdown date which was on 23 November 2009.Merton will then on-lend such loan to SERI. Both loans will be drawn down according to theprogress of the coal mine construction done by SERI in the Philippines. The loan amount as of30 September 2011 was USD 17.8 million (2010: USD 12.0 million).
The collateral for the Soleado loan includes pledge of shares held by Merton Group (Cyprus)Limited in Merton, pledge of shares held by Merton in SERI, pledge of Merton bank accounts,assignment of Merton's interest and benefit in SERI Loan, and mortgage of real properties andchattels by SERI.
In 2011, Baconco Co., Ltd., a wholly owned subsidiary of the Company (ì Baconcoî ), entered intoa loan agreement with Thoresen-Vinama Agencies Co., Ltd. (ì Thoresen-Vinamaî ) to provide a loan ofUSD 2 million. This loan is unsecured and repayable in 2 years. Baconco is entitled to incomefrom the bonded warehouse that is being built by Thoresen-Vinama.

12
133Annual Report 2011
Thoresen Thai Agencies Public Company LimitedNotes to Consolidated and Company Financial StatementsFor the years that ended on 30 September 2011 and 2010
63
31 Related parties (Continued)
31.4 Loans to/from related parties (Continued)
a) Loans to related parties as at 30 September in the consolidated and Company financial statementscomprise the following: (Continued)
Company
As at 30 September 2011, the Company granted unsecured loans in USD and Baht currency tosubsidiaries totalling Baht 4,917.3 million (2010: Baht 4,991.7 million), which carry interest atfixed rates (2010: fixed rates) and are repayable every month.
In addition, the Company granted unsecured long-term loans to an associate amounting toBaht 3.3 million (2010: Baht 7.3 million), which carry interest at MOR plus a certain margin(2010: MOR plus a certain margin).
Movements on long-term loans to related parties during the years that ended on 30 September areas follows:
Consolidated Company2011 2010 2011 2010
Bahtí000 Bahtí000 Bahtí000 Bahtí000
Long-term loansBeginning balance 372,315 11,323 4,999,052 582,311Additions 232,063 390,668 - 5,045,797Repayments (4,000) (4,000) (102,622) (553,670)Realised gains (losses) on
exchange rates - - 7,427 (482)Unrealised gains (losses) on
exchange rates - - 16,724 (74,904)Translation adjustments 19,906 (25,676) - -
Ending balance 620,284 372,315 4,920,581 4,999,052
b) Loans from related parties as at 30 September in the consolidated and Company financial statementscomprise the following:
Consolidated Company2011 2010 2011 2010
Bahtí000 Bahtí000 Bahtí000 Bahtí000
Short-term loansSubsidiaries - - 4,367,527 3,384,762Associate 4,500 7,500 - -
4,500 7,500 4,367,527 3,384,762

12
134 Thoresen Thai Agencies Public Company Limited
Thoresen Thai Agencies Public Company LimitedNotes to Consolidated and Company Financial StatementsFor the years that ended on 30 September 2011 and 2010
64
31 Related parties (Continued)
31.4 Loans to/from related parties (Continued)
b) Loans from related parties as at 30 September in the consolidated and Company financialstatements comprise the following: (Continued)
Consolidated
As at 30 September 2011, a subsidiary was granted a Thai Baht loan from the Companyísassociate, Gulf Agency Company (Thailand) Ltd. The loan carries interest at MLR plus a certainmargin, is unsecured, and has repayment terms at call.
Company
The short-term loans from subsidiaries can be called at any time and are unsecured. The loansbear interest at 1.25% per annum (2010: 1.25% per annum).
32 Promotional privileges
As at 30 September 2011, fourteen (14) shipping and offshore subsidiaries and two (2) indirectsubsidiaries which operate port services and barge transport received promotional privileges fromthe Board of Investment (ì BOIî ) under services of domestic and international shipping, service ofsubmerged structure inspection, service of underwater equipment, service of inspection of marinepollution, drilling services, trade and investment service office, and port services. The main privilegesinclude exemption from payment of import duty on machinery and exemption from corporate incometaxes for the promoted activities for a period of 8 years from the date when income is first derived, orwhen approval is given by the BOI.
To be entitled to the privileges, the Group must comply with the conditions and restrictions providedin the promotional certificates.
33 Financial instruments
The principal financial risks faced by the Group are foreign exchange rate risk, interest rate risk, andcredit risk. The objective in using financial instruments is to reduce the uncertainty over future cashflows arising from movements in exchange rates and interest rates, and to manage the liquidity of thecash resources.
Foreign exchange rate and interest rate risks
The exchange rate risk is the principal risk faced by the Group as certain purchases and services areentered into foreign currencies and also interest rate risk, which is the risk that future movements inmarket interest rates will affect the results of the Groupís operations and its cash flows. The Groupmanages these risks as follows:

12
135Annual Report 2011
Thoresen Thai Agencies Public Company LimitedNotes to Consolidated and Company Financial StatementsFor the years that ended on 30 September 2011 and 2010
65
33 Financial instruments (Continued)
a) Cross currency and interest rate swap contracts
On 29 December 2008, Mermaid Offshore Services Ltd. (ì MOSî ), a subsidiary of MMPLC,entered into a cross currency and interest rate swap contract with a local commercial bank fora long term loan in Thai Baht currency of Baht 328.7 million. The loan had a notional amount ofUSD 10 million with a maturity date of 31 August 2012. On 26 September 2011, the loan wasfully paid and this cross currency and interest swap contract was terminated. The gain fromthis termination has been recognised in the statement of income in the amount of Baht 9.9 million.
On 6 February 2009, MOS entered into another cross currency and interest rate swap contractwith a local commercial bank for a long-term loan facility in Thai Baht currency of Baht 786.2million. The loan has a notional amount of USD 22.5 million and a maturity date of December2016. On 26 September 2011, the cross currency and interest rate swap contract was earlyterminated in association with loan rescheduling. The gain from this termination has beenrecognised in the statement of income in the amount of Baht 72.1 million. Mermaid OffshoreServices Ltd. subsequently entered into a new cross currency and interest rate swap contractwhich was modified for business day convention. As at 30 September 2011, the outstandingloan balance is Baht 653.9 million and loan has a notional amount of USD 21.1 million.
On 29 December 2009, Nemo Subsea AS, a subsidiary of MOS, entered into an interest rateswap contract with a commercial bank for a long-term loan facility in US Dollar currency ofUSD 45.9 million. The notional principal amounts of the outstanding interest rate swapcontracts as at 30 September 2011 were USD 19.9 million and USD 19.9 million (2010: USD 21.4million and USD 21.4 million) with a maturity date of September 2012 and September 2017,respectively.
On 2 August 2010 and 10 January 2011, the Company entered into cross currency and interestrate swap contracts with a commercial bank against 5 year and 7 year Thai Baht bonds. Wehave locked in fixed USD interest rates of 3.60% and 3.82% per annum, respectively. As at30 September 2011, the outstanding bond balances were USD 127.83 million (2010: USD 62.15million) and these bonds had notional amounts of Baht 4,000 million (2010: Baht 2,000 million).
On 11 August 2011, UMS, a subsidiary, entered into interest rate swap contract with a commercialbank for a long term loan in Thai Baht currency. The loan had a notional amount of Baht 500million with a maturity date on 14 February 2014. We have swapped the floating interest rate of6M THBFIX plus 1.25% per annum to a fixed interest rate of 4.37% per annum. As at 30September 2011, the outstanding loan balance was Baht 475 million.

12
136 Thoresen Thai Agencies Public Company Limited
Thoresen Thai Agencies Public Company LimitedNotes to Consolidated and Company Financial StatementsFor the years that ended on 30 September 2011 and 2010
66
33 Financial instruments (Continued)
a) Cross currency and interest rate swap contracts (Continued)
The net fair values of the cross currency and interest rate swap contracts at the balance sheetdate are as follows:
Consolidated Company2011 2010 2011 2010
Bahtí000 Bahtí000 Bahtí000 Bahtí000
(Unfavourable) favourable on crosscurrency and interest rate swap contracts (42,411) 212,925 (55,383) 80,767
Consolidated Company2011 2010 2011 2010
USDí000 USDí000 USDí000 USDí000
Unfavourable on interest rateswap contract 4,212 5,237 - -
Consolidated Company2011 2010 2011 2010
Bahtí000 Bahtí000 Bahtí000 Bahtí000
Unfavourable on interest rateswap contract 1,265 - - -
The fair values of cross currency and interest rate swap contracts have been calculated (usingrates quoted by the counterparty to the contracts) as if the contracts were terminated at thebalance sheet date.
b) Forward foreign exchange contracts
UMS, a subsidiary, entered into forward foreign exchange contracts with local financialinstitutions in order to hedge the foreign exchange risk relating to trust receipts. As at 30September 2011, the outstanding contracts which settlement dates are between 21 Octoberand 4 November 2011 (2010: between 4 October and 22 December 2010) are as follows:
Consolidated Company2011 2010 2011 2010
Bahtí000 Bahtí000 Bahtí000 Bahtí000
USD 4.6 million at rateBaht 30.57 - 31.26 per USD 1
(2010: USD 7.3 million at ratesBaht 30.72 - 32.50 per USD 1) 142,209 230,858 - -

12
137Annual Report 2011
Thoresen Thai Agencies Public Company LimitedNotes to Consolidated and Company Financial StatementsFor the years that ended on 30 September 2011 and 2010
67
33 Financial instruments (Continued)
b) Forward foreign exchange contracts (Continued)
The net fair values of the forward foreign exchange contracts at the balance sheet date are asfollows:
Consolidated Company2011 2010 2011 2010
Bahtí000 Bahtí000 Bahtí000 Bahtí000
Favorable (unfavorable) on forwardforeign exchange contracts 1,440 (9,264) - -
The fair values of the forward foreign exchange contracts have been calculated (using ratesquoted by the counterparty to the contracts) as if the contract was terminated at the balancesheet date.
c) Foreign currency collar contracts
During 2007, two subsidiaries entered into foreign currency collar contracts to limit the foreigncurrency exchange rate fluctuation relating to two ship building contracts in YEN currencytotalling YEN 7,353 million. Such contracts specify the range of minimum and maximumexchange rates between YEN 105 to 120 per USD 1. The contracts are effective from 12December 2006 to 12 September 2011 for the first contract and from 27 December 2006 to 28December 2009 for the second contracts. The realised gains from the contracts have beenrecognised as income in the financial year 2011 at the amount of Baht 314 million.
The net fair values of the foreign currency collar contracts at the balance sheet date are as follows:
Consolidated Company2011 2010 2011 2010
Bahtí000 Bahtí000 Bahtí000 Bahtí000
Favourable - 266,064 - -
Credit risk
Most of the Groupís income, being freight income, is normally paid by clients in advance, or prior tothe corresponding cargoes being released to them. Management is therefore of the opinion thatcredit risk is not significant, and that the cost of hedging will outweigh the possible benefit. The Grouphas not entered into any derivative contracts relating to credit risk.
Fair value
Financial assets carried on the balance sheet include cash and cash equivalents, short-terminvestments, trade accounts receivable, and loans to related parties. Financial liabilities carried onthe balance sheet include bank overdraft, short-term loans, trade accounts payable, loans fromrelated parties, and long-term loans.
The carrying amounts of the financial assets and financial liabilities approximate their fair value.

12
138 Thoresen Thai Agencies Public Company Limited
Thoresen Thai Agencies Public Company LimitedNotes to Consolidated and Company Financial StatementsFor the years that ended on 30 September 2011 and 2010
68
34 Provident fund
The Group established a contributory registered provident fund, in accordance with the ProvidentFund Act B.E. 2530. The registered provident fund was approved by the Ministry of Finance.
Under the plan, employees may contribute up to 7 percent of their basic salary, with the Group matchingthe employeesí contribution. The Company appointed an authorised fund manager to manage the fundin accordance with the terms and conditions prescribed in the Ministerial Regulation No. 2 (B.E. 2532)issued under the Provident Fund Act B.E. 2530.
35 Commitments and contingent liabilities
35.1 Capital commitments
The Group has capital commitments in respect of warehouse construction, ship building, and vesselequipment contracts but not yet recognised as liabilities as at 30 September as follows:
Consolidated Company2011 2010 2011 2010
Million Million Million Million
- USD 71.1 91.9 - -- YEN - 3,688.4 - -- VND 19,535 - - -
35.2 Other commitments
a) Operating lease commitments - group company as lessee
The future aggregate minimum lease payments under non-cancellable operating leases ofvessels are as follows:
Consolidated Company2011 2010 2011 2010
Bahtí000 Bahtí000 Bahtí000 Bahtí000
Not later than 1 year 60,204 784,575 - -Later than 1 year but not later
than 5 years 11,619 55,546 - -Later than 5 years 31,913 16,042 - -
b) Sale and purchase contracts for steam coal
As at 30 September 2011 and 2010, UMS, a subsidiary, had outstanding commitments relatingto sale and purchase contracts for steam coal with foreign coal suppliers for certain metrictones. The coal price shall be adjusted which is subjected to the quality of coal, as specified bya formula in the agreements. As at 30 September 2011, UMS also had outstandingcommitments relating to sale contracts for steam coal with domestic enterprises for certainmetric tones at a fix price per contract (2010: Nil).

12
139Annual Report 2011
Thoresen Thai Agencies Public Company LimitedNotes to Consolidated and Company Financial StatementsFor the years that ended on 30 September 2011 and 2010
69
35 Commitments and contingent liabilities (Continued)
35.2 Other commitments (Continued)
c) Ship charter contracts
As at 30 September 2011, UMS had outstanding commitments relating to ship charter contractswith charterers at freight rates as specified in the contracts for 3 shipments (2010: 7 shipments).
d) Other commitments
As at 30 September 2011, a subsidiary of MMPLC has other commitments approximately Baht63.9 million (2010: Baht 62.3 million).
35.3 Significant agreements
a) Vessel and rig charter contracts
Consolidated Company30 September 30 September 30 September 30 September
2011 2010 2011 2010
Long-term charter-outcontracts:
Number of vessels and rigs 3 4 - -Period (months) 2 - 11 6 - 24 - -
Long-term charter-incontracts:
Number of vessels 1 6 - -Period (months) 3 2 - 14 - -
b) Employee Joint Investment Program (EJIP)
On 21 January 2010, the Company entered into a memorandum of understanding with keyexecutives of the Company and certain subsidiaries for the Employee Joint Investment Program(ì EJIPî ). The objective of the EJIP is designed as a performance-based retention tool for keyexecutives. The period of the EJIP is three years commencing 1 January 2010 until 31 December2012. EJIP members shall contribute four percent of their monthly base salary on a specific dateevery month. EJIP members shall receive from the Company and some subsidiaries acontribution of seven percent of their monthly base salary. In each month, an EJIP memberíscontribution and the Groupís contribution shall be used to purchase TTA ordinary shares on theStock Exchange of Thailand within the specified determined dates. EJIP members have the rightto sell their TTA shares one year after the end of the program period, or 31 December 2013.
The Groupís contributions to the EJIP members are charged to the statements of income in theyear to which they relate.

12
140 Thoresen Thai Agencies Public Company Limited
Thoresen Thai Agencies Public Company LimitedNotes to Consolidated and Company Financial StatementsFor the years that ended on 30 September 2011 and 2010
70
35 Commitments and contingent liabilities (Continued)
35.4 Contingent liabilities
The Company and the Group have given the following guarantees in the normal course of business:
30 September 2011Consolidated Company
Baht USD Baht USDmillion million million million
Letter of guarantees issued bybank on behalf of the Group 32.6 1.3 - -
Guarantee given by the Groupto financial institutions toguarantee credit facilitiesand purchases of rawmaterial 730.2 285.5 76.3 106.1
30 September 2010Consolidated Company
Baht USD Yen QAR* Baht USD Yenmillion million million Million million million million
Letter of guarantees issued bybank on behalf of the Group 46.5 0.1 - 14.5 - - -
Guarantee given by the Groupto financial institutions toguarantee credit facilitiesand purchases of raw material 1,080.2 169.7 817.0 14.5 119.0 60.1 817.0
36 Subsequent events
The Company
In November 2011, the Company repurchased and cancelled a portion of the outstanding bondsamounting to USD 3.10 million, representing 9.04% of the outstanding principal amount of the bonds.The aggregate principal amount of the convertible bonds outstanding after the repurchase andcancellation of the convertible bonds is USD 31.20 million with the conversion price of Baht 50.35 pershare.

12
141Annual Report 2011
Thoresen Thai Agencies Public Company LimitedNotes to Consolidated and Company Financial StatementsFor the years that ended on 30 September 2011 and 2010
71
36 Subsequent events (Continued)
Subsidiaries - Soleado
In November 2011, Soleado acquired a 47.07% economic interest in SERI, the operating coal miningbusiness in Philippines. The acquisition results in Soleado having 40% of all voting rights in SERI. Thenumber of shares held by Soleado in SERI divided into 240,000,000 common shares and 266,787,012preference shares. The preference shares carry 1.5 times economic interest of common shares. Theprice of common shares is USD 0.0395 per share and the price of preference shares is USD 0.0593per share. The amount of investment by Soleado is USD 25.3 million, of which USD 5 million is newcapital. USD 20.3 million comes from the conversion of the existing loan principal and interest toMerton Group that was on lent to SERI. Merton has assigned to Soleado its loan receivables fromSERI, and such receivables amounting to USD 17.8 million plus accrued interest amounting toapproximately USD 2.5 million and these receivables were converted into SERIís shares as mentionedabove.
Subsidiaries - UMS
Samutsakornís Provincial Governor issued an order to all coal trading operators in the province tocease all operations from 13 July 2011 onwards until further notice. However, on 23 November 2011,Samutsakornís Provincial Governor issued an order allowing coal transportation which UMS willfollow the order.

142 Thoresen Thai Agencies Public Company Limited
Income Structure13
1. Audit fees
The Company and its subsidiaries paid audit fees to audit firms for the last financial year of Baht 18,856,505.
2. Non-audit fees
The Company and its subsidiaries paid non-audit fees to audit firms for the last financial year of Baht 1,467,843, primarily relating to auditing the subsidiaries’ compliance to the conditions in the Approved International Shipping Enterprise (“AIS”) scheme, BOI’s certificates, tax filling and tax advice.
Baht in Millions
Transport Infrastructure Energy
2011 % 2010 % 2011 % 2010 % 2011 % 2010 %
Revenues from services
Freight charges 5,754.19 100.00% 10,157.15 100.00% - 0.00% - 0.00% - 0.00% - 0.00%
Offshore service income - 0.00% - 0.00% - 0.00% - 0.00% 5,542.82 100.00% 3,476.37 100.00%
Service and commission income
106.17 30.83% 367.76 62.43% 238.25 69.17% 221.35 37.57% - 0.00% - 0.00%
Revenues from sales - 0.00% - 0.00% 6,249.44 100.00% 4,675.90 100.00% - 0.00% - 0.00%
Revenues from operations (before eliminations)
5,860.36 32.76% 10,524.91 55.69% 6,487.69 36.26% 4,897.25 25.91% 5,542.82 30.98% 3,476.37 18.39%
Audit Fees14

143Annual Report 2011
Risk Factors15
Risk Management
TTA’s risk management focuses on the following risk categories: strategic, operational, compliance, and financial risks. The risk overview highlights the main risks known to TTA, which could hinder it in achieving its strategic and financial business objectives. The risk overview may, however, not include all the risks that may ultimately affect TTA. Some risks not yet known to TTA, or currently believed not to be material, could ultimately have a major impact on TTA’s businesses, objectives, revenues, income, assets, liquidity or capital resources.
Risk management forms an integral part of the business planning and review cycle. The company’s risk and control policy is designed to provide reasonable assurance that objectives are met by integrating management control into daily operations and by ensuring compliance with legal requirements. It makes management responsible for identifying the critical business risks and for the implementation of fit-for-purpose risk responses.
Taking risks is an inherent part of entrepreneurial behaviour. A structured risk management process encourages management to take risks in a controlled manner. Strategic risks and opportunities may affect TTA’s strategic ambitions. Operational risks include adverse unexpected developments resulting from internal processes, people and systems, or from external events that are linked to the actual running of each business. Compliance risks cover unanticipated failures to implement, or comply with, appropriate policies and procedures. Within the area of financial risks, TTA identifies risks related to foreign exchange, interest rate, fuel oil price fluctuation, and counterparty. TTA does not classify the risk categories themselves in order of importance.
Strategic risks
As TTA’s business is global, its operations are exposed to economic and political developments in countries across the world that could adversely impact its revenue and income.
TTA’s business environment is influenced by economic conditions globally and in individual countries where TTA conducts business. For example, the high degree of unemployment in certain countries and uncertainties with respect to the long-term high growth stability of the Chinese economy may result in lower demand and more challenging market environments across our businesses. Numerous other factors, such as fluctuation of energy and raw material prices, as well as global political conflicts, including the Middle East and other regions, could continue to impact macroeconomic factors and the international capital and credit markets. Economic and political uncertainty may have a material adverse impact on TTA’s financial condition or results of operations and can also make TTA’s budgeting and forecasting more difficult.
TTA may encounter difficulty in planning and managing operations due to unfavourable political factors including unexpected legal or regulatory changes, such as foreign exchange import or export controls, increased marine regulations, or restrictions on repatriation of returns from foreign investments. As emerging markets are becoming increasingly important in TTA’s operations, the above-mentioned risks are also expected to grow and could have an adverse impact on TTA’s financial condition and operating results.
TTA manages this risk through ongoing periodic review of the strategic plans defined by each business unit. Such review focuses on preserving or enhancing competitiveness, indentifying additional growth opportunities, and responding to industry, regulatory, or macroeconomic changes or trends, which impact each business. Every month, the Management Committee meets to monitor Group performance and

144 Thoresen Thai Agencies Public Company Limited
exchange views on adjusting business plans and short-term strategies to ensure confidence in reaching defined goals. In addition to the internal skills brought to bear in this monitoring and review process, management also consults industry and financial experts and frequently interacts with a number of reliable institutions and other sources to check information creditability and analyse differences among various assumptions. This ongoing review enables corrective actions to be taken well in advance of significant changes, which might impact the performance of the Group.
As a number of our businesses are highly capital intensive, the timing, nature, pricing, and financing of investments in both existing businesses and new activities is critical.
Rigorous investment criteria have been established and are closely followed in the course of any new investment discussions. Risks in connection with investment decisions are minimised by the use of detailed guidelines and multi-level review of all significant investments. Any investment decision requires concurrence from the head of the line of business and the Executive Vice President – Corporate Finance and Accounting, before any approval is requested.
The recent or new acquisitions could expose TTA to integration risks and challenge management in continuing to reduce the complexity of the company.
The integration risks could be in areas, such as sales and service force integration, logistics, regulatory compliance, information technology, and finance. Integration difficulties and complexity may adversely impact the realisation of an increased contribution from acquisitions. TTA may incur significant acquisition, administrative, and other costs in connection with their integration.
Furthermore, organisational simplification and resulting cost savings may be difficult to achieve. Acquisitions may also lead to a substantial increase in long-lived assets, including goodwill. Write-downs of these assts due to unforeseen business developments may materially adversely affect TTA’s earnings.
As the Group has grown and added activities both domestically and internationally, the complexity of our operations and the skills required to effectively manage such operations has grown as well.
The Group now has both majority-owned subsidiaries and associate companies, with a number of them listed on various stock markets. In addition to the regulatory and compliance risks (which are addressed below), the continuing growth of the Group, both in its existing businesses and through new investments, will create ongoing challenges to manage the various businesses and to ensure high quality human resources are in place to provide such oversight. To mitigate this risk, TTA has significantly increased efforts in the recruitment, training and development, and retention programmes to meet our anticipated personnel needs. The President and Chief Executive Officer discuss key human resources issues with all lines of business and business management functions regularly and leads a quarterly management meeting purely on human resource issues.
15

145Annual Report 2011
15
Operational risks
Transport group
Risks relating to shipping business
The dry bulk shipping company, as an owner and operator of ocean-going vessels operating without any geographical limitations, is exposed to risks of marine disaster, environmental mishaps resulting in substantial claims, cargo/property loss or damage and business interruptions due to accidents or other events caused by mechanical failure, human error, political action in various countries, labour strikes, terrorist actions, piracy, adverse weather conditions, and other such circumstances and events. This could result in increased costs or loss of revenues. However, to cover against most of these risks, which are standard for an international ship owner/operator, insurance covers are available in the international insurance industry. Accordingly, the dry bulk company is adequately covered against such aforesaid circumstances and events, although insurance premiums do vary with a company’s perceived exposure to these risks.
The operations of the Company are subject to extensive and changing regulations. Non-compliance with these regulations may result in the detention of ships leading to loss of revenues or claims from charterers, significant expenses for ship modifications or changes in operating procedures. However, the Company is vigilant on these issues and maintains operations in compliance with internationally prescribed safety and technical standards.
The operations of the ships require skilled personnel to be employed as crew to operate its ships. Likewise, the management of the company requires skilled managers at the corporate level with appropriate technical knowledge and experience. Sourcing and retaining such personnel is crucial for the business operations of the dry bulk company. However, due to the adoption of fair and reasonable staffing policies, the Company has been successful in sourcing and retaining highly skilled and qualified personnel.
As the dry bulk company increases its level of contracts of affreightment (COA’s), the exposure to changes in the oil price also rises. To mitigate this risk, the company actively hedges bunker requirements for its COA’s. This allows the Company to lock a significant portion of its costs.
The shipping industry and market is cyclical, experiencing volatility in profitability, vessel values and freight rates, resulting from changes in the supply of and demand for shipping capacity.
In the Company’s opinion, given the uncertainty and the extreme volatility in the market where rates can shoot up or collapse very quickly, it is always prudent to secure future earnings, at reasonably high freight rates whenever possible, as a cushion against a sudden and, more particularly, a sustained collapse of the freight rates in the spot market. To limit this volatility, the Group’s objective is a diversified and balanced fleet employment. The Company employs a certain percentage of the fleet on period time charters, which are supplemented by COA’s and tramp services. The demand side of the Company’s business is generated by the quantity of cargo its vessels are required to transport. The generation of this demand is mainly dependent on world trade and economic growth. Severe depression in growth and trade could reduce the demand for ships. A significant reduction in demand, particularly in the next few years when a significant number of new ships are expected to enter the market, could lead to a fall in freight rates.
As with any commercial enterprise, the dry bulk company is exposed to counter-party risk. This is particularly true in times of financial hardship. However, the Company is always conscious of the counterparty risk associated with its period charters and takes appropriate evaluative steps before

146 Thoresen Thai Agencies Public Company Limited
engaging in charters. Furthermore, regardless of credit-worthiness, the dry bulk company maintains rigid payment standards. It is for this reason that through the depressed market of the last year, the Company did not suffer any significant losses on account of defaults by charterers.
The Company’s revenues are generated from a number of customers and the company is not dependent on any single customer for the majority of its business. As such, the Company is not exposed to any risk of concentration of its business with any one customer and any loss of business from one such customer shall not have any significant impact on the Company’s business and will not results in sudden and significant loss of revenues.
World events could affect the Company’s results and financial condition.
In the past, political conflicts have resulted in attacks on vessels, mining of waterways, and other efforts to disrupt international shipping. Acts of terrorism and piracy have also affected vessels trading in regions such as the Middle East and South China Sea. In addition, diplomatic sanctions have affected shipping companies with contracts destined for mentioned countries. Any of these occurrences could have a material adverse impact on the Company’s operating results and financial condition.
The continued level of piracy attacks and our experience over the last three years have led it to provide significant additional passive deterrents, preparations, drills, procedures, and training of sea staff prior to entering and during transit of piracy-affected areas. These additional measures include full 360 degree razor wire fencing, accommodation and bridge protection, military level personal body and head protection, and mandatory use of patrolled sea corridors. Other deterrents and protection measures are being explored with both military and civilian consultants. Furthermore, we have purchased additional insurance coverage for protection against kidnap and ransom liabilities.
Energy Group
Risks relating to the Group’s Offshore Services Business
The offshore services industry is largely dependent on the oil and gas industry, which is affected by volatile oil and gas prices.
Mermaid provides offshore services to the oil and gas industry, and its offshore business is affected by fluctuations in the prices of oil and gas, which impact the level of activity in oil and gas exploration, development, and production in South-East Asia, where Mermaid is active.
Depending on the market price of oil and gas, oil and gas companies may cancel or reduce their activities, thus reducing the demand for the Mermaid’s offshore services. Any prolonged period of low drilling and production activity would likely have an adverse effect on the Company’s business and operations.
Demand for the Group’s offshore business is highly competitive and subject to fluctuations and the results of its offshore services segment operations may be volatile.
Demand for Mermaid’s offshore services is subject to periods of high demand, short supply, and high rates often followed by periods of low demand, excess supply, and low rates. The entry into the market of newly constructed, upgraded, or reactivated drilling or subsea engineering vessels will increase market supply and may inhibit the increase of rates or reduce them. Periods of low demand intensify the competition in the industry and often result in assets being idle for periods of time. Mermaid’s offshore services assets may be idle, or Mermaid may have to enter into lower rate contracts in response to market conditions in
15

147Annual Report 2011
the future. Mermaid’s ability to renew these contracts, or obtain new contracts, and the terms of any such contracts will depend on market conditions at the time such contracts are being considered.
In addition, as most of Mermaid’s subsea engineering services contracts are short-term in nature, changes in market conditions can quickly affect business. Further, as Mermaid’s offshore services business is project-based, its cash flow may not always be predictable and may be uneven. As a result of fluctuation in demand, its results of operations may be volatile.
Our strategy is to secure a number of different assets on long-term contracts. This provides a guaranteed earnings stream that is not affected by spot market conditions and provides a hedge against market volatility.
The Group’s offshore services business is subject to a number of operating risks.
Mermaid’s offshore services business is subject to various risks inherent in the oil and gas industry, such as fires, natural disasters, explosions, encountering formations with abnormal pressures, blowouts, cratering, pipeline ruptures, and spills. A number of these risks could have severe consequences, including loss of human life or serious injury, significant damage to Mermaid’s or its clients’ assets and equipment, environmental pollution, personal injury litigation, political consequences, and damage to Mermaid’s reputation.
Mermaid’s offshore services business is also subject to equipment failure risks, which may require long periods to repair and result in loss of revenue. A major system failure could result in substantial loss of life and or serious injury, damage to or loss of vessels and equipment and protracted legal or political disputes and damage to Mermaid’s reputation.
Mermaid constantly invests substantial capital in the fleet, and insists upon a comprehensive maintenance and repair schedule, that minimises the risk of equipment failure. Furthermore, Mermaid maintains a high focus on safety at all times, with a comprehensive safety management system in place, with clear safety guidelines and detailed safety training and awareness programs. In addition, clients also regularly inspect the fleet and provide their input to ongoing repair and maintenance programs.
There are a limited number of potential clients in the niche markets in which the Group’s offshore services business operates and the loss of a significant client could have a material impact on the Group’s financial results.
There are a limited number of potential clients, particularly for the drilling business, and a limited number of projects available in the niche markets that Mermaid’s offshore services business operates in. In any given year, a small number of contracts and projects account for a significant portion of Mermaid’s revenues and profitability. Further, given that Mermaid has two tender drilling rigs, the loss of any single existing client for the drilling business could thus have a material adverse impact on the drilling business and potentially Mermaid’s revenues and profitability as a whole, if Mermaid is unable to secure new clients to replace such a client.
Mermaid’s revenues and profitability could be materially and adversely affected if any of Mermaid’s major clients terminate its contracts or refuse to award new contracts to Mermaid and it is unable to secure new clients to replace these clients.
Mermaid works hard to maintain good relationships and its good reputation with all its major clients, and to date has never had a client terminate an existing contract due to reasons of Mermaid performance, nor
15

148 Thoresen Thai Agencies Public Company Limited
has Mermaid ever been technically disqualified from bidding for new contracts by clients with whom it has worked previously.
Infrastructure group
Risks Relating to the Group’s Coal Logistics Business
Transport related risks
UMS imports coal from Indonesia regularly. The modes used are dry bulk vessels or ocean going barges. There are two potential risks related to this - availability of vessels and fluctuations in freight rates during any given period.
UMS is well aware of these situations and addresses them through either fixed long term contracts with carriers and/or spot contracts. In the meantime, the Company’s dry bulk shipping business provides weekly updates and analysis on freight rate movements, allowing UMS to make fast and informed decisions.
Risk related to coal procurement
Major factors that affect procurement and cost are:
i) Availability of supply at required specification/quality ii) Prices of required specification/quality iii) Exchange rates
Risks related to supply availability include mine capacity and demand requirements from major importers - specifically power plants from China, Japan, India and Korea. UMS is also exposed to specification and quality risks that occur in Indonesia on a regular basis. UMS identifies on an annual basis its import volume requirements, as well as the desired specifications and quality. While the volumes may not be at the levels of the major import countries mentioned, the major Indonesian suppliers do participate in our bids of 50% of the volume or more. At the same time, specifications and quality requirements are managed strictly through the coal sourcing agreements that include rejection limits and penalties.
From a pricing perspective, most of the coal indices are tied to world market rates. The price of coal will fluctuate based on global supply and demand. Therefore, price volatility of any of these factors will impact the cost of goods sold. UMS closely monitors coal price indexes and through a balanced long term fixed and spot coal sourcing agreements is able to manage the cost of goods sold.
Approximately 90 percent of UMS’ cost of goods sold is denominated in US dollars, while all of its revenue is in Baht. This is due to the business model of importing coal from Indonesia and distributing it to domestic industries. Therefore, there is the potential of exposure to foreign exchange risk. When the Thai Baht depreciates, UMS’ cost of imported raw materials will be higher. UMS manages this risk through a policy of using forward contracts for all costs of imports and is therefore able to considerably mitigate foreign exchange rate risk.
Risk from new competitors
New competitors continue to enter the coal distribution market in Thailand. Previously it was seen that coal trading requires relatively minimal investment in terms of equipment and machinery. Increased competition has resulted in price undercutting and overall narrowing of gross margins for coal traders.
15

149Annual Report 2011
UMS continues to retain its key strategies in order to differentiate its products from competitors. For example, UMS provides consultative recommendations to customers on the quality of coal to match each type of boiler by industry type, as well as provide advice to customers on technical and other services related enquiries.
In essence, UMS screens and improves coal quality to be optimal for each type of boiler that is used by small and medium sized manufacturers. This ensures high efficiency for customers. As a result, with a significant customer base, UMS is able to import large coal volumes though larger sized vessels and enjoy lower freight costs, compared to smaller tonnage and vessels.
More recently, with increasing community concerns related to coal processing, many local and provincial government bodies are strictly enforcing or adding additional protection requirements to protect communities and the environment. UMS upgrades its facilities on an ongoing basis to meet and exceed the requirements. UMS is ISO 14001 certified. This will create a significant barrier to entry for many new players who previously invested little. Ultimately they will need to make major investments in upgrading equipment/machinery, land for stockpiles, in order to be in compliance with the changing environmental protection requirement.
Risk from substitute products and market expansion
In general, primary energy resources used by domestic industries are fuel oil, natural gas, and coal. Fuel oil was the most popular choice among manufacturing companies due to its availability and ease of use (ease of maintenance). Natural gas is another choice for industry given its lower cost compared to fuel oil. Coal use as an energy source is still not widespread.
The consistently increasing price trend for fuel oil has resulted in cost increases for industry overall. At the same time, gas prices are also increasing and it is also evident that domestic gas supply is on a reducing trend. As a result, many industries are seeking for alternative sources of energy for production and management of production costs. While coal is also a viable low cost source, many manufacturers are also looking to other sources such as palm husks, wood chips and other bio mass fuels.
However, coal has a significant advantage in terms of cost over other sources of energy. Coal reserves are more abundant than any other natural energy related source and may be found in over 100 countries.
UMS expects that demand for coal will continue to increase. As cost of production becomes increasingly crucial for every industry, many are turning their attention to coal as an alternative source of energy. For existing manufacturers, any consideration to convert from existing fuel oil boilers to coal fired boilers will require capital investment. However, with all factors considered including, the cost of fuel, operating expenses, and maintenance cost, manufacturers could find favourable returns of converting from fuel oil to coal.
Risk from communities and related environmental impacts
Coal is classified into many types including anthracite, bituminous, sub bituminous, and lignite. When coal is combusted, the oxygen in the air will react with the coal and generate the gas sulphur dioxide. If SO2 is inhaled or comes into contact with the skin, lung conditions and allergic reactions might result. At the same time, dust from coal could also cause allergies.
Currently, UMS imports bituminous and sub-bituminous coal that generates low sulphur (sulphur content is in the range of 0.1-1.5% while sulphur content in fuel oil is in the range of 0.1-3.0%). This creates less impact to the environment.
15

150 Thoresen Thai Agencies Public Company Limited
To minimise negative perceptions and the potential for adverse environmental impact to communities, UMS engages in a closed manufacturing process that complies with government regulations. Specifically, UMS reduces particulate dispersion with either a closed storage system, covering coal stockyards with plastic sheets, spraying water on coal stockpiles, building high fences around the warehouse, and planting trees around the land perimeter to trap particulates. UMS also covers trucks with plastic sheets and washes the truck tyres prior to dispatch in order to prevent coal falling onto roads.
Risks Relating to the Group’s Fertiliser & Warehousing Business in Vietnam
Risk related fertiliser raw material prices
Global and domestic fertiliser raw material prices can be volatile and therefore Baconco may be exposed to inventory adjustments, especially when the market faces a downturn or reduced margins when the market is on an upward trend. This is especially true if Baconco is not able to adjust quickly its market pricing.
While this risk cannot be completely eliminated, it is mitigated and minimised by controlling with two approaches:
a) Maintain low inventories, therefore limiting exposure in a market down turn situation and
b) Firm pricing and discount policies together with customer management based on superior quality therefore enabling Baconco to retain margins when raw material prices increase.
Risk of fertiliser raw material procurement
Baconco purchases raw materials from both domestic and overseas sources. In general, supply is balanced with a 50/50 split domestic and foreign.
With Baconco’s strategic policies of low inventory and just-in-time purchase of raw materials, it may be exposed to a higher probability of raw material shortage when global supply is tight.
Baconco has established long term relations with a number of large and medium sized suppliers internationally. These suppliers continue to be very supportive of the company based on our quality commitments, adherence to contractual obligations, and prompt payment for materials. Baconco’s volume and in time purchases of raw materials from suppliers have always been met.
Domestic competition for fertiliser
Vietnam is a highly competitive market for fertilisers and agrochemicals. There is currently an overcapacity of NPK production in Vietnam (bulk blending and granulation). In the next several years, more projects are being planned.
Baconco has chosen a strategy of differentiation and concentrates on specialised products to limit exposure to competition. Overall, Baconco engages in over 50 different fertiliser formulas from generic market blends to highly specialised types. This is to ensure that Baconco stays ahead of the competition, which in general produces 10-15 product types.
Baconco also engages in multiple production processes, as well as value adding its products with some unique processes such as compaction, USP, and bio coating of fertilisers. Through this approach, Baconco is able to maintain the reputation of the brand and the image in the market as the high quality, high service provider with consistent innovations and is able to maintain its market share and margins.
15

151Annual Report 2011
On-time delivery of fertiliser
With Baconco’s just-in-time production policy, finished products inventory is low. This could lead to a higher probability of delivery delay to customers.
Baconco manages this risk with a good supply chain approach - through consistent and efficient communications between sales operations and the production facility. The factory knows several weeks in advance the incoming orders. Combined with a preventative maintenance program for machineries and equipment, production capacities are consistently maintained. Finally through automated bagging lines and loading processes, product is delivered to customers without delays.
Foreign currency risks
Baconco purchases half of its raw material in USD and sells finished goods domestically in VND. Given there are constant devaluations of the VND by the Vietnamese government, foreign exchange risks exist.
As the VND is not a generally convertible currency, coverage is limited. This foreign exchange risk may be managed by maintaining low inventories (based on the company’s strategic policies) and a cash sales/payment policy resulting in zero customer debt. This approach has permitted Baconco to pay suppliers promptly and reduce USD exposure.
Baconco is also engaged in exporting some of its production, thereby generating USD income, which is used to pay raw material suppliers.
Risks related to regulatory compliance
The Vietnamese government establishes specific standards for fertiliser formulas in order to protect consumers and penalties are enforced if products are not manufactured based on tested specifications. Baconco imports raw materials from reliable foreign and domestic suppliers and already has the reputation as a high quality producer of fertiliser. With the direction calls for innovation of production formulas, Baconco’s products are always in compliance or above government stated standards.
COMPLIANCE RISKS
Risk from Regulatory Changes in Countries where TTA has investments
TTA takes all possible measures to protect its own legal position and prevent legal risks from arising.
A compliance program applies to our employees worldwide, which enjoins them to comply with laws and guidelines, and provides them with the relevant training and support. The core of the programme is the TTA Code of Conduct, which defines ethical behaviour guidelines. This is complemented by training and testing programs, and a Whistle Blower Line for reporting compliance violations.
Insofar as possible and practical, the Company limits liability and damage risks through insurance coverage, the type and scope of which is continually adjusted to meet current requirements.
Environment, Occupational Health, Safety and Security Risk
TTA adherence to high technical standards and rules of conduct minimises potential damage and thus ensures the continuity of plant and equipment. TTA updates these preventive measures regularly. We systematically conduct health and environmental safety audits at all locations. Through inspections and consultation, we minimise the risks to people and the environment.
15

152 Thoresen Thai Agencies Public Company Limited
Risk from Social and Community Impacts
To address these risks, TTA monitors and analyses the impacts of changes in environmental and safety laws and regulations on our operations. We closely coordinate with government agencies, apply available information to develop work plans and response measures, and ensure ongoing community relations activities in operating areas with a constant focus on community participation.
FINANCIAL RISK
The principal financial risks are foreign exchange risk, interest rate risk, and counterparty risk. The Company uses instruments such as cross currency and interest rate swap contracts, foreign currency forward contracts, foreign currency collar contracts, and target redemption swap agreements to manage the key financial risks. The objective in using these financial instruments is to reduce the uncertainty over future cash flows arising from movements in exchange rates, and to manage the liquidity of cash resources. It is our policy not to enter into any foreign exchange or interest rate derivative transactions for speculative purposes.
Foreign Exchange Risk
International maritime, offshore services, third-party logistics, and fertiliser businesses utilise the US dollar as the major currency for commercial transactions and asset acquisitions. The Company’s primary objective is to maximise the operating revenues and costs in US dollars. This ensures an appropriate balance of foreign currency revenues against foreign currency commercial expenditures, asset acquisitions, and loan obligations. Additionally, US dollar denominated loan facilities have been obtained to fund these US dollar generating businesses and investment. Residual exchange rate risks are managed through financial instruments, such as forward contracts and managing foreign-currency deposits.
TTA has executed derivatives such as cross currency and interest rate swaps to fix our financial costs. Cross currency and interest rate swap contracts protect the Company from movements in exchange rates and interest rates.
Although the vast majority operations are USD dominated, the Company’s functional currency remains in Thai Baht. Therefore, foreign-exchange risk arises when transactions are denominated in a currency other than the Baht. Foreign-exchange gains or losses appear in Item 30 of the Notes to Financial Statements.
Interest Rate Risk
The Company seeks to manage its exposure to interest rate volatility and minimise its interest costs. Interest rate volatility is mitigated through actively managing the mix of fixed and floating interest rates on our borrowings and through the use of derivatives, such as interest rate swaps, on our longer-term borrowings. Furthermore, we actively manage the overall tenor of our loan portfolio matched with operation cash flow. The Group bears market risks relating to changes in US Dollar interest rates only for the US dollar loans with minimal fixed margins tied to a floating LIBOR.
15

153Annual Report 2011
Fuel Oil Price Fluctuation Risk
The fluctuation of fuel oil prices may significantly affect vessel operating expenses and subsequently may impact the Company’s profit. In the past, the Company entered into swap agreements to the fixed price for fuel oil prices on COA’s. This is especially important and effective to minimise the risk arising from future fuel oil price changes between the date a cargo contract is entered into and the date the cargo is carried. As the dry bulk shipping business secures more vessel operating days at fixed rates, the Company is expected to hedge the expected future fuel oil requirement for each long-term cargo contract by entering into bunker swap contracts or bunker forward contracts at the time of negotiation of each long-term cargo contract.
Counterparty Risk
Most of our dry bulk freight income is normally paid by clients in advance, or prior to the corresponding cargoes being released to them. As for coal sales, the largest customers are well-established public companies in Thailand and coal sales to each SME client is not significantly large. Fertiliser sales are all done in cash. We do not believe that the counterparty risk is significant, and that the cost of hedging such risk would outweigh the possible benefit. We therefore have not entered into any derivative contracts relating to this risk.
15

154 Thoresen Thai Agencies Public Company Limited
Shareholdings by Directors/Executives16
Shareholdings by Directors as of 30 September 2011
Name As of 30 Sept. 10
Changes During Year
As of 30 Sept. 11
1. Mr. Aswin Kongsiri 0 0 0 Spouse 0 0 0 2. M.L. Chandchutha Chandratat (1) 196,988 400,000 596,988 Spouse 0 0 0 3. Dr. Pichit Nithivasin 0 0 0 Spouse 0 0 0 4. Prof. Dr. Warapatr Todhanakasem(2) 0 0 0 Spouse 0 0 0 5. Prof. Athueck Asvanund(2) 0 0 0 Spouse 0 0 0 6. Mr. Oral Wilson Dawe 0 0 0 Spouse 0 0 0 7. Mr. Sak Euarchukiati 0 0 0 Spouse 0 0 0 8. Mr. Stephen Fordham 0 10,000 10,000 Spouse 0 0 0 9. Dr. Siri Ganjarerndee 0 0 0 Spouse 0 0 0 10. Mr. Peter Stokes 0 0 0 Spouse 0 0 0
Total 196,988 410,000 606,988
Note : (1) M.L. Chandchutha Chandratat’s shareholding exclude shares from EJIP. (2) Prof. Dr. Warapatr Todhanakasem and Prof. Athueck Asvanund became Director on 15 August 2011.
TTA Share Ownership by Executives (Individually and Through the Employee Joint Investment Programme)(1) as of 30 September 2011
Name As of 30 Sept. 10
Changes During Year
As of 30 Sept. 11
1. M.L. Chandchutha Chandratat(1) 196,988 400,000 596,988
Spouse 0 0 0
2. Mrs. Penroong Suwannakudt 1,100 0 1,100
Spouse 0 0 0
Ownership by Individual Executives 198,088 400,000 598,088
3. Ownership through EJIP by Executives(2) 167,624 138,952 306,576
Total direct and indirect TTA shareholdings by executives through EJIP
365,712 538,952 904,664
Note: (1) As long as shares are acquired under the Employee Joint Investment Programme (”EJIP”), the SEC has waived its requirement that an executive publicly disclose any TTA share purchases. (2) TTA had nine executives as of 30 September 2010 and eight executives as of 30 September 2011.

155Annual Report 2011
Shareholders/Dividend Policy17
Major Shareholders as of 27 December 2011 (The latest share register book closing date)
No. Name No. of Shares Percentage
1. Mr. Chalermchai Mahagitsiri 58,494,400 8.26
2. UOB Kay Hian Private Limited 35,459,400 5.01
3. Ms. Ausana Mahagitsiri 30,360,100 4.29
4. Thai NVDR Co., Ltd. 25,536,565 3.61
5. Mr. Prateep Tangmatitham 10,358,600 1.46
6. State Street Bank Europe Limited 9,173,710 1.30
7. Commander Apiwat Chanchaimongkol 6,600,000 0.93
8. The Bank Of New York (Nominees) Limited 6,387,110 0.90
9. State Street Bank And Trust Company 6,297,580 0.89
10. Globlex Corporation Co., Ltd. 6,216,300 0.88
Total 194,883,765 27.53
Policy On Dividend Payments
The timing and amount of dividends, if any, will depend on our operational results, financial condition, cash requirements and availability, restrictions in financing agreements, and other factors deemed relevant by our Board. Because we are a holding company with no material assets other than the shares of our subsidiaries and affiliates, our ability to pay dividends on the common shares depends on the earnings and dividend distributions of our subsidiaries and affiliates.
TTA has established a policy to distribute dividends of at least 25% of the consolidated net profit after tax but excluding unrealised foreign exchange gains or losses, subject to the Company’s investment plans and other relevant factors. The Board may review and revise the dividend policy from time to time to reflect the Company’s future business plans, the needs for investment, and other factors, as the Board deems appropriate. However, dividend distributions may not exceed the retained earnings reported in the financial statements of the Company only.
The declaration and payment of dividends will always be subject to Thai law. For example, Thai law prescribes that the declaration and payment of dividends is subject to the discretion of the AGM on the recommendation of the Board (for final dividends) or at the discretion of the Board (for any interim dividends). Furthermore, Thai law generally prohibits the payment of dividends other than from profits (net profits plus retained earnings less any accumulated losses) and provided that the company first maintains a minimum reserve fund of 10% of the capital of the company, or higher if determined by company regulations, and cannot be made while a company is insolvent or would be rendered insolvent by the payment of such a dividend.
Most of our subsidiaries have adhered to a policy to pay dividends to TTA at not less than 70% of their net profit, except for the smaller shipping services companies, Mermaid, and UMS. As listed companies on the SGX-ST and MAI, respectively, their Board of Directors must apply the same level of care and judgement when recommending dividends as the TTA Board. Mermaid’s and UMS’s possible dividend payments will depend on various factors, including return on equity and retained earnings, expected financial performances, projected level of capital expenditures and other investment plans, and restrictions on payment of dividends that may be imposed by its financing arrangements.

156 Thoresen Thai Agencies Public Company Limited
Corporate Governance Report18
Introduction The Board of Directors (the “Board” and each Board member, a “Director”) recognises the critical importance of corporate governance in supporting TTA’s sustainable growth, creating shareholder value, and securing trust from all stakeholders, including shareholders, customers, employees, and the general public.
The Board plays a number of key roles, one of which is the oversight of corporate governance. Management is delegated to the President & Chief Executive Officer and his executive team, which follows the Board-approved corporate governance policies.
Good corporate governance requires a strong commitment from the Board and management, so that the proper behaviour and examples are established throughout the Company. TTA has continuously maintained and developed excellent corporate governance practices, which have been recognised by the Thai Institute of Directors (“IOD”) in its CG assessment results in 2009 and 2010.
1. THE CORPORATE GOVERNANCE
The Board is accountable to all shareholders and is committed to understanding shareholders’ needs and to evaluating systematically economic, social, environmental, and ethical matters that may affect their interests. Each Director exhibits high standards of integrity, commitment, and independence of thought and judgement. The Board also takes into account the interests of other stakeholders.
At the Board of Directors’ meeting on 21 December 2011, the Board has established a Corporate Governance Committee (the “CG Committee”) to review corporate governance practices and the Code of Conduct and to monitor compliance of the practices so that it remains within an ethical framework.
TTA’s CG practices in 2011, in accordance with guidelines of the Stock Exchange of Thailand, cover the following issues:
1. Rights and Equitable Treatment of Shareholders and Shareholders’ Meetings 2. Policy on the Interests of Stakeholders 3. Information Disclosure and Transparency 4. Responsibilities of the Board of Directors and Committees 5. Business Ethics and Code of Conduct
2. SHAREHOLDERS: RIGHTS AND EQUITABLE TREATMENT
(A) GENERAL RIGHTS AND EQUALITY
TTA is accountable to its shareholders in terms of information disclosure, accounting methods, use of insider information, and conflict of interest. Management must be ethical, and any decision must be based on honesty and fairness and for the collective benefit of shareholders as a whole.
We recognise our duty to ensure fair treatment to all shareholders. We have a duty to protect shareholders’ benefits and rights, which include, among other things, the rights to receive dividends and obtain relevant and adequate information from the Company on a regular and timely basis. We also have a duty to disseminate transparent information and ensure management accountability through shareholders’ meeting arrangements. It has been our tradition to fully accommodate all shareholders in each shareholders’ meeting.

157Annual Report 2011
Each shareholder shall receive, prior to any shareholders’ meeting, complete and sufficient information concerning the proposed agenda attached to the meeting notification, which is sent to shareholders at least fourteen days prior to the meeting date.
During the meeting, shareholders are entitled to pose questions, express their opinions, suggestions, or recommendations, and vote. They can request additional information on significant accounting entries. We encourage disclosure of business information and transactions to provide shareholders with a clear understanding of our operations. Major and minor shareholders equally receive information regarding corporate performance, management policies, financial statements, and are entitled to fair treatment in allocations of dividends and returns.
All shareholders are given proxy forms, allowing them to appoint their authorised representative or select an independent director to attend and vote at the meetings on their behalf.
To increase communication channels and shareholder interaction, the Board has implemented a policy to give shareholders an opportunity to propose agenda items for future shareholders’ meetings. Shareholders are able to send their questions to us and propose agenda items to the Board for consideration via our website prior to any shareholders’ meetings. Guidelines that allow shareholders to nominate directors are also posted on our website. For the 2012 Annual General Meeting of Shareholders, TTA allowed shareholders to submit agenda items and director nominations through 30 September 2011 to provide sufficient time to consider all agenda items. The policy to include agenda items and recommend director nominations is posted in TTA’s website under Investor Relations.
(B) SHAREHOLDERS’ MEETINGS
TTA’s policy is to conduct shareholders’ meetings in accordance with the law and to allow shareholders to exercise their rights fully and in an informed manner. Within four (4) months after our financial year-end, we organise an Annual General Meeting (“AGM”). The meeting is conducted in accordance with applicable laws and SET requirements, from the calling of the meeting, the notification of the meeting agendas, the dispatch of meeting materials, the conduct of the meeting, and the distribution of minutes.
In addition, we publish the notice of each meeting in at least one Thai language and one English language daily newspaper for three consecutive days no later than three (3) days prior to each AGM. We also publish the meeting notice on our website. TTA seeks to promote the use of electronic communication within its reporting methods, so all documents are available on our website at http://www.thoresen.com.
Detailed procedures for each shareholders’ meeting are as follows:
(i) Procedures prior to the meetings
The 2011 AGM was held on 2 March 2011, because the first call of the 2011 AGM on 28 January 2011 did not achieve a quorum. TTA used the shareholders record date to give them more time to scrutinise meeting notices or request additional information ahead of the meeting. The notice to the 2011 AGM (rescheduled) was sent to shareholders and the SET on 9 February 2011, which complies with TTA’s policy that notice to any meeting must be sent at least fourteen (14) days prior to the meeting. The notice was also made available on TTA’s website thirty (30) days in advance so that shareholders have up to thirty (30) days to study the information to make their decisions. Each agenda included the opinion of the Board.
Prior to any shareholders’ meeting, details such as time and place of the meeting, the meeting agendas, proxy forms, and a list of documents required for attending the meeting are sent to shareholders to assist
18

158 Thoresen Thai Agencies Public Company Limited
them in exercising their rights and casting their votes on each agenda item. Information provided to shareholders includes:
1. Factual details, reasons, and the Board’s recommendation on each agenda item.
2. Material information, such as a list of names and credentials of proposed candidates for director position(s) to be appointed in replacement of former directors who retired by rotation for the year and details of remuneration of directors and Board committee members.
3. Details of meeting procedures and appointment of proxies. TTA also advises that shareholders may appoint an independent director as their proxy.
(ii) At the shareholders’ meeting
TTA facilitates registration by separating lines between shareholders and proxy holders. TTA uses a bar code system to register meeting attendees and to count votes. Stamps were made readily available for shareholders to mail their proxy forms. The e-voting programme of the Thailand Securities Depository Co., Ltd. (“TSD”) was also used in the registration and vote count, increasing efficiency and transparency.
(iii) During the meeting
The Chairman of the Board presided over the 2011 AGM. Nine out of ten directors, including the chairpersons of the Board committees, attended the meeting. The Chairman and the President & Chief Executive Officer were responsible for answering shareholders’ questions. Before the meeting formally began, the Chairman explained the voting procedures. After each agenda item, the voting results were announced.
For shareholders’ convenience and clarification, multimedia presentations are shown during all meetings. TTA conducts the meeting in accordance with the agenda and offers an equal opportunity for each shareholder to cast their vote. The Chairman gives shareholders sufficient opportunity to ask questions and make recommendations on any matter relating to TTA’s operations and financial statements without prejudicing the rights of any shareholder. The Chairman or President & Chief Executive Officer provides clarifications during the meeting and meets informally with shareholders afterwards. All votes cast at a shareholders’ meeting, whether in person or by proxy, are counted.
TTA has received excellent scores (ranging between 90-99) for the quality of AGM organisation since 2007. The assessment results were based on the assessment form of the SEC in conjunction with the Listed Companies Association and Thai Investors Association.
(iv) Procedures following the meeting
TTA prepares and promptly submits the minutes of each shareholders’ meeting to the SET within the required time frame of fourteen (14) days after the meeting. The minutes of the 2011 AGM were recorded and submitted to the SET on 16 March 2011, which was fourteen (14) days after the meeting. The minutes were also posted on our website at http://www.thoresen.com.
3. POLICY ON RIGHTS OF STAKEHOLDERS
TTA acknowledges the importance of all stakeholder groups. Recognising their contribution to our competitiveness and profitability, we take into consideration the interests of both internal stakeholders, namely shareholders, employees, and management and external stakeholders such as creditors, suppliers, clients, communities, government agencies, and other related organisations. To safeguard their rights, we comply with all applicable laws and regulations and have established adequate internal controls and auditing systems to monitor compliance.
18

159Annual Report 2011
The policy to review concerns from stakeholders has been implemented, and all stakeholders can communicate their concerns to the Audit Committee via our website. The concerns will be discussed and any material matters will be reported to the Board. If so instructed by the Board, an investigation into these concerns will be launched.
(A) SHAREHOLDERS
TTA aims to maximise shareholders’ long-term benefits by sustaining growth and profitability and maintaining competitiveness through careful consideration of current and future business risks. We place great importance on continuous business development, quality execution, effective internal controls, auditing systems, and risk management. We disclose all information fairly and transparently in a timely manner and use our best efforts to protect our assets and reputation.
(B) EMPLOYEES
Employees are regarded as valuable assets of the Company. We continually seek to recruit and retain capable and experienced employees in accordance with our strategic and operating plans. Essential training programmes are continuously provided to enhance employees’ capabilities. A favourable culture and atmosphere are promoted in the workplace, together with fair and equal treatment for all employees. We provide welfare and security to all our employees, with benefits including life, health, and dental care insurance and provident funds. We encourage our employees to acquire new knowledge and skills through third-party training programmes and offer them scholarships to pursue university education. TTA has established the Thoresen Club to organise activities, such as sports days, outings, and the New Year’s Party so that employees can relax and get together. Since 2009, TTA has launched the “TTA Happy Everyday” programme, under which various activities, including meditation, yoga, and relaxing massages, are provided after office hours to all employees. We also encourage our employees to join corporate social responsibility programme such as aid to flooding victims in Thailand.
In the past year, TTA improved its performance management system with an aim to build performance-based culture that aligns compensation with results and performance. The Performance objectives were set to align with the TTA’s strategy and were communicated and cascaded down the organisation.
In terms of development, quarterly People Development Forums (“PDF”) were held and dedicated solely to determine executive development policies and guidelines and succession planning of key positions in TTA and its subsidiaries. The Learning and Development Center was created under the Group to provide knowledge and skill training in areas of business and people management. In addition, the Management Development Program (“MDP”), a systematic executive development programme sponsored by the President & Chief Executive Officer, was established and aims to provide intensive development for senior and middle management.
(C) MANAGEMENT
TTA recognises that management is one of the key success factors for its operations. Accordingly, management remuneration is appropriately structured and comparable with other listed companies in Thailand. In 2010, TTA reviewed its remuneration policy for senior executives to reflect our new strategic direction. In January 2010, TTA launched an Employee Joint Investment Programme (“EJIP”) which is designed as a performance-based retention tool for key executives. Management is also allowed to work independently without interference as defined in their duties and responsibilities, which are approved by the Board.
18

160 Thoresen Thai Agencies Public Company Limited
(D) COUNTERPARTIES
TTA conducts business affairs with our partners, competitors, creditors, suppliers, etc. according to the contracted trading terms and conditions in a fair and ethical manner. Our policy is to avoid any dishonest actions or any actions that may infringe upon the rights of our counterparties as established by law or through mutual agreements.
For suppliers and creditors, TTA is pursuing a more centralised approach to ensure that we carry out business efficiently and fairly with them. TTA equally and fairly treats them by protecting our interests and ensuring that suppliers and creditors enjoy a fair return. TTA will avoid a situation that may lead to conflicts of interest and will honour any binding commitment that we have made.
For competitors, TTA treats them fairly and legally according to international principles without violating their secrets or acquiring their confidential information in a fraudulent way.
For lenders, TTA treats lenders fairly, responsibly, and transparently. We do not conceal information, which may cause damages for the lenders. If TTA cannot fulfil one or more of its obligations, we seek to notify the lenders so that a resolution can be agreed upon together.
(E) CLIENTS
We recognise that clients are crucial to the success of our operations. Accordingly, we ensure our clients’ satisfaction by offering high-quality services that meet their needs and expectations in a fair and professional manner. Recognising their importance, we give our clients the professional experience and the attention they deserve, protect their confidentiality and foster their trust. A client’s confidential information is strictly protected and will only be revealed if required by law or with proper consent from the relevant party.
(F) RESPONSIBILITY TO THE COMMUNITY, SOCIETY, AND ENVIRONMENT
TTA aims to achieve consistently high standards of behaviour towards society and the environment. We adhere to the highest safety and pollution control standards in our business operations. We sensitively deal with issues related to the public interest and participate in activities that are beneficial to communities and the environment. We also contribute to various charitable activities and promote employees’ concern for the environment. TTA’s corporate social responsibility activities can be reviewed on page 62.
4. INFORMATION DISCLOSURE AND TRANSPARENCY
TTA delivers accurate, sufficient, and complete disclosure of TTA’s financial information and material and other information that may have an impact on the interests of shareholders or any decision to invest in, or the price of, any shares and securities issued by TTA. This information is to be distributed on a timely basis and transparently through channels that are fair and trustworthy. The aim is to ensure that an investment in the Company’s shares and securities is based on an informed decision.
The designated executives that can disclose information about TTA are the Chairman, the President & Chief Executive Officer, the Executive Vice President, Corporate Finance and Accounting, and the Stakeholder Relations Associate Director. The disclosure officers meet and provide information to interested parties on various occasions as follows:
1. One-on-one meetings with shareholders, creditors, and analysts (88 meetings in 2011) 2. Quarterly meetings with analysts to discuss our most recent financial performance (4 meetings in 2011)
18

161Annual Report 2011
3. Investor conferences (6 conferences in 2011) 4. Road shows (2 road shows in 2011)
Apart from the above, a number of communication channels are used, including the annual reports, the annual financial statements, the SET web site, and general shareholders’ meetings. We are keen to promote the use of our website as another channel for information disclosure. Among other things, all SET information releases, recent research reports, presentations, and TV and magazine interviews are available on our website.
To contact the Company’s stakeholder relations unit, the general public may call 0-2250-0569 ext. 338 or e-mail [email protected].
5. BOARD OF DIRECTORS
(A) BOARD STRUCTURE
The size of the Board is stated in TTA’s Articles of Association, which specifies that the Board shall consist of not less than five directors. There are currently ten directors in the Board, the majority of which (8 out of 10) are independent directors.
All Directors have a number of duties and responsibilities, which include the following:
1. Directors should have sufficient access to financial and other business information to perform their duties effectively.
2. Directors should regularly attend every Board meeting, including committee meetings, raise essential questions to protect and ensure the rights and interests of TTA’s shareholders and other stakeholders, and ensure that the Company complies with best practices.
3. Directors should have the ability and display the willingness to learn TTA’s business and express their views independently by dedicating sufficient time and attention to all substantive issues.
4. Directors should regularly hold meetings without executive directors and try in every way possible to look for opportunities in which they can discuss business issues with management.
5. Non-executive directors are not expected to stay in their positions beyond a certain time limit. However, the difficulties of finding appropriate replacements, the benefits of the working relationship built up over the years within the Board and their understanding of the business are taken into account. While no time limits were formally established, the policy on director terms is that non-executive directors are not generally expected to hold office for more than ten years or four terms, consecutively or otherwise, unless there are justifiable reasons for their continuity, taking into consideration the responsibility of such persons, and their past, current, and anticipated contributions to TTA.
As a matter of principle, TTA limits the number of active boards on which our Directors may sit to ensure that they have sufficient time to devote to our business affairs.
(i) Executive Director
An executive director is a director who is involved in management on a full-time basis and receives regular monthly remuneration from TTA in the form of salary or its equivalent.
18

162 Thoresen Thai Agencies Public Company Limited
(ii) Independent Director
An independent director is a director who does not manage TTA or any of its subsidiaries, is independent from management and major shareholders, and has no business dealings with TTA, which may compromise our interests and/or the shareholders’ interests.
The main qualifications of an independent director include:
1. They must not hold more than 1 percent, including shares held by a related person, of the issued shares of TTA, its subsidiary, affiliate, or related company. To act as a member of the Audit Committee, the ownership restriction must not exceed 0.5 percent.
2. They must not be or have previously been directors who take part in management of TTA, an employee, a staff, a major shareholder of TTA, member or advisor who receives a regular salary, or a controlling person of TTA, its subsidiary, affiliate, related company, or same-level subsidiary unless they have not been involved in such positions for at least two years prior to the date of appointment. Such business relationship shall not be inclusive of the independent director who has previously been an officer or a consultant in a government sector who is a major shareholder or a controlling person of TTA.
3. They must be free of any direct or indirect, financial or other interests in the management and business of TTA, its subsidiary, affiliate, related company, a major shareholder, or a controlling person in a way that might interfere with their independent opinions, and neither being nor having been a significant shareholder, or a controlling person having business relationship with TTA, its subsidiary, affiliate, related company, or a major shareholder of TTA, unless they have not been involved in such positions for at least two years prior to the date of appointment.
4. They must not be related to any executive director, executive officer, controlling person, or major shareholder no matter by blood or registration under laws such as parents, spouse, siblings, and children, including the spouse of the children, executives, major shareholder, controlling person, or persons to be nominated as executive or controlling person of TTA or its subsidiary.
5. They must not be a director who has been appointed as a representative of TTA’s director, major shareholder, or shareholders who are related to TTA’s major shareholder.
6. They must not be or have previously been an auditor of TTA, its subsidiary, affiliate, related company, a major shareholder, a controlling person of TTA, and not being a significant shareholder, a controlling person or a partner of an audit firm which employs auditors of TTA, its subsidiary, affiliate, related company, a major shareholder, or a controlling person having business relationship with TTA, unless they have not been involved in such positions for at least two years prior to the date of appointment.
7. They must not be or have previously been persons who provided any professional advice and services, such as legal adviser or financial consultant, who receives service fees more than Baht 2 million per annum from TTA, its subsidiary, affiliate, related company, a major shareholder, or a controlling person of TTA, unless they have not been involved in such positions for at least two years prior to the date of appointment.
8. They must not operate any business which has the same nature as and is in competition with the business of TTA or its subsidiary, or not being a significant partner in any partnership, or not being an executive director, employee, staff, or an advisor who receives regular salary; or holding shares exceeding one percent of the total number of voting rights of any other company operating business which has the same nature as and is in significant competition with the business of TTA and its subsidiary.
18

163Annual Report 2011
9. They must not have any other characteristics or qualifications which might interfere with their independent opinions on TTA’s business operations.
(iii) Members of the Board of Directors
TTA has ten directors on the Board, which consists of one executive director (10% of the total number of Directors), one non-executive director (10% of the total number of Directors), and eight independent directors (80% of the total number of Directors). The Board as of 30 September 2011 consisted of the following persons:
Members of the Board of Directors as of 30 September 2011
Name Position
1. Mr. Aswin Kongsiri Chairman/Independent Director
2. M.L. Chandchutha Chandratat President & Chief Executive Officer/Executive Director
3. Dr. Pichit Nithivasin Vice Chairman (from 21 December 2011)/Independent Director
4. Prof. Dr. Warapatr Todhanakasem Independent Director
5. Prof. Athueck Asvanund Independent Director
6. Mr. Oral Wilson Dawe Independent Director
7. Mr. Sak Euarchukiati Independent Director
8. Mr. Stephen Fordham Director
9. Dr. Siri Ganjarerndee Independent Director
10. Mr. Peter Stokes Independent Director
(iv) Segregation of Positions
The Board elects one of its non-executive directors as Chairman. The Chairman and President & Chief Executive Officer are two separate individuals. The Chairman oversees the implementation of policies and guidelines pursuant to the strategies established by the Board and management and ensures that Board meetings are successfully conducted. During each meeting, all Directors are encouraged to actively participate and raise essential questions.
The authorities of the Board and management are clearly defined and segregated. Directors occasionally meet to advise and support management through the President & Chief Executive Officer. At the same time, the Board stays away from routine tasks or business activities under management responsibility. Only the President & Chief Executive Officer is authorised by the Board to perform such tasks. The President & Chief Executive Officer’s authority is therefore efficiently channelled through management.
(B) ROLES AND RESPONSIBILITIES OF THE MANAGEMENT STRUCTURE
(i) Board of Directors
The Board is committed to conducting itself in accordance with the highest standards of behaviour and in compliance with all laws, rules, and regulations. The Board’s primary responsibility is to supervise and direct management for TTA’s benefit. Among other things, the Board, acting directly or through committees, shall have the following duties:
18

164 Thoresen Thai Agencies Public Company Limited
1. Overseeing the conduct of the Company’s business to evaluate whether it is being properly managed and ensure all activities are conducted according to relevant laws and ethical standards.
2. Managing the Company’s performance in line with legal requirements, our objectives and by-laws, and resolutions adopted at the shareholders’ meetings.
3. Establishing and approving major financial objectives, plans, and actions.
4. Reviewing and approving major changes in the appropriate auditing and accounting principles and practices used in the preparation of the Company’s financial statements.
5. Assessing major risk factors relating to the Company’s performance and reviewing measures to address and mitigate such risks.
6. Evaluating its own performance and capabilities and improving its work processes as necessary.
7. Approving the compensation of employees.
8. Appointing the appropriate committees to manage the Company’s business affairs as assigned by the Board.
The Board has delegated to the President & Chief Executive Officer, working with other executive officers, the authority and responsibility for managing the business consistent with TTA’s standards and according to any specific plans, instructions, or directions of the Board.
Additionally, TTA focuses on internal control and risk management systems appropriate for our current business undertakings. The Board works in close consultation with management in a consistent manner with our Core Values, Mission, and Vision (“VMV”) framework and Code of Conduct.
(ii) The President & Chief Executive Officer
The powers and duties of the President & Chief Executive Officer that the Board deems appropriate include the following:
1. To implement TTA’s operations according to the policies, strategies and goals, budgets, and plans defined and approved by the Board, subject to legal requirements, regulations, and announcements made by the relevant authorities.
2. To monitor and provide reports on business conditions and the Company’s financial position, and recommend options and strategies, which are consistent with the policies and market conditions.
3. To consider and approve business transactions in accordance with the Board’s direction and within the limits established by the Board.
4. To manage and supervise all business and support functions, including finance, risk management, internal controls, operations, human resource management, and administration.
5. To represent TTA, including having the authority to deal with government agencies and regulators.
6. To oversee communications with all stakeholders and ensure that our reputation and image are continually enhanced.
7. To implement assignments entrusted to him by the Board and the Board committees.
18

165Annual Report 2011
8. To oversee implementation of good corporate governance practices.
9. To screen matters before forwarding them to the Board.
(iii) The Chairman of the Board
The Chairman of the Board is responsible for acting as the Chairman at all Board meetings and shareholders’ meetings. If the Chairman is unavailable to attend a meeting, the Board will elect a Presiding Director as Chairman for that meeting. The Chairman is also responsible for monitoring the meetings in line with legal requirements and TTA’s by-laws concerning the meetings (if any) and ensuring that the meetings proceed according to their agenda.
(C) COMPANY SECRETARY AND BOARD COMMITTEES
The Board reserves to itself the making of strategic policy decisions. The Board delegates more detailed considerations either to Board committees and officers (in case of its own processes) or the President & Chief Executive Officer (in case of the management of TTA’s business activities).
The Board has appointed the Company Secretary and five committees, namely the Audit Committee, the Nomination and Remuneration Committee, Investment Committee, Risk Management Committee and Corporate Governance Committee.
(i) Company Secretary
The Board appointed Ms. Mantanee Surakarnkul as the Company Secretary to take responsibility for matters connected with meetings of the Board and the shareholders and to contribute to best corporate governance practices.
The Company Secretary reports functionally to the Chairman and organisationally to the Executive Vice President, Corporate Finance and Accounting. Details of the Company Secretary’s functions are available on the Company’s website at http://www.thoresen.com.
(ii) Audit Committee
As of 30 September 2011, the Audit Committee (“AC”) comprised the following directors: Prof. Dr. Warapatr Todhanakasem (Chairperson), Dr. Siri Ganjarerndee, and Mr. Sak Euarchukiati. All AC members are independent directors. During the financial year that ended on 30 September 2011, the Audit Committee convened 9 meetings.
Together, the AC has the recent and relevant financial experience required to discharge their duties. The external auditors’ lead partner and TTA’s Executive Vice President, Corporate Finance and Accounting, Executive Vice President - Corporate Risk, and Compliance, and Internal Audit Senior Manager attend all key meetings prior to the release of our quarterly financial statements. During the year, the AC meets with the external auditors, Executive Vice President - Corporate Risk, and Compliance and the Internal Audit Senior Manager separately without any management in attendance.
The AC has full-delegated authority from the Board to perform its tasks, which include systematic monitoring and obtaining assurance that the legally required standards of disclosure and executive limitations relating to financial matters are being observed. Forward agendas are set each year to allow the AC to monitor management on the financial risks identified in TTA’s annual business plan. The Chairperson reports on the AC’s activities to the Board meeting immediately following every meeting. Between
18

166 Thoresen Thai Agencies Public Company Limited
meetings, the Chairperson reviews emerging issues with TTA’s Executive Vice President, Corporate Finance and Accounting, Executive Vice President - Corporate Risk, and Compliance, and Internal Audit Senior Manager and the external auditors.
The AC’s main tasks include:
1. Reviewing the accuracy, sufficiency, credibility, and objectivity of the financial reporting process by coordinating with the external auditors and executives responsible for preparing the quarterly and yearly financial reports.
2. Reviewing the appropriateness and effectiveness of internal control systems and internal audit functions by coordinating with the external auditors and internal auditors, ensuring the adequacy of the internal control systems and internal audit functions as follows:
• Reviewing the activities and organisational structure of the internal audit function and ensure no unjustified restrictions or limitations are made.
• Determining an internal audit unit’s independence.
• Considering and approving on the appointment, removal, transfer, or dismissal of the Internal Audit Senior Manager.
• Considering audit reports and recommendations presented by internal auditors and monitoring the implementation of the recommendations.
• Reviewing the adequacy of the Company’s risk management and ensuring that risk management complies with the guidelines of the relevant authorities and our internal policies.
3. Reviewing the Company’s business operations, ensuring that they comply with laws on securities and exchange, the SET’s regulations, and the laws relating to the Company’s business.
4. Considering, selecting, and nominating an independent person to be the Company’s auditor, including the auditing fee and the following main activities i.e.
• Reviewing the performance of the external auditors by taking into account the auditor’s credibility, the adequacy of resources, audit engagements, and experience of its staff assigned to audit the Company’s accounts.
• Reviewing the external auditors’ proposed audit scope and approach and ensure no unjustified and restrictions or limitations have been placed on the scope.
• Making recommendations to the board regarding the reappointment of the external auditors.
• Considering audit reports and recommendations presented by the external auditors and monitoring the implementation of the recommendations.
5. Reviewing the Company’s business operations, including connected transactions, and ensuring that there is no conflict of interest, taking into consideration transactions between TTA and subsidiaries or related parties in order to assure the effectiveness of the system for monitoring compliance with laws and regulations and to be reasonable for the highest benefit of the Company.
6. Preparing and disclosing in the Company’s annual report, an Audit Committee’s report which must be signed by the AC’s chairperson, which consists of at least the following information.
18

167Annual Report 2011
• Opinion on the accuracy, completeness, and creditability of the Company’s financial report.
• Opinion on the adequacy of the Company’s internal control system.
• Opinion on the compliance with the law on securities and exchange, the SET’s regulations, or the laws relating to the Company’s business.
• Opinion on the suitability of an auditor. TTA has a policy to safeguard the independence of the external auditors by limiting non-audit services to defined audit-related and tax services. A new lead audit partner is appointed every five years.
• Opinion on the transactions that may lead to conflicts of interests.
• Number of the AC meetings and the attendance of such meetings by each committee member.
• Opinion or overview comment received by the AC from its performance of duties in accordance with the charter.
• Other transactions which, according to the AC’s opinion, should be known to the shareholders and general investors, subject to the scope of duties and responsibilities assigned by the Company’s Board.
7. Performing any other act as assigned by the Company’s Board of Directors, with the approval of the AC.
8. Reviewing and updating the charter and then seek the approval of changes from the Board.
The work accomplished by the AC in 2011 included the following:
1. The AC reviewed all annual and quarterly financial reports before recommending their publication to the Board. The AC discussed and constructively challenged judgements related to critical accounting policies and estimates drawing on prepared reports, presentations, and independent advice from the external auditors.
2. Risk management activities and specific reports were reviewed quarterly
3. Internal controls were reviewed in the shipping business in areas of revenue cycle, ship management, crew management, bunkering, and dry docking.
4. Regular advice was also provided by the Internal Audit Department, including an annual assessment of the effectiveness of the Company’s controls. Reports of internal audit findings and management responses were reviewed in detail. Discussions of these reports contributed to the AC’s view of the effectiveness of the Company’s system of internal controls.
Appointment of the Auditors and Fixing the Auditing Fee
The Board assigned the AC to consider and propose the appointment of the external auditors and the auditing fee to the shareholders for approval at every AGM. At the 2011 AGM, the shareholders approved the following items:
1. The appointment of Mr. Kajornkiet Aroonpirodkul, License No. 3445, or Mr. Chanchai Chaiprasit, License No. 3760, or Mrs. Nattaporn Phan-Udom, License No. 3430, of PricewaterhouseCoopers as auditors for the 2011 financial year.
18

168 Thoresen Thai Agencies Public Company Limited
2. The audit fee in the amount of Baht 3.16 million to review and audit TTA’s financial statements and consolidated financial statements.
After reviewing the proposed audit engagement terms and fees, the AC advised the Board of its assessment and recommended that reappointment of PricewaterhouseCoopers be proposed to our shareholders at the next AGM to be held on 31 January 2012.
(iii) Nomination and Remuneration Committee
At the Board of Directors meeting held on 26 November 2010, the Board approved that the Nomination Committee and the Remuneration Committee be combined into one committee called the Nomination and Remuneration Committee (“NRC”) and on 13 May 2011, the Board approved the Nomination and Remuneration Committee Charter. The NRC comprises four (4) members being Dr. Pichit Nithivasin (Chairman), Mr. Stephen Fordham, Dr. Siri Ganjarerndee, and Mr. Sak Euarchukiati.
Before the combination of the two Committees, the Nomination Committee met three (3) times in 2011. The Remuneration Committee met twice in 2011. After the combination into NRC, the NRC met five (3) times in 2011. The NRC’s main tasks include:
1. Determining the process and criteria for the selection and qualification of candidates nominated in accordance with the structure, size, and composition of the Board of Directors as the Board of Directors prescribes;
2. Reviewing and making recommendations to the Board of Directors on all candidates nominated (whether by the Board of Directors, shareholders, or otherwise) for appointment to the Board of Directors, taking into account the candidate’s track record, age, knowledge, experience, capabilities, the number of previously held board positions, and other relevant factors;
3. Identifying and making recommendations to the Board of Directors as to the Directors who are to retire by rotation and to be put forward for re-election at each annual general meeting of the Company, having regard to the Directors’ contribution and performance (such as their attendance, preparedness, participation and candour), including, if applicable, as independent Directors;
4. Assessing annually whether or not a Director is independent or a new independent director meets the requirements prescribed by laws or relevant regulations;
5. Ensuring that, in connection with the re-election of Directors at annual general meetings of the Company, sufficient information is provided to the shareholders so as to enable them to make an informed decision;
6. Identifying and nominate candidates for the approval of the Board of Directors to fill vacancies in the Board of Directors and sub-committee as and when they arise;
7. Reviewing all candidates nominated for appointment as the Company’s chairman, or managing director;
8. Recommending to the Board of Directors a policy for the selection of the Chairman, develop a succession plan according to such policy, and review annually both the succession plan for the Chairman and the chief executive officer's succession plan proposed by management;
9. At least once every financial year, reviewing (and thereafter, making recommendations to the Board of Directors regarding) the Board of Directors structure, size, composition and core competencies, taking
18

169Annual Report 2011
into account the balance between executive and non-executive Directors and between independent and non-independent Directors, and having regard at all times to the principles of corporate governance;
10. Procuring that at least one-third (1/3) of the Board of Directors shall comprise of independent Directors or such other minimum proportion and criteria as prescribed by laws or relevant regulations;
11. Proposing, for approval by the Board of Directors, objective performance criteria (that allows comparison with the Company’s industry peers) to evaluate the effectiveness of the Board of Directors as a whole. Once approved by the Board of Directors, the performance criteria shall not be changed without proper justification from the Board of Directors;
The Chairman of the Board of Directors, in consultation with the Committee, will act on the results of the performance evaluation, and where appropriate, propose new members to be appointed to the Board of Directors or seek the resignation of Directors;
12. Supporting a channel for minor shareholders to propose a candidate to be a director of the Company;
13. Recommending and proposing for the Board of Directors approval a framework of remuneration and determine the specific remuneration package, including annual/ special bonuses, fees and any other type and form of remuneration for:
• Members of The Board of Directors for further approval by shareholders
• Members of any special committee established by the Board of Directors;
14. Recommend and propose for the Board of Directors approval a framework of remuneration and determine the specific remuneration package, including annual/ special bonuses, salaries and any other type or form of remuneration for:
• President & Chief Executive Officer
• Management Committee members, one level below the President & Chief Executive Officer
15. Conduct the annual performance evaluation and report the results to the Board of Directors for acknowledgement, of the following;
• President & Chief Executive Officer
16. Consider the Company’s annual remuneration budget, and propose to the Board of Directors for final approval;
17. Continue to follow and evaluate the remunerations for directors and executives by taking into account the following factors and keeping the Board of Directors informed of the Committee’s activities at the next Board of Directors meeting.
• The level of remuneration should be appropriate to attract, retain, and motivate directors and executives needed to run the Company successfully.
• The pay and employment conditions are competitive within the industry and in comparable companies.
Since 2009, Mercer (Thailand) Ltd. and Development Dimension International, Inc. (“DDI”) were engaged to formulate a new remuneration policy for the Company. The scope of work included developing job grades
18

170 Thoresen Thai Agencies Public Company Limited
for all positions, benchmarking current pay structures of all job grades with selected peers, and developing performance measurement tools. Using this data analysis, Corporate Human Resources structured competitive short-term and medium-term incentive plans, salary ranges for all job grades and performance assessment tools for Board approval.
A number of key principles were advocated and are now applied.
1. The remuneration structure will reflect a fair system of rewards.
2. A significant component of remuneration will be linked to the achievement of demanding performance targets, which include total shareholder returns to align executive and shareholder interests.
3. Assessment of performance will be both quantitative and qualitative, using defined competencies and key performance indicators.
4. Remuneration policy and practices will be as transparent as possible, both for participants and shareholders.
The new remuneration policy has been effective since 2010.
The NRC assesses market information and advice and applies its judgment to setting annual merit increases. In assessing the final outcome of individual bonuses each year, the NRC carefully reviews the Company’s achievements and competitor results.
Executive compensation consists of salary, annual bonus, long-term incentives, which include TTA shares from the Employee Joint Investment Program (“EJIP”), provident funds, and other benefits.
The Board sets the level of remuneration for all non-executive directors within the limits approved by shareholders. In line with the Thai Institute of Directors Association guidelines regarding Director Compensation Best Practices (September 2006), shareholders approved a compensation scheme for non-executive Directors that comprises monthly fees, attendance fees, and a bonus if TTA exceeds a 15% return on parent shareholders funds.
The Board is actively engaged in orderly succession planning to enable its composition to be renewal without compromising its continued effectiveness. In 2011, the shareholders appointed Mr. Oral Wilson Dawe as a director to fill the directorship position vacated by M.R. Chandram S. Chandratat who passed away in November 2010.
(iv) Risk Management Committee
At the Board of Directors meeting held on 14 May 2010, the Board approved the appointment of the Risk Management Committee (“RMC”) and on 14 December 2010, the Board approved the Risk Management Committee Charter. The RMC members comprise a minimum of four (4) members from the Company’s Directors and executives. The Board of Directors shall appoint one non-executive Director. The other members shall be President & Chief Executive Officer, Executive Vice President, Corporate Finance & Accounting, and Executive Vice President, Corporate Risk, and Compliance
The RMC’s main tasks include:
1. Reviewing the effectiveness of the Enterprise Risk Management system within the Group and be assured that material risks are identified and appropriate risk management processes are in place, including the formulation and subsequent updating of appropriate Group policies.
18

171Annual Report 2011
2. Evaluating the adequacy and effectiveness of administrative, operating, and accounting controls used by the Group.
3. Reviewing actual and potential material risk exposures.
4. Promoting and providing support to the execution of risk management program within the Group.
5. Monitoring the implementation of business unit and corporate risk management plans.
6. Reviewing business contingency planning processes within the Group and be assured that material risks are identified and appropriate contingency plans are in place.
7. Regularly coordinating with the Audit Committee by sharing information about risks and internal control potentially affecting the Company’s business.
8. Deciding and providing recommendations on critical issues obtained from the risk management process.
There were 4 (four) RMC meetings in 2011 Financial Year.
(v) Investment Committee
At the Board of Directors meeting held on 14 May 2010, the Board approved the appointment of the Investment Committee (“IC”) and on 14 December 2010, the Board approved the Investment Committee Charter. The IC members comprise a minimum of five members from the Company’s Directors and executives. From the Board, two Directors who have some knowledge or experience of the proposed investment project will be appointed by the Chairman of the Board for each proposed project. Other members shall be President & Chief Executive Officer, the Executive Vice President, Corporate Finance and Accounting, and Executive Vice President, Corporate Strategy.
The IC’s main tasks include:
1. Reviewing, evaluating, and recommending to the Board for approval of new diversification investments, if it determines that such investments would be in the best interests of the Company;
2. Review, considering, and making recommendations to the Board on the implementation of an Investment Policy and/or investment projects;
3. Reviewing, evaluating, and considering procedures that management has implemented to monitor compliance with an Investment Policy on each and any of the investment projects;
4. Providing guidance to management on analysing and structuring the proposed investment project prior the submission to the Board for approval;
There was no IC meeting in 2011 Financial Year.
(D) CONFLICT OF INTEREST
(i) Potential Conflict of Interest Transactions and Inter-Company Transactions
The Board understands that transactions, which could lead to a potential conflict of interest and/or related party transaction, must be considered very carefully in full compliance with the relevant rules and regulations of the SET. Moreover, such transactions are entered into on an “arm’s length” basis and are conducted in the best interests of TTA and all shareholders.
18

172 Thoresen Thai Agencies Public Company Limited
Since 2009, TTA Directors and executives were required to submit a report that summarises their and their related persons’ interests and securities ownership in other companies. This information was filed with TTA and is used to monitor potential related party or connected transactions. New TTA Directors and senior executives shall submit this report within thirty (30) days after being appointed.
In case there are changes in related persons and close relatives, Directors and executives shall submit a revised report to TTA within fourteen (14) days after changes occur.
The Board also monitors compliance with the regulations regarding criteria, procedures, and disclosure of such transactions. TTA has a policy to disclose detailed information of these transactions, which includes transaction amounts, transaction parties, their underlying reasons, and necessity of the transaction in our annual reports.
TTA has a policy to prevent Directors, executives, and employees from using their status to seek personal benefit. As a result, Directors, executives, and employees must refrain from any transactions that may lead to a conflict of interest with TTA. Any interested Directors, executives, and employees are not allowed to participate in the decision-making process. In particular, Directors are prohibited from considering or casting their votes on matters in which they may have a potential conflict of interest.
The Board and management also emphasise a prudent and unbiased review of inter-company transactions, which are transactions between TTA and its subsidiaries.
(ii) Monitoring Insider Trading
The Board prohibits Directors, executives, and employees from using an opportunity or information acquired while working in their positions to seek personal benefit or to establish a competing or related business with TTA. This policy includes a complete prohibition against using material insider information to buy or sell TTA’s shares and securities for their own interest and against giving insider information to other persons or entities to buy or sell TTA’s shares and securities.
Directors and executives are required to report trading transactions in TTA’s shares and securities and their ownership position whenever changes occur. The Board has a policy prohibiting all Directors and senior executives to trade in TTA’s shares and securities during the period of three (3) weeks prior to the release of our quarterly and annual financial results. This prohibition applies to entities in which our Directors have a beneficial interest, are employed by, or act as a representative thereof.
(E) INTERNAL CONTROL
TTA focuses its utmost attention on internal control systems to ensure efficiency in all management and operation levels. The Internal Audit Department (“IAD”) is an independent department that reports directly to the AC. The IAD assists the AC and the Board by performing regular evaluations on TTA’s internal controls, financial and accounting matters, compliance, business and financial risk management policies and procedures, and ensuring that internal controls are adequate to meet TTA’s requirements.
With respect to internal control, TTA has focused on five main areas as follows:
1. Organisational Control and Environment Measures
The organisation structure has been appropriately designed to facilitate management to effectively manage business activities. In addition, business goals have been formulated for employees to follow and have been closely monitored. We recognise that a proper control environment will lead to work efficiency and effectiveness of work.
18

173Annual Report 2011
2. Risk Management Measures
TTA’s management has reviewed its risk policy, frameworks, and plans. The management and all staff have also been encouraged to be aware of the importance of risk and the significance of risk management so that everyone is prepared to mitigate or resolve the identified risk appropriately in a timely fashion. We are promoting a risk awareness culture, in which risk management is everyone’s responsibility. A risk management structure has been systematically created. Risk management plans and measures have been formulated where both internal and external risk factors possibly affecting TTA’s businesses and targets as well as operations are assessed. In addition, TTA has formulated its reporting and risk management monitoring procedures for appropriate responses to constant changes. Risk management monitoring plans are carefully reviewed before being reported to the Board on a quarterly basis.
3. Management Control Activities
Authority and approval assignments have been defined for each department and are monitored regularly. Transactions with major shareholders, Directors, management, and related parties have been carefully controlled to conform to the Notification of the SET regarding Rules and Procedures and Disclosure of Connected Transactions of Listed Companies. In addition, TTA recognises the importance of internal control systems on an operational level to ensure that operations are conducted efficiently. Powers and duties of operations and management level personnel are laid down clearly, including proper segregation of duties between the operations units, control units, and assessment units for the purpose of maintaining appropriate checks and balances. There is a proper level of control maintained on the utilisation of our property/assets. Moreover, an internal control system for the financial and accounting functions is clearly set up, which allows adequate reporting to the relevant management.
4. Information and Communication Measures
Information technology has been developed to ensure efficient business operations and to serve management’s needs. We recognise the importance of accurate, reliable, and prompt information and communication. The primary objective is the provision of accurate and timely data for decision-making. TTA has invested in an effective communication system, including internal and external channels. The accounting records conform to generally accepted accounting standards and the accounting files are updated regularly. Documents for the shareholders’ meetings and the Board of Directors’ meetings have been delivered ahead of the meetings and contain sufficient information for the shareholders or the Board to make decisions.
5. Monitoring
Since the existing systems provide prompt and reliable information on a regular basis, management and Board can therefore achieve proper monitoring over relevant financial reports in an effective manner. At the same time, they can also perform an accurate review and assessment, and suggest improvement over existing business plans, supported by effective internal supervision carried out by the IAD throughout the year.
The internal audit system has been regularly reviewed by the IAD, according to an annual audit plan and the results of the performed audits were reported to the AC. No material deficiencies have been reported to date. However, recommendations regarding internal controls have been provided in some areas. The IAD also reviews whether key operations and financial activities are conducted efficiently and legally.
18

174 Thoresen Thai Agencies Public Company Limited
(F) BOARD MEETINGS
The Board is generally required to meet at least four (4) times a year. Special meetings are convened as necessary to address specific needs. In 2011, there were fourteen (14) Board meetings. Principal meeting agendas were: consideration of TTA’s strategic direction, annual business plan and budget, quarterly financial reports, and significant acquisition and disposal of assets. The Company Secretary ordinarily prepares and circulates the agenda at least seven days before each meeting and relevant documents at least seven (7) days before each meeting to allow Board members time to consider the issues.
The Company Secretary records the minutes, which are ordinarily circulated to the Board members within fourteen (14) days after the meeting. The minutes are adopted at the next subsequent meeting and are kept for scrutiny by the Board members and other concerned parties.
The Board requires all members to devote sufficient time to the work of the Board, to perform the duties and responsibilities of Directors, and to use their best endeavours to attend meetings. Details of attendance records in 2011 are shown in the following table.
Details of Directors’ Attendance Record in 2011 Financial Year
Name
Board Meetings Audit Committee Meetings Nomination Committee Meetings/1
Remuneration Committee Meetings/2
Nomination and
Remuneration Committee
Meetings
Risk Management
Committee Meeting
Regular Meeting
Special Meeting
Total Regular Meeting
Special Meeting
Total
1. Mr. Aswin Kongsiri 3/4 9/10 12/14 2/2 - 2/2 - - - -
2. M.L. Chandchutha Chandratat
4/4 10/10 14/14 - - - - - - 4/4
3. Dr. Pichit Nithivasin 4/4 9/10 13/14 - - - 3/3 2/2 3/3 -
4. Prof. Dr. Warapatr Todhanakasem**
0/0 1/2 1/2 - 1/1 1/1 - - - -
5. Prof. Athueck Asvanund** 0/0 1/2 1/2 - - - - - - -
6. Mr. Oral Wilson Dawe* 1/2 5/7 6/9 - - - - - - 2/3
7. Mr. Sak Euarchukiati 4/4 9/10 13/14 6/6 1/1 7/7 3/3 2/2 3/3 1/1
8. Mr. Stephen Fordham 3/4 9/10 12/14 - - - 3/3 - 3/3 -
9. Dr. Siri Ganjarerndee 4/4 9/10 13/14 6/8 - 6/8 2/3 1/2 3/3 -
10. Mr. Peter Stokes 3/4 9/10 12/14 - - - - - - -
Note : * Mr. Oral Wilson Dawe became a Board member in March 2011. ** Prof. Athueck Asvanund and Prof. Dr. Warapatr Todhanakasem became Board members in August 2011 /1 the Nomination Committee meetings before the combination of Remuneration Committee and Nomination Committee in
November 2010 /2 the Remuneration Committee meetings before the combination of Remuneration Committee and Nomination Committee in
November 2010
18

175Annual Report 2011
Details of Directors’ Attendance Record of Directors who resigned during the 2011 Financial Year
Name
Board Meetings Audit Committee Meetings Nomination and Remuneration
Committee Meetings
Risk Management
Committee Meeting
Regular Meeting
Ad-hoc Meeting
Total Regular Meeting
Ad-hoc Meeting
Total
1. Mrs. Pratana Mongkolkul 4/4 5/8 9/12 6/8 - 6/8 - -
2. Mrs. Joey Horn 3/3 6/8 9/11 - - - - -
Note: Mrs. Pratana Mongkolkul resigned on 15 August 2011. Mrs. Joey Horn resigned on 31 July 2011.
(G) BOARD ASSESSMENT AND ROTATION
The Board is composed of ten directors. Directors stand for re-election every three (3) years. The executive Director has an employment contract with TTA.
The Board is pursuing a gradual process to rotate its composition without compromising its continued effectiveness. New board members are invited based on many criteria, an important one being their ability to contribute to TTA’s business growth strategy.
Our policy on director term limits is such that non-executive Directors are not generally expected to hold office for more than ten years or four terms, consecutively or otherwise, unless with justified reasons taking into consideration the responsibility of such persons, and their past, current, and anticipated contributions to TTA.
The Board conducted a formal evaluation of its own performance for the year that ended on 30 September 2011. The evaluation process was led by the Chairman of the NRC and was conducted by sending a board assessment form to each Director. The responses to the form were collated by the Company Secretary.
There were six (6) main areas of evaluation namely: 1. Structure and Characteristics of the Board 2. Roles and Responsibilities of the Board 3. Board of Directors Meeting 4. Board of Directors’ Performance 5. Relationship with Management 6. Self Development of Directors
The Board had discussed the results and asked board committees to propose measures to improve the efficiency of the Board.
(H) REMUNERATION
(i) Remuneration of Directors and Management
The Board’s policy is that Director remuneration should reflect their duties and responsibilities to fulfil the expectations of all stakeholders. It is implicit that Directors must possess appropriate experience and qualifications to discharge such duties.
The current Board remuneration was approved at the 2011 AGM. The Board, based on recommendations by the NRC, also sets the remuneration for senior management. These amounts take into consideration the
18

176 Thoresen Thai Agencies Public Company Limited
responsibility of such executives, and their past, current, and anticipated contributions to TTA. To the extent possible, such compensation will reflect the relative compensation level for senior executives in the market.
(ii) Remuneration for the Board, the Board Committees, and Senior Executive Officers in 2011
Remuneration in Cash
The Board’s Remuneration
At the 2011 AGM, TTA’s shareholders approved the remuneration of TTA’s Board as follows:
• Total standard monthly fees for all nine non-executive directors shall be Baht 430,000. If an additional non-executive director is appointed to the Board, he/she will receive a standard monthly fee of Baht 35,000. The non-executive directors shall receive an attendance fee of Baht 45,000 per meeting. The Chairperson of the Board of Directors shall receive an attendance fee of Baht 54,000 per meeting (equal to 1.20 times the attendance fee of other non-executive directors).
• The Chairperson of the AC shall receive an attendance fee of Baht 48,000 per meeting (equal to 1.20 times the attendance fees of other AC members), while other AC members shall each receive an attendance fee of Baht 40,000 per meeting.
• The Chairperson of the Nomination and Remuneration Committee shall receive an attendance fee of Baht 36,000 per meeting, which is equal to 1.20 times of the attendance fee of other members of the Nomination and Remuneration Committee members. Other Remuneration and Nomination Committee members shall each receive an attendance fee of Baht 30,000 per meeting.
• The Chairpersons of the Investment Committee and the Risk Management Committee shall each receive an attendance fee of Baht 18,000 per meeting, which is equal to 1.20 times the attendance fees of other members of the Investment Committee and the Risk Management Committee. Other members shall each receive an attendance fee of Baht 15,000 per meeting.
• Travelling allowance shall be paid to foreign directors who travel into Thailand to attend Board of Directors meetings or committee meetings as follows:
- From Asia to Thailand: USD 500 per day
- From Europe/USA and others to Thailand: USD 1,000 per day
• The executive Director(s) shall receive no monthly fees or other forms of remuneration.
• To align the interests of the Board and shareholders, a bonus for all non-executive Directors is proposed to be paid only after a 15% return on parent shareholders funds* is achieved. Once this threshold is reached, a bonus equal to 0.50% of annual consolidated net profit above a 15% return on parent shareholders funds will be shared equally among all non-executive Directors.
Note : * Return on parent shareholders funds
TTA consolidated net profit – unrealised exchange gains or losses
paid up share capital + share premium + legal reserve + retained earnings
18
=

177Annual Report 2011
Full remuneration and bonus details are prescribed in the table below.
Remuneration and Bonus for the Board and Board Committees for the 2011 Financial Year
Unit: Baht
Name
Board of Directors Attendance Fees Total (Standard
and attendance
fees)
Travel Allowance
(only foreign directors)
(USD)
Standard Remuneration*
Bonus Board of
Directors
Audit Committee
Nomination Committee/1
Remuneration Committee/2
Nomination and Remuneration
Committee
Risk Management
Committee
1. Mr. Aswin Kongsiri 1,595,000 - 648,000 80,000 - - - - 2,323,000 -
2. M.L. Chandchutha Chandratat
- - - - - - - - - -
3. Dr. Pichit Nithivasin 420,000 - 585,000 - 45,000 36,000 108,000 - 1,194,000 -
4. Prof. Dr. Warapatr Todhanakasem**
54,194 - 45,000 - - - - - 99,194 -
5. Prof. Athueck Asvanund**
54,194 - 45,000 - - - - - 99,194 -
6. Mr. Oral Wilson Dawe**
243,871 - 270,000 - - - - 15,000 528,871 4,500
7. Mr. Sak Euarchukiati 420,000 - 585,000 240,000 45,000 30,000 90,000 - 1,410,000 -
8. Mr. Stephen Fordham 420,000 - 540,000 - 54,000 - 90,000 - 1,104,000 6,000
9. Dr. Siri Ganjarerndee 420,000 - 585,000 240,000 30,000 15,000 90,000 - 1,380,000 -
10. Mr. Peter Stokes 420,000 - 540,000 - - - - - 960,000 10,000
Total 4,047,259 - 3,843,000 560,000 174,000 81,000 378,000 15,000 9,098,259 USD 20,500
Note: * Mr. Oral Wilson Dawe became a Board member in March 2011 and Prof. Dr. Warapatr Todhanakasem and Prof. Athueck Asvanund
became Board member in August 2011. /1 the Nomination Committee meetings before the combination of Remuneration Committee and Nomination Committee in
November 2010 /2 the Remuneration Committee meetings before the combination of Remuneration Committee and Nomination Committee in
November 2010
Remuneration and Bonus for the Board and Board Committees who resigned during the financial year 2011
Name
Board of Directors Attendance Fees Total
(Standard and attendance
fees)
Total Travelling Allowance (only
foreign directors) (USD)
Standard Remuneration* Bonus
Board of Directors
Audit Committee
Remuneration and Nomination
Committee
1. Mrs. Pratana Mongkolkul 366,935 - 405,000 288,000 - 1,059,935 -
2. Mrs. Joey Horn 350,000 - 405,000 - - 755,000 3,000
Total 716,935 - 810,000 288,000 - 1,814,935 USD 3,000
18

178 Thoresen Thai Agencies Public Company Limited
Remuneration of Executives
Remuneration of executives in the form of salary and bonus and other cash remuneration is as follows:
Unit: Baht millions
Executives during financial year/full-year
equivalent people 2011
Executives during financial year/full-year
equivalent people 2010
Total salary and bonus 9 persons/8.83 persons Baht 68.29 million 9 persons/7.5 persons Baht 57.00 million
Other remuneration (Provident fund contributions by TTA)
9 persons/8.83 persons Baht 5.59 million 9 persons/7.5 persons Baht 4.74 million
Note: One executive resigned in September 2011.
Two executives joined in July 2010.
(I) DIRECTOR ORIENTATION AND DEVELOPMENT
The President & Chief Executive Officer normally gives orientation meetings for new Board members. In these meetings, briefings on TTA’s policies and key business operations are given, along with the Memorandum and Articles of Association, recent presentations, the latest annual report, and board committees’ charters, in a Director’s Handbook.
In addition, TTA encourages Directors to attend courses or join activities aimed at improving their performance on the Board and Board committees. Six directors have participated in the Thai Institute of Directors’ (“IOD”) director training programmes, including the Director Certification Program (“DCP”), the Director Accreditation Program (“DAP”), the Finance for Non-Finance Director Program (“FN”), and the Role of Chairman Program (“RCP”).TTA encourages Directors who have not participated in the above training programmes to participate at the Company’s expense.
List of key courses in IOD which TTA’s directors attended
Courses No. of participants
The Role of Chairman 1
The Director Accreditation Program 2
The Director Certification Program 4
The Finance for Non-Finance Director Program 1
6. TTA’S BUSINESS ETHICS AND CODE OF CONDUCT
(A) TTA’S ETHICAL AND OPERATIONAL GUIDELINES
TTA has the following ethical and operational guidelines:
(i) Fairness
We believe in being fair to all parties having a business relationship with us and conscientiously avoid favouritism or a conflict of interest situation.
(ii) Professionalism
We carry out our responsibilities in a professional manner and are determined to achieve excellence by continuously increasing performance levels through new methods and technologies.
18
179Annual Report 2011
(iii) Proactiveness
We are responsive to client needs and social, technical, and economic changes and adapt to the circumstances.
(iv) Discipline and Compliance
We pursue business affairs with discipline and ethical principles and ensure that our undertakings comply with laws, rules, and regulations.
(B) CODE OF CONDUCT
The Board has approved a VMV framework to guide our business operations. A Code of Business Conduct was approved by the Board on 12 February 2010 to implement the VMV framework, emphasising our four Core Values.
TTA has arranged Code of Conduct training to all employees to ensure that they understand good practices and has included the Code of Conduct training as part of the orientation for new employees.
Our four Core Values are:
(i) Integrity : We are open, honest, and ethical, deliver on our promises, and build and nurture trust in our relationships.
(ii) Excellence : We set high standards of quality, safety, environment, security, and service, are always prepared for challenges, and conduct our business professionally.
(iii) Team Spirit : We care for our clients, employees, and suppliers and behave in ways that build a spirit of teamwork and collaboration and show deep respect for one another.
(iv) Commitment : We are passionate about the future of this Company and feel accountable for business results and success.
The Board’s policy is that Directors will pursue the highest standards of ethical conduct in the interests of all stakeholders. The Board allows executive Director(s) to take up external board appointments, subject to the agreement and approval of the Board. Executive Director(s) retain(s) any fees received in respect of such external appointments. Generally, outside appointments are limited to two (2) outside company boards only. Non-executive Directors may serve on a number of outside boards, however, provided that they continue to demonstrate the requisite commitment to discharge effectively their duties to TTA.
18

180 Thoresen Thai Agencies Public Company Limited
Inside Information Control19
Directors and management are required to submit securities holding reports to TTA on the same day as when they submit the reports to the SEC and the SET in accordance with the SEC and SET Notifications regarding reports of securities holding. They are also required to follow the SET Guidelines on Insider Trading, which require Directors and executives refraining from securities trading before the disclosure of financial statements or other important information that may affect the price of the securities. For further details, please review our Corporate Governance Report.

181Annual Report 2011
Related Party Transactions20
Party Transactions
Related party transactions between TTA and its subsidiaries or between subsidiaries and subsidiaries are shown in the notes to the consolidated financial statements. Major related party transactions between TTA and its subsidiaries with associates or joint ventures are as follows:
Companies Related Party Companies/Entities
Relationship Description of Transactions
Transaction Amount (Baht) Pricing Policy
30 Sept. 2010 30 Sept. 2011
1. Mermaid Maritime Public Company Limited
Asia Offshore Drilling Limited
TTA holds a 57.14% stake in Mermaid Maritime Public Company Limited and Mermaid Maritime Public Company Limited holds a 33.75% stake in Asia Offshore Drilling Limited. Both companies have a common director.
Mermaid Maritime Public Company Limited charged administrative, technical, and commercial management services to Asia Offshore Drilling Limited.
- (No transaction in 2010)
224,587,401.29 (Recorded as other income)
Price was negotiated between Mermaid Maritime Public Company Limited and Asia Offshore Drilling Ltd. It was fair and market based price as evaluated by third financial expet.
2. Soleado Holdings Pte. Ltd.
Merton Group (Cyprus) Ltd.
TTA holds a 100% stake in Soleado Holdings Pte. Ltd. and Soleado Holdings Pte. Ltd. holds a 24.3% stake in Merton Group (Cyprus) Ltd. Both companies are direct and indirectly held by TTA, respectively.
Soleado Holdings Pte. Ltd. lent USD 17.8 million to Merton Group (Cyprus) Ltd. As of 30 September 2011, the outstanding loan was USD 17.8 million, or equivalent to Baht 554.78 million. Soleado Holdings Pte. Ltd. charges an interest rate of 25% per annum on the loan.
49,364,841.00 (Recorded as interest income)
89,633,089.04 (Recorded as interest income) (The outstanding loan and interest have been converted into equity of SKI Energy Resources Inc.)
Interest rate was based on a mutual agreement and in line with the commercial risk for a pre-operating company in the Philippines.
3. Shipping group of companies
Fearnleys (Thailand) Ltd.
TTA holds a 99.99% stake in all dry bulk vessel owning companies and holds a 49% stake in Fearnleys (Thailand) Ltd. Both companies are direct and indirectly held by TTA, respectively.
Fearnleys (Thailand) Ltd. provided ship chartering services to the dry bulk shipping business.
42,500,923.01 (Inter-company transactions were eliminated, as Fearnleys (Thailand) Ltd. was a subsidiary last year and become an associate in 2011.)
31,205,039.34 (Recorded as vessel operating expenses)
Same price as normally charged to a third party
4. Soleado Holdings Pte. Ltd.
Petrolift Inc. TTA holds a 100% stake in Soleado Holdings Pte. Ltd. and Soleado Holdings Pte. Ltd. holds a 40% stake in Petrolift Inc. Both companies are direct and indirectly held by TTA, respectively.
Petrolift Inc. declared a dividend of 0.1588 Philippine Pesos per share. As of 30 September 2011, the outstanding dividend to be paid to Soleado Holdings Pte. Ltd. was 68 million Philippine Pesos.
- (No transaction in 2010)
48,331,637.50 (Recorded as amount due from related parties. This amount was received in October 2011.
From profit of Petrolift Inc.

182 Thoresen Thai Agencies Public Company Limited
20
Companies Related Party Companies/Entities
Relationship Description of Transactions
Transaction Amount (Baht) Pricing Policy
30 Sept. 2010 30 Sept. 2011
5. Baconco Co., Ltd. Thoresen-Vinama Agencies Co., Ltd.
TTA holds a 100% stake in Soleado Holdings Pte. Ltd. and Soleado Holdings Pte. Ltd. holds a 100% stake in Baconco Co., Ltd. TTA holds a 50% stake in Thoresen (Indochina) S.A. and Thoresen (Indochina) S.A. holds a 49% stake in Thoresen- Vinama Agencies Co., Ltd. Both companies are indirectly held by TTA.
Baconco Co., Ltd. lent USD 2 million to Thoresen-Vinama Agencies Co., Ltd. As of 30 September 2011, the outstanding loan was USD 2 million.
- (No transaction in 2010)
62,181,000.00 (Recorded as long term loan)
The loan principal is repayable within 2 years at USD 1 million per year plus 50% and 25% profit sharing of the bonded warehouse that is built by Thoresen- Vinama Agencies Co., Ltd. in the first and second year, respectively.
6. Thoresen Thai Agencies Public Company Limited
The Post Publishing Public Company Limited
TTA does not hold shares in The Post Publishing Public Company Limited. However, both companies have a common director.
The Post Publishing Public Company Limited charged for newspaper membership and advertisement.
254,476.00 (Recorded as administrative expenses)
352,946.00 (Recorded as administrative expenses)
Same price as normally charged to a third party
7. Thoresen Thai Agencies Public Company Limited
Prasit Patana Public Company Limited
TTA does not hold shares in Prasit Patana Public Company Limited. However, both companies have a common director.
Prasit Patana Public Company Limited charged for medical services.
41,637.80 (Recorded as administrative expenses)
39,700.00 (Recorded as administrative expenses)
Same price as normally charged to a third party
Necessity and Rationale of Related Party Transactions
In case TTA or a subsidiary signs an agreement or conducts a related party transaction with a subsidiary company, affiliated company and/or third party, TTA or a subsidiary will consider the necessity and rationale of such agreement based mainly on TTA’s interests. Approval Measures or Procedures of Related Party Transactions
If TTA or its subsidiary is to execute an agreement or if there is any related party transaction between TTA and its subsidiary, affiliated company, related company, third party and/or anyone with possible conflict of interests, the Board of Directors requires TTA or a subsidiary, for the purpose of its benefits, to comply with the rules and regulations of the SET and the SEC regarding disclosure of information of listed companies concerning connected transactions. Prices and other conditions shall be on an arm’s length basis and are conducted in the best interests of TTA and all shareholders. Directors, executives, or employees having an interest in such transaction are not allowed to participate in the decision-making process and in any approval process. Policy for Future Related Party Transactions
The Audit Committee and TTA will jointly consider and review any related party transactions that may arise in the future to ensure their necessity and fair price basis.

183Annual Report 2011
Company Investments21
No. Name of Company Type of Shares
# of Issued Shares
# of Invested Shares
% of Holding
Par Value
Transport Group
Type of Business : International Maritime Transportation
1 Thoresen & Company (Bangkok) Limited 26/26-27 Orakarn Building, 8th Floor Chidlom Road, Lumpinee, Pathumwan Bangkok 10330 Tel. : +66 (0) 2250-0569
Ordinary Preference
9,470,000 3,030,000
9,470,000 3,029,994
99.9 10
2 Thor Jupiter Shipping Co., Ltd. Ordinary 974,000 973,993 99.9 100
3 Thor Wind Shipping Co., Ltd. Ordinary 2,000,000 1,999,993 99.9 100
4 Thor Wave Shipping Co., Ltd. Ordinary 2,000,000 1,999,993 99.9 100
5 Thor Harmony Shipping Co., Ltd. Ordinary 3,500,000 3,499,993 99.9 100
6 Thor Dynamic Shipping Co., Ltd. Ordinary 3,600,000 3,599,993 99.9 100
7 Thor Integrity Shipping Co., Ltd. Ordinary 3,850,000 3,849,993 99.9 100
8 Thor Enterprise Shipping Co., Ltd. Ordinary 6,300,000 6,299,993 99.9 100
9 Thor Energy Shipping Co., Ltd. Ordinary 10,000,000 9,999,993 99.9 100
10 Thor Endeavour Shipping Co., Ltd. Ordinary 11,000,000 10,999,993 99.9 100
11 Thor Merchant Shipping Co., Ltd. Ordinary 200,000 199,994 99.9 100
12 Hermes Shipping Co., Ltd. Ordinary 270,000 269,994 99.9 100
13 Thor Star Shipping Co., Ltd. Ordinary 300,000 299,993 99.9 100
14 Thor Skipper Shipping Co., Ltd. Ordinary 300,000 299,993 99.9 100
15 Thor Sailor Shipping Co., Ltd. Ordinary 300,000 299,993 99.9 100
16 Thor Mariner Shipping Co., Ltd. Ordinary 350,000 349,994 99.9 100
17 Thor Sun Shipping Co., Ltd. Ordinary 400,000 399,993 99.9 100
18 Thor Spirit Shipping Co., Ltd. Ordinary 400,000 399,993 99.9 100
19 Thor Sky Shipping Co., Ltd. Ordinary 400,000 399,993 99.9 100
20 Thor Sea Shipping Co., Ltd. Ordinary 400,000 399,993 99.9 100
21 Thor Trader Shipping Co., Ltd. Ordinary 450,000 449,993 99.9 100
22 Thor Traveller Shipping Co., Ltd. Ordinary 450,000 449,993 99.9 100
23 Thor Orchid Shipping Co., Ltd. Ordinary 472,500 472,493 99.9 100
24 Thor Confidence Shipping Co., Ltd. Ordinary 500,000 499,993 99.9 100
Investments in other companies exceeding 10% of other companies' shares as of 30 September 2011 are as follows:

184 Thoresen Thai Agencies Public Company Limited
21
No. Name of Company Type of Shares
# of Issued Shares
# of Invested Shares
% of Holding
Par Value
25 Thor Nautilus Shipping Co., Ltd. Ordinary 500,000 499,993 99.9 100
26 Thor Mercury Shipping Co., Ltd. Ordinary 600,000 599,994 99.9 100
27 Thor Triumph Shipping Co., Ltd. Ordinary 600,000 599,993 99.9 100
28 Thor Lotus Shipping Co., Ltd. Ordinary 630,000 629,993 99.9 100
29 Thor Jasmine Shipping Co., Ltd. Ordinary 700,000 699,993 99.9 100
30 Thor Champion Shipping Co., Ltd. Ordinary 750,000 749,993 99.9 100
31 Thor Venture Shipping Co., Ltd. Ordinary 750,000 749,993 99.9 100
32 Thor Guardian Shipping Co., Ltd. Ordinary 750,000 749,993 99.9 100
33 Thor Nautica Shipping Co., Ltd. Ordinary 753,000 752,993 99.9 100
34 Thor Pilot Shipping Co., Ltd. Ordinary 800,000 799,993 99.9 100
35 Thor Navigator Shipping Co., Ltd. Ordinary 990,000 989,993 99.9 100
36 Thor Transit Shipping Co., Ltd. Ordinary 1,000,000 999,993 99.9 100
37 Thor Alliance Shipping Co., Ltd. Ordinary 1,060,000 1,059,993 99.9 100
38 Thor Commander Shipping Co., Ltd. Ordinary 1,150,000 1,149,993 99.9 100
39 Thor Tribute Shipping Co., Ltd. Ordinary 1,170,000 1,169,993 99.9 100
40 Thor Neptune Shipping Co., Ltd. Ordinary 1,380,000 1,379,993 99.9 100
41 Thor Captain Shipping Co., Ltd. Ordinary 1,530,000 1,529,994 99.9 100
42 Thor Nexus Shipping Co., Ltd. Ordinary 1,857,000 1,856,993 99.9 100
43 Thor Master Shipping Co., Ltd. Ordinary 1,880,000 1,879,993 99.9 100
44 Thor Transporter Shipping Co., Ltd. Ordinary 2,000,000 1,999,993 99.9 100
45 Thor Nereus Shipping Co., Ltd. Ordinary 2,128,000 2,127,993 99.9 100
46 Thor Nectar Shipping Co., Ltd. Ordinary 2,541,000 2,540,993 99.9 100
Note : The registered office address of companies in items No. 2-46 is 26/32 Orakarn Building, 10th Floor, Soi Chidlom Ploenchit Road, Lumpinee, Pathumwan, Bangkok 10330 Tel. : +66 (0) 2250-0569
Type of Business : International Maritime Transportation
47 Thoresen Chartering (HK) Limited Suite B, 12th Floor, Two Chinachem Plaza 135 Des Voeux Road Central, Hong Kong
Ordinary 500,000 499,999 99.99 HK$ 1
48 Thoresen Shipping Singapore Pte. Ltd. 78 Shenton Way, #04-02 Singapore 079120 Tel. : +65 6578-7000
Ordinary 111,300,000 111,300,000 100.0 S$ 1

185Annual Report 2011
21
No. Name of Company Type of Shares
# of Issued Shares
# of Invested Shares
% of Holding
Par Value
49 Thoresen Shipping Germany GmbH Stavendamm 4a, 28195 Bremen, Germany Tel. : 421 336 52 22
Ordinary 25,000 25,000 100.0 Euro 1
50 PT Perusahaan Pelayaran Equinox Globe Building 4th & 5th floor Jalan Bancit Raya Kav.31-33, Jakarta Indonesia 12740 Tel: +6221 7918 7006
Ordinary 24,510 12,010 49.0 1,000,000 Rupiah
Type of Business : Ship Agency
51 ISS Thoresen Agencies Ltd. 26/26-27 Orakarn Building, 8th Floor Soi Chidlom, Ploenchit Road, Lumpinee Pathumwan, Bangkok 10330 Tel. : +66 (0) 2254-0266
Ordinary 500,000 245,000 49.0 100
52 Gulf Agency Company (Thailand) Ltd. 26/30-31 Orakarn Building, 9th Floor Soi Chidlom, Ploenchit Road, Lumpinee Pathumwan, Bangkok 10330 Tel. : +66 (0) 2650-7400
Ordinary 22,000 11,215 51.0 1,000
53 Thoresen Shipping FZE 1901-19th Floor, Golden Tower Opp. Marbella Resort, Al Buhairah Corniche Road, Sharjah, UAE. Tel. : 971-6-574 2244
Ordinary 1 1 100.0 550,550 Dirhams
54 Thoresen (Indochina) S.A. 12A Floor, Bitexco Building 19-25 Nguyen Hue Boulevard District 1 Ho Chi Min City, Vietnam Tel. : +84 8 821 5423
Ordinary 2,500 1,250 50.0 US$ 100
Type of Business : Ship Brokerage
55 Fearnleys (Thailand) Ltd. 26/55 Orakarn Building, 15th Floor Soi Chidlom, Ploenchit Road, Lumpinee Pathumwan, Bangkok 10330 Tel. : +66 (0) 2253-6160
Ordinary 135,000 66,144 49.0 100

186 Thoresen Thai Agencies Public Company Limited
21
No. Name of Company Type of Shares
# of Issued Shares
# of Invested Shares
% of Holding
Par Value
56 Thoresen Chartering (Pte) Ltd. 78 Shenton Way, #04-02 Singapore 079120 Tel. : +65 6578-7000
Ordinary 100,000 100,000 100.0 S$ 1
Type of Business : Oil and GasTankering Business
57 Petrolift Inc. 6th Floor, Mapfre Insular Corporate Center Madrigal Business Park I, 1220 Acacia Avenue, Ayala Alabang Muntinlupa City, Philippines
Ordinary 1,259,350,452 503,740,176 40.0/1 S$ 1 Philippines
Peso
Energy Group
Type of Business : Offshore Services
58 Mermaid Maritime Public Company Limited 26/28-29 Orakarn Building, 9th Floor Soi Chidlom, Ploenchit Road, Lumpinee Pathumwan, Bangkok 10330 Tel. : +66 (0) 2255-3115-6
Ordinary 784,747,743 277,823,871 170,590,470/1
57.14 1
Type of Business : Coal Mining Business
59 Merton Group (Cyprus) Ltd. Nikou Kranidioti 7D, Tower 4, 3rd Floor Flat/Office 302, Egkomi, PC 2411 Nicosia, Cyprus
Ordinary 17,900 4,352 24.31/1 US$ 1
60 Qing Mei Pte. Ltd. 5 Shenton Way, 21-06 UIC Building Singapore 068808
Ordinary 6,336,096 2,112,032 33.33/1 US$ 1
Infrastructure Group
Type of Business : Ship Supplies, Logistics, Ship Stevedoring and Transportation
61 Chidlom Marine Services & Supplies Ltd. 26/22-23 Orakarn Building, 7th Floor Soi Chidlom, Ploenchit Road, Lumpinee Pathumwan, Bangkok 10330 Tel. : +66 (0) 2250-0569
Ordinary 700,000 699,993 99.9 100

187Annual Report 2011
21
No. Name of Company Type of Shares
# of Issued Shares
# of Invested Shares
% of Holding
Par Value
62 GAC Thoresen Logistics Ltd. 26/30-31 Orakarn Building, 9th Floor Soi Chidlom, Ploenchit Road, Lumpinee Pathumwan, Bangkok 10330 Tel. : +66 (0) 3818-5090-2
Ordinary 750,000 382,496 51.0 100
Type of Business : Port Operations
63 Sharjah Ports Services LLC P.O.Box 510, Port Khalid Sharjah, United Arab Emirates Tel. : 971-6-528 1327
Ordinary 26,000 12,740 49.0/2 100 Dirhams
64 Baria Serece Phu My Borough, Tan Thanh District Baria Vung Tau Province, Vietnam Tel. : +84.64.3876603
Ordinary 2,039,080 407,816 20.0/1 100,000 VND
Type of Business : Coal Logistics Business
65 Unique Mining Services Public Company Limited 36/83 P.S. Tower Building, 24th Floor Soi Sukhumvit 21, Sukhumvit Road Klongtoey, Wattana, Bangkok 10110 Tel. : +66 (0) 2664-1701-8
Ordinary 153,454,064 136,083,041 88.68/3 0.50
Type of Business : Fertilisers Business
66 Baconco Co., Ltd. Phu My I Industrial Park, Tan Thanh Town Baria Vung Tau Province, Vietnam Tel. : 064.893 400
"Paid up capital is VND 377,072,638,790 or USD 25,833,128.40"
100.0/1 -
Holding Group
Type of Business : Holding Company
67 Soleado Holdings Pte. Ltd. 78 Shenton Way, #04-02 Singapore 079120 Tel. : +65 6578-7000
Ordinary 130,000,000 130,000,000 100.0 S$ 1
68 Athene Holdings Ltd. 26/32 Orakarn Building, 10th Floor Soi Chidlom, Ploenchit Road, Lumpinee Pathumwan, Bangkok 10330 Tel. : +66 (0) 2254-8437
Ordinary 1,000,000 999,993 100.0 100
Note: /1 indirectly held by Soleado Holdings Pte. Ltd. /2 indirectly held by Thoresen Shipping FZE /3 indirectly held by Athene Holdings Ltd.

188 Thoresen Thai Agencies Public Company Limited
Glossary of Maritime Terms22
The following are definitions of key terms used in this annual report.
Annual Survey The inspection of a vessel by a classification society that takes place every year.
Bareboat Charter Also known as “demise charter.” Contract or hire of a vessel under which the owner is usually paid a fixed amount of charter hire rate for a certain period of time during which the charterer is responsible for the operating costs and voyage costs of the vessel or drilling rig and crewing.
Bulk Vessels/Carriers Vessels which are specially designed and built to carry large volumes of cargo in bulk cargo form.
Capesize A dry bulk carrier in excess of 100,000 dwt.
Charter The hire of vessel or drilling rig for a specified period of time or in the case of bulk carriers to carry cargo for a fixed fee from a loading port to a discharging port. The contract for a charter is called a charterparty.
Charterer The individual or company hiring a vessel.
Charter Hire Rate A sum of money paid to the vessel or drilling rig owner by a charterer under a charterparty for the use of a vessel or drilling rig.
Classification Society An independent organisation which certifies that a vessel or drilling rig has been built and maintained in accordance with the rules of such organisation and complies with the applicable rules and regulations of the country of such vessel or drilling rig and the international conventions of which that country is a member.
Deadweight Tonne (“dwt”) A unit of a vessel’s capacity for cargo, fuel oil, stores and crew, measured in metric tons of 1,000 kilograms. A vessel’s dwt, or total deadweight, is the total weight the vessel can carry when loaded to a particular load line.
Deepwater For dive support vessels, this refers to water depths beyond 300 metres. For drilling, this comprises “5th Generation Deepwater”, which refers to the latest generation of semisubmersible rigs and drillships possessing the latest technical drilling capabilities and the ability to operate in water depths in excess of 7,000 feet. “Other Deepwater” refers to semisubmersible rigs and drillships that possess the ability to drill in water depths greater than 4,500 feet.
Dive Support Vessel Specially equipped vessel that performs services and acts as an operational base for divers, remotely operated vehicles, and specialised equipment.
DP-2 Two dynamic positioning systems on a vessel allows the vessel to maintain position even with failure of one DP system, which is required for vessels that support both air and saturation diving and remotely operated vehicles, and for those working in close proximity to platforms.
Draft Vertical distance between the waterline and the bottom of the vessel’s keel.

189Annual Report 2011
Dry Bulk Non-liquid cargoes of commodities shipped in an unpackaged state.
Dry-docking The removal of a vessel or drilling rig from the water for inspection and / or repair of submerged parts.
Dynamic Position (“DP”) Computer-directed thruster systems that use satellite-based positioning and other positioning technologies to ensure the proper counteraction to wind, current, and wave forces enabling the vessel to maintain its position without the use of anchors.
Gross Tonne Unit of 100 cubic feet or 2.831 cubic meters used in arriving at the calculation of gross tonnage.
Handymax A dry bulk carrier of approximately 35,000 to 60,000 dwt.
Handysize A dry bulk carrier having a carrying capacity of up to approximately 35,000 dwt.
Hull The shell or body of a vessel.
International Maritime A United Nations agency that issues international trade standards for Organisation (“IMO”) shipping.
Intermediate Survey The inspection of a vessel or drilling rig by a classification society surveyor which takes place between two and three years before and after each Special Survey for such vessel or drilling rig pursuant to the rules of international conventions and classification societies.
ISM Code The International Management Code for the Safe Operation of Ships and for Pollution Prevention, as adopted by the IMO.
Metric Tonne A unit of measurement equal to 1,000 kilograms.
Moonpool An opening through the hull of a vessel through which a diving bell or remotely operated vehicle may be deployed, allowing safe deployment in adverse weather conditions.
Newbuilding A newly constructed vessel.
Orderbook A reference to currently placed orders for the construction of vessels or drilling rigs (e.g., the Handymax orderbook).
Panamax A dry bulk carrier of approximately 60,000 to 80,000 dwt of maximum length, depth and draft capable of passing fully loaded through the Panama Canal.
Protection & Indemnity Insurance obtained through a mutual association formed by vessel owners Insurance to provide liability insurance protection from large financial loss to one
member through contributions towards that loss by all members.
Remotely Operated Vehicles Robotic vehicles used to complement, support, and increase the efficiency (“ROV”) of diving and sub-sea operations and for tasks beyond the capability of
manned diving operations.
22

190 Thoresen Thai Agencies Public Company Limited
Saturation Diving Saturation diving involves divers working from special chambers for extended periods at a pressure equivalent to the pressure at the work site.
Scrapping The disposal of old or damaged vessel tonnage by way of sale as scrap metal.
Short-Term Time Charter A time charter which lasts less than approximately twelve months.
Sister Ships Vessels of the same class and specification which were built by the same shipyard.
SOLAS The International Convention for the Safety of Life at Sea 1974, as amended, adopted by the IMO.
Special Survey The inspection of a vessel or drilling rig by a classification society surveyor which takes place a minimum of every four years and a maximum of every five years.
Spot Market The market for immediate chartering of a vessel usually for single voyages.
Strict Liability Liability that is imposed without regard to fault.
Subsea Construction Vessel These vessels provide an above-water platform with distinguishing characteristics such as DP systems, saturation diving capabilities, deck space, cranes, and moonpools. Deck space and cranes are important features of a vessel’s ability to transport and fabricate hardware, supplies, and equipment necessary to complete sub-sea projects.
Tender Rigs A tender rig is a purpose-built self-erecting drilling tender barge with a flat bottom, raked sterns, and raked bow hull shape. It is designed as a cost-efficient and flexible drilling system for development scenarios involving multiple well slot fixed offshore platforms whereby the rig moves from platform to platform using its own drilling equipment set which is lifted by its own crane. Lifting operations can be made onto platforms up to a height of 90 feet above sea level.
Time Charter Contract for hire of a vessel. A charter under which the vessel owner is paid charter hire rate on a per day basis for a certain period of time, the vessel owner being responsible for providing the crew and paying operating costs while the charterer is responsible for paying the voyage costs. Any delays at port or during the voyages are the responsibility of the charterer, save for certain specific exceptions such as loss of time arising from vessel breakdown and routine maintenance.
Voyage Charter Contract for hire of a vessel under which a vessel owner is paid freight on the basis of moving cargo from a loading port to a discharge port. The vessel owner is responsible for paying both operating costs and voyage costs. The charterer is typically responsible for any delay at the loading or discharging ports.
22

191Annual Report 2011
22
The following are definitions of key terms used in this annual report.
Anthracite Coals with a volatile-carbon ratio equal to 0.12 or less. It has a bright black luster and is coal of the highest rank.
Ash Inorganic residue after incineration of coal.
Bituminous Coal A general term descriptive of coal intermediate in rank between sub bituminous and semi-anthracite and including coking coals. Bituminous coals may be either bright or dull and are usually banded in appearance.
Black Coal A general term for coal of either sub-bituminous, bituminous or anthracite rank.
Brown Coal Coal of the lowest rank, of a soft friable nature and high moisture in the air-dried sample.
BTU (British Thermal Unit) the quantity of heat required to raise the temperature of one pound of distilled water 1°F at its point of maximum density.
Calorific Value Quantity of heat produced when a unit weight of coal burns. Calorific value is measured in British thermal units per pound or calories per gram.
Carbons Content The amount of carbon in coal.
Coal Blending Coal that is mixed in predetermined and controlled quantities to give a uniform feed or product.
Coal Dust Particles of coal that can pass a No. 20 sieve.
Coal Handling and A plant used to upgrade the quality of coal including crushing, sizing and Preparation Plant drying - usually refers to the reduction of ash forming mineral in coal.
Coal Mine An area of land and all structures, facilities, machinery, tools, equipment, shafts, slopes, tunnels, excavations and other property, real or personal, placed upon, under or above the surface of such land by any person, used in, or to be used in, or resulting from the work of extracting in such area bituminous coal, lignite, or anthracite from its natural deposits in the earth by any means or method and the work of preparing the coal so extracted and includes custom coal preparation facilities.
Coal Reserve The economically mineable part of the coal resource, as defined in the JORC Code. It includes diluting materials and allowances for losses.
Coal Resource Coal in the ground with reasonable prospects for eventual economic extraction, as defined in the JORC Code.
Coking Coal Coal which is suitable for coke making and used in the production of metallurgical coke.
CV Calorific Value basis (GAD, NAR, or GAR).
Energy Coal Coal used to provide heat for steam rising as part of the electricity generation process.
Glossary of Coal Terms

192 Thoresen Thai Agencies Public Company Limited
GAD Gross air dried.
GAR Gross as received.
Hard Coking Coal Coals which make hard coke when carbonised in the coke oven.
HGI Hardgrove Grind ability Index - ease of pulverisation (e.g. 30 is very hard, 70 is soft).
JORC Code 2004 Australasian Code for Reporting Identified Mineral Resources and ore Reserves. Australian mining exploration and production companies are bound to produce Resource and Reserves Statements using the JORC Code in accordance with the listing Rules of the Australian Stock Exchange.
Lignite A brownish-black coal composed of vegetable matter which has been altered more than in peat, but less than in sub-bituminous coal.
Metallurgical Coal Coals which are consumed in the production of pig iron, either via the coke oven process, direct injection (PCI) or by direct reduction.
NAR Net as received.
Peat A dark brown or black deposit resulting from the partial decomposition of vegetal matter in marshes and swamps. It is the first step in the formation of coal.
Proximate Analysis The analysis of coal or coke in terms of moisture, ash, volatile matter and (by difference) fixed carbon.
Recoverable Reserve Similar to coal reserve, a term used to describe the amount of coal that can physically be mined from a reserve at an acceptable cost, as defined in the JORC Code.
Specific Energy The energy in kilocalories released per kg of coal burned. (Calorific Value)
Steaming Coal Coal used to provide heat for steam raising as part of the electricity generation process.
Sulphur Forms sulphur dioxide during coal combustion.
Thermal Coal Coals which are normally used for the generation of heat for steam raising and other general industry applications. These coals generally do not exhibit any coking properties and therefore would not make coke in a conventional coke oven. However, thermal coals can be used as PCI Coals provided they have levels of ash, moisture, volatile matter and sulphur which make them suitable for the production of blast furnace pig iron.
Ultimate Analysis The analysis of a coal expressed in terms of carbon, hydrogen, nitrogen, sulphur and oxygen. High nitrogen and sulphur contents can create high levels of NOx and SOx which are serious pollutants.
VM (Volatile Matter) the percentage of coal which is lost as volatile matter (gases) when coal is incinerated under standard conditions.
22

193Annual Report 2011
The following are definitions of key terms used in this annual report.
Urea the most common nitrogen fertiliser in the world. Formula CO(NH2)2, can be prilled or granular, and obtained by chemical process (natural gas into ammonia, and then urea).
DAP very common phosphate fertiliser, the diammonium phosphate (NH4)2H2PO4 is obtained from the chemical transformation of natural rock phosphate (mining origin).
Potash used to mention potassium chloride (KCL), salt of potassium obtained by mining and chemical transformation to refine and remove the sodium salts.
NPK Stands for “Nitrogen Phosphorus Potassium”, used to mention the compound fertilisers associating the three main fertilising nutrients, to be differentiated from the single fertilisers.
USP “Urea Super phosphate”: a patented chemical process using urea, sulfuric acid and rock phosphate, to manufacture a compound fertiliser NPK 20-10-0 + 15 CaO + 7S.
Blending or “bulk blending” is a physical process mixing single fertilisers together to obtain NPK fertilisers.
Granulation process using steam, water and heat to manufacture NPK fertilisers, thereafter called granulated fertilisers.
Compaction process using heat and pressure to manufacture NPK fertilisers, thereafter called compacted fertilisers.
Glossary of Fertiliser Terms22

194 Thoresen Thai Agencies Public Company Limited
The Company23
AS OF 30 SEPTEMBER 2011
Name of Company Thoresen Thai Agencies Public Company Limited
Registration No. 0107537002737
Date of Establishment 16 August 1983
Date of Conversion to Public Company Limited 15 December 1994
Date of Listing Ordinary Shares in SET 25 September 1995
Address 26/26-27 Orakarn Building, 8th Floor
Soi Chidlom, Ploenchit Road
Bangkok 10330,Thailand
Telephone : +66 (0) 2254-8437
Website: http://www.thoresen.com
Type of Business Holding company with 3 lines of Business:
Transport, Energy, and Infrastructure
Ordinary Shares:
Registered Capital Baht 833,004,413
Paid up Capital Baht 708,004,413
No. of Issued Shares 708,004,413 ordinary shares
Par Value/Share Baht 1
Convertible Bonds:
Issued Convertible Bonds US$ 169,800,000
Outstanding Principal Amount of Convertible Bonds US$ 34,300,000
Type of Convertible Bonds Five-year amortising bonds
Secondary Market of Convertible Bonds The Singapore Exchange Securities
Trading Limited (SGX)
Date of Listing Convertible Bonds in SGX 25 September 2007

195Annual Report 2011
23
Domestic Debentures:
Issued Domestic Debentures Tranche 1: Baht 2,000,000,000, with 5-year term
Tranche 2: Baht 2,000,000,000, with 7-year term
Date of Listing Domestic Debentures 9 July 2010
in Thai Bond Market Association
Securities Registrar of Ordinary Shares Thailand Securities Depository Co., Ltd.
Capital Market Academy Building
2/7 Moo 4, North Park Project Vibhavadi-Rangsit
Road, Bangkok 10210, Thailand
Telephone : +66 (0) 2596-9000
Auditor Mr. Kajornkiet Aroonpirodkul
Certified Public Accountant (Thailand) No. 3445
PricewaterhouseCoopers ABAS Limited
15th Floor, Bangkok City Tower
179/74-80 South Sathorn Road
Bangkok 10120, Thailand
Telephone : +66 (0) 2344-1000
Legal Advisor Baker & McKenzie Ltd.
5th Floor, 22nd - 25th Floor, Abdulrahim Place
990 Rama IV Road
Bangkok 10500, Thailand
Tel: +66 (0) 2636-2000
Tinaphong Contract & Trial Office Co., Ltd.
160/564-565, 24th Floor, ITF-Silom Palace
Silom Road., Suriyawong Sub-district
Bangruk District, Bangkok 10500, Thailand
Telephone: +66 (0) 2235-8516
Pramuanchai Law Office Co., Ltd.
2038-2042 Rama 6 Road
Bangkok 10330, Thailand
Telephone: +66 (0) 2219-2031-2
Watson, Farley & Williams (Thailand) Limited.
Unit 902, 9th Floor, GPF Witthayu Tower B
93/1 Wireless Road, Bangkok 10330, Thailand
Telephone: +66 (0) 2655-7800/78
Watson, Farley & Williams Asia Practice LLP
6 Battery Road #28-00 Singapore 049909
Telephone : +65 6532 5335
