ttowards new and owards new and … urja/vol 6... · in english and hindi). chief patron ... arun...
TRANSCRIPT

Ministry of New and Renewable EnergyGovernment of India
www.mnre.gov.in
Volume 6 � Issue 3 � December 2012
TOWARDS NEW AND TOWARDS NEW AND RENEWABLE RENEWABLE
ENERGYENERGY

HAPPY NEW YEAR
2013

Dear Readers,Energy plays a vital role in achieving productivity, prosperity and comfort level of a nation. Per capita energy consumption is an indicator of the standard of living of the people, energy access of the people and growth of a country. International Energy Agency has recently estimated that there are about 2.7 billon people covering about 40 per cent of world population who do not have access to modern energy and electricity. They rely mostly on traditional biomass for cooking, heating and on kerosene for lighting. Renewable energy is playing an important role in providing quality energy access to these people which can help in mitigating the gap to energy access.
Energy storage is another challenge which so far, depends on battery only. However costs, cycle life, limitation to large capacity and to some extent safety are few major issues which need to be addressed by the research community. Batteries have a major role to provide continuous supply of electricity from various renewable energy based applications to the people. The radical changes in the current technology that are cost eff ective and aff ordable to the people are urgently required. With the advent of electric based vehicles, the importance and requirement of effi cient batteries increases manifolds.
Light Emitting Diode (LED) is emerging as an alternative to the traditional bulbs and even the recently developed CFLs. LEDs with solar PV based electricity is an excellent energy effi cient combination for lighting in residential, streets, commercial establishments etc. However, there is need for standardization of LEDs and mass production in India that will reduce their cost and make them aff ordable to the common man.
In this context the present issue of Akshay Urja provides information on LEDs and batteries as well. The articles on solar lamps for tribal homes, solar PV laboratory kit for training solar engineers, hydrogen fuel for energy security and bio diesel production: boon for rural areas are informative and useful. I hope that you will fi nd it interesting and with the updated information. I also seek your valuable suggestions for the constant improvement in Akshay Urja.
I wish you all a very happy and prosperous new year.
Volume 6 ■ Issue 3December 2012A bi-monthly newsletter of the Ministry of New and Renewable Energy, Government of India (Published in English and Hindi).
Chief PatronDr Farooq AbdullahMinister for New and Renewable Energy, New Delhi
PatronShri Gireesh B PradhanSecretary, MNRE, New Delhi
EditorDr Arun K Tripathi, MNRE, New Delhi
Editorial BoardN P Singh, ChairmanPraveen SaxenaP DhamijaD K KhareM R NouniB S NegiR K Vimal
Production teamSulagna Chattopadhyay, Ankita Sah, Madhusmita Giri, D K Das, A Panwar, Nilesh Kumar, Binod Kumar Rawat, IPP Ltd., New Delhi;Dr. N Chatterjee, Hon Consultant; N Ghatak,MNRE, New Delhi.
Editorial offi ceDr Arun K Tripathi, Editor, Akshay UrjaMNRE, Block No. 14, CGO Complex, Lodhi Road,New Delhi - 110 003Tel. +91 11 2436 3035, 2436 0707 Fax +91 11 2436 3035 E-mail: [email protected]: www.mnre.gov.in
Produced byIris Publication Pvt. Ltd.111/9 KG, Aruna Asaf Ali Marg, Vasant Kunj, New Delhi -110 070, Telefax. +91 11 2612 2789, 2689 2275.E-mail: [email protected]
Publisher and PrinterMinistry of New and Renewable Energy, New Delhi.
Cover PhotoThe 25 kWp solar PV power plant at Kulikawn Civil Hospital, Aizawl, Mizoram.
Disclaimer: The views expressed by
authors including those of the editor
in this newsletter are not necessarily
the views of the MNRE.
Published, printed and edited for and on behalf of the Ministry of New and Renewable Energy, Government of India, from B-14, CGO Complex, Lodhi Road, New Delhi, by Dr Arun Kumar Tripathi. Printed at Aravali Printers & Publishers (P) Ltd. W-30, Okhla Industrial Area, Phase II, New Delhi - 110 020, India.
From the Editor’s Desk
ARUN K TRIPATHI<[email protected]>

December 2012Volume 6 Issue 32
Letters to the Editor
I am a Rural Development Student of a backward district of Odisha. I would like to thank you for bringing out this useful and educative Newsletter Akshay Urja in our District Information Offi ce (DIPR), Library, Nabarangpur. The Newsletter contains useful material and information on renewable energy technology which is very benefi cial for us.
Mahendra Kumar NayakNabarangpur, Odisha
Central University of Punjab at Bathinda is an upcoming University. After completing my tenure at SSS-NIRE, I recently joined this University. One of the Schools for higher education in the University is the School of Environment and Earth Sciences. The School has a Centre for Alternate Energy Technologies. I have been using the Akshay Urja Newsletter for the last several years and must say that it is the best source for updating the scientifi c community with the latest advances in the area of alternate energy technologies.
Dr. A. K. Jain,Former Director of SSS-NIRE,
Bathinda, Punjab.
I came across your esteemed Newsletter on the website of MNRE and found it to be very useful, as the content of the Newsletter contains all the latest developments in the fi eld of renewable energy. It is great
and indeed convenient since it is also available online.
Dr. R. N. HegdeSanjay Nagar, Bengaluru
We are writing to you from WAPCOS Limited (A Government of India Undertaking – Ministry of Water Resources) International Consultants in Water Resources, Power and Infrastructure Development. Our mission is to achieve sustained profi table growth, excellence in performance, use of state-of-the-art technical expertise, innovativeness, capacity building and meeting society’s needs. Akshay Urja, the bi- monthly Newsletter is very informative and helps greatly to create awareness regarding renewable energy and serves as a useful guide. The Newsletter will prove to be of immense help to us.
V. U. KoundanyaG. M. (IWRM),
Gurgaon, Haryana
I found Akshay Urja at my friend's place. It is very useful and informative to disseminate information among the people. The depleting conventional energy sources and global warming has made the people to reach out for alternative sources of energy. We can see that among RE, the hydro, solar PV, biomass, biogas, wind energy etc. have been very popular, according to the information given in articles published in the Newsletter. Kindly, publish some RE products prices and
Dear Reader, Thank you very much for your suggestions and encouragement. The editorial team of Akshay Urja will make
every eff ort to make this newsletter highly informative and useful to all our readers. We welcome your suggestions and valuable
comments to make further improvements in terms of content and presentation. Editor: Akshay Urja
its availability which is useful for domestic purposes such as price of a solar panel, LED bulbs, solar lanterns, mobile chargers. I belong to a rural area and this information would be very useful for me.
Arun Kumar SharmaKatru Bigha, Nalanda, Bihar
×ñ¢ âæ×æçÁ·¤ çß™ææ٠⢷¤æØ, ·¤æàæè çãU‹Îê çßàßçßlæÜØ ·¤æ Àæ˜æ ãUê¡Ð Ò¥ÿæØ ª¤ÁæüÓ çÙØç×Ì M¤Â âð ÂÉU¸Ìæ ãUê¡Ð çÎâ�ÕÚU w®vv ·ð¤ ¥¢·¤ ÒÁñß ª¤ÁæüÓ ×ð¢ Îè »§ü ÁæÙ·¤æçÚUØô¢ ·¤æ ×ñ¢Ùð ¥ÂÙð »æ¢ß ¥õÚU ¥æâ-Âæâ ·ð¤ â�æè çÁÜô¢ ×𢠷¤æȤè âÎéÂØô» ç·¤ØæÐ ×éÛæð ØãU ÕÌæÌð ãUé° ¥ÂæÚU ãUcæü ãUô ÚUãUæ ãUñ ç·¤ ßãUæ¢ ·ð¤ »ýæ×è‡æ Üô»ô¢ Ùð §âð ·¤æÈ¤è »¢�æèÚUÌæ âð çÜØæ ãUñ, ÌÍæ Áñß ª¤Áæü âð â¢Õ¢çÏÌ ÁæÙ·¤æçÚUØô¢ ·ð¤ âæÍ §â·ð¤ ©UˆÂæÎÙ ·¤æð �æè ÕÉU¸æßæ ç×Üæ ãUñÐ
çßßð·¤ ·é¤×æÚU çâ¢ãU,Õè.°¿.Øê. ßæÚUæ‡æâè,©UžæÚU ÂýÎðàæ
×ñ¢ Üô·¤ Áæ»ëçÌ ·ð¤‹¼ý ·¤æ ÂéSÌ·¤æÜØ âãUæØ·¤ ãUê¡Ð ØãUæ¢ ·ð¤ â�æè ÂæÆU·¤»‡æ Ò¥ÿæØ ª¤ÁæüÓ ÂÉU¸Ìð ãUñ¢ ¥õÚU §ââð Üæ�æ ©UÆUæ ÚUãUð ãUñ¢Ð §â Âç˜æ·¤æ ×ð¢ Îè ãUé§ü â�æè ÁæÙ·¤æçÚUØæ¢ Üæ�æÂýÎ ãUôÌè ãUñ¢Ð ¥õÚU ¥æàææ ·¤ÚUÌæ ãUê¢ ç·¤ �æçßcØ ×𢠥õÚU �æè ÁæÙ·¤æçÚUØæ¢ ç×ÜÌè ÚUãUð¢»èÐ
ÂéSÌ·¤æÜØ âãUæØ·¤Üô·¤ Áæ»ëçÌ ·ð¤‹¼ý, Îð߃æÚU, ÛææÚU�æ¢Ç
Ò¥ÿæØ ª¤ÁæüÓ Âç˜æ·¤æ çÙØç×Ì M¤Â âð Âýæ# ãUæðÌð ÚUãUÙð ·ð¤ çÜ° ¥ÚUçߢΠ×çãUÜæ çß·¤æâ €ÜÕ âç×çÌ ¥æ·¤è ¥æÖæÚUè ãñUÐ §â Âç˜æ·¤æ âð âæñÚU ª¤Áæü ·ð¤ ·¤æØü·ý¤×æð́ ·ð¤ ÕæÚðU ×ð́ ¥‘ÀUè ÁæÙ·¤æÚUè ãUæð ÁæÌè ãñUÐ ¥æ·ð¤ âÈ Ü ÂýØæâ âð Îðàæ ×ð́ çßléÌ ·ð¤ ·¤×è ·¤è Âêçˆæü ãUæð ÚUãUè ãñUÐ â¢SÍæ âæðÜÚU çâSÅU× ·¤æ ·¤æØü ·¤ÚÙæ ¿æãUÌè ãñU ÌÍæ »æ¡ß ·¤æð Âê‡æü âæðÜÚU ÂÚU ¥æÏæçÚUÌ ·¤ÚUÙæ ¿æãUÌè ãñUÐ ¥æ·¤æ ×æ»üÎàæÙü â¢SÍæ ·¤æð Âýæ# ãUæð»æ, Âê‡æü ¥æàææ ãñUÐ
Ÿæè×Ìè ¥¢ÁçÙ ÚUSÌæð»è¥ÚUçߢΠ×çãUÜæ çß·¤æâ €ÜÕ âç×çÌ,
×¢ãU§ü ¿æñ·¤, ÕéÎæñÙ,©UžæÚU ÂýÎðàæ

3December 2012Volume 6 Issue 3
Cover Story10 Solar Street Lighting
RE Feature14 Battery Energy Storage
17 Solar Lamps for Homes
in Maharashtra
20 PV Laboratory Kit for Training
Solar Engineers
24 Electric Vehicles: The Way
Forward
27 Algal Biomass - A Renewable
Substrate for Bio-ethanol
Production
31 Hydrogen : Fuel for Energy
Security
Light emitting diodes are emerging as alternatives to the grid powered conventional street lighting systems in rural areas.
NCPRE at Indian Institute of Technology Bombay, developed a novel and low cost ‘Solar PV Laboratory Kit’ to conduct a teaching course on solar PV.
National 4-7■ A shining solar power farm
■ National conference at NIRE
■ Shops for solar devices in Haryana
■ Punjab to set up solar power
clusters for tubewells
■ Solar power back-up to help
policing
■ India, Malaysia ink MoU on RE
■ DVC plans 1,000 MW solar power
plant over water canal network
■ RE investments rise globally, India
posts 62 per cent growth
■ ‘Bijli Box’ lights homes in rural Uttar
Pradesh with solar power
■ 6th Renewable Energy India 2012
Expo
■ Govt’s compensation for feeding
solar power to gird
International 8-9■ High-Efficiency quantum dot solar
cells developed
■ LA goes solar
■ Scotland on track to meet 2020
renewable electricity target
■ Automakers gear up for battery-
based vehicles
■ Tanzania plans first geothermal
power plant
35 Mega Solar Rooftop Programme in
Tamil Nadu
37 Solar PV – Can prices go down
further?
40 Biodiesel : Boon for Rural Areas
Event44 ASEAN-India Ministerial Meeting
on Renewable Energy
46 Trade Fair 2012
48 A National Meet on Solar Cities
49 Tech Update50 Web/Book Alert51 Forthcoming Events52 RE Statistics
RE NEWSDecember 2012contents
Workers hand picking Jatropha seeds in Chhattisgarh
Hydrogen, a clean and economicfuel, is a renewable energy source, which is the pressing need of the present time.

4
National
December 2012Volume 6 Issue 3
A SHINING SOLAR POWER FARMMoser Baer’s Rs. 100 crore project at Sivaganga, Tamil Nadu has a technology suited specifi cally for the Indian climate. Located in the hinterland, it is a project that proved to be a trump card for those advocating solar power as a solution to the power crisis in the State. Spread across 65 acres in Rettai Pillai Ayyanarkoil, a tiny hamlet near Muthupatti in Sivaganga district, the 5 MW solar grid interactive solar PV plant has exceeded the targets set in the planning stages, according to government and company offi cials. The plant has come up with funding from IDBI and the International Finance Corporation, a part of the Washington-based World Bank Group. The Sivaganga project, identifi ed by the Tamil Nadu Energy Development Agency (TEDA) and implemented under the Generation Based Incentive (GBI) scheme of the Union Ministry of New and Renewable Energy, was commissioned on December 20, 2010. A power purchase agreement was signed with the erstwhile Tamil Nadu Electricity Board (TNEB) for Rs. 4.50 per unit. Being operated by Moser Baer Clean Energy, the project has a plant load factor of above 20 per cent against the Central Electricity Regulatory Commission’s stipulation of 19 per cent. The average daily production of the plant has been around 24,500 units. Excluding four per cent of the
production for internal consumption and loss, the remainder is fed into the grid. In March 2011, the highest monthly generation was achieved with 31,500 units.
www.thehindu.com29 October 2012
NATIONAL CONFERENCE AT NATIONAL INSTITUTE OF RENEWABLE ENERGYA two day National Conference on ‘Recent Advances in Bio-energy Research’ was organised at Sardar Swaran Singh National Institute of Renewable Energy, (SSS-NIRE), Kapurthala, during 7-8 December, 2012. The Conference covered all aspects of bio-energy including biomass and energy management, thermochemical, biochemical, chemical and electrochemical conversion of biomass to biofuels. Original research articles are invited in all areas of bio-energy from research scholars, academicians, scientists and industry people. The Conference was held with a vision to establish the Institute as an apex R&D institution for carrying out state-of-the-art research and developmental activities in the area of bio-energy, including human resource development at all levels, post-doctoral research and research leading to commercialisation of renewable energy technologies. The chief patron at the Conference was Shri G. B. Pradhan, Secretary, Ministry of New and Renewable Energy. Dr. N. P. Singh, Advisor/Head (NIRE), MNRE was the patron and Prof. A.K. Jain, Director, NIRE was the Chairman of the Conference. A target of adding about 30,000 MW from various renewable energy sources has been fi xed for the 12th Plan period (2012-17). Dr. N. P. Singh, said that since the inception of NIRE there has been remarkable work done in a very short time, which includes big projects working on generating power through non-
conventional energy sources in Punjab, which will not only help in safeguarding the environment but also help farmers earn from agricultural waste. He also said that biomass is an effi cient source of generating electricity and that today solar, wind, biomass and small hydro together contribute a total of 27,000 MW to electricity generation and that a target of adding about 30,000 MW from various renewable energy sources has been fi xed for the 12th Plan period.
www.conference88.com8 December 2012
SHOPS FOR SOLAR DEVICES IN HARYANAState owned Haryana Renewable Energy Development Agency (HAREDA) has decided to open
Renewable energy News
‘Akshay Urja’ shops in nine districts of the State for sale and repair of the solar and energy effi cient devices. The shops would be opened in Fatehabad, Rohtak, Sonipat, Bhiwani, Ambala, Yamunanagar, Palwal, Mewat and Jhajjar districts, a HAREDA spokesman said. www.timesofi ndia.indiatimes.com,
26 October 2012
PUNJAB TO SET UP SOLAR POWER CLUSTERS FOR TUBEWELLSThe Punjab government has decided to explore the possibility of developing solar power clusters to energise agricultural pumps in

5
National
December 2012Volume 6 Issue 3
rural areas, which can help the State to bring down the power subsidy cost. The State identifi es that there is a large scope for developing solar power clusters in rural areas to provide power to agricultural pumps directly thereby cutting the subsidy and further investing the saved money to produce clean energy. The State is also planning to get a study including technical as well as fi nancial viability of the proposed solar power clusters done. Under the proposed initiative, a cluster of tubewells will be identifi ed and after identifying the power requirement of these tubewells, solar power panel with a one time investment can be installed to supply power to agricultural pumps.
www.timesofi ndia.indiatimes.com24 October 2012
SOLAR POWER BACK-UP TO HELP POLICINGThe computers at police stations across the state of Uttar Pradesh will not shut down in case of a power failure in the near future as the State police headquarters has initiated the process of providing solar power back-up to the police stations. With computerisation of police stations across the State expected to be completed by December 2014, the state police headquarters has been off ering solar power backup to electric gadgets including computers, printers and scanners to police stations. In fact, the solar power backup project
has been completed in 12 districts under the fi rst phase. These districts include three Naxal aff ected districts of Sonbhadra, Chandauli and Mirzapur. The other districts are Khiri, Pilibhit, Bahraich, Balrampur, Maharajganj, Siddarthnagar and Shravasti and two on UP-Bihar border - Ghazipur and Ballia. The solar power back-up will enhance the working of police stations in rural areas and aid in the smooth running of the Crime and Criminal Tracking Network and Systems (CCTNS).
www.i4u.com26 October 2012
INDIA, MALAYSIA INKMoU ON REIndia and Malaysia agreed to cooperate in renewable energy, especially in biomass, hydropower, solar and wind power. A Memorandum of Understanding (MoU) was signed on 7 November 2013 by India’s Minister of New and Renewable Energy Farooq Abdullah and Peter Chin Fah Kui, Malaysian Minister of Energy, Green Technology and Water. Both countries also agreed to form a joint working group for joint research, exchange and training of scientifi c and technical personnel, exchange of available scientifi c and technologies information and transfer of know-
promoting energy for remote and unelectrifi ed areas.
www.english.globalgujaratnews.com
9 November 2012
DVC PLANS 1,000 MW SOLAR POWER PLANT OVER WATER CANAL NETWORKTaking cue from Gujarat, Damodar Valley Corporation (DVC) proposes to set up solar power plant atop 2,494 kilometres long network of canals that has the potential to generate up to 1,000 MW green solar power. Gujarat has shown the way with the commissioning of the world’s fi rst one MW canal top solar power plant in Mehsana district over 750 metres stretch of canal in February this year. Setting
up solar power plant atop water canal eliminates the need for land acquisition and water evaporation from the canal that is quite high in India with sunshine for nearly 300 days in a year, is also minimised. DVC told a parliamentary panel last week that to begin with 15 MW capacity canal top solar photovoltaic plant at DVC canal, Burdwan in West Bengal, was planned. “Detailed project report has already been prepared by a global consultant PricewaterhouseCoopers,” a power ministry offi cial said. In parallel,
how, technology and equipment on a non-commercial basis. The Indian Minister also briefed his Malaysian counterpart on India’s progress in renewable energy and its eff orts in

6
National
December 2012Volume 6 Issue 3
registration of the project at United Nations Framework Convention on Climate Change for getting clean development mechanism (CDM) benefi t has been initiated.
www.mydigitalfc.com25 November 2012
RE INVESTMENTS RISE GLOBALLY, INDIA POSTS 62 PER CENT GROWTH New investments in renewable energy and fuels reached 257 billion USD worldwide last year, with India logging the sharpest surge and China attracting the largest amount at 52.2 billion USD says a report. In 2010, the total global investment in renewable power and fuel was 220 billion USD, according to the latest report of Worldwatch Institute. “Investment in India grew 62 per cent, the highest growth rate for any single country over 2010,” the report said. The total renewable energy investments in industrial countries in 2011 accounted for 65 per cent of global investment, increasing 21 per cent to 168 billion USD. In contrast, 35 per cent of global new investment that went to developing countries increased 10 per cent to 89 billion USD, the report said. Of this sum, China, India and Brazil accounted for 71 billion USD in total investment. In 2011, ‘fi nancial new investment’ in renewable energy installations (a category that excludes small-scale projects and R&D) in industrial countries outpaced investments in the developing world, but in 2010 investments in this category in developing countries had surpassed those in industrial countries for the fi rst time, it said. Worldwatch said a major development in 2011 was the dominance of solar power in technology-specifi c investments -- driven by a 50 per cent reduction in price over the year -- with 147.4 billion USD invested in solar, compared with 83.8 billion USD for
wind projects and 10.6 billion USD for biomass and waste-to-energy technology. “Although this was not the fi rst time solar surpassed wind in total investment, it was the fi rst time that this involved such a wide margin,” it said. Biofuels, which as recently as 2006 held the second overall ranking in renewable energy technologies, attracted the fourth highest total investment in 2011 at 6.8 billion USD, followed by 5.8 billion USD for small hydro and 2.9 billion USD for geothermal installations.
www.business-standard.com11 October 2012
‘BIJLI BOX’ LIGHTS HOMES IN RURAL UTTAR PRADESH WITH SOLAR POWERA renewal energy company, OMC Power, is lighting up rural parts of Uttar Pradesh by delivering solar-charged batteries to homes in an out-of-the-box move that promises cheap and uninterrupted power supply. A startup company fl oated a year ago by three former employees of Ericsson, is supplying electricity to about 3,000 households in remote areas of Hardoi district where conventional power lines are yet to reach. The company’s promoters hope to energise another 24,000 homes by the end of the year. The power distribution model involves generation of electricity at an 18-kW solar plant at Jangaon, in Hardoi, from where it reaches villagers’ homes in rechargeable batteries contained in boxes, popularly called ‘Bijli Box’ (power in a box). One charge is enough for 12 hours. Every evening, employees collect the boxes from the generating unit and deliver them to their subscribers in nearby villages on diesel vehicles. The Bijli Box - weighing about 2 kg and holding an electronic circuit and accompanying software besides the battery - can power a couple of
bulbs, a fan and a specially-made television set. The company has also employed youth from the villages to replace the spent boxes with charged ones at daybreak.
www.articles.economictimes. indiatimes.com
1 November 2012
6TH RENEWABLE ENERGY INDIA 2012 EXPOOrganised by UBM India, the 6th Renewable Energy India 2012 Expo was the epicentre for deliberations on the potential of renewables in India. Held during 7-9 November 2012 at the international standard venue facility of the India Expo Center, Greater Noida (National Capital Region of Delhi), the event culminated with a call to the industry to step up innovations and leverage the multiple investment opportunities being created by the Government. The expo played an important catalyst role in creating a common business forum for global and local stakeholders. Evolving the format of the expo with the changing dynamics of the industry, a diverse approach was adopted to promote fi nancing required by the RE sector in India. A three day concurrent conference having 36 interactive sessions and 172 high profi le speakers was the hub for knowledge exchange that widened the market insights of the attending delegates. The vibrant expo forum attracted key stakeholders and leading industry stalwarts to network and tap new markets. 475 domestic and international exhibitors from 25 countries and 10,169 trade

7
National
December 2012Volume 6 Issue 3
professionals comprising of 6,056 qualifi ed buyers participated atthe expo.
www.renewableenergyindiaexpo.com 9 November 2012
GOVT’S COMPENSATION FOR FEEDING SOLAR POWER TO GRID
The government is considering changes in laws that would allow customers to be paid for the solar power they generate and feed into the grid. This will persuade individual consumers, rather than power distribution companies, to supply at least 1,000 MW of electricity to India’s grid by installing solar panels on rooftops of residential and commercial buildings by 2017, the government hopes. If successful, this would generate more than one-tenth of the renewable energy capacity of 9,000 MW of solar power that the government plans to add under the marquee Jawaharlal Nehru National Solar Mission (JNNSM), and more than a hundred-fold increase from the current levels of power generated by rooftop solar power systems. Previous attempts by the authorities, including those in Delhi and Mumbai, to subsidise solar water-heater systems have been unsuccessful, mainly because the costs of buying and installing these were prohibitively high, in spite of a 30 per cent subsidy on solar equipment. “Once this can be put into place, we should be able to kickstart demand for solar power in a big way,” Shri Gireesh Pradhan, Secretary, Ministry of New and Renewable Energy (MNRE) said. “Given the rise in power tariff s, a feed in tariff will make people re-evaluate the costs and benefi ts of solar power.” Pradhan added that his Ministry was in talks with Germany, which has nearly half its 27,000 MW of solar energy capacity generated by rooftop-based systems, to help
implement the scheme. To be sure, several states, such as Gujarat, West Bengal, Karnataka and Tamil Nadu, have announced rooftop solar-power generation schemes but these come with several restrictions, such as being open only to government buildings and academic institutions, as well as requirements that the installed project to be of a minimum size. “We’re planning on a further centralised subsidy,” said Tarun Kapoor, Joint Secretary, MNRE. “When you couple that with initiatives by various states, we’re expecting a major change in solar usage patterns in the country. I wouldn’t then be surprised with 2,000 MW of rooftop solar powerby 2017.”
Apart from JNNSM, India’s solar power industry has been boosted by the decline in prices of solar PV panels, down 25 per cent from what they were in 2008. This is largely due to a manufacturing glut in China, which now surpasses Europe and the US in producing solar cells and is also a primary source of raw material for Indian solar-panel manufacturers. Rajasthan has a dominant 70 per cent of India’s installed solar power capacity of 1,000 MW, thanks to sunshine, desert topography and incentives to power developers under JNNSM.
Experts said a feed-in tariff system could be misused and regulators need to be watchful. They would need to look out for abuses such as “feeding back utility supply generation from subsidised fuels, etc. However, reducing solar prices and increasing diesel prices may make such a situation very improbable,” said a report by Prayas Energy group, a Pune-based energy consultancy. “It is desirable to move away from the feed-in tariff route and prioritise self consumption (where homes produce their energy instead of banking on incentives from power distribution companies).”
A feed-in tariff policy wouldn’t necessarily be a strong incentive to encourage rooftop solar policy initiatives, said the CEO, Council on Energy Environment and Water.
He said. “For example, the incentives that might make more sense in Bangalore are diff erent from Delhi which has diff erent energy consumption patterns. Unless this is addressed, no one scheme can be a panacea. I haven’t specifi cally analysed the feed-in tariff for solar but the big problem to encouraging access to renewable energy is the lack of innovative fi nancing schemes.”
www.eai.in14 December 2012
8
International
December 2012Volume 6 Issue 3
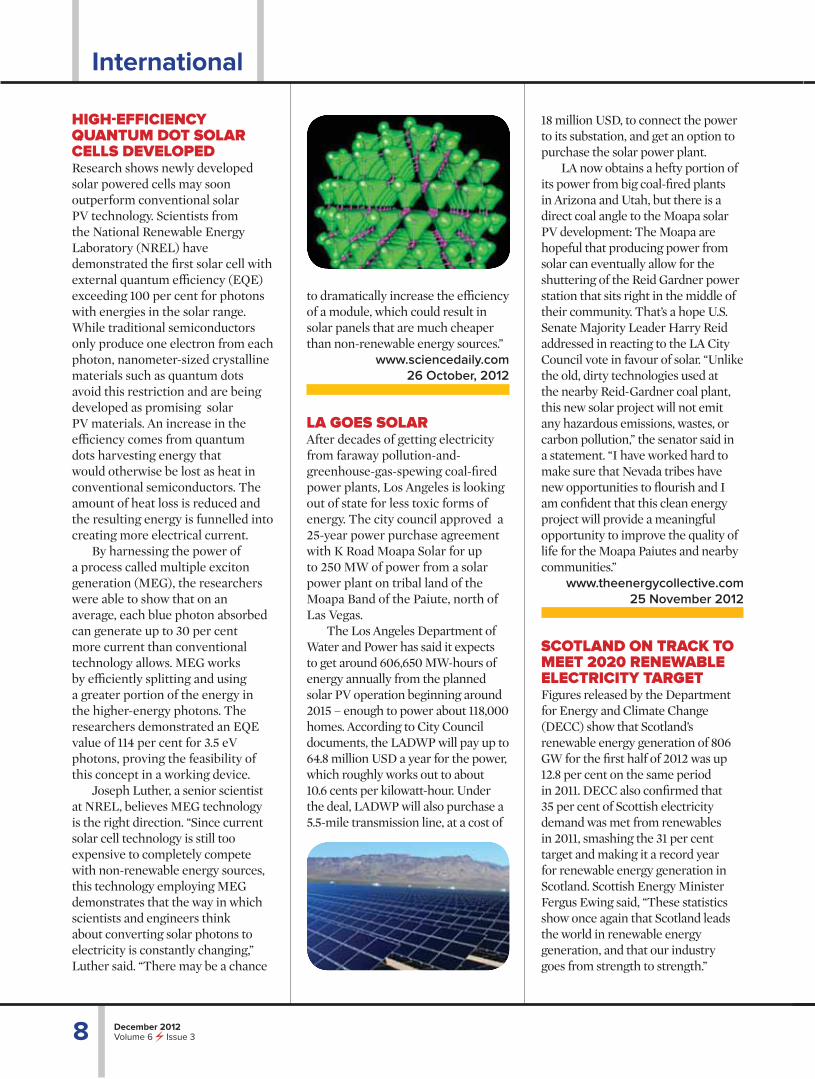
HIGH-EFFICIENCY QUANTUM DOT SOLAR CELLS DEVELOPEDResearch shows newly developed solar powered cells may soon outperform conventional solar PV technology. Scientists from the National Renewable Energy Laboratory (NREL) have demonstrated the fi rst solar cell with external quantum effi ciency (EQE) exceeding 100 per cent for photons with energies in the solar range. While traditional semiconductors only produce one electron from each photon, nanometer-sized crystalline materials such as quantum dots avoid this restriction and are being developed as promising solar PV materials. An increase in the effi ciency comes from quantum dots harvesting energy that would otherwise be lost as heat in conventional semiconductors. The amount of heat loss is reduced and the resulting energy is funnelled into creating more electrical current.
By harnessing the power of a process called multiple exciton generation (MEG), the researchers were able to show that on an average, each blue photon absorbed can generate up to 30 per cent more current than conventional technology allows. MEG works by effi ciently splitting and using a greater portion of the energy in the higher-energy photons. The researchers demonstrated an EQE value of 114 per cent for 3.5 eV photons, proving the feasibility of this concept in a working device.
Joseph Luther, a senior scientist at NREL, believes MEG technology is the right direction. “Since current solar cell technology is still too expensive to completely compete with non-renewable energy sources, this technology employing MEG demonstrates that the way in which scientists and engineers think about converting solar photons to electricity is constantly changing,” Luther said. “There may be a chance
to dramatically increase the effi ciency of a module, which could result in solar panels that are much cheaper than non-renewable energy sources.”
www.sciencedaily.com26 October, 2012
LA GOES SOLARAfter decades of getting electricity from faraway pollution-and-greenhouse-gas-spewing coal-fi red power plants, Los Angeles is looking out of state for less toxic forms of energy. The city council approved a 25-year power purchase agreement with K Road Moapa Solar for up to 250 MW of power from a solar power plant on tribal land of the Moapa Band of the Paiute, north of Las Vegas.
The Los Angeles Department of Water and Power has said it expects to get around 606,650 MW-hours of energy annually from the planned solar PV operation beginning around 2015 – enough to power about 118,000 homes. According to City Council documents, the LADWP will pay up to 64.8 million USD a year for the power, which roughly works out to about 10.6 cents per kilowatt-hour. Under the deal, LADWP will also purchase a 5.5-mile transmission line, at a cost of
18 million USD, to connect the power to its substation, and get an option to purchase the solar power plant.
LA now obtains a hefty portion of its power from big coal-fi red plants in Arizona and Utah, but there is a direct coal angle to the Moapa solar PV development: The Moapa are hopeful that producing power from solar can eventually allow for the shuttering of the Reid Gardner power station that sits right in the middle of their community. That’s a hope U.S. Senate Majority Leader Harry Reid addressed in reacting to the LA City Council vote in favour of solar. “Unlike the old, dirty technologies used at the nearby Reid-Gardner coal plant, this new solar project will not emit any hazardous emissions, wastes, or carbon pollution,” the senator said in a statement. “I have worked hard to make sure that Nevada tribes have new opportunities to fl ourish and I am confi dent that this clean energy project will provide a meaningful opportunity to improve the quality of life for the Moapa Paiutes and nearby communities.”
www.theenergycollective.com25 November 2012
SCOTLAND ON TRACK TO MEET 2020 RENEWABLE ELECTRICITY TARGETFigures released by the Department for Energy and Climate Change (DECC) show that Scotland’s renewable energy generation of 806 GW for the fi rst half of 2012 was up 12.8 per cent on the same period in 2011. DECC also confi rmed that 35 per cent of Scottish electricity demand was met from renewables in 2011, smashing the 31 per cent target and making it a record year for renewable energy generation in Scotland. Scottish Energy Minister Fergus Ewing said, “These statistics show once again that Scotland leads the world in renewable energy generation, and that our industry goes from strength to strength.”
9
International
December 2012Volume 6 Issue 3
director of WWF Scotland said, “It’s great news that Scotland is producing even more renewable electricity than last year, but this should come as no surprise. We have repeatedly beaten our renewable electricity goals and are well on track to hit the 100 per cent target by 2020. Clean, green energy from a whole range of renewables is vital to our move to reduce climate change emissions.”
www.keepscotlandbeautiful.org 2 October 2012
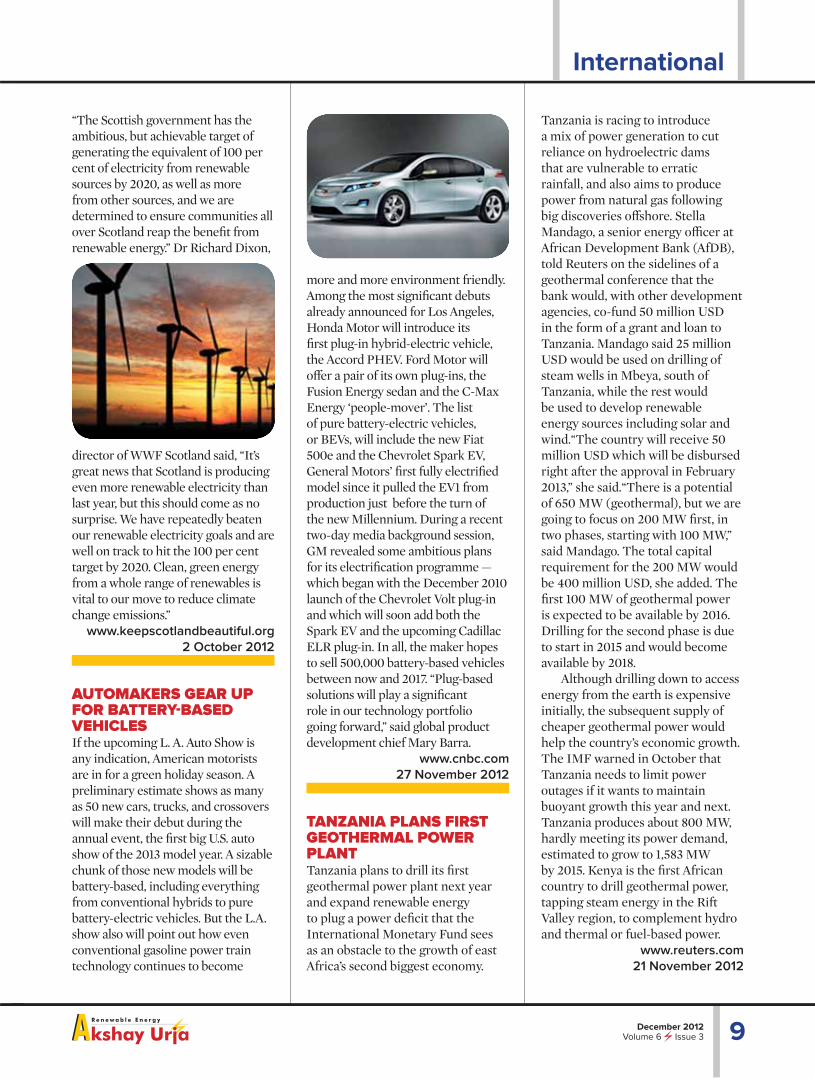
AUTOMAKERS GEAR UP FOR BATTERY-BASED VEHICLESIf the upcoming L. A. Auto Show is any indication, American motorists are in for a green holiday season. A preliminary estimate shows as many as 50 new cars, trucks, and crossovers will make their debut during the annual event, the fi rst big U.S. auto show of the 2013 model year. A sizable chunk of those new models will be battery-based, including everything from conventional hybrids to pure battery-electric vehicles. But the L.A. show also will point out how even conventional gasoline power train technology continues to become
more and more environment friendly. Among the most signifi cant debuts already announced for Los Angeles, Honda Motor will introduce its fi rst plug-in hybrid-electric vehicle, the Accord PHEV. Ford Motor will off er a pair of its own plug-ins, the Fusion Energy sedan and the C-Max Energy ‘people-mover’. The list of pure battery-electric vehicles, or BEVs, will include the new Fiat 500e and the Chevrolet Spark EV, General Motors’ fi rst fully electrifi ed model since it pulled the EV1 from production just before the turn of the new Millennium. During a recent two-day media background session, GM revealed some ambitious plans for its electrifi cation programme — which began with the December 2010 launch of the Chevrolet Volt plug-in and which will soon add both the Spark EV and the upcoming Cadillac ELR plug-in. In all, the maker hopes to sell 500,000 battery-based vehicles between now and 2017. “Plug-based solutions will play a signifi cant role in our technology portfolio going forward,” said global product development chief Mary Barra.
www.cnbc.com27 November 2012
TANZANIA PLANS FIRST GEOTHERMAL POWER PLANTTanzania plans to drill its fi rst geothermal power plant next year and expand renewable energy to plug a power defi cit that the International Monetary Fund sees as an obstacle to the growth of east Africa’s second biggest economy.
Tanzania is racing to introduce a mix of power generation to cut reliance on hydroelectric dams that are vulnerable to erratic rainfall, and also aims to produce power from natural gas following big discoveries off shore. Stella Mandago, a senior energy offi cer at African Development Bank (AfDB), told Reuters on the sidelines of a geothermal conference that the bank would, with other development agencies, co-fund 50 million USD in the form of a grant and loan to Tanzania. Mandago said 25 million USD would be used on drilling of steam wells in Mbeya, south of Tanzania, while the rest would be used to develop renewable energy sources including solar and wind.“The country will receive 50 million USD which will be disbursed right after the approval in February 2013,” she said.“There is a potential of 650 MW (geothermal), but we are going to focus on 200 MW fi rst, in two phases, starting with 100 MW,” said Mandago. The total capital requirement for the 200 MW would be 400 million USD, she added. The fi rst 100 MW of geothermal power is expected to be available by 2016. Drilling for the second phase is due to start in 2015 and would become available by 2018.
Although drilling down to access energy from the earth is expensive initially, the subsequent supply of cheaper geothermal power would help the country’s economic growth. The IMF warned in October that Tanzania needs to limit power outages if it wants to maintain buoyant growth this year and next. Tanzania produces about 800 MW, hardly meeting its power demand, estimated to grow to 1,583 MW by 2015. Kenya is the fi rst African country to drill geothermal power, tapping steam energy in the Rift Valley region, to complement hydro and thermal or fuel-based power.
www.reuters.com21 November 2012
“The Scottish government has the ambitious, but achievable target of generating the equivalent of 100 per cent of electricity from renewable sources by 2020, as well as more from other sources, and we are determined to ensure communities all over Scotland reap the benefi t from renewable energy.” Dr Richard Dixon,

December 2012Volume 6 Issue 310
Cover Story
SOLAR STREET LIGHTINGLight Emitting Diode (LED) solar lights is emerging as an alternative to the grid powered conventional street lighting systems in rural areas because of their
superiority in energy effi ciency, lumen depreciation, operation and maintenance. Solar PV powered LEDs for street lighting systems are ideally suited for rural
areas where grids are weak and there are frequent disruptions and outages of conventional electric power.
Fig 1. LED Solar street lights in village Bukapur, Moradabad, Uttar Pradesh
M. SIDDHARTHA BHATT, RAJASHEKAR P. MANDI, K. PRADEEP
Light emitting diodes (LEDs) are miniature bulbs of directional or pointed beams with UV resistant, weather proof, unbreakable plastic, super-lamination. Basically, the mode of building up luminaires of a large
size is through clustering of miniature sources into a lamp. An individual LED gives a maximum output of 1200 lumen. Luminaires are confi gured out of around 3 to 60 LEDs.
Solid state, white, opto semiconductor LEDs in conjunction with solar photovoltaic (PV) have the potential for energisation independent of the grid, especially in areas of weak and unreliable power supply. It is a continuously evolving technology, becoming cheaper each day and it serves as an ideal energy saving solution in the street lighting sector - portable as well as in-situ technology. The energy effi ciency of LEDs (laboratory) which was around 100
lumen/W in 2008 went up to 132 in 2009 and 231 in 2011. The fi eld effi ciencies are presently around 90-100 lumen/W. The diff erence in the laboratory and fi eld conditions is on account of the operating temperature and other factors such as operating current, linkage to driver and battery unit, etc.
A major advantage of solar PV based LED lighting technology is its ability to be later integrated into smart grid confi gurations in the electricity distribution sector because of its solid state technology which can be digitally controlled for illumination level, on/off operations, etc. The street lighting load when using LED systems would be of much lower electric rating that can also be controlled with ease. It is an ideal solution for a demand side management for minimisation of the grid evening peak created because of lighting loads. Dimming, without drop in energy effi ciency is

11December 2012Volume 6 Issue 3
Cover Story
a distinct feature of LED lighting. LEDs using SPV has the added advantage of bringing
down the capital cost of the SPV system as the power requirement of the LEDs are far lower than that of conventional lighting systems. Hence, the SPV based LED lamps are emerging as the front runners for energy saving, grid independent street lighting systems (Fig. 1). The power input of equivalent LEDs is reduced to almost 25 per cent of their conventional tubular fl uorescent lamp (TFL) or compact fl uorescent lamp (CFL) equivalent.
A typical confi guration, as fi xed by Ministry of New and Renewable Energy (MNRE) is a 40 W solar PV panel, 40 Ah battery and 9-11 W LED lamps, to give an output lighting level of over 15 lux at 4 m height and 4 m periphery (Fig. 3).
Luminaires and their effi ciency In general, a lamp (in the present context) is a light source energised by electric power from either the grid or through a solar installation. A luminaire is a device that serves for the distribution, fi ltering or transformation of the light, including necessary components for fi xing, protection and energy supply of these lamps. Luminaires can be classifi ed on the basis of the type of lamp, the number of lamps, the location (indoors, outdoors), the type of protection (luminaires for dry, humid or dusty environments), etc.
This study is restricted to LED lamps for street lighting powered by solar PV power systems. LED systems have ideal compatibility with solar PV systems because both are solid state devices. Performance indices : Some of the characteristics of white LEDs are as follows:■ The present light density is 1 mcd/m2.■ The correlated colour temperature (CCT) is in the range of
2600 K to 10,000 K. Typically it is 2600-3700 K.■ The colour rendering index (CRI) varies between 75 and
85. At lower colour temperatures the CRI is higher and decreases with the increase in CCT.
■ LEDs being point sources, the viewing angle of the emitter is 15-25°.
■ The operating voltage varies between 2.5 to 4 V (with typical values of 3.5 to 4 V) while the operating current varies between 100-1000 mA (with typical values of 300-500 mA).
■ The forward current varies exponentially with rise in forward voltage.
■ The lumen output increases with current at the rate of 0.25 per cent to 0.35 per cent/mA.
■ The thermal resistance of the junction is around 8°C/W and the maximum junction temperature is around 150°C.
■ The luminous fl ux decreases with increase in junction temperature at the rate of 0.25 per cent/°C. At 150°C it is around 68 per cent of the value at 25°C.
While in fl uorescent and incandescent technologies the lumen effi ciency increases with increase in power output
Fig 2. View of heat sink used in dispersing the heat from the back of the lamp.
A major advantage of solar PV based LED lighting technology is its ability to be integrated into smart grid confi gurations because of its solid state technology which can be digitally controlled for illumination level, on/off operations, etc.
whereas in LED lighting systems it decreases with increase in power output. Hence, dimming improves energy effi ciency besides reducing the power input.Energy effi ciency: The basic conversion effi ciency of electric power to light in the LED is represented by the lumen effi ciency (ε) which is the ratio of the lumen output to the electric input (lumen/W). Luminous fl ux (φ -lumen) is the luminous energy emitted/transmitted per second. Luminous effi ciency (ε -lumen/W) is the effi cacy of the lamp or the inherent effi ciency of the lamp. The 100 per cent conversion equivalent of electric power to light energy or maximum effi ciency of a light source matching the chromaticity co-ordinates of white light is as follows:i. The photopic luminous effi ciency of monochromatic light at 555 nm is 683 lumen/W.ii. The scotopic luminous effi ciency (low light conditions with luminescence of 10-6 to 10-2 cd/m2) is 1700 lumen/W at 507 nm.iii. As per the International Standards 1 lumen is equivalent to 0.001496 W which gives a mesophic luminous effi ciency of 668.45 lumen/W. Thus, in absolute terms 1 W is the equivalent of 668.45 lumen which is considered as the 100 per cent luminous output.
The maximum energy effi ciency of an electric converter into light is governed by the Carnot cycle effi ciency where the electric power is considered as a heat source at infi nite temperature and the light source is considered at its colour temperature. The Carnot conversion effi ciency is ≈100 per
December 2012Volume 6 Issue 312
Cover Story
and electrical loss due to contact resistance in the LED. Taking each of these as 90 per cent, the external quantum effi ciency of a LED works out to 72.9 per cent which is 487.30 lumen/W. This does not include the AC to DC or DC to DC power conversion of input voltage and optical redistribution effi ciency which is given under the lamp effi ciency (see Equation 2).
The maximum external quantum lumen efficiency of white LEDs (blue output converted to white) is 300 lumen/W (energy efficiency = 45 per cent) with the use of nano crystal materials. According to published literature, the highest external quantum efficiency achieved is 200-240 lumen/W for experimental LEDs. The colour conversion efficiency (from blue to white) through the phosphor is already considered in the external quantum efficiency of emitter. The external quantum lumen efficiency of the light source/emitter/engine which includes the colour converter (from blue to white through the phosphor) is 90-110 lumen/W for commercial LEDs.
The driver effi ciency for a conventional driver is around 85+ per cent while for a well designed micro-controller based driver it can be as high as 98 per cent. Driver effi ciency is highly sensitive to the cost of the power source (in the case of solar PV system where capital cost of the solar module is high). Investment in the driver cost is off set by the reduction in the cost of the PV panel. The optical re-distributor effi ciency is around 95 per cent.These are the losses due to redistribution of the point source in the luminaire through diff users, lenses, refl ectors, etc., at the system level. The energy effi ciency of the lamp is given by,
ηηεε reflectordriveremitterlamp= (2)
Thus, the lumen effi ciency of market LEDs which
include the drive and refl ector is around 100 lumen/W (energy effi ciency = 15 per cent).Thermal load : The thermal load (q) (W) of the LED emitter/
The maximum energy effi ciency of an electric converter into light is governed by the Carnot cycle effi ciency where the electric power is considered as a heat source at infi nite temperature and the light source is considered at its colour temperature.
cent because this is an energy transition from a higher graded source (electric power) to a nearly/slightly lower graded source (light). In solar PV conversion, the Shockley-Queisser limit of quantum effi ciency for silicon for a gap band of 1.1 electron volts (eV) is 33.7 per cent for a single layer and 86.0 - per cent for infi nite layers.
In LEDs using Group III semiconductors, the internal quantum effi ciency in multilayered conversion is 100 per cent for blue light of 490 nm at 2.7 eV energy level. The external quantum effi ciency is given by,
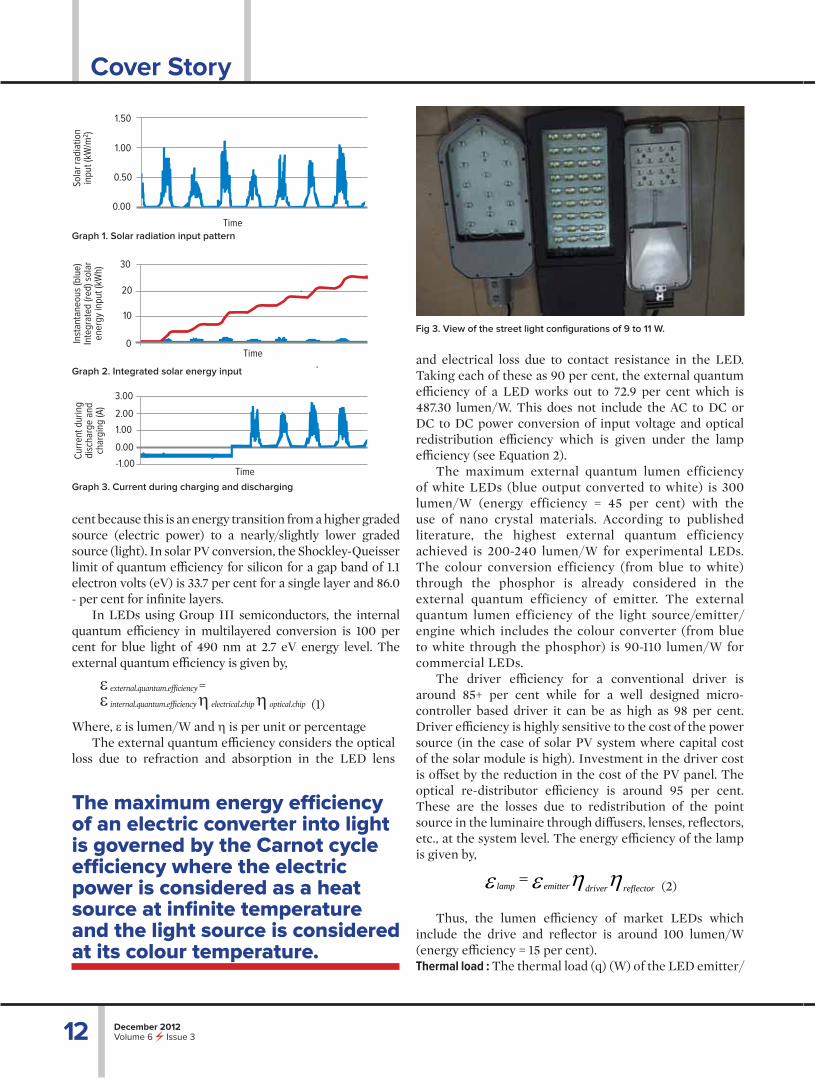
Fig 3. View of the street light confi gurations of 9 to 11 W.
Time-1.00
0.00
1.00
2.00
3.00
Cur
rent
dur
ing
dis
char
ge a
nd
char
ging
(A)
Time
10
20
30
0Inst
anta
neou
s (b
lue)
In
tegr
ated
(red
) sol
ar
ener
gy in
put (
kWh)
Graph 2. Integrated solar energy input
Graph 3. Current during charging and discharging
Time
0.00
0.50
1.00
1.50
Sola
r ra
dia
tion
inpu
t (kW
/m2)
Graph 1. Solar radiation input pattern
ε external.quantum.effi ciency =ε internal.quantum.effi ciency η electrical.chip η optical.chip (1)
Where, ε is lumen/W and η is per unit or percentageThe external quantum effi ciency considers the optical
loss due to refraction and absorption in the LED lens

13December 2012Volume 6 Issue 3
Cover Story
source/engine of electric power input of P (W) is given by,
For a typical LED with a lumen effi ciency of 90-100 lumen/W, the thermal load is 85+ per cent of the input electric power to the emitter (after subtracting of the thermal loss in the driver). Heat sinks (Fig. 2) must be designed in conditions of higher power and lower lumen effi ciency. The thermal load (q) (W) of the driver of rating P (W) is given by,
( )[ ]Pqdriver
η−= 1 (4)
The driver thermal load is the fraction of the electric power absorbed in the driver as heat which is typically between 2 per cent to 15 per cent of the input electric power. The design of the thermal heat dissipation is through heat sinks of copper or aluminium or metal composites with air cooled fi ns or forced cooling (fans). LEDs are epoxy packed and the connection pins are used as heat sinks to dissipate the heat. If the thermal balance is maintained, i.e., the rate of heat dispersed is equal to the rate of heat generated, then the life of the LEDs will be as per design. Otherwise there will be temperature rise leading to lowering of life of the source and acceleration of lumen depreciation.
ResultsGraphs 1 to 6 give the performance of a typical LED street light of 10 W input. Fig. 1 to 3 give the view of street light
fi xture and the thermal management system for heat dissipation.Areas for improvement in the system are:■ Optimisation of the thermal management system for
reducing the cost of extended heat transfer area as well as achieving the required level of cooling by avoiding temperature rise of the system.
■ Optimisation of design to achieve ingress proofi ng as well as enabling heat dispersion.
■ Optimisation of lumen depreciation after operation for 2000-3000 hours.
■ Improvement in robustness of the driver under abnormal electrical conditions. ■ Design optimisation for confi guring these street lighting
lamps for gang/centralised operation in multiples of 25, 50 and 100 lamps for rural clusters/networks.
Conclusions The solar powered LED street lighting technology, addressed primarily to meet the requirements of rural areas that are weakly connected to the grid or facing power outages (Fig. 4). The LED street lighting systems provide 15 lux at a height of 4 m and periphery of 4 m at an energy effi ciency of 90 lux/W. There is further scope for developments in the area of powering street lights for villages and rural clusters in a centralised operating mode for 25, 50 and 100 lamps. ❂
The authors are Additional Director, Engineering Offi cer and Engineering Assistant, respectively, in Energy Effi ciency and Renewable Division, Central Power Research Institute, Bangalore. Email : [email protected]
Table 1. The typical performance range of street lighting systems.
Particular Power (W)Light Output(lux)
Electronic Effi ciency (per cent)
Power to Electronic Circuit (W)
Maximum 12.3 21.5 94.9 1.6
Minimum 9.2 16.1 86.2 0.5
Average 9.9 17.8 90.4 1.1
Fig 4. Solar operated street lights in Deoghar, Jharkhand
Graph 4. Battery voltage in a street lighting system
Graph 5. Solar PV and battery voltage in the street lighting system
Graph 6. Integrated battery current in a street lighting system
Time
14.00
13.00
12.00
11.00
10.00
Bat
tery
vol
tage
dur
ing
disc
harg
e an
d ch
argi
ng
thro
ugh
sola
r po
wer
(V)
Time
20.00
0.00
-20.00
-40.00Inst
anta
neou
s (b
lue)
In
tegr
ated
(red
) b
atte
ry c
urre
nt (A
)
Time
25.00
20.00
15.00
10.00
5.00
0.00
PV
vol
tage
(red
) an
d b
atte
ry v
olta
ge
(blu
e) (V
)
P
q = [1-( )]P (3)668.45 ε emitter

RE Feature
14 December 2012Volume 6 Issue 3
USHA RAGHAVAN
Battery Energy StorageBatteries based renewable energy systems bring stable and reliable power that supports critical applications.
Cost, life cycle, safety, energy and power are major barriers in energy storage systems. The economic
viability of renewable energy source largely depends on the effi ciency of the battery and the cost eff ectiveness
of the storage system.
Fig 1. Small wind turbines of 3.2 kW under testing at Wind Turbine Research Station

RE Feature
15December 2012Volume 6 Issue 3
Chronic power shortage coupled with an increased need for energy in a backdrop of rapidly growing population and emerging economies is posing challenges to the energy market. Renewable
energy is an alternative that can meet the global energy supply defi cit with the help of good energy storage systems. Batteries are extensively used with renewable energy utilities to store energy for later use, to supply energy on demand. Wind and solar power is susceptible to weather and its output is intermittent. Battery energy storage station makes renewable energy relevant to the grid and stabilises output from wind power plants and solar farms, strengthening the on-grid proportion of this power and enhances grid security. Taking advantage of storage battery discharge, a combined system of wind and solar power and energy storage can smoothen power output, stabilise electricity transfer and improve quality of grid connection for renewable energy power plants. In fuel cells, the energy reservoir in the form of a battery may be required to off set the relatively slow response during transient load demands. With the recent advancements in battery technology, effi cient storage of energy in battery has become feasible and the conversion effi ciency hasalso increased (Fig. 1 & 2).
Battery parametersThere are several parameters that are specifi ed for a given battery. They vary from one battery type to another and also depend on operating conditions. Some of these parameters that serve as useful indicators of battery’s performance are:Capacity: It is the maximum charge storage capacity of a battery, represented in terms of Ampere-hour.Voltage: These are the open circuit voltage (theoretical voltage), working voltage (available voltage during
Fig 2. Solar battery system
Table 1. Table showing relative performance of various types of batteries
Lead acid
Nickel metal hydride
Nickel-cadmium
Lithium ion Ferrous
Voltage ** * * ***** ****
Cycle life ** *** *** *** *****
Energy density (by weight)
* *** ** ***** ****
Energy density (by volume)
* *** ** ***** ***
Safety **** *** ***** * *****
High current discharge
*** *** ***** **** *****
High temperature performance
* * **** *** ****
Low temperature performance
***** * *** *** ***
Battery parameters vary from one battery type to another and also depend on operating conditions which serve as useful indicators of a battery’s performance.
operating conditions) and cutoff voltages (voltages after which the battery needs to be recharged).Depth of discharge: This is a measure of how much energy has been withdrawn from a battery and is expressed as a percentage of its full capacity.Life cycle: It is the number of complete charge-discharge cycles that a battery can perform before its normal capacity falls below 80 per cent of its initial rated capacity.Self discharge: It is the electrical capacity that is lost when a battery is not being used.
Factors aff ecting battery performanceThe theoretically available energy of a battery cannot be completely converted into electrical energy. Only a fraction of the theoretical capacity of the battery can be used. The performance of the battery is aff ected by various factors, some of which are:Voltage levels: When a battery is discharged its terminal voltage is always lower than the theoretical voltage. This is due to ohmic and polarisation losses.Discharge current: The magnitude of discharge current aff ects the battery’s terminal voltage and its service life. Higher discharge current results in shorter service life.Temperature during discharge: The temperature has a signifi cant eff ect of battery capacity and its terminal voltage. As the battery temperature reduces both the voltage and capacity of battery decreases.

RE Feature
16 December 2012Volume 6 Issue 3
maximise the performance of lithium-ion batteries.Fig 3 is an illustration of a cathode electrode, with the
aluminium current collector foil covered with nanophosphate particles. The middle image is the nanophosphate secondary particle and the image on the right illustrates the primary particles. The primary nanophosphate particles are on the order of one-tenth of a micron in diameter and are agglomerated into much larger secondary particles, which have diameters of a few microns. Micron-sized secondary particles allow the nanophosphate powder to be handled and processed more easily. This unique electrochemical structure of nanophosphate enables a number of performance advantages, including higher power, excellent safety, long life and greater usable energy.
A very recent study at Stanford University has demonstrated that it is possible to build a solar battery entirely with carbon. Carbon has the potential to deliver high performance at a low cost. Scientists at Universityof Texas are developing safe nano-engineered alloyanodes to replace the unsafe graphite anodes now used in lithium-ion technology to store electricity produced by renewable sources.
ConclusionBatteries are useful in ensuring the optimum use of renewable energy. In fact the economic viability of renewable energy source largely depends on the effi ciency of the battery and cost eff ectiveness of the storage system. The ultimate miracle battery is however, nowhere in sight and the battery remains the ‘weak link’ for the foreseeable future. As long as the battery is based on an electro-chemical process, limitations of power density and short life expectancy must be taken into account. It is necessary to adapt to this constraint and design the equipment around it. People want an inexhaustible pool of energy in a small package that is cheap, safe and clean. A radical turn will be needed to satisfy the unquenchable thirst for portable and mobile power. It is doubtful whether a superior electro-chemical battery, an improved fuel cell, a futuristic atomic fusion battery or some other ground breaking energy storage device will fulfi l this dream. ❂The author is Head, Information Technology, Vidya Prasarak Mandal’s Polytechnic, Thane. Email: [email protected]
Types of batteries and their comparisonBatteries are typically classifi ed as primary and secondary batteries. The primary batteries are non-rechargeable batteries. They need to be discarded once they discharge. They normally have a long shelf life and are used for portable electronic devices. They include alkaline and lithium batteries. Secondary batteries are rechargeable batteries. They are used as storage devices for electrical energy as their charge retention period is poor resulting in poor shelf life. They include the lead-acid batteries, Ni-Cd batteries and lithium ion batteries. Traction secondary batteries are used for storing energy in solar photovoltaic systems. They involve number of charge and discharge cycles. A comparison of the performance of popularly used lead acid, nickel metal hydride, nickel-cadmium, lithium ion and ferrous batteries is shown in Table 1. Li-ion and Fe batteries provide superior battery life, performance, safety and density compared to lead acid batteries.
Lead acid batteries are cheap, bulky, need high maintenance and exhibit low power density. Nickel – metal hydride batteries are costly, rugged, need low maintenance and have a low power density. Lithium ion batteries have a high power/energy density and low weight/volume. They have very high effi ciency but are expensive.
Choice of a batteryThe choice of a battery depends on the given applications and is determined by following factors:■ Working voltage and battery capacity■ Cyclic requirements (in solar PV systems, batteries are
required to provide energy whenever sunlight is not available. It is required to undergo a number of charge/ discharge cycles and are subjected to deep discharge due to load demands)
■ Range of operating temperatures■ Self discharge rate of batteries
Nanotechnology for energy storageThe overall performance and reliability of an advanced battery system depends largely on the cell chemistry. Lithium ion batteries can be used for a wide range of applications. Nanophosphate is an engineered nanoscale material with specifi c structural and chemical properties designed to
A recent study at Stanford University has demonstrated that it is possible to build a solar battery entirely with carbon with a potential to deliver high performance at a low cost.
Fig 3. Electrochemical structure of nanophosphate
-5 microns<0.1 microns
RE Feature
17December 2012Volume 6 Issue 3
ANANT B. TAMHANE
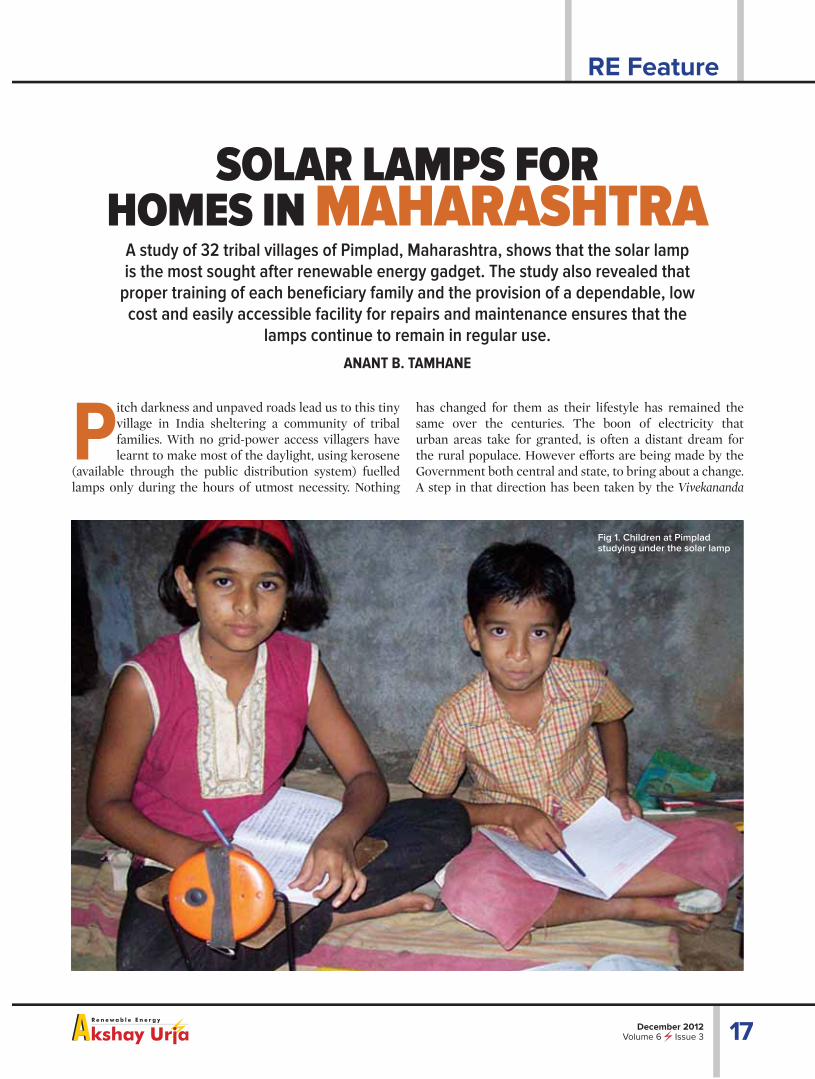
SOLAR LAMPS FOR HOMES IN MAHARASHTRA
Pitch darkness and unpaved roads lead us to this tiny village in India sheltering a community of tribal families. With no grid-power access villagers have learnt to make most of the daylight, using kerosene
(available through the public distribution system) fuelled lamps only during the hours of utmost necessity. Nothing
A study of 32 tribal villages of Pimplad, Maharashtra, shows that the solar lamp is the most sought after renewable energy gadget. The study also revealed that
proper training of each benefi ciary family and the provision of a dependable, low cost and easily accessible facility for repairs and maintenance ensures that the
lamps continue to remain in regular use.
has changed for them as their lifestyle has remained the same over the centuries. The boon of electricity that urban areas take for granted, is often a distant dream for the rural populace. However eff orts are being made by the Government both central and state, to bring about a change. A step in that direction has been taken by the Vivekananda
Children Studying Under the Solar Lamps
Fig 1. Children at Pimplad studying under the solar lamp

RE Feature
18 December 2012Volume 6 Issue 3
Kendra Prashikshan aur Seva Prakalpa (Vivekananda Kendra for Training and Service Project). Under its ‘Project for Renewable Energy Intervention for Rural Development,’ 32 villages were selected around Pimplad in the Trimbakeshwar Taluk of Nasik district in Maharashtra (Table 1).
Mode of ImplementationAll the selected villages were fairly large in size and comprised of a few hamlets each. The houses were scattered and in general, located on farmlands. Although a network of motorable roads connected the hamlets, however a few hamlets could be accessed only by foot (~300 m) and were therefore not covered under the state electricity board supply. Thus, around 50 per cent of the houses had no access to electricity supply from the Maharashtra State Electricity Board (MSEB). The electrifi ed villages also did not have uninterrupted power supply with outages lasting over 18 hours a day.
Solar lamps were selected as one of the important renewable energy gadgets for intervention. The village folk were, in general, resource poor. Most of them did not have ready cash to purchase these new gadgets. Also eff ective training for proper operation and maintenance of the new devices was the other important aspect that had to be considered. Keeping this in view and to ensure that the solar lamps provided to the villagers render satisfactory service over their normal life span, the following guidelines were adopted for selecting the benefi ciaries: (1) Households which were either not covered by the MSEB or were unable to avail the connection were given priority; and (2) Full cost of the solar lamps was met from the project budget of EVE Foundation, Mumbai which worked in co-ordination with the Vivekananda Kendra. The Vanavasi tribal community selected for the distribution are mainly cultivators and labourers (Fig. 2). The project also taught the benefactors how to repair solar lamps using LED technology. In all 4500 solar lamps were distributed in 32 tribal villages since September 2010 (Fig. 3).
The solar lamp confi guration Lantern mode -Ten LEDs are used to light up a room. It provides 16 hours of service. Turbo mode - Ten LED light up to the ‘very bright’ mode which allows it to be used as a desk lamp for reading. It can be used for 4 hours in this mode.Torch mode - Out of ten LEDs only two light up. It can be used as a night lamp too and can provide 16 hours of service. All the above three facilities are available on a single switch. In the turbo mode solar lamps provide 200 per cent brighter light than a kerosene lamp.
Vivekananda Kendra Prashikshan and Seva PrakalpaThe training centre covers a project area of several remote tribal villages and small ‘padas.’ The Vanvasi tribal community inhabiting these areas are deprived of education, health care and employment. To carry forward the great vision of Swami Vivekananda the Kendra was fi rst launched in Kanyakumari in 1972. The branches then spread over the farthest and inaccessible areas of the country to be silently engaged in the task of ‘nation building’ with the theme ‘serve man- serve God’.
The work undertaken in Pimplad, actualises the messages of Swamiji. Balwadi, anandalaya, vivekashram, aarogya seva, shramdaan shibirs, vocational training and mahila jagran are some of the activities undertaken for the Vanavasi villages. The Vivekananda Kendra Prashikshan Seva Prakalpa also propagates the use of biogas and are evolving a programme for biodiesel. Use of Kandi-coal is also propagated. The Vivekananda Kendra’s Natural Resources Development project known as VK-NARDEP has been working for more than 25 years in the fi eld of sustainable development. Its work in renewable energy has even won the organisation the prestigious international ‘ASHDEN’ award.
In conclusionThe salient points that emerged during the implementation of
Table 1. Background of Project Area
Particulars Pimplad Bramha-nwada Sapgaon Amboli Aambai
Population 1500 1000 1200 2000 1100
No. of house holds
350 250 270 325 150
Area under farming(in hectares)
85 65 75 70 30
Major crop Rice and Nachani only, grown from rain water
Energy source
Few diesel and electric pumps for lifting water from rivers and ground water from open wells
Fig 2. The villagers fi lling up forms to avail the solar lamp

RE Feature
19December 2012Volume 6 Issue 3
the solar lamps project in the selected villages are as follows:■ Solar lanterns are one of the most eff ective and sought
after RE gadgets in the villages.■ There is a need to adequately train the adults of each
benefi ciary family in order to ensure satisfactory performance of the gadget.
■ The quantity and reliability of materials used to create the solar lamp ought to be excellent for the smooth running of the gadget.
■ Dependable, low cost and easily accessible systems for repairs and maintenance are a must in order to ensure that the solar lamps continue to remain in regular use.
After a very long wait there is now some light in the lives of the villagers of Pimplad - all due to the newly installed solar lamps. After darkness falls children are now found huddled around solar lamps - studying. Women visit one another’s house more frequently with the quarters being lighted up. With working hours extended, women are now performing various household chores like stitching and cooking under the illumination of the reliable solar light. Men too are involving themselves in productive activities by settling farming material (such as produce in godowns, seed/
sapling procurement etc.) and holding meetings with senior members to exchange agriculture related know-how. Above all people are saving the money that was spent on kerosene and are not being subject to indoor pollution too. ❂The author is an Engineer Consultant in Renewable Energy, Vidharbha, Maharashtra, email : [email protected]
Fig 3. Villagers and trainers in Pimplad
There has been consistent increase in the pace of renewable energy development and the sector has grown at an annual rate of 23 per cent rising from about 3900 MW in 2002-2003 to about 26,137 MW in September 2012.
Wind energy continues to dominate India’s renewable energy industry, accounting for 70 per cent of installed capacity (18,192 MW), followed by small hydropower (3,447 MW), biomass power (3,359 MW) and solar power
(1045 MW). In terms of electricity generation, with normative capacity utilisation factors, the renewable power installed capacity is generating around 50 BU per year corresponding to about 6.5 per cent in the total
electricity mix and 12.5 per cent of total capacity in 2011-2012. Off grid applications of renewable energy have also made signifi cant headway.
AT A GLANCERenewable Energy in India
Source : MNRE

RE Feature
20 December 2012Volume 6 Issue 3
CHETAN S. SOLANKI, BRIJ M. ARORA, JUZER VASI AND GAURAV B. TARE
PV Laboratory Kit for TRAINING SOLAR
ENGINEERSThe National Centre for Photovoltaic Research and Education
(NCPRE) at Indian Institute of Technology Bombay (IITB) used a novel and low cost ‘Solar Photo Voltaic Laboratory Kit’ (SPLK) to
conduct teaching courses in remote centres.
Fig 1. Hands-on training to teachers on the lab kit, NCPRE

RE Feature
21December 2012Volume 6 Issue 3
The Solar PV Laboratory Kit is designed by the faculty and research staff of NCPRE using low cost components. Using the Kit, one can perform various experiments right from the cell to system level. For
the two week interactive course 35 lab kits were fabricated and shipped to 35 remote centres. The approximate cost of each kit was Rs. 40,000. The coordinators of the remote centres received hands-on experience with the laboratory kit well before the course and thereafter they provided the hands-on training to teachers participating at the respective centres (Fig. 1). To supplement the lab kit, a detailed 163 page laboratory manual was also sent out to all centres. In addition, a DVD, ‘Solar PVs: Fundamentals, Technology and Applications’ showing how the experiments are to be performed, was also provided. These served as an aid to the coordinators during the course as well as a reference for the participants while performing the experiments.
Laboratory KitEach laboratory kit consists of fi ve sub-kits and one freeware. They are as follows:
i. Solar PV Module Characterisation Kit - It makes use of mono-crystalline and multi-crystalline solar PV modules (10 W and 2 numbers each). These mono and multi PV modules are diagonally arranged in the frame so that one can identify the diff erence in mono and multi technology of solar PV modules. At standby, this frame of PV modules rests in another frame having a mechanical moving and locking arrangement. This makes the PV module kit very compact and a person can easily carry it from his lab to the roof or suitable place having direct sunlight for undertaking the experiment. The moving and locking arrangement facilitates to set and lock the solar PV module frame very precisely at required angle between 0-90°. The protractor reads the proper tilt angle of the PV modules frame. It consists of two fi xed legs in the front and two castor wheels at its back; the castor wheels can be used to rotate the PV module kit to track the sun, the fi xed legs keeps the kit fi xed during low wind loads. While tracking the sun using the moving arrangement and castor wheels, the needle provided right at the centre of the PV module frame shows the direction of the sun. When the shadow of the needle becomes zero, it means that the PV modules are directly facing the sun. The banana pins provided as terminals of PV modules facilitates series and parallel connections of the PV modules within the kit very conveniently (Fig. 2).
ii. Solar PV Cell Characterisation Kit - Two 4 x 4 cm2 glass laminated multi-crystalline solar cells are housed inside the cabinet in an aluminium block. This aluminium block is fi tted
with a heater and a temperature sensor. The temperature controller facilitates the controlling of temperature on the solar cells (temperature dependence of a solar cell can be studied). The cooling fan directly blows air on the aluminium block and solar cells when cooling is required by the user. The ammeter and voltmeter gives the readings while performing experiments, the 100 Ohms resistance pot acts as variable load on the solar cells, one can vary the pot gradually to plot I-V characteristics.
For using the nearly 1000 W/m2 obtained from the
Fig 3. Solar cell as radiation measurement kit
sun, two of quartz halogen lamps (50 W rating each) are used. These lamps are provided with intensity regulator knob and a series of insertable fi lters and glasses to vary the light intensity while performing experiments. The kit is also provided with a switch for internal and external mode. Internal mode is the normal mode for performing experiments and in the external mode, an external power supply (four quadrant power supply or an electronic load) can be used so as to study the dark and illuminated current-voltage characteristics of a solar cell (Fig. 3).
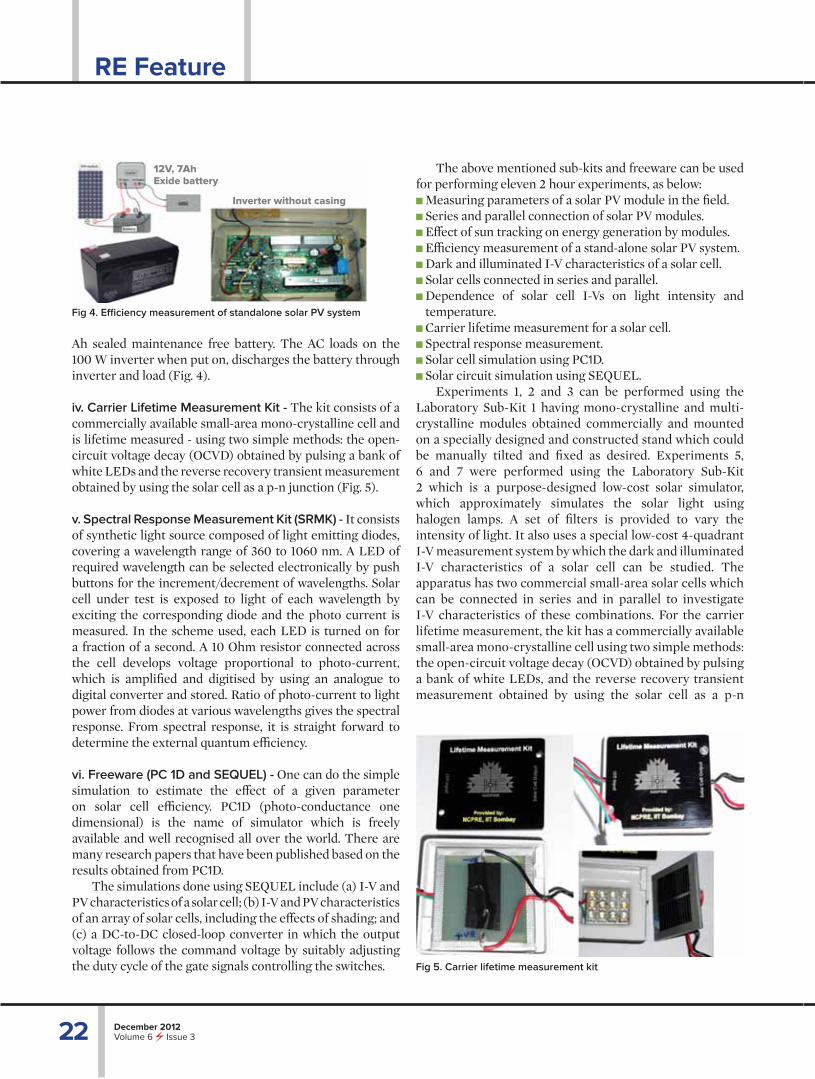
iii. Solar PV System Characterisation Kit - The PV system consists of diff erent components of a stand-alone PV system such as solar PV modules, battery, inverter and load. In this the major components are solar PV modules, battery and inverter. Solar PV modules are used to charge the 12 V, 7.2
Pyranometre
Calibrated solar cell
Fig 2. Solar PV module characterisation kit
Castor wheels at two ends for 360* rotation
Degree protractor at either end of the kit
Needle for shadow
Handle for opening the frame
Two crystalline and two multi crystalline modules
Fixed legs at two ends for fi rm holding of the kit
Key used in the locking arrangement
Locking arrangement at two ends
RE Feature
22 December 2012Volume 6 Issue 3
The above mentioned sub-kits and freeware can be used for performing eleven 2 hour experiments, as below:■ Measuring parameters of a solar PV module in the fi eld.■ Series and parallel connection of solar PV modules.■ Eff ect of sun tracking on energy generation by modules.■ Effi ciency measurement of a stand-alone solar PV system.■ Dark and illuminated I-V characteristics of a solar cell.■ Solar cells connected in series and parallel.■ Dependence of solar cell I-Vs on light intensity and
temperature.■ Carrier lifetime measurement for a solar cell.■ Spectral response measurement. ■ Solar cell simulation using PC1D.■ Solar circuit simulation using SEQUEL.
Experiments 1, 2 and 3 can be performed using the Laboratory Sub-Kit 1 having mono-crystalline and multi-crystalline modules obtained commercially and mounted on a specially designed and constructed stand which could be manually tilted and fi xed as desired. Experiments 5, 6 and 7 were performed using the Laboratory Sub-Kit 2 which is a purpose-designed low-cost solar simulator, which approximately simulates the solar light using halogen lamps. A set of fi lters is provided to vary the intensity of light. It also uses a special low-cost 4-quadrant I-V measurement system by which the dark and illuminated I-V characteristics of a solar cell can be studied. The apparatus has two commercial small-area solar cells which can be connected in series and in parallel to investigate I-V characteristics of these combinations. For the carrier lifetime measurement, the kit has a commercially available small-area mono-crystalline cell using two simple methods: the open-circuit voltage decay (OCVD) obtained by pulsing a bank of white LEDs, and the reverse recovery transient measurement obtained by using the solar cell as a p-n
Ah sealed maintenance free battery. The AC loads on the 100 W inverter when put on, discharges the battery through inverter and load (Fig. 4).
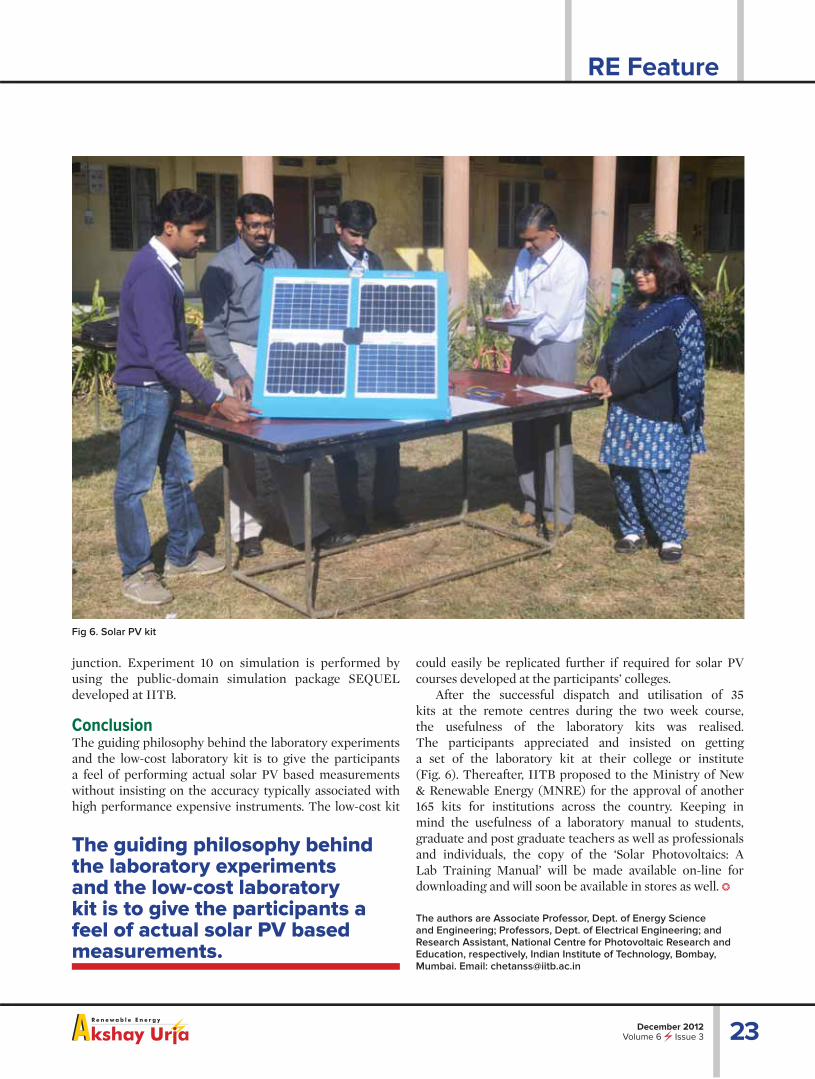
iv. Carrier Lifetime Measurement Kit - The kit consists of a commercially available small-area mono-crystalline cell and is lifetime measured - using two simple methods: the open-circuit voltage decay (OCVD) obtained by pulsing a bank of white LEDs and the reverse recovery transient measurement obtained by using the solar cell as a p-n junction (Fig. 5).
v. Spectral Response Measurement Kit (SRMK) - It consists of synthetic light source composed of light emitting diodes, covering a wavelength range of 360 to 1060 nm. A LED of required wavelength can be selected electronically by push buttons for the increment/decrement of wavelengths. Solar cell under test is exposed to light of each wavelength by exciting the corresponding diode and the photo current is measured. In the scheme used, each LED is turned on for a fraction of a second. A 10 Ohm resistor connected across the cell develops voltage proportional to photo-current, which is amplifi ed and digitised by using an analogue to digital converter and stored. Ratio of photo-current to light power from diodes at various wavelengths gives the spectral response. From spectral response, it is straight forward to determine the external quantum effi ciency.
vi. Freeware (PC 1D and SEQUEL) - One can do the simple simulation to estimate the eff ect of a given parameter on solar cell effi ciency. PC1D (photo-conductance one dimensional) is the name of simulator which is freely available and well recognised all over the world. There are many research papers that have been published based on the results obtained from PC1D.
The simulations done using SEQUEL include (a) I-V and PV characteristics of a solar cell; (b) I-V and PV characteristics of an array of solar cells, including the eff ects of shading; and (c) a DC-to-DC closed-loop converter in which the output voltage follows the command voltage by suitably adjusting the duty cycle of the gate signals controlling the switches.
Fig 4. Effi ciency measurement of standalone solar PV system
12V, 7Ah Exide battery
Inverter without casing
Fig 5. Carrier lifetime measurement kit
RE Feature
23December 2012Volume 6 Issue 3
The guiding philosophy behind the laboratory experiments and the low-cost laboratory kit is to give the participants a feel of actual solar PV based measurements.
Fig 6. Solar PV kit
junction. Experiment 10 on simulation is performed by using the public-domain simulation package SEQUEL developed at IITB.
ConclusionThe guiding philosophy behind the laboratory experiments and the low-cost laboratory kit is to give the participants a feel of performing actual solar PV based measurements without insisting on the accuracy typically associated with high performance expensive instruments. The low-cost kit
could easily be replicated further if required for solar PV courses developed at the participants’ colleges.
After the successful dispatch and utilisation of 35 kits at the remote centres during the two week course, the usefulness of the laboratory kits was realised. The participants appreciated and insisted on getting a set of the laboratory kit at their college or institute(Fig. 6). Thereafter, IITB proposed to the Ministry of New & Renewable Energy (MNRE) for the approval of another 165 kits for institutions across the country. Keeping in mind the usefulness of a laboratory manual to students, graduate and post graduate teachers as well as professionals and individuals, the copy of the ‘Solar Photovoltaics: A Lab Training Manual’ will be made available on-line for downloading and will soon be available in stores as well. ❂
The authors are Associate Professor, Dept. of Energy Science and Engineering; Professors, Dept. of Electrical Engineering; and Research Assistant, National Centre for Photovoltaic Research and Education, respectively, Indian Institute of Technology, Bombay, Mumbai. Email: [email protected]
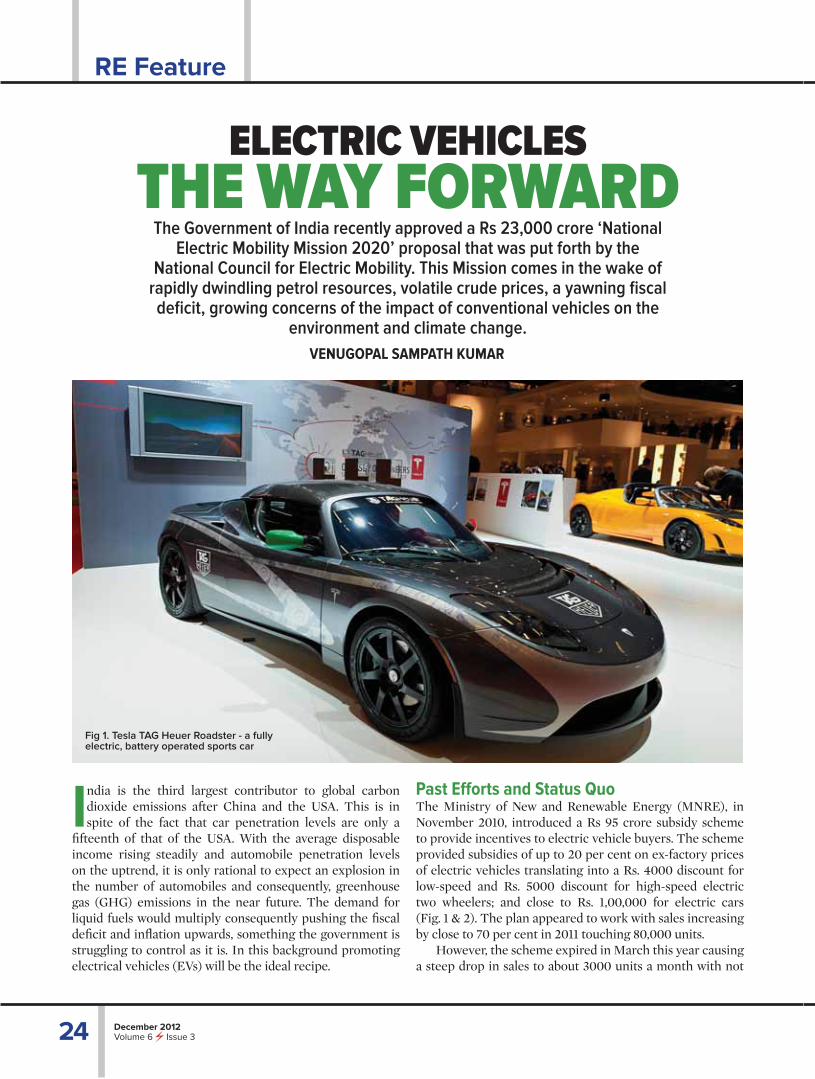
RE Feature
24 December 2012Volume 6 Issue 3
VENUGOPAL SAMPATH KUMAR
ELECTRIC VEHICLESTHE WAY FORWARD
India is the third largest contributor to global carbon dioxide emissions after China and the USA. This is in spite of the fact that car penetration levels are only a
fi fteenth of that of the USA. With the average disposable income rising steadily and automobile penetration levels on the uptrend, it is only rational to expect an explosion in the number of automobiles and consequently, greenhouse gas (GHG) emissions in the near future. The demand for liquid fuels would multiply consequently pushing the fi scal defi cit and infl ation upwards, something the government is struggling to control as it is. In this background promoting electrical vehicles (EVs) will be the ideal recipe.
The Government of India recently approved a Rs 23,000 crore ‘National Electric Mobility Mission 2020’ proposal that was put forth by the
National Council for Electric Mobility. This Mission comes in the wake of rapidly dwindling petrol resources, volatile crude prices, a yawning fi scal defi cit, growing concerns of the impact of conventional vehicles on the
environment and climate change.
Past Eff orts and Status QuoThe Ministry of New and Renewable Energy (MNRE), in November 2010, introduced a Rs 95 crore subsidy scheme to provide incentives to electric vehicle buyers. The scheme provided subsidies of up to 20 per cent on ex-factory prices of electric vehicles translating into a Rs. 4000 discount for low-speed and Rs. 5000 discount for high-speed electric two wheelers; and close to Rs. 1,00,000 for electric cars(Fig. 1 & 2). The plan appeared to work with sales increasing by close to 70 per cent in 2011 touching 80,000 units.
However, the scheme expired in March this year causing a steep drop in sales to about 3000 units a month with not
Fig 1. Tesla TAG Heuer Roadster - a fully electric, battery operated sports car

RE Feature
25December 2012Volume 6 Issue 3
a single electric car being sold in the months of April and May. Of the 1000 dealerships in the country, 250 shut down and 3 out of 12 e-bike manufacturers shut shop. This clearly highlights the dependence of the industry on subsidies. The MNRE has since reinstated the subsidy scheme in September giving in to the pleas from electric vehicle manufacturers.
While the MNRE’s scheme boosted sales of electric vehicles two-fold, it did little to create a sustainable market. The most common reasons cited for the electric vehicles market not picking up the fi rst time around were lack of awareness creation and support infrastructure viz. charging stations. India currently has about 1500 electric cars and 400,000 electric bikes on the road.
National Mobility Mission 2020More than 80 per cent of the envisioned 6-7 million electric vehicles on Indian roads are expected to be two-wheelers. For the plan to succeed, average yearly sales in the order of 800,000-1,000,000 two wheelers would be required, nearly ten times the number of vehicles sold in the industry’s best year till date. The Government is expected to invest Rs. 12,000-14,000 crores over the next 5 years, primarily to boost demand through subsidies, a move to facilitate consumer acceptance of these newer technologies which have higher costs of acquisition. Furthermore, the Government will invest heavily on research and development eff orts and put in place charging infrastructure to encourage migration from conventional methods. The substantial savings on account of decrease in fossil fuel consumption will more than off set the support provided therefore justifying this initiative as an economically viable proposition (Table 1).
Market DriversEV sales in the past, in developed markets have been driven by green enthusiasts who did not mind dishing out a little more for something that would cause a lesser impact on the surrounding environment. The Indian market, however, is vastly diff erent as it focuses on economics and cost-benefi ts. Therefore, it is a highly price-driven market. Secondly, most customers tend to compare an EV with a conventional automobile and thus expect maximum range even if it is true
Table 1. National Mobility Mission 2020 Highlights
Mission Highlights Intended Eff ect/Purpose
6-7 million electric vehicles on the road by 2020.
Liquid fuel savings of 2-3 million tonnes and lowering of GHG emissions by 1.3-1.5 per cent in 2020 as compared to status quo.
Close to Rs 23,000 crores expected to be spent with government contributing around Rs 12,000-14,000 crores and industry about Rs 8000-9000 crores.
Sound charging infrastructure and extensive research and development to be carried out. Subsidies to boost sales of EVs. Creation of a wider rangeof products.
that they do not use the entire range on a daily basis. It gives them ‘more options’. A third driver would be the burgeoning petrol and diesel costs. Petrol has been fully deregulated and the prices are expected to only go higher. Diesel deregulation is expected at some point in the future and the prices have already seen a 10-per cent increase recently. Other factors such as lower charge time and wider product ranges could act as sales drivers as well.
ChallengesWhile there remains no doubt that subsidies will play a big role in stimulating sales and promoting electric vehicles in order to achieve envisioned sales fi gures a lot more will be necessary. ■ Vehicle safety : It has been a major deterrent to the large-scale adoption of electric vehicles in the past. Lithium-ion batteries are prone to fi re and hence present a considerable stumbling block to the growth of the industry. Stringent quality control measures and safety standards have to be put in place to ensure that only batteries of the highest quality are used because even a single incident can set the industry back by a few years.■ In the past, electric vehicle owners have complained that post-sales service off ered by the manufacturers were extremely discouraging. Excellent after-sales service in combination with good charging infrastructure can go a long way in improving the overall attractiveness of electric vehicles to the consumer. These methods have been winners for conventional automobile manufacturers in India with Maruti being a good example.■ EV owners have often complained about the product range when it comes to EVs. Even though this is capital intensive, it could work in the favour of the manufacturer in the long run if companies look at investing in a wider product range.
PositivesAlthough the challenges are many, there are a few factors that will be working for the Mission and the growth of electric vehicles. Recent and imminent hike in gas prices will work in
Fig 2. Electric vehicle - Siemens electric car, Munich, Germany

RE Feature
26 December 2012Volume 6 Issue 3
wheeler EVs have been proven to be a success in a similar price-driven Chinese market simply because the initial investment is lower. ■ A recent McKinsey analysis showed that current cost reduction eff orts can cut the battery costs by up to 60 per cent by 2020. The battery unit accounts for 60 per cent of the electric vehicle costs. Prudent R & D investments and eff orts in this direction will improve the aff ordability of electric vehicles. ❂
favour of EVs improving viability and thus, strengthening its case for growth. This crucial factor, in tandem with subsidies, promises to be the biggest driver of electric vehicle sales during the tenure of the plan.
Points for Consideration■ Lack of awareness is often cited as one of the main reasons behind EVs not previously taking off in India. The Government in partnership with vehicle manufacturers can undertake awareness campaigns to clear popular misconceptions about EVs. With the right charging infrastructure, full charge time can be cut to about 4-5 hours considering that residential power is supplied at 220 V in India. Another useful fact that could be conveyed is that 80 per cent charge takes only 2-3 hours, more than enough for the average Indian commuter.■ The Government can also play a part in showcasing the benefi ts by investing in electric buses and taxis. Such a public transparent system would go a long way in raising consumer confi dence.■ Pure battery EVs are very expensive and are known to be less successful than plug-in hybrid electric vehicles (PHEVs) and hybrid electric vehicles (HEVs) since the initial cost is much higher. PHEVs and HEVs can bridge the gap until battery costs are lowered easing the transition to pure battery EVs. In this context, range extended electric vehicles (REEVs) can be a good alternative as well. In these vehicles, there exists a small ICE which charges the battery unlike the conventional hybrid. Therefore, when charge runs out, conventional fuel could be used to charge the battery thus extending the range.■ At a time when fossil fuel prices are steeply rising and forcing the public to pay attention to their fuel bills, the time is ripe for the introduction of the national plan. The onus will be on the Government to set the tone for the EV industry in India over the next 5 years. Leading by example can be a move that could work wonders for the sector. The target of 6 million electric vehicles on the road looks achievable considering the success of electric bikes in a similar Chinese two-wheeler dominated market provided the investment is used prudently. ■ India is predominantly a two-wheeler market. Two-
Hikes in gas prices will work in favour of electric vehicles improving viability and thus, strengthening the case for growth. This crucial factor, in tandem with subsidies, promises to be the biggest driver of electric vehicle sales. The author is Senior Research Analyst, Energy Alternatives India,
Chennai. Email: [email protected]
Electric VehiclesThere are 2-wheeler and 4-wheeler electric vehicles. Two wheeler vehicles are apt for shorter distances. They are lighter, have lower battery size requirements and are, hence, cheaper. They have also been proved to be hugely successful in a two-wheeler dominated market like China which has around 6-7 million 2-wheelers. Four wheeler electric vehicles are, however, much more popular in the west. They have higher battery requirements envisaged to be apt for long commutes and trips. Purely battery electric vehicles have, yet, to take off fully - with hybrids proving to be more popular.
Drivers ■ Economics and cost-benefi ts: Financing options ■ Vehicle range ■ Burgeoning conventional fuel costs ■ Lower charge time ■ Wider product rangeDeterrents ■ Vehicle safety ■ Post-sales service ■ Product range ■ Public confi dencePositives ■ Rising fossil fuel costs: Improving economics ■ Predominantly two-wheeler market ■ Global battery cost-reduction eff orts

RE Feature
27December 2012Volume 6 Issue 3
BEENA B. NAIR AND S. SESHADRI
Algal Biomass - A renewable substrate
for bio-ethanol production
Algae, a very large and diverse group of simple autotrophic organisms ranging from unicellular to multicellular forms, constitute the largest part of the biotic components of aquatic ecosystems and are seen as an alternative to land based biomass as their cultivation has several advantages over terrestrial plants. They are studied for ethanol production either directly or after the extraction of various
bioactive compounds. However, selection of appropriate algal species, standardisation of mass cultivation practices coupled with
development of economically viable compounds and optimisation of hydrolysis and fermentation processes are likely to play a major role
in the improved production of ethanol.
Fig 1. Scaled up algal cultures

RE Feature
28 December 2012Volume 6 Issue 3
Production of biofuels from less exploited resources is now emerging as a topic of intensive research. Biomass is an attractive feedstock as it is a renewable resource that could be sustainably
developed in the future. It has positive environmental properties resulting in low net release of carbon dioxide, very low sulphur content and signifi cant economic potential. Bio-ethanol feedstocks can be divided into three major groups: (i) sucrose-containing feedstocks (e.g. sugar cane, sugar beet, sweet sorghum and fruits), (ii) starchy materials (e.g. corn, jowar, wheat, rice, potatoes, cassava, sweet potatoes and barley), and (iii) lignocellulosic biomass (e.g. wood, straw, grasses). Conventionally, substrates rich in starch and sugar like corn, sugar cane and sugar beet are utilised as common feedstock for ethanol fermentation. However, these feedstocks are too expensive and are in demand by other applications. Hence, there is a growing interest worldwide to fi nd out new and cheaper sources for production of bio-ethanol.
As bio-ethanol programme is directly linked to various issues like food security, farm economy, climate change, sustainability, technological developments and environmental concerns, simple fast growing biomass are viewed as a medium and long term option for bio-ethanol production. Algal biomass has the potential to act as one of the promising source of biofuels and serve as an excellent alternative source to meet the present and future fuel demands. Of late, research institutions and commercial houses have diverted their attention towards algae based biofuel and it is expected that the next decade will see a tremendous expansion of this area in the global market.
Algae: The Third Generation BiomassAlgae are photosynthetic organisms comprised generally of macroalgae (seaweeds, Fig. 2) and microalgae (phytoplankton). Seaweeds, classifi ed as green, red and brown based on their pigmentation, are benthic marine forms rich in cell wall poly saccharides and carbohydrates and are used mainly in the production of commercially
Fig 2. Seaweeds growing on rocks
valuable phycocolloids such as agar, carrageenan and alginic acid, and as soil fertilisers and conditioners. Microalgae on the other hand are utilised in aquaculture industries and as nutraceutical supplements as well as for the extraction of high value compounds including carotenoids and polyunsaturated fatty acids. Since certain algae are rich in carbohydrates (generally seaweeds - 20 to 50 per cent and microalgae - 4 to 23 per cent dry weight) of various forms such as starch, cellulose, glucose and other sugars and polysaccharides, they provide an economically viable feed stock for fermentation to ethanol.
Algae, considered as the third generation biomass have proved to be superior to any other biomass due to its environmental and economic sustainability, security of supply, absence of lignin, high photosynthetic effi ciency, fast-growing rate and role in reduction of greenhouse gas emissions. They have the potential to convert atmospheric carbon dioxide into useful biomass by growing even in wastewaters and can yield biofuels without much harm to food supplies, biodiversity and agriculture. A number of algal species with high oil and starch content are now being identifi ed and tested for mass culturing and biodiesel and bio-ethanol production (Fig. 1).
Ethanol ProductionEthanol can be produced from sugar / starch / cellulose containing biomass by the action of specifi c microbes. The process generally involves acid hydrolysis followed by treatment with hydrolytic enzymes and then fermentation. Since carbohydrates are found in various forms such as starch or cellulose they need to be hydrolysed into sugars to be utilised by ethanologenic microorganisms to ferment them into alcohol. Thus ethanol production is carried out in two major steps, saccharifi cation of starch / cellulose to sugar and fermentation of the hydrolysate by specifi c microbial strains such as yeast.
Various types of pre-treatments are carried out for the improved conversion of cellulosic materials to fermentable sugars before enzymatic saccharifi cation. Contrary to the above, algae with higher photon conversion effi ciency
Algae have proved to be superior to any other biomass due to its environmental and economic sustainability, security of supply, absence of lignin, high photosynthetic effi ciency, fast-growing rate and role in reduction of greenhouse gas emissions.
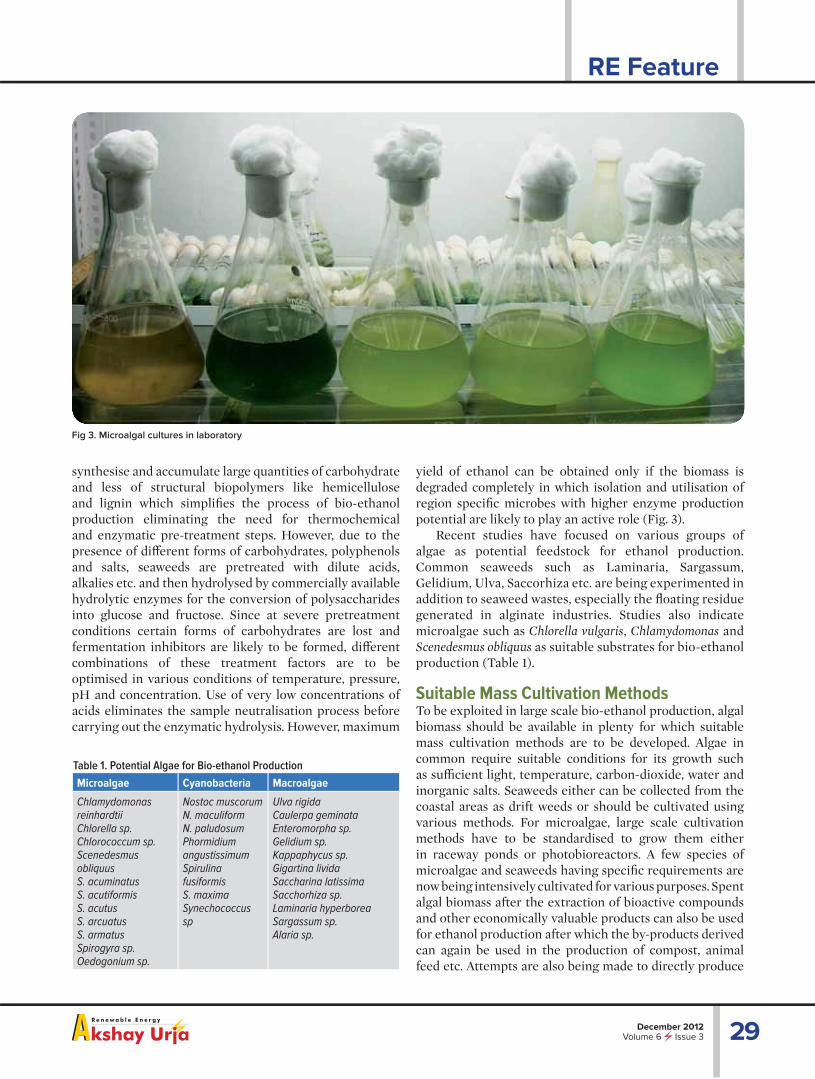
RE Feature
29December 2012Volume 6 Issue 3
yield of ethanol can be obtained only if the biomass is degraded completely in which isolation and utilisation of region specifi c microbes with higher enzyme production potential are likely to play an active role (Fig. 3).
Recent studies have focused on various groups ofalgae as potential feedstock for ethanol production. Common seaweeds such as Laminaria, Sargassum, Gelidium, Ulva, Saccorhiza etc. are being experimented in addition to seaweed wastes, especially the fl oating residue generated in alginate industries. Studies also indicate microalgae such as Chlorella vulgaris, Chlamydomonas and Scenedesmus obliquus as suitable substrates for bio-ethanol production (Table 1).
Suitable Mass Cultivation MethodsTo be exploited in large scale bio-ethanol production, algal biomass should be available in plenty for which suitable mass cultivation methods are to be developed. Algae in common require suitable conditions for its growth such as suffi cient light, temperature, carbon-dioxide, water and inorganic salts. Seaweeds either can be collected from the coastal areas as drift weeds or should be cultivated using various methods. For microalgae, large scale cultivation methods have to be standardised to grow them either in raceway ponds or photobioreactors. A few species of microalgae and seaweeds having specifi c requirements are now being intensively cultivated for various purposes. Spent algal biomass after the extraction of bioactive compounds and other economically valuable products can also be used for ethanol production after which the by-products derived can again be used in the production of compost, animal feed etc. Attempts are also being made to directly produce
synthesise and accumulate large quantities of carbohydrate and less of structural biopolymers like hemicellulose and lignin which simplifi es the process of bio-ethanol production eliminating the need for thermochemical and enzymatic pre-treatment steps. However, due to the presence of diff erent forms of carbohydrates, polyphenols and salts, seaweeds are pretreated with dilute acids, alkalies etc. and then hydrolysed by commercially available hydrolytic enzymes for the conversion of polysaccharides into glucose and fructose. Since at severe pretreatment conditions certain forms of carbohydrates are lost and fermentation inhibitors are likely to be formed, diff erent combinations of these treatment factors are to be optimised in various conditions of temperature, pressure, pH and concentration. Use of very low concentrations of acids eliminates the sample neutralisation process before carrying out the enzymatic hydrolysis. However, maximum
Table 1. Potential Algae for Bio-ethanol Production
Microalgae Cyanobacteria Macroalgae
Chlamydomonas reinhardtiiChlorella sp. Chlorococcum sp.Scenedesmus obliquusS. acuminatus S. acutiformisS. acutusS. arcuatusS. armatus Spirogyra sp.Oedogonium sp.
Nostoc muscorumN. maculiformN. paludosumPhormidium angustissimumSpirulina fusiformisS. maxima Synechococcus sp
Ulva rigidaCaulerpa geminataEnteromorpha sp. Gelidium sp.Kappaphycus sp.Gigartina livida Saccharina latissimaSacchorhiza sp.Laminaria hyperboreaSargassum sp.Alaria sp.
Fig 3. Microalgal cultures in laboratory
RE Feature
30 December 2012Volume 6 Issue 3
ethanol from genetically engineered algal cells avoiding the conventional steps. However in addition to productivity, the cost involved also should be equal to or lower than any other available biomass.
Fermentation of converted sugars to alcohol is being carried out along with saccharifi cation (simultaneous saccharifi cation and fermentation - SSF) or as separate hydrolysis and fermentation - SHF. A wide variety of micro organisms are used in ethanol production mainly to carry out fermentation including bacteria and yeast. Both terrestrial and marine yeasts have proved to be potential candidates for ethanol production as they could utilise cellulose substrates by growing at low pH with minimum nutritional requirements and higher resistance to contamination. Other than Saccharomyces cerevisiae, yeasts like Issatchenkia orientalis and Pichia sp., and bacteria like Escherichia coli, Zymomonas sp. and Klebsiella oxytoca are the common microorganisms which are able to utilise mannitol, glucose etc. and are therefore employed to produce ethanol. However, the process depends on factors such as the kind of pretreatment, fermentation time, pH, temperature, nutrient supplementation etc.
ConclusionsWhile utilisation of algal biomass for bio-ethanol production is an eco-friendly and sustainable approach for renewable bio-fuel production, the approach has its own inherent limitations. Future research in this area is wide open to various promising aspects such as isolation / selection of potential algal strains, optimisation of their growth in various environments, optimisation of carbohydrate content in selected strains, tweaking the potential strains to increase the photosynthetic effi ciency and adaptability either through conventional or modern biotechnological tools and identifi cation of suitable microbes for eff ective break down of carbohydrates and improved fermentation.
Identifi cation of suitable biochemical triggers and environmental factors along with appropriate pretreatment methods and enhanced enzymatic hydrolysis followed by improved fermentation processes will help to obtain high ethanol yields from algae. India being rich in algal biodiversity and holding a massive potential for seaweed farming and microalgal cultivation with its abundant sunlight, can eff ectively exploit the potential of these renewable resources in the fi eld of energy production. Moreover, the exceptional ability of algae to remediate waste water and to make use of fl ue gases if combined with energy generation and development of multiple products will prove to be an economicallyviable option. ❂
Inviting articles for Akshay Urja
Editor, Akshay UrjaMinistry of
New and Renewable Energy Block – 14, CGO Complex,
Lodhi Road, New Delhi – 110 003Tel. +91 11 2436 3035, Fax +91 11 2436 3035 www.mnre.gov.in, E-mail [email protected]
The need to have a sustainable supply necessitates the exploitation of available
energy sources, and among these, renewable resources are at the forefront.
It is now an established fact that RE (renewable energy) can be an integral part of sustainable development because of its
inexhaustible nature and environment-friendly features. RE can play an
important role in resolving the energy crisis in urban areas to a great extent.
Today RE is an established sector with a variety of systems and devices available for meeting the energy demand of urban inhabitants, but there is a need to create
mass awareness about their adoption. Akshay Urja is an attempt to fulfi l this
need through the dissemination of 20,000 copies in India and abroad. The magazine publishes news, articles, research papers, case studies, success stories, and write-ups on RE. Readers are invited to send
material with original photographs and statistical data. The photographs should be provided in high resolution fi les on a CD or through email. Akshay Urja will
pay a suitable honorarium to the authors for each published article of 1500 words and above. The publication material in
two copies, along with a soft copy on CD/DVD/e-mail may be sent to-
The authors are Scientist (Algology) and Director (R&D),respectively, at Shri AMM Murugappa Chettiar Research Centre, Taramani, Chennai. Email: [email protected]

RE Feature
31December 2012Volume 6 Issue 3
Fig 1. Biofuel generation in reactors
RENU SINGH, ARTI BHATIA AND SAPNA TIWARI
HYDROGEN : FUEL FOR ENERGY SECURITY
During the launch of National Action Plan on Climate Change, the Prime Minister of India, Dr. Manmohan Singh said ”Our vision is to make India’s economic development energy-effi cient.
Over a period of time, we must pioneer a graduated shift from economic activity based on fossil fuels to one based
Hydrogen, a clean and economic fuel, is a renewable energy source, which is the pressing need of the present time.
Surplus agricultural residue can be safely used to produce hydrogen which can open doors to a wide range of new energy
technologies and policy options.
on non-fossil fuels and from reliance on non-renewable and depleting sources of energy to renewable sourcesof energy”.
The need of the hour is very aptly conveyed by the Prime Minister. India is already on the world map as far as harnessing of renewable energy is concerned. The nation
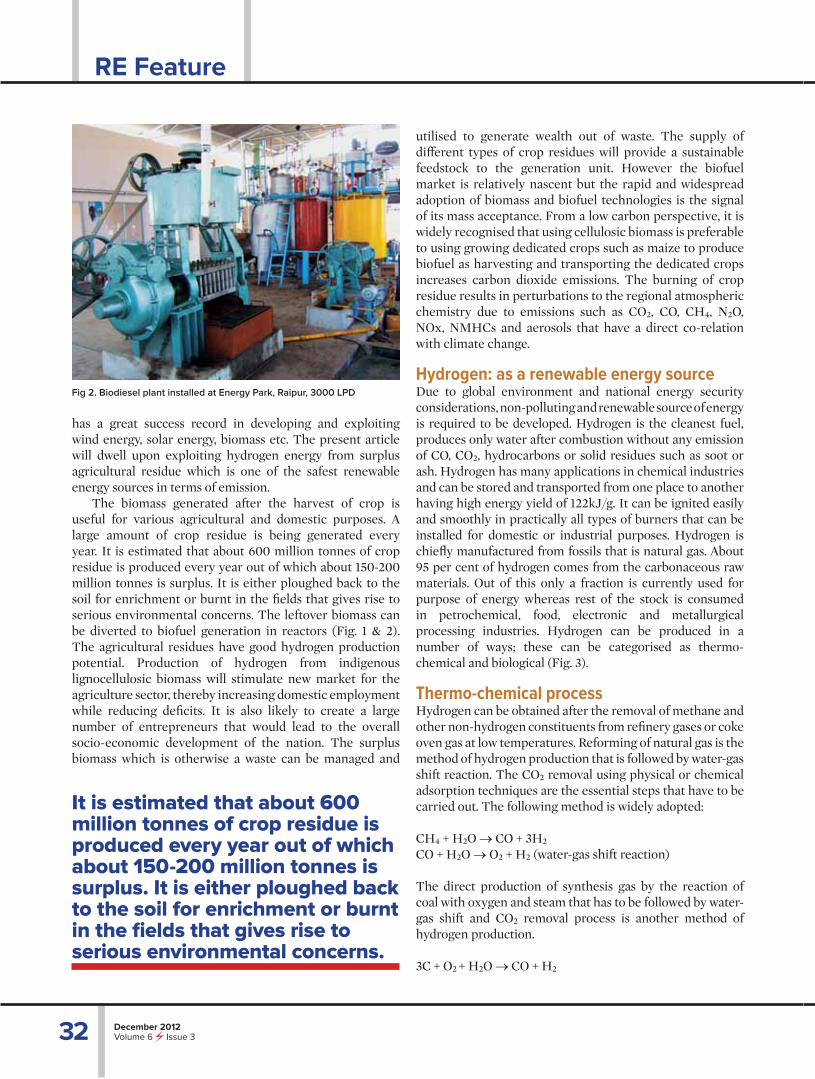
RE Feature
32 December 2012Volume 6 Issue 3
has a great success record in developing and exploiting wind energy, solar energy, biomass etc. The present article will dwell upon exploiting hydrogen energy from surplus agricultural residue which is one of the safest renewable energy sources in terms of emission.
The biomass generated after the harvest of crop is useful for various agricultural and domestic purposes. A large amount of crop residue is being generated every year. It is estimated that about 600 million tonnes of crop residue is produced every year out of which about 150-200 million tonnes is surplus. It is either ploughed back to the soil for enrichment or burnt in the fi elds that gives rise to serious environmental concerns. The leftover biomass can be diverted to biofuel generation in reactors (Fig. 1 & 2). The agricultural residues have good hydrogen production potential. Production of hydrogen from indigenous lignocellulosic biomass will stimulate new market for the agriculture sector, thereby increasing domestic employment while reducing defi cits. It is also likely to create a large number of entrepreneurs that would lead to the overall socio-economic development of the nation. The surplus biomass which is otherwise a waste can be managed and
Fig 2. Biodiesel plant installed at Energy Park, Raipur, 3000 LPD
It is estimated that about 600 million tonnes of crop residue is produced every year out of which about 150-200 million tonnes is surplus. It is either ploughed back to the soil for enrichment or burnt in the fi elds that gives rise to serious environmental concerns.
utilised to generate wealth out of waste. The supply of diff erent types of crop residues will provide a sustainable feedstock to the generation unit. However the biofuel market is relatively nascent but the rapid and widespread adoption of biomass and biofuel technologies is the signal of its mass acceptance. From a low carbon perspective, it is widely recognised that using cellulosic biomass is preferable to using growing dedicated crops such as maize to produce biofuel as harvesting and transporting the dedicated crops increases carbon dioxide emissions. The burning of crop residue results in perturbations to the regional atmospheric chemistry due to emissions such as CO2, CO, CH4, N2O, NOx, NMHCs and aerosols that have a direct co-relation with climate change.
Hydrogen: as a renewable energy sourceDue to global environment and national energy security considerations, non-polluting and renewable source of energy is required to be developed. Hydrogen is the cleanest fuel, produces only water after combustion without any emission of CO, CO2, hydrocarbons or solid residues such as soot or ash. Hydrogen has many applications in chemical industries and can be stored and transported from one place to another having high energy yield of 122kJ/g. It can be ignited easily and smoothly in practically all types of burners that can be installed for domestic or industrial purposes. Hydrogen is chiefl y manufactured from fossils that is natural gas. About 95 per cent of hydrogen comes from the carbonaceous raw materials. Out of this only a fraction is currently used for purpose of energy whereas rest of the stock is consumedin petrochemical, food, electronic and metallurgical processing industries. Hydrogen can be produced in a number of ways; these can be categorised as thermo-chemical and biological (Fig. 3).
Thermo-chemical processHydrogen can be obtained after the removal of methane and other non-hydrogen constituents from refi nery gases or coke oven gas at low temperatures. Reforming of natural gas is the method of hydrogen production that is followed by water-gas shift reaction. The CO2 removal using physical or chemical adsorption techniques are the essential steps that have to be carried out. The following method is widely adopted:
CH4 + H2O → CO + 3H2
CO + H2O → O2 + H2 (water-gas shift reaction)
The direct production of synthesis gas by the reaction of coal with oxygen and steam that has to be followed by water-gas shift and CO2 removal process is another method of hydrogen production.
3C + O2 + H2O → CO + H2
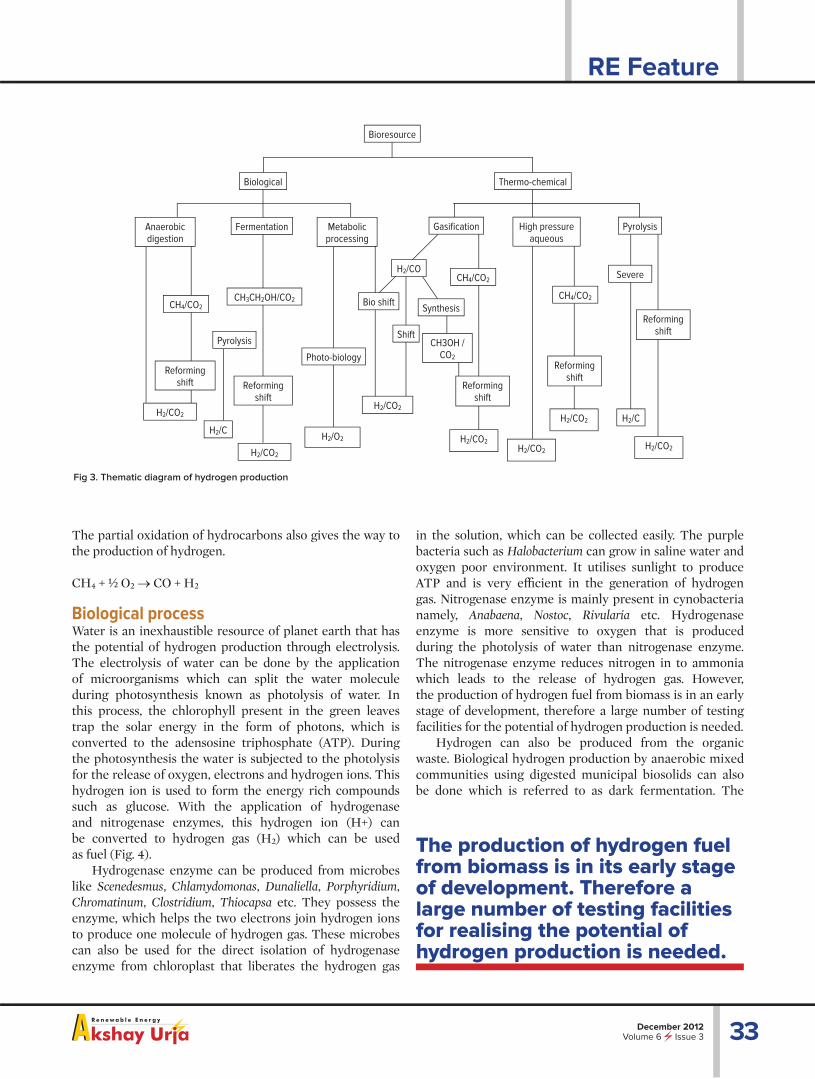
RE Feature
33December 2012Volume 6 Issue 3
The production of hydrogen fuel from biomass is in its early stage of development. Therefore a large number of testing facilities for realising the potential of hydrogen production is needed.
The partial oxidation of hydrocarbons also gives the way to the production of hydrogen.
CH4 + ½ O2 → CO + H2
Biological processWater is an inexhaustible resource of planet earth that has the potential of hydrogen production through electrolysis. The electrolysis of water can be done by the application of microorganisms which can split the water molecule during photosynthesis known as photolysis of water. In this process, the chlorophyll present in the green leaves trap the solar energy in the form of photons, which is converted to the adensosine triphosphate (ATP). During the photosynthesis the water is subjected to the photolysis for the release of oxygen, electrons and hydrogen ions. This hydrogen ion is used to form the energy rich compounds such as glucose. With the application of hydrogenase and nitrogenase enzymes, this hydrogen ion (H+) canbe converted to hydrogen gas (H2) which can be usedas fuel (Fig. 4).
Hydrogenase enzyme can be produced from microbes like Scenedesmus, Chlamydomonas, Dunaliella, Porphyridium, Chromatinum, Clostridium, Thiocapsa etc. They possess the enzyme, which helps the two electrons join hydrogen ions to produce one molecule of hydrogen gas. These microbes can also be used for the direct isolation of hydrogenase enzyme from chloroplast that liberates the hydrogen gas
in the solution, which can be collected easily. The purple bacteria such as Halobacterium can grow in saline water and oxygen poor environment. It utilises sunlight to produce ATP and is very effi cient in the generation of hydrogen gas. Nitrogenase enzyme is mainly present in cynobacteria namely, Anabaena, Nostoc, Rivularia etc. Hydrogenase enzyme is more sensitive to oxygen that is produced during the photolysis of water than nitrogenase enzyme. The nitrogenase enzyme reduces nitrogen in to ammonia which leads to the release of hydrogen gas. However,the production of hydrogen fuel from biomass is in an early stage of development, therefore a large number of testing facilities for the potential of hydrogen production is needed.
Hydrogen can also be produced from the organic waste. Biological hydrogen production by anaerobic mixed communities using digested municipal biosolids can also be done which is referred to as dark fermentation. The
Fig 3. Thematic diagram of hydrogen production
Bioresource
Biological
Anaerobic digestion
Metabolic processing
Gasifi cation Pyrolysis
Thermo-chemical
CH4/CO2
Fermentation
Reformingshift
CH3CH2OH/CO2
H2/CO2
H2/O2
Photo-biology
Pyrolysis
H2/C
H2/CO2
Reforming shift
H2/CO
Shift
Synthesis
CH3OH /CO2
Reforming shift
H2/CO2
H2/CO2H2/CO2
CH4/CO2
H2/CO2 H2/C
Reforming shift
CH4/CO2
Severe
High pressure aqueous
Reforming shift
H2/CO2
Bio shift

RE Feature
34 December 2012Volume 6 Issue 3
theoretical maximum yield of hydrogen fermentation is reported to be four moles of hydrogen per mole of glucose or eight moles of hydrogen per mole of sucrose, if all of the substrate would be converted to acetic acid. A new fermentation process that converts negative-value organic waste into hydrogen rich gas has been developed by the Biotechnology Research Group at Iowa State University. The process employs compost, anaerobic digester sludge, soil etc. as mixed microbial cultures for the conversion to hydrogen rich gas. The hydrogen-producing bacteria such as Clostridia control the system for hydrogen gas production. This technology not only produces the cleanest fuel but also helps in the management of waste in a sustainable manner that provides energy security as well as takes care of the problem of pollution.
Conclusion The application of fuel cells is gaining acceptance in the world of energy production due to its effi ciency. In the production of biogas, bacteria convert organic matter to lower metabolites like organic acids, CO2 and hydrogen. This hydrogen is immediately consumed by the methanogenic bacteria and methane which is the fi nal product. The decoupling of hydrogen production is possible from the methane production system by the prevention of the growth of methanogenic bacteria. It leads to the production of
organic matter to lower metabolites and the conversion of these metabolites to hydrogen.
Hydrogen is an energy carrier with the potential to open doors to a wide range of new energy technologies and policy options. Fuel cells powered by hydrogen can achieve high effi ciencies and have a variety of possible uses in mobile and stationary applications. In the right circumstances hydrogen and fuel cells technologies could make major contributions to the key policy objectives of energy security and mitigation of carbon dioxide emissions, especially in the transportation sector. Recent advances in hydrogen and fuel cell research and development have tremendously increased the interest of the international community towards these technologies which have the potential to create paradigm shifts in transport and power generation. There is a complex array of technologies and processes for hydrogen production, storage, transportation, distribution, diff erent types of fuel cells, and other end use technologies. There is also a range of competing technologies with the potential to meet, at least in part, some of the policy objectives. These include biofuels and various forms of electric or hybrid vehicles. ❂
The authors are Scientist, Senior Scientist and Senior Research Fellow, respectively, at Centre for Environment Science and Climate Resilient Agriculture, Indian Agricultural Research Institute, Pusa, New Delhi. Email: [email protected]
Fig 4. Biological pathways for hydrogen production.
Biofuels, health food, animal feed
Residual microalgae biomass
Cellulosic feedstock
Pretreatment and hydrolysis reactor Dark-fermentation
Photo-fermentation
Hydrolysate
Organic acids
Microalgae-culture
H2
H2
CO2
CO2
Light
Light

RE Feature
35December 2012Volume 6 Issue 3
Mega Solar Rooftop Programme in Tamil Nadu
Special schemes in the construction of solar powered green houses and solar street lighting in villages are being implemented by Tamil Nadu from 2011-12, besides, 3 lakh
solar powered houses and 1 lakh solar powered street lights is targeted for the period of 5 years up to 2015-16.
P. R. RENUKA SAJITH
Fig 1. Street lights powered by centralised solar power plants, Tamil Nadu

RE Feature
36 December 2012Volume 6 Issue 3
The Government of Tamil Nadu has launched the country’s largest solar roof top programme under Chief Minister’s Solar Powered Green House Scheme. The Scheme plans to cover around 60,000
houses per year with solar powered lights for the benefi t of the rural poor thus, envisaging to achieve around 3 lakh houses over a period of 5 years from 2011-12 to 2015-16. Solar lighting systems consisting of 100 W solar PV panel and 5 nos. CFLs each of 9 W were installed for the year 2011-12 at an estimated cost of Rs. 180 crore including fi nancial assistance of Rs. 42.6 crore from Ministry of New and Renewable Energy (MNRE). One lakh street lights in villages are targeted over a period of 5 years upto 2016. For the year 2011-12, 20,000 street lights have been taken up at an estimated cost of Rs. 50.5 crore including fi nancial assistance of Rs. 8.1 crore from MNRE.
These CFLs can be operated for 5 hours per day. The solar home lighting system has an innovative design having storage for one day with provision for a grid backup. The Smart Hybrid Power Conditioning Unit in the system allows charging of battery from the grid, during rainy or cloudy days, when solar power is not suffi cient to charge the battery in full. The intelligent algorithm permits charging from grid only between 10 am and 6 pm. This has been done to prevent charging during the night (which would leave battery in full condition when the sun comes out in the morning) and has also excluded charging during morning peak. Reduction in autonomy has resulted in considerable reduction in capital investment on additional battery and solar PV panel capacity required for higher autonomy (usually 3 day autonomy is provided). Since Tamil Nadu has more than 320 sunny days, no autonomy is provided.
Third party agencies have been appointed for 1 per cent sample pre-dispatch inspection (PDI) at factories and 100 per cent post installation inspection and certifi cation. The entire project runs on a comprehensive enterprise resource planning (ERP) system. Manufacturers submit the lots online through their login, PDI agency login and receive the random sample numbers of the components to be inspected and then submit inspection report. Similarly installation report is submitted online by the vendors which enables third party inspection (TPI) agency to inspect and submit its report online. All reports are processed automatically by ERP for acceptance or rejection. The district engineers of Tamil Nadu Energy Development Agency (TEDA) then do super-check inspections of the 5 per cent random numbers generated by ERP. Payment is automatically made for each batch of 60 installations.
A state of the art call centre is being established for receiving the complaints and monitoring rectifi cation by the suppliers. Vendors selected are Tata Power Solar and Shandong. PDI agency is QSS and TPI agencies are TUV and SGS. Proposal for LED based DC SPV home lights
instead of CFL based AC system is under consideration in the forthcoming years. Under this scheme roof top solar PV modules totalling to 20-30 MW would be installed in 5 years.
The government of Tamil Nadu has also launched the unique scheme of energising existing street lights with solar power in clusters through centralised solar power plants (Fig. 1). This is fi rst of its kind in the country, as the existing street lights so far powered from grid supply are powered from solar energy in clusters of 10 with provision for grid backup. The existing street lights with 40 W tube lights and fi lament lamps are replaced with 20 W LED lights. Similar to home lights, the smart power conditioning unit in the system allows charging of battery from the grid.
Remote monitoring unit is provided in each power plant for monitoring the performance of the street lights from the offi ce of TEDA as well as from each district(Fig. 2). Daily fault report is generated and sent to the supplier for rectifi cation within two days. Tampering of panel, battery and inverter housing is also monitored through tamper alarm and sms. The street lights are dimmed to one third of full brightness from 10 pm to 5 am to save energy.
The system comes with a 5 year replacement warranty (20 years for SPV panel) and is maintained by the suppliers for 5 years. Monthly servicing is mandated. Vendors selected are Tata Power Solar and Sukam. The PDI agency is QSS and Remote Monitoring and TPI Agency is Salzer. ❂
The author is Deputy Senior Manager, Tamil Nadu Energy Development Agency (TEDA), Chennai.Email: [email protected]
Fig 2. Solar PV panel used for powering homes in Tamil Nadu
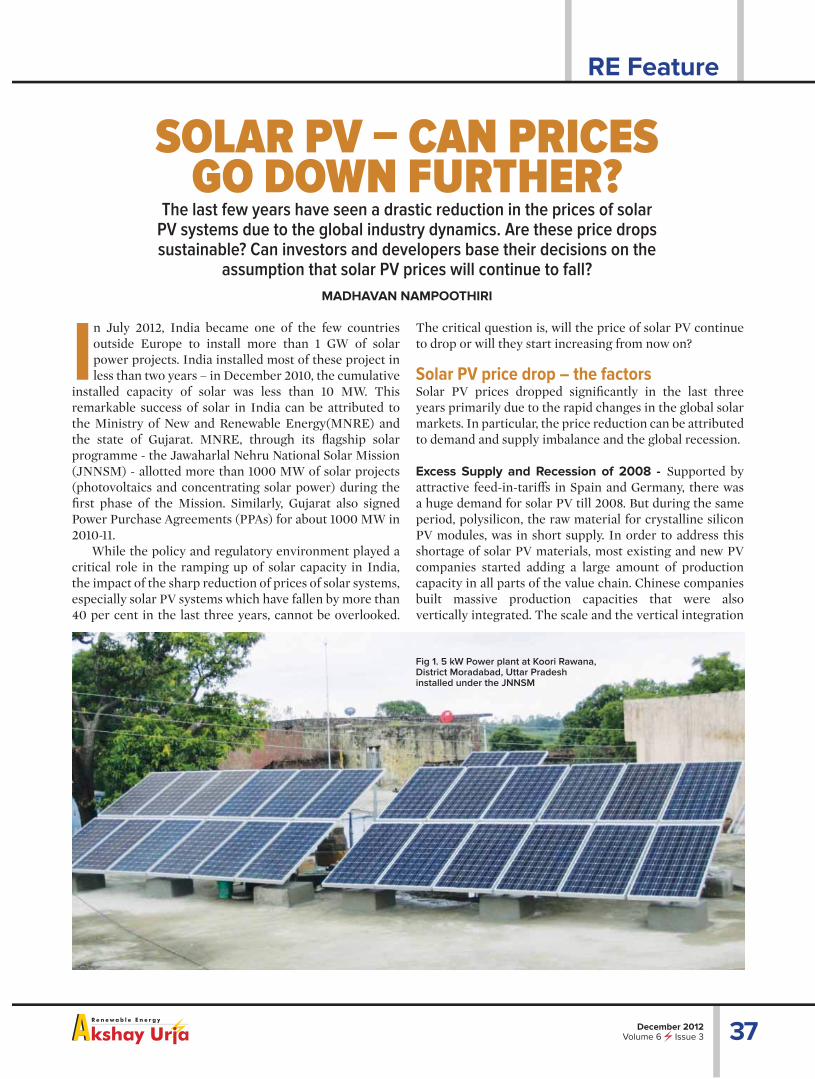
RE Feature
37December 2012Volume 6 Issue 3
MADHAVAN NAMPOOTHIRI
SOLAR PV – CAN PRICES GO DOWN FURTHER?
In July 2012, India became one of the few countries outside Europe to install more than 1 GW of solar power projects. India installed most of these project in less than two years – in December 2010, the cumulative
installed capacity of solar was less than 10 MW. This remarkable success of solar in India can be attributed to the Ministry of New and Renewable Energy(MNRE) and the state of Gujarat. MNRE, through its fl agship solar programme - the Jawaharlal Nehru National Solar Mission (JNNSM) - allotted more than 1000 MW of solar projects (photovoltaics and concentrating solar power) during the fi rst phase of the Mission. Similarly, Gujarat also signed Power Purchase Agreements (PPAs) for about 1000 MW in 2010-11.
While the policy and regulatory environment played a critical role in the ramping up of solar capacity in India, the impact of the sharp reduction of prices of solar systems, especially solar PV systems which have fallen by more than 40 per cent in the last three years, cannot be overlooked.
The last few years have seen a drastic reduction in the prices of solar PV systems due to the global industry dynamics. Are these price drops sustainable? Can investors and developers base their decisions on the
assumption that solar PV prices will continue to fall?
The critical question is, will the price of solar PV continue to drop or will they start increasing from now on?
Solar PV price drop – the factorsSolar PV prices dropped signifi cantly in the last three years primarily due to the rapid changes in the global solar markets. In particular, the price reduction can be attributed to demand and supply imbalance and the global recession.
Excess Supply and Recession of 2008 - Supported by attractive feed-in-tariff s in Spain and Germany, there was a huge demand for solar PV till 2008. But during the same period, polysilicon, the raw material for crystalline silicon PV modules, was in short supply. In order to address this shortage of solar PV materials, most existing and new PV companies started adding a large amount of production capacity in all parts of the value chain. Chinese companies built massive production capacities that were also vertically integrated. The scale and the vertical integration
Fig 1. 5 kW Power plant at Koori Rawana, District Moradabad, Uttar Pradesh installed under the JNNSM

RE Feature
38 December 2012Volume 6 Issue 3
of these Chinese companies helped them reduce the prices tremendously. In the meantime, the recession of 2008 caused a crash in the polysilicon prices. The prices fell from about 350 USD/kg in 2008 to about 20 USD/kg during the mid-2012. This drop in polysilicon prices caused the price of c-si modules to drop by more than 50 per cent. These two drivers – massive production capacity build-up and crash in input costs (of polysilicon) – resulted in huge price drops of solar PV.
Drop in demand – After the recession in 2008, Spain put an end to its feed in tariff (FiT) and many other countries such as France followed it. Even though Germany and Italy periodically reduced their FiTs, the drop in module prices made the solar PV projects fi nancially attractive till end of 2011. However, after the revision of FiT by Germany eff ective from January 2012, the demand for solar PV fell drastically. The mismatch in supply and demand caused by the above factors and the crash in prices led many solar PV manufacturers to either go bankrupt or to opt for restructuring. Signifi cant amount of solar PV inventory had to be liquidated by selling them at a loss.
The drop in solar PV prices globally had an impact
Fig 2. 5 MW grid connected Solar PV plant near Jodhpur, Rajasthan
Solar PV prices dropped signifi cantly in the last three years primarily due to the rapid changes in the global solar markets. In particular, the price reduction can be attributed to demand and supply imbalance and the global recession.
on the solar PV projects in India as well. The Central Electricity Regulatory Commission (CERC) notifi es the benchmark capital costs for solar PV every year. The benchmark cost for the most recent 4 years is given inFig. 3. It can be seen from the Fig. 3 that the system price has dropped by 41 per cent (Rs. 17 crores/MW to Rs. 10 crores/MW) during the period 2009-10 to 2012-13.
The most striking result of this price reduction has been the tariff realisation achieved during the JNNSM reverse bidding. In the fi rst batch of the Phase 1 of the JNNSM, the CERC had set a reference price of Rs. 17.91/kW. However, the average tariff realised was much lower at an average price of Rs. 11.8/kW. The situation became even more interesting in the second round. As against a reference price of Rs. 15.39/kW, the average tariff realised was about Rs. 8.80/kW. The lowest price was about Rs. 7.49/kW, which is a drop of over 50 per cent from the CERC price of Rs. 17.91/kW within a span of less than two years.
System cost - system components - cost breakdownAt the time of writing, several project developers have been able to execute projects at less than Rs. 8 crores/MW. For the purpose of this analysis, only numbers provided by CERC will be used. From the data given in the Table 1, it can be observed that even though price of the system has been dropping, not all of the individual components are seeing reduction in prices. While solar PV module and inverter prices have dropped, the prices of almost every other component have remained stable or have increased. Why is this happening and what are the implications? Let us examine these in some more detail.
ModulesThe price of modules has seen the biggest drop. From about 2 USD/W in early 2011, the module price has dropped by about 60 per cent to 0.80 USD/W in mid-2012. This can be attributed to the excess supply of solar PV modules mentioned earlier. However, we do not expect it to fall further because:■ Consolidation of the industry is leading to a reduction in production capacity, and■ Tightening of input costs (cells and other materials).
The share of module in the system price has dropped to about 45 per cent from earlier 60 per cent.
Fig 3. PV system cost (crores/MW)
Financial Year2009-10
20
15
10
5
02010-11
15.2 14.42
10
17
2011-12 2012-13
Cost
(cro
res/
MW
)

RE Feature
39December 2012Volume 6 Issue 3
InvertersInverter prices saw drops of about 50 per cent from 0.36 USD/W in 2009 to about 0.18 USD/W in mid-2012. The demand-supply dynamics for inverters were quite diff erent from the modules segment. In 2010, inverters were in short supply and the average delivery times were about 6 months. As a result, price of inverters increased during this period. However, 2011 saw an oversupply of inverters in the market and subsequently the price of inverters also dropped. The situation is expected to linger in 2012.
Unlike solar PV module segment where Chinese companies have more than 50 per cent of market share, there are very few Chinese suppliers of top tier inverters. According to IMS Research, Chinese companies accounted for less than 3 per cent of inverter revenues in 2010. Due to this situation, non-Chinese inverter companies have been making healthy profi ts. This also means that the inverter companies have the time and money to come up with technology improvements and cost reductions. Due to the dynamics mentioned above, it is expected that inverter prices will come down further in the next few years.
MaterialsOne of the major costs associated with a solar PV project are the mounting structures and electrical cables. While the mounting structures are made of galvanised steel or aluminium, electrical cables are made of either aluminium or copper. Cement concrete mixture is also used for mounting structures and for other civil works like foundations for control room, transformer stations and offi ce blocks. All the materials used above are commodities and are also used in other growth sectors like construction, heavy industries and several other industries. The demand from these sectors is tied to the macroeconomic conditions and as the global economy continues to slowly grow, the prices of these materials are expected to escalate over the next few years.
Table 1. Some of the major components of a PV system and their benchmark cost breakdown per MW as provided by CERC
Particulars 2010-11 2011-12 2012-13
PV Modules 9.15 8.33 4.94
Land Cost 0.05 0.15 0.16
Civil and General Works 0.90 0.95 0.90
Mounting Structures 0.80 1.05 1.00
Power Conditioning Units/Inverters
1.80 1.60 0.98
Evacuation Cost upto Inter-connection Point (cables and transformers)
0.85 0.90 1.00
Preliminary and Pre-operative Expenses Including IDC and Contingency
1.65 1.44 0.8
Total (crores/MW) 15.20 14.42 ~10 (9.78)
EvacuationMost of the materials/equipment used in solar PV projects are also used in other segments like wind and conventional power plants. Since these equipment are highly standardised, there is not enough room for price reductions. In fact, the prices are expected to go up in line with the general infl ation.
Civil and other worksCost of civil and other works (laying roads, earth moving, civil work for mounting structures, etc) has been relatively stable and have been increasing as per the general infl ation. There is a signifi cant labour component in the civil works and it is quite likely that the cost of the civil works will only go up, unless signifi cant amount of automation is adapted.
LandThe land cost is currently a very small percentage of the total project cost and naturally does not have a huge impact on the returns of the project. But land prices have seen big increases in places which have good solar irradiation. In the future, it is quite likely that availability of cheap land might become a challenge.
Pre-operative expensesThe pre-operative expenses include cost of contingency, insurance, project management costs and other similar expenses. With the increase in knowledge in solar power plant construction, the pre-operative expenses have been reducing quite signifi cantly. However, it is unlikely that the pre-operative expenses will go down further. It could either increase or remain stable.
ConclusionThe Solar PV capital costs have been reducing drastically over the last few years, thereby bringing solar closer to the traditional fuel sources. The increased aff ordability of solar has helped the penetration of this renewable energy source in almost every part of the world, including India. However, it is quite likely that the Solar PV capital cost has hit the bottom. Solar PV module prices are likely to remain stable at the current price levels for the medium term, while inverter prices could go down further. But the decrease in inverter prices will be negated by the increase in prices of other balance of system (BOS) components like steel, electrical equipment, cables and other services. However, a major technological breakthrough – increased effi ciencies of modules, inverter technology or other aspects of the system – has the potential to completely change this. So, we need to work towards developing solutions that are suited to Indian conditions. ❂The author is Founder and Director, RESolve Energy Consultants, Chennai. Email: [email protected]
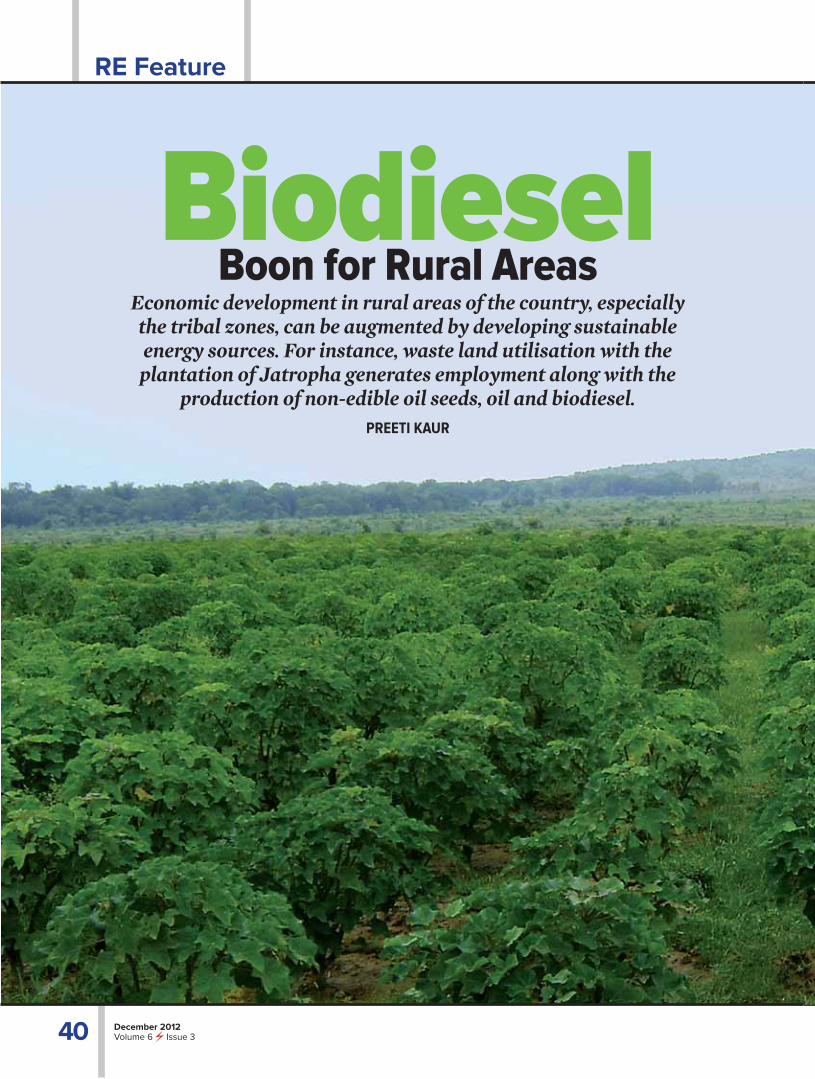
RE Feature
40 December 2012Volume 6 Issue 3
BiodieselBoon for Rural Areas
Economic development in rural areas of the country, especially the tribal zones, can be augmented by developing sustainable energy sources. For instance, waste land utilisation with the plantation of Jatropha generates employment along with the
production of non-edible oil seeds, oil and biodiesel. PREETI KAUR
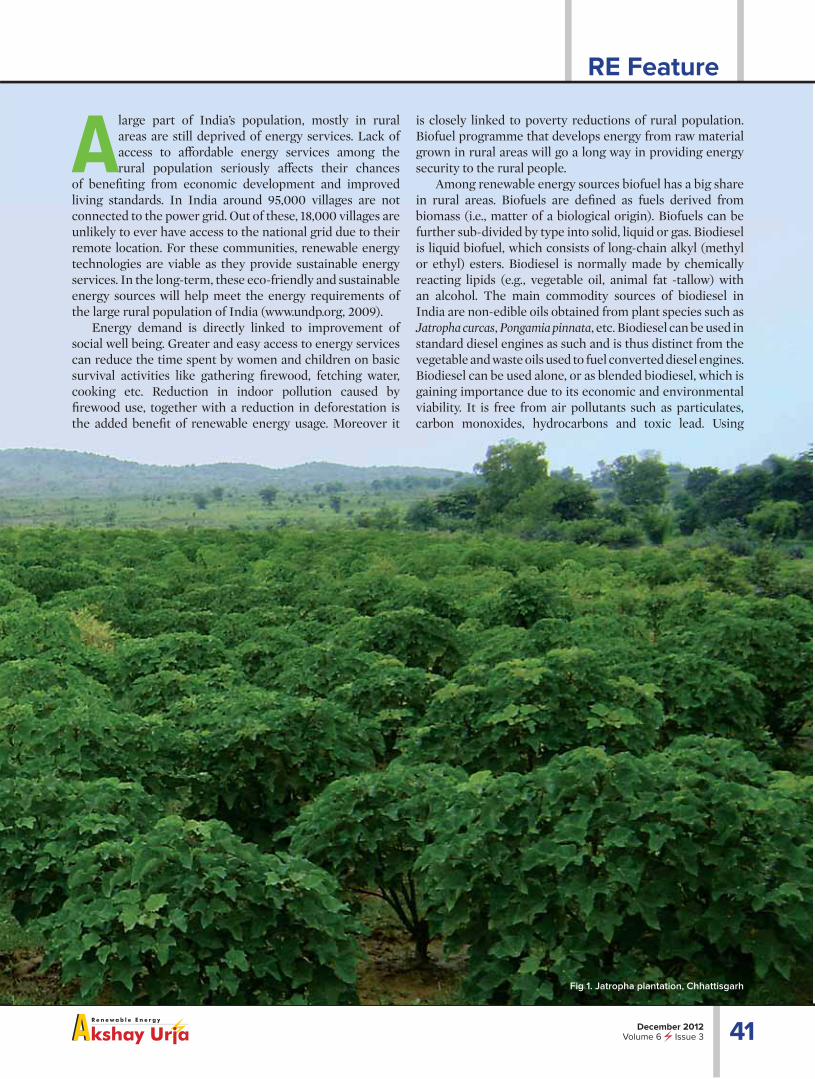
RE Feature
41December 2012Volume 6 Issue 3
A large part of India’s population, mostly in rural areas are still deprived of energy services. Lack of access to aff ordable energy services among the rural population seriously aff ects their chances
of benefi ting from economic development and improved living standards. In India around 95,000 villages are not connected to the power grid. Out of these, 18,000 villages are unlikely to ever have access to the national grid due to their remote location. For these communities, renewable energy technologies are viable as they provide sustainable energy services. In the long-term, these eco-friendly and sustainable energy sources will help meet the energy requirements of the large rural population of India (www.undp.org, 2009).
Energy demand is directly linked to improvement of social well being. Greater and easy access to energy services can reduce the time spent by women and children on basic survival activities like gathering fi rewood, fetching water, cooking etc. Reduction in indoor pollution caused by fi rewood use, together with a reduction in deforestation is the added benefi t of renewable energy usage. Moreover it
is closely linked to poverty reductions of rural population. Biofuel programme that develops energy from raw material grown in rural areas will go a long way in providing energy security to the rural people.
Among renewable energy sources biofuel has a big share in rural areas. Biofuels are defi ned as fuels derived from biomass (i.e., matter of a biological origin). Biofuels can be further sub-divided by type into solid, liquid or gas. Biodiesel is liquid biofuel, which consists of long-chain alkyl (methyl or ethyl) esters. Biodiesel is normally made by chemically reacting lipids (e.g., vegetable oil, animal fat -tallow) with an alcohol. The main commodity sources of biodiesel in India are non-edible oils obtained from plant species such as Jatropha curcas, Pongamia pinnata, etc. Biodiesel can be used in standard diesel engines as such and is thus distinct from the vegetable and waste oils used to fuel converted diesel engines. Biodiesel can be used alone, or as blended biodiesel, which is gaining importance due to its economic and environmental viability. It is free from air pollutants such as particulates, carbon monoxides, hydrocarbons and toxic lead. Using
Fig 1. Jatropha plantation, Chhattisgarh
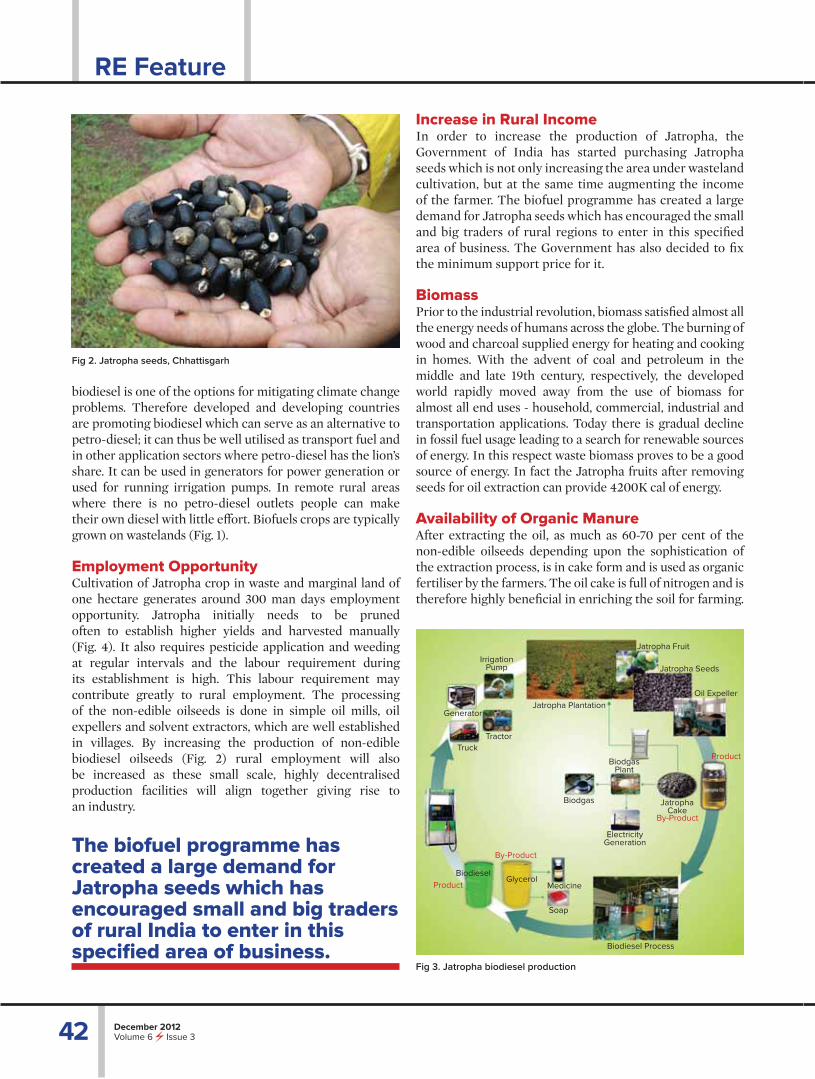
RE Feature
42 December 2012Volume 6 Issue 3
Increase in Rural Income In order to increase the production of Jatropha, the Government of India has started purchasing Jatropha seeds which is not only increasing the area under wasteland cultivation, but at the same time augmenting the income of the farmer. The biofuel programme has created a large demand for Jatropha seeds which has encouraged the small and big traders of rural regions to enter in this specifi ed area of business. The Government has also decided to fi x the minimum support price for it.
BiomassPrior to the industrial revolution, biomass satisfi ed almost all the energy needs of humans across the globe. The burning of wood and charcoal supplied energy for heating and cooking in homes. With the advent of coal and petroleum in the middle and late 19th century, respectively, the developed world rapidly moved away from the use of biomass for almost all end uses - household, commercial, industrial and transportation applications. Today there is gradual decline in fossil fuel usage leading to a search for renewable sources of energy. In this respect waste biomass proves to be a good source of energy. In fact the Jatropha fruits after removing seeds for oil extraction can provide 4200K cal of energy. Availability of Organic ManureAfter extracting the oil, as much as 60-70 per cent of the non-edible oilseeds depending upon the sophistication of the extraction process, is in cake form and is used as organic fertiliser by the farmers. The oil cake is full of nitrogen and is therefore highly benefi cial in enriching the soil for farming.
biodiesel is one of the options for mitigating climate change problems. Therefore developed and developing countries are promoting biodiesel which can serve as an alternative to petro-diesel; it can thus be well utilised as transport fuel and in other application sectors where petro-diesel has the lion’s share. It can be used in generators for power generation or used for running irrigation pumps. In remote rural areas where there is no petro-diesel outlets people can make their own diesel with little eff ort. Biofuels crops are typically grown on wastelands (Fig. 1).
Employment OpportunityCultivation of Jatropha crop in waste and marginal land of one hectare generates around 300 man days employment opportunity. Jatropha initially needs to be pruned often to establish higher yields and harvested manually(Fig. 4). It also requires pesticide application and weeding at regular intervals and the labour requirement during its establishment is high. This labour requirement may contribute greatly to rural employment. The processing of the non-edible oilseeds is done in simple oil mills, oil expellers and solvent extractors, which are well established in villages. By increasing the production of non-edible biodiesel oilseeds (Fig. 2) rural employment will also be increased as these small scale, highly decentralised production facilities will align together giving rise toan industry.
The biofuel programme has created a large demand for Jatropha seeds which has encouraged small and big traders of rural India to enter in this specifi ed area of business.
Fig 2. Jatropha seeds, Chhattisgarh
Fig 3. Jatropha biodiesel production
By-Product
By-Product
Product
Product
Biodiesel
BiodgasPlant
Biodgas
Biodiesel Process
Electricity Generation
JatrophaCake
Jatropha Plantation
Tractor
Truck
Generator
Irrigation Pump Jatropha Seeds
Jatropha Fruit
Oil Expeller
GlycerolMedicine
Soap
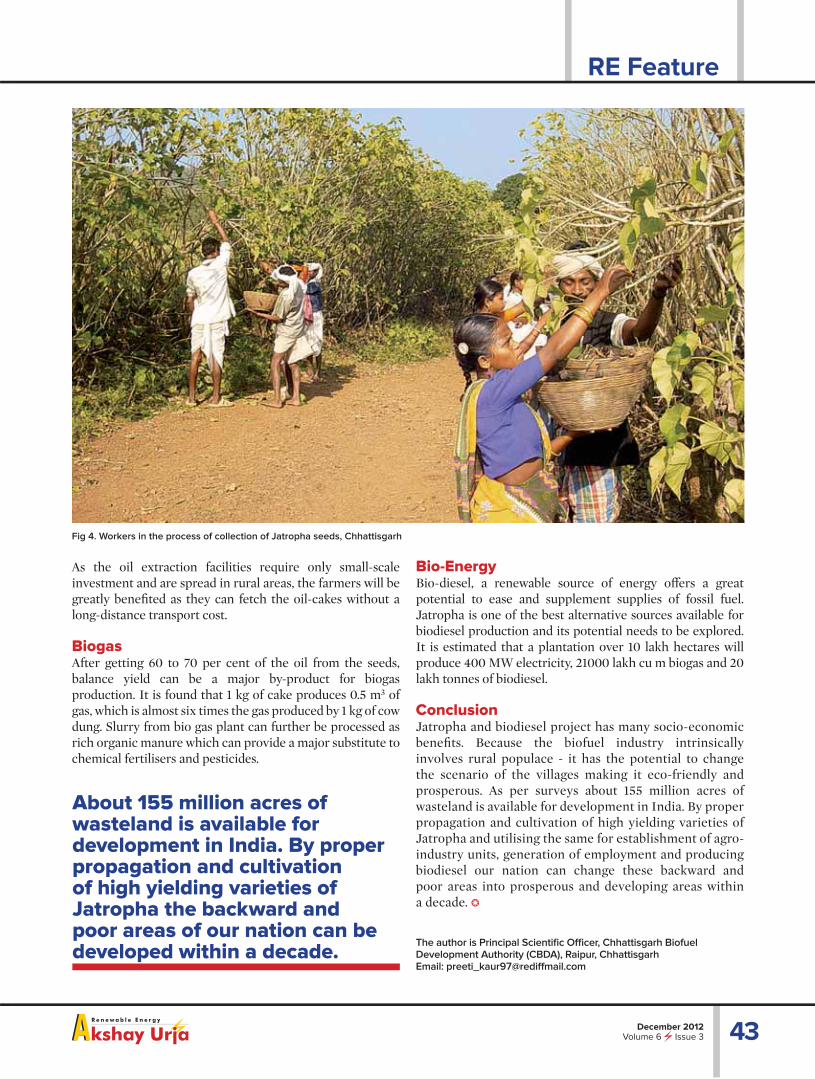
RE Feature
43December 2012Volume 6 Issue 3
As the oil extraction facilities require only small-scale investment and are spread in rural areas, the farmers will be greatly benefi ted as they can fetch the oil-cakes without a long-distance transport cost.
BiogasAfter getting 60 to 70 per cent of the oil from the seeds, balance yield can be a major by-product for biogas production. It is found that 1 kg of cake produces 0.5 m3 of gas, which is almost six times the gas produced by 1 kg of cow dung. Slurry from bio gas plant can further be processed as rich organic manure which can provide a major substitute to chemical fertilisers and pesticides.
Bio-Energy Bio-diesel, a renewable source of energy off ers a great potential to ease and supplement supplies of fossil fuel. Jatropha is one of the best alternative sources available for biodiesel production and its potential needs to be explored. It is estimated that a plantation over 10 lakh hectares will produce 400 MW electricity, 21000 lakh cu m biogas and 20 lakh tonnes of biodiesel.
ConclusionJatropha and biodiesel project has many socio-economic benefi ts. Because the biofuel industry intrinsically involves rural populace - it has the potential to change the scenario of the villages making it eco-friendly and prosperous. As per surveys about 155 million acres of wasteland is available for development in India. By proper propagation and cultivation of high yielding varieties of Jatropha and utilising the same for establishment of agro-industry units, generation of employment and producing biodiesel our nation can change these backward and poor areas into prosperous and developing areas within a decade. ❂
Fig 4. Workers in the process of collection of Jatropha seeds, Chhattisgarh
The author is Principal Scientifi c Offi cer, Chhattisgarh Biofuel Development Authority (CBDA), Raipur, ChhattisgarhEmail: preeti_kaur97@rediff mail.com
About 155 million acres of wasteland is available for development in India. By proper propagation and cultivation of high yielding varieties of Jatropha the backward and poor areas of our nation can be developed within a decade.
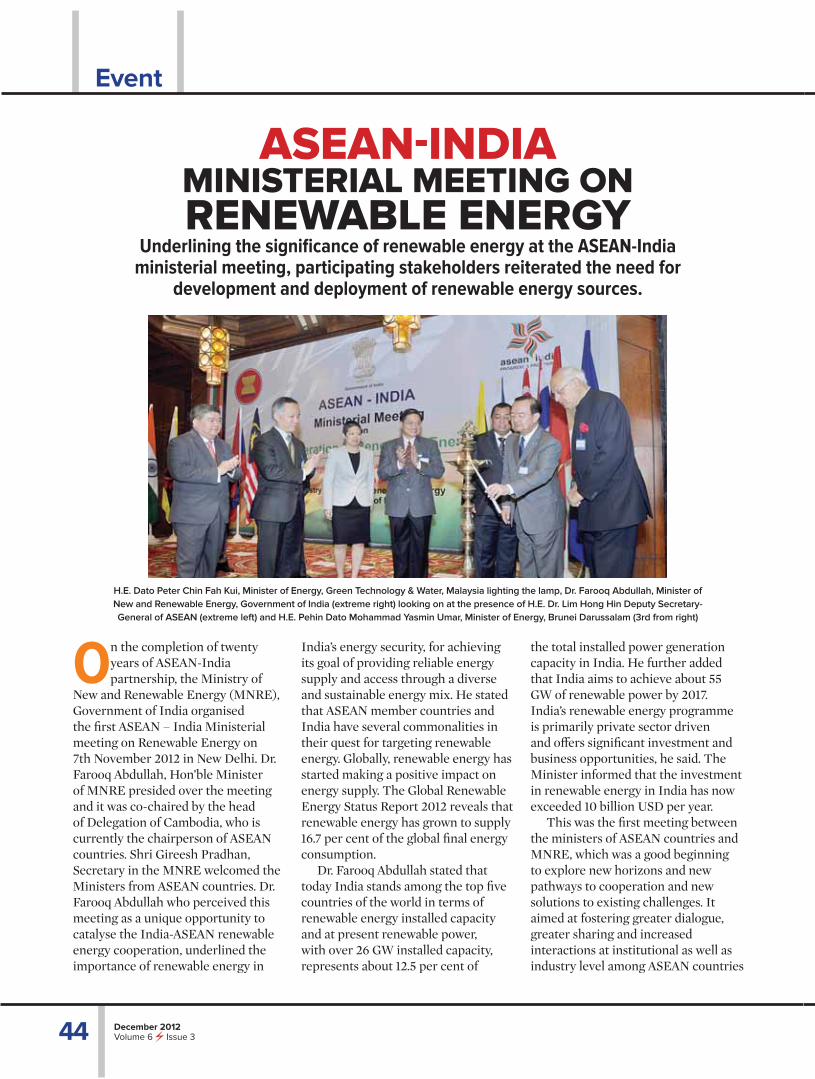
44 December 2012Volume 6 Issue 3
Event
H.E. Dato Peter Chin Fah Kui, Minister of Energy, Green Technology & Water, Malaysia lighting the lamp, Dr. Farooq Abdullah, Minister of New and Renewable Energy, Government of India (extreme right) looking on at the presence of H.E. Dr. Lim Hong Hin Deputy Secretary-General of ASEAN (extreme left) and H.E. Pehin Dato Mohammad Yasmin Umar, Minister of Energy, Brunei Darussalam (3rd from right)
Underlining the signifi cance of renewable energy at the ASEAN-India ministerial meeting, participating stakeholders reiterated the need for
development and deployment of renewable energy sources.
ASEAN-INDIAMINISTERIAL MEETING ON RENEWABLE ENERGY
On the completion of twenty years of ASEAN-India partnership, the Ministry of
New and Renewable Energy (MNRE), Government of India organised the fi rst ASEAN – India Ministerial meeting on Renewable Energy on 7th November 2012 in New Delhi. Dr. Farooq Abdullah, Hon’ble Minister of MNRE presided over the meeting and it was co-chaired by the head of Delegation of Cambodia, who is currently the chairperson of ASEAN countries. Shri Gireesh Pradhan, Secretary in the MNRE welcomed the Ministers from ASEAN countries. Dr. Farooq Abdullah who perceived this meeting as a unique opportunity to catalyse the India-ASEAN renewable energy cooperation, underlined the importance of renewable energy in
India’s energy security, for achieving its goal of providing reliable energy supply and access through a diverse and sustainable energy mix. He stated that ASEAN member countries and India have several commonalities in their quest for targeting renewable energy. Globally, renewable energy has started making a positive impact on energy supply. The Global Renewable Energy Status Report 2012 reveals that renewable energy has grown to supply 16.7 per cent of the global fi nal energy consumption.
Dr. Farooq Abdullah stated that today India stands among the top fi ve countries of the world in terms of renewable energy installed capacity and at present renewable power, with over 26 GW installed capacity, represents about 12.5 per cent of
the total installed power generation capacity in India. He further added that India aims to achieve about 55 GW of renewable power by 2017. India’s renewable energy programme is primarily private sector driven and off ers signifi cant investment and business opportunities, he said. The Minister informed that the investment in renewable energy in India has now exceeded 10 billion USD per year.
This was the fi rst meeting between the ministers of ASEAN countries and MNRE, which was a good beginning to explore new horizons and new pathways to cooperation and new solutions to existing challenges. It aimed at fostering greater dialogue, greater sharing and increased interactions at institutional as well as industry level among ASEAN countries

45December 2012Volume 6 Issue 3
Event
Dr. Farooq Abdullah (centre) Minister of New and Renewable Energy, Government of India along with other delegates of the ASEAN countries
Source: Ministry of New and Renewable Energy, Government of India.
and India. Dr. Abdullah, envisioned that every citizen of ASEAN-India region should have access to clean, reliable and aff ordable energy. Some of the main issues that came up during the discussion included fi nancing renewable energy, cooperation in research and development, technology transfer etc.
The meeting was attended by H. E. Pehin Dato Mohammad Yasmin Umar, Minister of Energy, Brunei Darussalam, H.E Dato Peter Chin Fah Kui, Minister of Energy, Green Technology and Water, Malaysia and H. E. Tran Quoc Khanh, Vice Minister of MOIT, Vietnam. Respective ambassadors and high commissioners headed the other delegations from various countries. The ministers of ASEAN member countries presented the current status of renewable energy utilisation in their respective country and all of them reiterated the need for augmenting renewable energy applications in view of ensuing needs and to curb green house gas emissions. Many delegates sought cooperation in solar, wind, biomass, small hydro
technologies including capacity building from India.
At the end the Chairman’s Statement on joint cooperation for renewable energy applications was adopted by the ministers and heads of delegations of ASEAN countries and India. Prior to this meeting, the MNRE organised an ‘ASEAN-India Workshop on Cooperation in Renewable Energy’ participated by experts and policy planners from ASEAN countries and India on 5-6 November 2012 at Vigyan Bhavan, New Delhi. Shri Gireesh Pradhan inaugurated the Workshop, which mainly focused on sharing of experience among participating countries on the development and deployment of renewable energy, and to identify the institutions for establishing long-term cooperation between institutions in India and ASEAN countries. The Workshop was attended by 17 participants from 8 ASEAN member countries with over 170 delegates from all over India and from diff erent streams of renewable energy. Over 30 experts made their
presentations on the subjects of wind, solar PV, solar thermal, bio-energy, renewable energy resource assessment techniques, off -grid applications and micro-grid for rural electrifi cation.
The major areas of cooperation that emerged during the workshop included experience sharing in renewable energy resource assessment using GIS and remote sensing technologies, sharing of renewable energy equipment calibration and testing facilities, protocol and evaluation methods, standards and certifi cation procedures, off -shore power supply and transmission technology utilising wind and ocean technologies, regional network on R&D on renewable energy technology facilitating sharing of best practices and lessons learnt, exchange of ideas for providing energy access to rural population through promotion of micro-grids/off -grids based on renewable technologies and sharing of experience in fi nancing of renewable energy projects. ❂
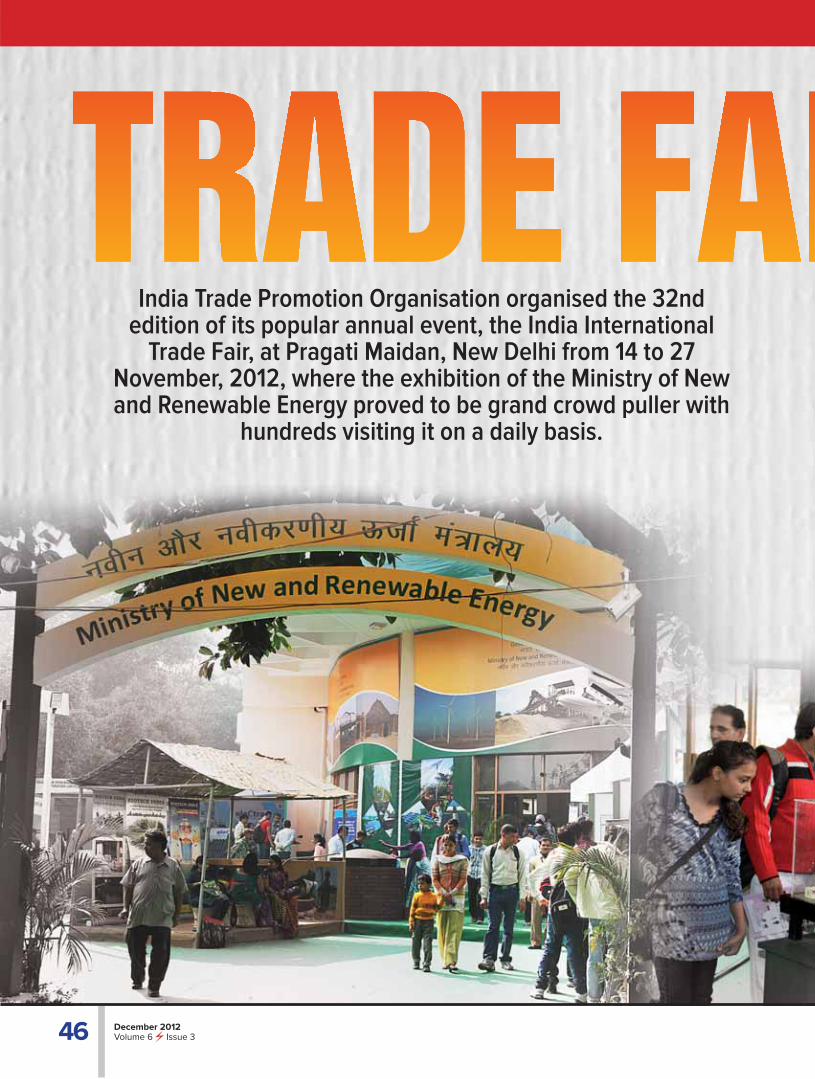
46 December 2012Volume 6 Issue 3
Event
India Trade Promotion Organisation organised the 32nd edition of its popular annual event, the India International
Trade Fair, at Pragati Maidan, New Delhi from 14 to 27 November, 2012, where the exhibition of the Ministry of New and Renewable Energy proved to be grand crowd puller with
hundreds visiting it on a daily basis.
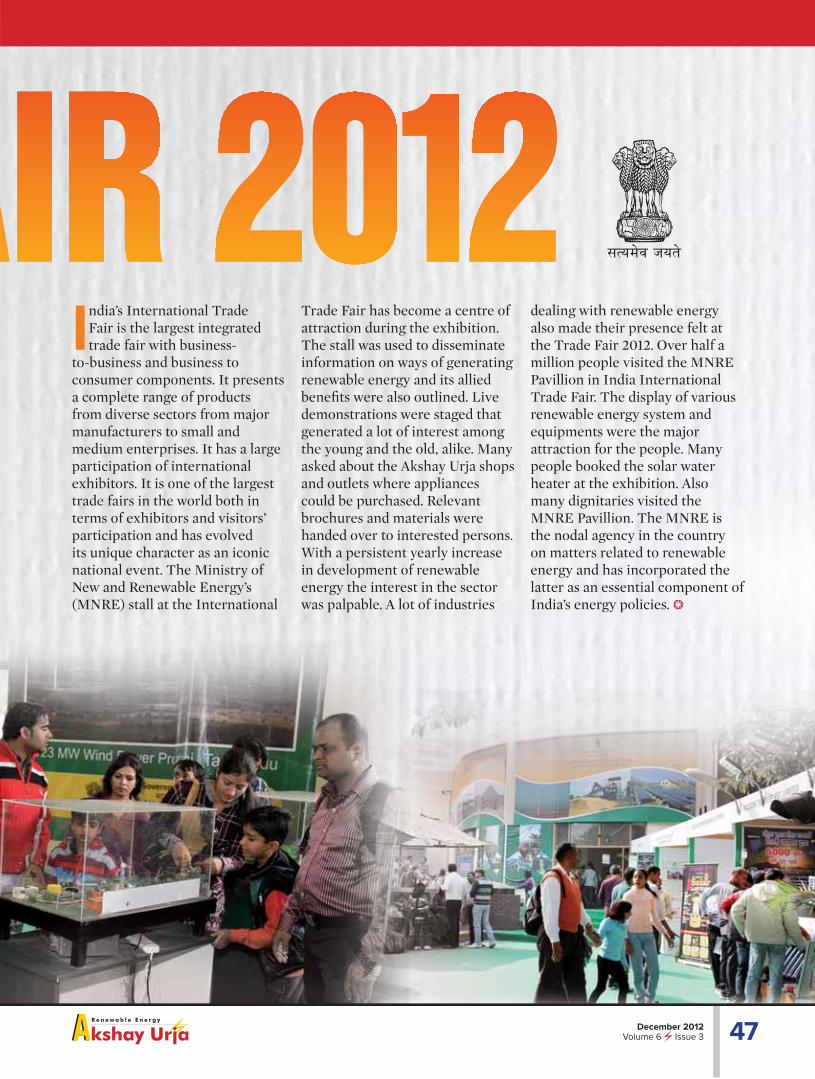
47December 2012Volume 6 Issue 3
Event
India’s International Trade Fair is the largest integrated trade fair with business-
to-business and business to consumer components. It presents a complete range of products from diverse sectors from major manufacturers to small and medium enterprises. It has a large participation of international exhibitors. It is one of the largest trade fairs in the world both in terms of exhibitors and visitors’ participation and has evolved its unique character as an iconic national event. The Ministry of New and Renewable Energy’s (MNRE) stall at the International
Trade Fair has become a centre of attraction during the exhibition. The stall was used to disseminate information on ways of generating renewable energy and its allied benefi ts were also outlined. Live demonstrations were staged that generated a lot of interest among the young and the old, alike. Many asked about the Akshay Urja shops and outlets where appliances could be purchased. Relevant brochures and materials were handed over to interested persons. With a persistent yearly increase in development of renewable energy the interest in the sector was palpable. A lot of industries
dealing with renewable energy also made their presence felt at the Trade Fair 2012. Over half a million people visited the MNRE Pavillion in India International Trade Fair. The display of various renewable energy system and equipments were the major attraction for the people. Many people booked the solar water heater at the exhibition. Also many dignitaries visited the MNRE Pavillion. The MNRE is the nodal agency in the country on matters related to renewable energy and has incorporated the latter as an essential component of India’s energy policies. ❂

48 December 2012Volume 6 Issue 3
Event
In an eff ort to minimise dependency on fossil fuels the Ministry of New and Renewable Energy organised a one day meet focusing on
enhancing solar energy for power generation needs.
A NATIONALMEET ON SOLAR CITIES
A day long ‘National Meet on Solar Cities’ was inaugurated by Shri Gireesh B Pradhan, Secretary,
Ministry of New and Renewable Energy (MNRE) on 22 November 2012, at India International Centre, Max Mueller Marg, New Delhi. In his address the Secretary urged the Municipal Corporations to enhance the use of renewable energy in their areas and save fossil fuel based energy. To achieve this, he added that building bye-laws could be amended suitably, to promote the solar water heaters, solar SPV rooftop systems, kitchen waste based plants in the various establishments of the city. Smt. Nisha Singh, Joint Secretary, Ministry of Urban Development, emphasised the need for the concerned Ministries to work in coordination with each other. Shri Tarun Kapoor, Joint Secretary, MNRE welcomed the participants and mentioned that the 28 master plans approved by MNRE have city specifi c innovative renewable contents/ projects along with the
energy effi ciency and green building strategies. The master plans have estimated that substantial amount of funds is required for achieving the goal. He suggested that the source of funding could be MNRE, local bodies, state govt., users, loan from banks/ fi nancial institutions etc. Dr. Arun K Tripathi, Director, MNRE presented an overview on development of solar cities programme and invited proposals on renewable energy applications from the solar cities.
About 150 participants were present in the day long event including representatives of municipal corporations, construction companies, fi nancial institutions, international agencies, manufacturing companies, investment institutions, technology companies and state nodal agencies, banks etc. The aim of this meet was to discuss the ‘way forward’ for the execution of renewable energy or energy effi ciency related projects in solar cities. The Municipal Commissioners of Thane, Shimla
and Mysore actively participated in the event. A panel discussion was held on the topic ‘Way forward for Implementation and Financing of Solar Cities’. Shri R. A. Rajeev, Municipal Commissioner, Thane, chaired the panel and Mr. Arunabha Ghosh moderated the discussion.
The Ministry is implementing a Scheme on ‘Development of Solar Cities’ which provides support to 60 cities to develop them as solar cities. So far, the Ministry has approved 41 cities for developing as solar cities. Four Cities viz. Gandhinagar, Nagpur, Chandigarh and Mysore are being developed as Model Solar Cities.
The fi nancial support upto Rs. 9.50 crore is provided for each Model Solar City and the equal amount is provided by the municipal corporation/city administration/state or any other resources including public private partnership for installation of renewable energy projects/system. Agartala, Rajkot, Shimla, Faridabad, Thane, Shirdi, Leh and Amritsar are being developed as Pilot Solar Cities. The fi nancial support upto Rs. 2.50 crores to be provided by MNRE to each Pilot Solar City and the equal amount will be given by the municipal corporation/city administration/state or any other resources including public private partnership for installation of renewable energy projects/systems. These solar cities have helped in motivating the municipal corporations to promote renewable energy projects and systems in their respected cities. ❂Source: Ministry of New and Renewable Energy.

Tech Update
49December 2012Volume 6 Issue 3
Self cleaning fabrics are based on very thin transparent coating of nano titanium dioxide particles on textile substrates such as cotton.
The Textile Department of
Indian Institute of Technology
(IIT), Delhi, has successfully
developed a self cleaning fabric by
mimicking the lotus leaf eff ect. Such
fabrics show superhydrophobicity
which is developed using deposition
of nanosilica particles and a fi ne
coating of low surface energy
textile water repellent fi nish. Dr
John Xin and Dr Walid Daoud
of the Hong Kong Polytechnic
University’s Nanotechnology
Centre for Functional and Intelligent
Textiles and Apparel developed and
reported this process for the fi rst
time in 2004.
The self cleaning fabrics
property is due to photocatalytic
properties imparted to the fabric
by 'anatase' nanocrystalline form
titanium dioxide (TiO2) nanoparticles
(about 20 nm in size). The coated
fabrics show discolouration of red
wine coff ee stains on irradiation of
coated cotton samples in a sun test
solar simulator.
The photocatalytic activity of
semiconductor oxides such as TiO2
is attributed to promotion of an
electron from the valance band to
the conduction band brought about
by the absorption of a photon of
ultra band gap (~3.2 eV) light whose
energy (hν) is greater than the energy
diff erence between electrons in the
valance and the conduction band.
When photons of sunlight hit the
layer of titanium dioxide nanoparticles
deposited on the cotton fabric,
electrons are excited up to the
conduction band and react with
oxygen molecules in the air
(Fig. 1). The double bond of the
oxygen molecule is broken and in
presence of oxygen and/or water,
super-oxide (O2-) and/or hydroxyl
(OH-) radicals are formed, which
attack adsorbed organic species such
as stains or dirt on the surfaces of
titanium dioxide nanoparticles layers
deposited on the cotton fabric and
decompose them. The nano titania/
nano zinc oxide coating on fabrics
is also a promising process for use
as an antibacterial and UV blocking
agent in the textile industry. ❂
FABRIC CLEANED BY THE SUN
Courtesy, Dr. Mangala Joshi, Professor, Department of Textile Technology, IIT Delhi, India. Email: [email protected]
Fig 1. Self cleaning mechanism of cotton fabric with titanium dioxide nanoparticles
e-
Oxygen molecule
is oxidised
Unpaired electron
Photons
of light
Titanium dioxide
coating
Freed
electronFabric Dirt molecules

Web/Book Alert
December 2012Volume 6 Issue 350
Renewable Energy :The FactsBy: Walter Witzel and Dieter Seifried Paper Back: 256 PagesCost: 39.95 USD Publisher: Routledge
(October 17, 2012)Email : [email protected]: 1849711607ISBN-13: 978-1849711609
Renewable Energy DesalinationBy: Bekele Debele Negewo Paperback: 232 pages, Cost: 25.00 USDPublisher: World Bank
Publications (September 26, 2012)Email : [email protected]: 082138838XISBN-13: 978-0821388389
Renewable Energy Applications for Freshwater ProductionBy: Jochen Bundschuh, Jan Hoinkis Hardcover: 286 pages Cost: 119.95 USD
Publisher: CRC Press; (July 2, 2012)Email : [email protected] 10: 0415620899ISBN-13: 978-0415620895
website
Renewable Energy Policy Convergence in the EUBy: David Jacobs Hardcover: 294 PagesCost: 99.95 USD Publisher: Ashgate
Pub Co (July 28, 2012) Email : [email protected]: 1409439097 ISBN-13: 978-1409439097
Nanophysics of Solar and Renewable EnergyBy: Edward L. Wolf Hardcover: 270 pagesCost: 50.71 USD Publisher: Wiley VCH
(19 Sep 2012)Email : [email protected]: 10: 3527410465ISBN-13: 13: 978-3527410460
100 Per Cent Renewable: Energy Autonomy in ActionBy: Peter DroegeHardcover: 352 pagesCost: 56.00 USDPublisher: Routledge
(October 16, 2012)Email Id: [email protected]: 1844077187ISBN-13: 978-1844077182
Transmission Expansion for Renewable Energy Scale-Up : Emerging Lessons and RecommendationsBy: Marcelino Madrigal, Steven StoftPaper Back: 168 Pgs., Cost: 25.95 USD Publisher: World Bank PublicationsYear : July 6, 2012Email: [email protected]: 082139598XISBN-13: 978-0821395981
This report reviews emerging approaches being undertaken by transmission
utilities and regulators to cope with the challenges of expanding transmission for renewable energy scale-up. Proactive planning and regulating transmission networks are emerging as the
premier approach to ensure that transmission networks are expanded effi ciently and eff ectively. Linking planning with clear and stable cost-recovery regulation can also help bringing the private sector to complement the considerable investment needs in transmission.
NJ Clean Energy Programmewww.njcleanenergy.comNew Jersey’s Clean Energy
Programme (NJCEP) promotes
increased energy effi ciency and
the use of clean, renewable
sources of energy including solar,
wind, geothermal, and sustainable
biomass. NJCEP off ers fi nancial
incentives, programmes, and
services for residential,
commercial, and municipal
customers.
The Clean Revolutionthecleanrevolution.orgThe Clean Revolution is a
partnership of international
statesmen and governments,
business leaders and corporations,
thinkers and opinion formers.
It is coordinated by The Climate
Group. It calls for a swift, massive
scale-up of clean energy and
infrastructure and of smart
technologies and design. They
believe that this is the only feasible
path to a smarter, better, more
prosperous future. The initiative
aims to create a tipping point for
change by inspiring government
and business leaders. It presents
them with the evidence of the
economic opportunities of the
Clean Revolution and profi les how
innovative leadership is already
transforming policies and markets
around the world.
Calco Greenwww.calcogreen.comCalcoGreen is a renewable energy
and energy effi ciency solutions
company focused on providing
shared energy savings for energy
effi ciency projects, short term
bridge funding, and fi nance
consulting to clean energy
developers, capital sources,
contractors, engineers,
manufacturers, companies, and
organisations, that subscribe to the
CalcoGreenEdge service.

Forthcoming Events
51December 2012Volume 6 Issue 3
NA
TIO
NA
L IN
TER
NA
TIO
NA
L
International Conference on Energy Resources and Technologies for Sustainable
Development (ICERTSD 2013), Place: Howrah, West Bengal, India, Organiser: Dept.
of Mechanical Engineering: Bengal Engineering and Science University, Shibpur,
Contact: Dr. Sudip Ghosh, 91 33 2668 4561-63, Website: www.icertsd.org
WINDPRO - 4th International Wind Conference and Exhibition, Place: CODISSIA
Trade Fair Complex, Coimbatore Organiser: Indian Wind Power Association,
Contact: 044- 45504035, [email protected], [email protected],
Website: www.windpro.org
Water Management in India 2013, Place: New Delhi, Organiser: IBK Media
Contact: Ajay Kumar, Email: [email protected], 9702293599,
022- 25006681 Website: www.ibkmedia.com
International Conference on Information and Engineering Sciences - 2013 (ICIES
-2013), Place: Vijayawada, Andhra Pradesh, India , Organiser: International
Multidisciplinary Research Foundation, Contact: Dr. D.B Ratnakar, Email: dbratnakar@
imrf.in, Website: www.imrf.in
International Conference on Electrical and Electronics Engineering (ICEEE),
Place: Hyderabad, India, Organiser: IRNet INDIA, Contact: 040 - 66515151,
E-mail : [email protected], Website: www.interscience.ac.in
2nd Reed as a Renewable Resource: International Conference on the Utilization of
Wetland Plants, Place: Greifswald, Germany, Organiser: University of Greifswald,
Contact: +49 (0)3834 86 4137, [email protected], Website: www.rrr2013.de
2nd Annual International Conference on Sustainable Energy and Environmental
Sciences, Place: Singapore, Organiser: Global Science and Technology Forum,
Contact: +65 6327 0166 or [email protected],
Website: www.env-energy.org
Deeper Water Off shore Wind, Place: London, United Kingdom,
Organiser: Global Insight Conferences, Contact: +44 (0)20 7953 4016 or info@
off shorewindconference.com, Website: www.off shorewindconference.com
International Renewable and Sustainable Energy Conference,
Place: Ouarzazate, Morocco, Organiser: Mediterranean Space of Technology and
Innovation, Morrocan Agency for Solar Energy, Polydisciplinary Faculty Ouarzazate
Contact: Youssef Zaz +212-(0)-662 102 167 or [email protected]
Website: www.med-space.org/irsec
7 - 9February 2013
10 - 12February 2013
13February 2013
21 – 23 February 2013
3March 2013
14 - 16February 2013
25 - 26 February 2013
6 - 7March 2013
7 - 9 March 2013
In India
In Other Countries

December 2012Volume 6 Issue 352
RE Statistics
kW= kilowatt; MW = megawatt; Sq m = square metre
Renewable Energyat a Glance
Cumulative deployment of various renewable energy projects/systems/devices in India
Renewable Energy Programme/ Systems
Cumulative Achievements (as on 31 December 2012)
I. Power from Renewables In MW
A. Grid interactive power
Wind Power 18420.40
Small Hydro Power 3464.59
Biomass Power 1248.60
Bagasse Cogeneration 2239.63
Waste to Power (Urban and Industrial) 96.08
Solar Power (SPV) 1176.25
Sub total (A) 26677.10
B. Off grid/captive power
Waste to energy 113.60
Biomass (Non-Bagasse) Cogeneration 426.04
Biomass Gasifier (Rural and Industrial) 155.596
Aero-Generators/Hybrid Systems 1.74
SPV Systems (>1 kW) 106.33
Water Mills/Micro Hydel 2121 nos.
Sub total (B) 803.306
Total (A+B) 27480.40
II. Remote Village Electrifi cation (villages/hamlets)
III. Other renewable energy systems
Family Type Biogas Plants (in lakh) 45.86
Solar Water Heating Systems - Collector Area (million sq m) 6.17


RN
I No. D
ELE
NG
/2007/22701