ttr500 series vector network analyzer specifications and...
TRANSCRIPT

x
TTR500 SeriesVector Network AnalyzerSpecifications and Performance VerificationZZZ
Technical Reference Manual
*P077125500*
077-1255-00


TTR500 SeriesVector Network AnalyzerSpecifications and Performance VerificationZZZ
Technical Reference Manual
xx
www.tek.com
077-1255-00

Copyright © Tektronix. All rights reserved. Licensed software products are owned by Tektronix or its subsidiaries or suppliers, and areprotected by national copyright laws and international treaty provisions.
Tektronix products are covered by U.S. and foreign patents, issued and pending. Information in this publication supersedes that in allpreviously published material. Specifications and price change privileges reserved.
TEKTRONIX and TEK are registered trademarks of Tektronix, Inc.
VectorVu-PC is a trademark of Tektronix, Inc.
Contacting Tektronix
Tektronix, Inc.14150 SW Karl Braun DriveP.O. Box 500Beaverton, OR 97077USA
For product information, sales, service, and technical support:In North America, call 1-800-833-9200.Worldwide, visit www.tek.com to find contacts in your area.

Table of Contents
Table of Contents
Important safety information . . . . . . . . . . . . . . . . . . . . . . . . . . . . . . . . . . . . . . . . . . . . . . . . . . . . . . . . . . . . . . . . . . . . . . . . . . . . . . . . . . . . . . . . . . . . . . . . . . . . . . . . . . iii
General safety summary. . . . . . . . . . . . . . . . . . . . . . . . . . . . . . . . . . . . . . . . . . . . . . . . . . . . . . . . . . . . . . . . . . . . . . . . . . . . . . . . . . . . . . . . . . . . . . . . . . . . . . . . . iii
Service safety summary . . . . . . . . . . . . . . . . . . . . . . . . . . . . . . . . . . . . . . . . . . . . . . . . . . . . . . . . . . . . . . . . . . . . . . . . . . . . . . . . . . . . . . . . . . . . . . . . . . . . . . . . . iv
Terms in this manual . . . . . . . . . . . . . . . . . . . . . . . . . . . . . . . . . . . . . . . . . . . . . . . . . . . . . . . . . . . . . . . . . . . . . . . . . . . . . . . . . . . . . . . . . . . . . . . . . . . . . . . . . . . . . v
Terms and symbols on the product . . . . . . . . . . . . . . . . . . . . . . . . . . . . . . . . . . . . . . . . . . . . . . . . . . . . . . . . . . . . . . . . . . . . . . . . . . . . . . . . . . . . . . . . . . . . . . v
Preface . . . . . . . . . . . . . . . . . . . . . . . . . . . . . . . . . . . . . . . . . . . . . . . . . . . . . . . . . . . . . . . . . . . . . . . . . . . . . . . . . . . . . . . . . . . . . . . . . . . . . . . . . . . . . . . . . . . . . . . . . . . . . . . . . vi
Documentation . . . . . . . . . . . . . . . . . . . . . . . . . . . . . . . . . . . . . . . . . . . . . . . . . . . . . . . . . . . . . . . . . . . . . . . . . . . . . . . . . . . . . . . . . . . . . . . . . . . . . . . . . . . . . . . . . . . vi
Specifications . . . . . . . . . . . . . . . . . . . . . . . . . . . . . . . . . . . . . . . . . . . . . . . . . . . . . . . . . . . . . . . . . . . . . . . . . . . . . . . . . . . . . . . . . . . . . . . . . . . . . . . . . . . . . . . . . . . . . . . . . . 1
Frequency . . . . . . . . . . . . . . . . . . . . . . . . . . . . . . . . . . . . . . . . . . . . . . . . . . . . . . . . . . . . . . . . . . . . . . . . . . . . . . . . . . . . . . . . . . . . . . . . . . . . . . . . . . . . . . . . . . . . . . . . 2
Measurement bandwidth. . . . . . . . . . . . . . . . . . . . . . . . . . . . . . . . . . . . . . . . . . . . . . . . . . . . . . . . . . . . . . . . . . . . . . . . . . . . . . . . . . . . . . . . . . . . . . . . . . . . . . . . . 2
Sweep . . . . . . . . . . . . . . . . . . . . . . . . . . . . . . . . . . . . . . . . . . . . . . . . . . . . . . . . . . . . . . . . . . . . . . . . . . . . . . . . . . . . . . . . . . . . . . . . . . . . . . . . . . . . . . . . . . . . . . . . . . . . 2
Test port levels . . . . . . . . . . . . . . . . . . . . . . . . . . . . . . . . . . . . . . . . . . . . . . . . . . . . . . . . . . . . . . . . . . . . . . . . . . . . . . . . . . . . . . . . . . . . . . . . . . . . . . . . . . . . . . . . . . . 3
Dynamic range . . . . . . . . . . . . . . . . . . . . . . . . . . . . . . . . . . . . . . . . . . . . . . . . . . . . . . . . . . . . . . . . . . . . . . . . . . . . . . . . . . . . . . . . . . . . . . . . . . . . . . . . . . . . . . . . . . . 4
Signal flow parameters. . . . . . . . . . . . . . . . . . . . . . . . . . . . . . . . . . . . . . . . . . . . . . . . . . . . . . . . . . . . . . . . . . . . . . . . . . . . . . . . . . . . . . . . . . . . . . . . . . . . . . . . . . . 8
Reference frequency. . . . . . . . . . . . . . . . . . . . . . . . . . . . . . . . . . . . . . . . . . . . . . . . . . . . . . . . . . . . . . . . . . . . . . . . . . . . . . . . . . . . . . . . . . . . . . . . . . . . . . . . . . . . 10
Trigger . . . . . . . . . . . . . . . . . . . . . . . . . . . . . . . . . . . . . . . . . . . . . . . . . . . . . . . . . . . . . . . . . . . . . . . . . . . . . . . . . . . . . . . . . . . . . . . . . . . . . . . . . . . . . . . . . . . . . . . . . . . 10
Interfaces, input, and output ports. . . . . . . . . . . . . . . . . . . . . . . . . . . . . . . . . . . . . . . . . . . . . . . . . . . . . . . . . . . . . . . . . . . . . . . . . . . . . . . . . . . . . . . . . . . . . . 11
Power supply system . . . . . . . . . . . . . . . . . . . . . . . . . . . . . . . . . . . . . . . . . . . . . . . . . . . . . . . . . . . . . . . . . . . . . . . . . . . . . . . . . . . . . . . . . . . . . . . . . . . . . . . . . . . 12
Host processor . . . . . . . . . . . . . . . . . . . . . . . . . . . . . . . . . . . . . . . . . . . . . . . . . . . . . . . . . . . . . . . . . . . . . . . . . . . . . . . . . . . . . . . . . . . . . . . . . . . . . . . . . . . . . . . . . . 13
Mechanical characteristics. . . . . . . . . . . . . . . . . . . . . . . . . . . . . . . . . . . . . . . . . . . . . . . . . . . . . . . . . . . . . . . . . . . . . . . . . . . . . . . . . . . . . . . . . . . . . . . . . . . . . . 13
Environmental performance . . . . . . . . . . . . . . . . . . . . . . . . . . . . . . . . . . . . . . . . . . . . . . . . . . . . . . . . . . . . . . . . . . . . . . . . . . . . . . . . . . . . . . . . . . . . . . . . . . . . 14
Performance verification. . . . . . . . . . . . . . . . . . . . . . . . . . . . . . . . . . . . . . . . . . . . . . . . . . . . . . . . . . . . . . . . . . . . . . . . . . . . . . . . . . . . . . . . . . . . . . . . . . . . . . . . . . . . . . 15
Prerequisites . . . . . . . . . . . . . . . . . . . . . . . . . . . . . . . . . . . . . . . . . . . . . . . . . . . . . . . . . . . . . . . . . . . . . . . . . . . . . . . . . . . . . . . . . . . . . . . . . . . . . . . . . . . . . . . . . . . . 15
Required equipment . . . . . . . . . . . . . . . . . . . . . . . . . . . . . . . . . . . . . . . . . . . . . . . . . . . . . . . . . . . . . . . . . . . . . . . . . . . . . . . . . . . . . . . . . . . . . . . . . . . . . . . . . . . . 16
Preliminary checks . . . . . . . . . . . . . . . . . . . . . . . . . . . . . . . . . . . . . . . . . . . . . . . . . . . . . . . . . . . . . . . . . . . . . . . . . . . . . . . . . . . . . . . . . . . . . . . . . . . . . . . . . . . . . . 17
Performance verification procedures . . . . . . . . . . . . . . . . . . . . . . . . . . . . . . . . . . . . . . . . . . . . . . . . . . . . . . . . . . . . . . . . . . . . . . . . . . . . . . . . . . . . . . . . . . . 18
Internal reference frequency accuracy over the calibration period . . . . . . . . . . . . . . . . . . . . . . . . . . . . . . . . . . . . . . . . . . . . . . . . . . . . . . 18
Frequency reference output level . . . . . . . . . . . . . . . . . . . . . . . . . . . . . . . . . . . . . . . . . . . . . . . . . . . . . . . . . . . . . . . . . . . . . . . . . . . . . . . . . . . . . . . . . 20
Maximum output power and output power level accuracy . . . . . . . . . . . . . . . . . . . . . . . . . . . . . . . . . . . . . . . . . . . . . . . . . . . . . . . . . . . . . . . 21
Test port noise floor. . . . . . . . . . . . . . . . . . . . . . . . . . . . . . . . . . . . . . . . . . . . . . . . . . . . . . . . . . . . . . . . . . . . . . . . . . . . . . . . . . . . . . . . . . . . . . . . . . . . . . . . 25
Dynamic range. . . . . . . . . . . . . . . . . . . . . . . . . . . . . . . . . . . . . . . . . . . . . . . . . . . . . . . . . . . . . . . . . . . . . . . . . . . . . . . . . . . . . . . . . . . . . . . . . . . . . . . . . . . . . 28
Dynamic accuracy . . . . . . . . . . . . . . . . . . . . . . . . . . . . . . . . . . . . . . . . . . . . . . . . . . . . . . . . . . . . . . . . . . . . . . . . . . . . . . . . . . . . . . . . . . . . . . . . . . . . . . . . . 30
Uncorrected signal flow parameters (User correction OFF, Factory correction ON). . . . . . . . . . . . . . . . . . . . . . . . . . . . . . . . . . . . 35
Test record. . . . . . . . . . . . . . . . . . . . . . . . . . . . . . . . . . . . . . . . . . . . . . . . . . . . . . . . . . . . . . . . . . . . . . . . . . . . . . . . . . . . . . . . . . . . . . . . . . . . . . . . . . . . . . . . . . . . . . . 41
TTR500 Specifications and Performance Verification i

Table of Contents
ii TTR500 Specifications and Performance Verification

Important safety information
Important safety information
This manual contains information and warnings that must be followed by the user for safe operation and to keep theproduct in a safe condition.
To safely perform service on this product, additional information is provided at the end of this section. (See page iv,Service safety summary.)
General safety summaryUse the product only as specified. Review the following safety precautions to avoid injury and prevent damage to this productor any products connected to it. Carefully read all instructions. Retain these instructions for future reference.
Comply with local and national safety codes.
For correct and safe operation of the product, it is essential that you follow generally accepted safety procedures in additionto the safety precautions specified in this manual.
The product is designed to be used by trained personnel only.
Only qualified personnel who are aware of the hazards involved should remove the cover for repair, maintenance, oradjustment.
This product is not intended for detection of hazardous voltages.
While using this product, you may need to access other parts of a larger system. Read the safety sections of the othercomponent manuals for warnings and cautions related to operating the system.
When incorporating this equipment into a system, the safety of that system is the responsibility of the assembler of the system.
To avoid fire or personal injury
Connect and disconnect properly. Do not connect or disconnect probes or test leads while they are connectedto a voltage source.
Use only insulated voltage probes, test leads, and adapters supplied with the product, or indicated by Tektronix to besuitable for the product.
Observe all terminal ratings. To avoid fire or shock hazard, observe all ratings and markings on the product. Consultthe product manual for further ratings information before making connections to the product.
Do not apply a potential to any terminal, including the common terminal, that exceeds the maximum rating of that terminal.
The measuring terminals on this product are not rated for connection to mains or Category II, III, or IV circuits.
Do not operate without covers. Do not operate this product with covers or panels removed, or with the case open.
Avoid exposed circuitry. Do not touch exposed connections and components when power is present.
Do not operate with suspected failures. If you suspect that there is damage to this product, have it inspected byqualified service personnel.
Disable the product if it is damaged. Do not use the product if it is damaged or operates incorrectly. If in doubt about safety ofthe product, turn it off and disconnect the power. Clearly mark the product to prevent its further operation.
TTR500 Specifications and Performance Verification iii

Important safety information
Examine the exterior of the product before you use it. Look for cracks or missing pieces.
Use only specified replacement parts.
Do not operate in wet/damp conditions. Be aware that condensation may occur if a unit is moved from a cold to awarm environment.
Do not operate in an explosive atmosphere.
Keep product surfaces clean and dry. Remove the input signals before you clean the product.
Provide proper ventilation. Refer to the installation instructions in the manual for details on installing the productso it has proper ventilation.
Provide a safe working environment. Avoid improper or prolonged use of keyboards, pointers, and button pads.Improper or prolonged keyboard or pointer use may result in serious injury.
Be sure your work area meets applicable ergonomic standards. Consult with an ergonomics professional to avoid stressinjuries.
Use only the Tektronix rackmount hardware specified for this product.
Service safety summaryThe Service safety summary section contains additional information required to safely perform service on the product. Onlyqualified personnel should perform service procedures. Read this Service safety summary and the General safety summarybefore performing any service procedures.
To avoid electric shock. Do not touch exposed connections.
Do not service alone. Do not perform internal service or adjustments of this product unless another person capable ofrendering first aid and resuscitation is present.
Disconnect power. To avoid electric shock, disconnect the USB 3.0 cable from the instrument before removing anycovers or panels, or opening the case for servicing.
Use care when servicing with power on. Disconnect power, remove battery (if applicable), and disconnect test leadsbefore removing protective panels, soldering, or replacing components.
iv TTR500 Specifications and Performance Verification

Important safety information
Terms in this manualThese terms may appear in this manual:
WARNING. Warning statements identify conditions or practices that could result in injury or loss of life.
CAUTION. Caution statements identify conditions or practices that could result in damage to this product or other property.
Terms and symbols on the productThese terms may appear on the product:
DANGER indicates an injury hazard immediately accessible as you read the marking.
WARNING indicates an injury hazard not immediately accessible as you read the marking.
CAUTION indicates a hazard to property including the product.
When this symbol is marked on the product, be sure to consult the manual to find out the nature of thepotential hazards and any actions which have to be taken to avoid them. (This symbol may also be used torefer the user to ratings in the manual.)
The following symbol(s) may appear on the product:
TTR500 Specifications and Performance Verification v

Preface
Preface
Verify the software version
The VectorVu-PC software version must be version 1.0 or greater.
Purpose
This manual lists the electrical, mechanical, and environmental specifications, and the certification and compliancestatements for the Tektronix TTR500 Vector Network Analyzer (VNA). Also provided are procedures for verifying theperformance of the instrument.
DocumentationThis table lists some of the documentation that is available for the TTR500 series products.
Product documentation
Document Purpose Location
Installation and Safety Instructions Provides software and hardwareinstallation instructions andassociated safety warnings
Printed format ships with product. PDFavailable on the product flash drive and atwww.tek.com/manuals.
Specifications and PerformanceVerification (this manual)
Provides specifications andperformance verificationprocedures for checkinginstrument performance
PDF available at www.tek.com/manuals.
Help (User manual) Provides operating informationabout the hardware and software
Available as a help file in VectorVu-PC applica-tion and in PDF at www.tek.com/manuals.
API Programmer manual Information on commands usedto control the instrument throughan API
PDF available at www.tek.com/manuals.
vi TTR500 Specifications and Performance Verification

Specifications
Specifications
All specifications are guaranteed unless labeled Typical. Typical specifications are provided for your convenience.
NOTE. Warranted characteristics that are checked in the Performance Verification are marked with a symbol.
The performance limits in this specification are valid for the following conditions:
The VectorVu-PC software version is 1.0 or greater.
You operate the instrument in an environment that meets the temperature, altitude, and humidity characteristics listed inthese specifications.
You allow the instrument to warm up sufficiently (> 30 minutes). To do this, connect the instrument to a PC and startthe VectorVu-PC application. The application must be continuously acquiring data for at least 30 minutes. Once theinstrument has warmed up, the thermometer indicator in the instrument status bar changes from yellow to green.
NOTE. The TTR500 does not fully power on until VectorVu-PC has established communication with the TTR500 and isacquiring data.
For small signal S-parameters, the instrument must have been calibrated using the recommended precision calibrationkit at an ambient temperature within ±1°C of the current ambient temperature.
All specifications are valid in the temperature range of 18°C to 28°C unless specified otherwise.
TTR500 Specifications and Performance Verification 1

Specifications
FrequencyFrequency range 100 kHz to 6.0 GHz
Measurement bandwidthEffective IF bandwidth 1 Hz to 500 kHz
SweepConfigurable sweep parameters Sweep time, sweep delay and number of points are configurable.
Sweep Delay is the time from end of last frequency point to start of first point ofnext sweep You can specify sweep delay sequentially—e.g. (Start, Stop, N), or(Start, Stop, Step).
Sweep Delay: 0 sec (Min) to 1.0 sec (Max)
Number of points: 1 to 20001 (host memory limited)
Up to 16 channels
Up to 16 displays
Up to 16 traces, and 9 markers/trace
Sweep type Linear
Logarithmic
2 TTR500 Specifications and Performance Verification
Specifications
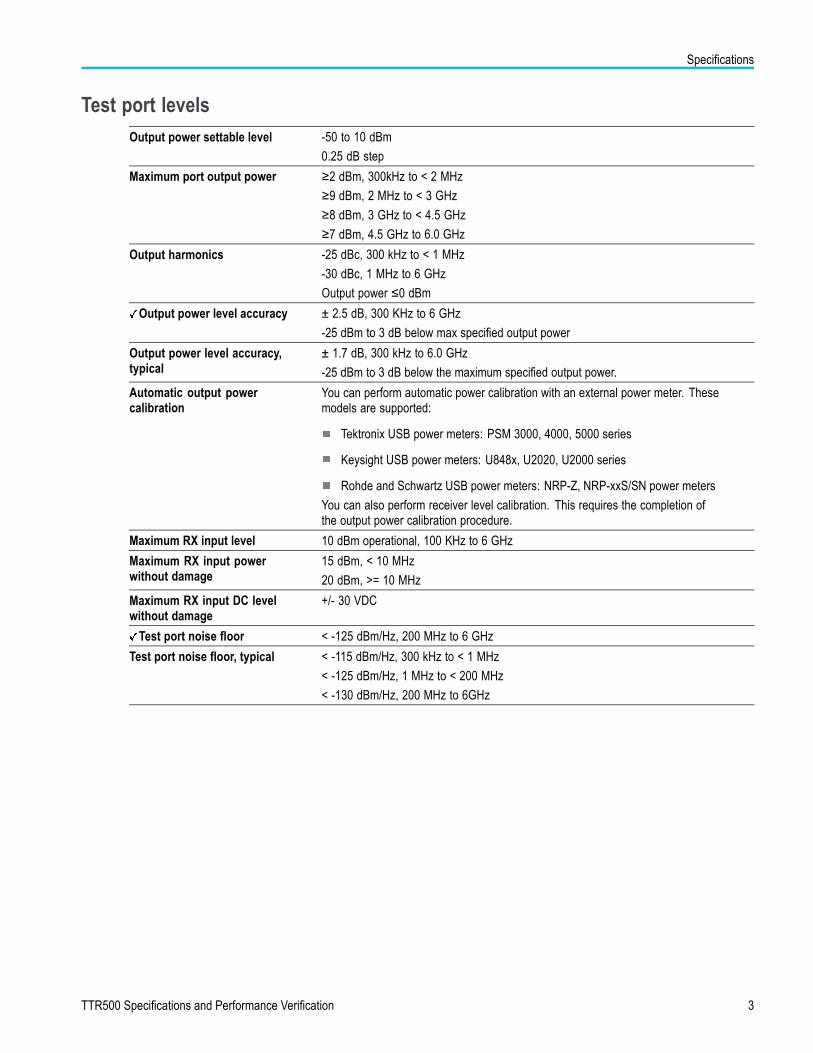
Test port levelsOutput power settable level -50 to 10 dBm
0.25 dB step
Maximum port output power ≥2 dBm, 300kHz to < 2 MHz
≥9 dBm, 2 MHz to < 3 GHz
≥8 dBm, 3 GHz to < 4.5 GHz
≥7 dBm, 4.5 GHz to 6.0 GHz
Output harmonics -25 dBc, 300 kHz to < 1 MHz
-30 dBc, 1 MHz to 6 GHz
Output power ≤0 dBm
Output power level accuracy ± 2.5 dB, 300 KHz to 6 GHz
-25 dBm to 3 dB below max specified output power
Output power level accuracy,typical
± 1.7 dB, 300 kHz to 6.0 GHz
-25 dBm to 3 dB below the maximum specified output power.
Automatic output powercalibration
You can perform automatic power calibration with an external power meter. Thesemodels are supported:
Tektronix USB power meters: PSM 3000, 4000, 5000 series
Keysight USB power meters: U848x, U2020, U2000 series
Rohde and Schwartz USB power meters: NRP-Z, NRP-xxS/SN power meters
You can also perform receiver level calibration. This requires the completion ofthe output power calibration procedure.
Maximum RX input level 10 dBm operational, 100 KHz to 6 GHz
Maximum RX input powerwithout damage
15 dBm, < 10 MHz
20 dBm, >= 10 MHz
Maximum RX input DC levelwithout damage
+/- 30 VDC
Test port noise floor < -125 dBm/Hz, 200 MHz to 6 GHz
Test port noise floor, typical < -115 dBm/Hz, 300 kHz to < 1 MHz
< -125 dBm/Hz, 1 MHz to < 200 MHz
< -130 dBm/Hz, 200 MHz to 6GHz
TTR500 Specifications and Performance Verification 3

Specifications
Dynamic rangeSystem dynamic range
The system dynamic range is measured in a 10 kHz IF bandwidth scaled to 10 Hz noise bandwidth. Measurement dynamicrange may be limited at low levels by crosstalk or the noise floor.
System dynamic range System dynamic range, typical Frequency range
112 dB 300 kHz to < 1 MHz
117 dB 1 MHz to < 2 MHz
124 dB 2 MHz to < 200 MHz
124 dB 125 dB 200 MHz to < 3 GHz
123 dB 123 dB 3 GHz to < 4.5 GHz
122 dB 122 dB 4.5 GHz to 6 GHz
Uncorrected crosstalk with load
For best isolation results, connect a DUT to each port. Measurement dynamic range may be limited on the lower end bycrosstalk or the noise floor.
Uncorrected crosstalk Frequency range
–85 dB 300 kHz to < 1 MHz
–110 dB 1 MHz to < 10 MHz
–105 dB 10 MHz to < 200 MHz
–120 dB 200 MHz to < 1 GHz
–115 dB 1 GHz to < 2 GHz
–120 dB 2 GHz to 6 GHz
10 Hz IFBW, 18°C to 28°C, within 1°C of calibration temperature
4 TTR500 Specifications and Performance Verification

Specifications
Corrected crosstalk with load
The corrected crosstalk with load refers to the crosstalk measured after performing a full 2–port SOLT calibration withisolation using a Spinner BN533861 type-N 50Ω load.
Corrected crosstalk Frequency range
–90 dB 300 kHz to < 1 MHz
–118 dB 1 MHz to < 10 MHz
–115 dB 10 MHz to 200 MHz
–125 dB > 200 MHz to < 1 GHz
–125 dB 1 GHz to < 2 GHz
–120 dB 2 GHz to 6 GHz
10 Hz IFBW, both ports terminated in 50Ω
Trace noise
Trace noise Specification
Magnitude 1 0.008 dB rms, 300 kHz to < 200 MHz
0.006 dB rms, 200 MHz to 6 GHz
Phase 1 0.050 degree rms, 300 kHz to < 200 MHz
0.040 degree rms, 200 MHz to 6 GHz
1 Determined using a thru connection with 1 kHz IFBW and +10 dBm source power
Temperature stability
Temperature stability Specification
Magnitude 1 0.008 dB/°C, 300 kHz to 3 GHz
0.015 dB/°C, > 3 GHz to 6 GHz
Phase 1 0.1 deg/°C, 300 kHz to 3 GHz
0.2 deg/°C, > 3 GHz to 6 GHz
1 Determined using a thru connection with 10 Hz IFBW and 0 dBm receiver power
Dynamic accuracy
105 MHz 2 GHz
> -60 to -50 dBm 0.55 dB 0.45 dB
> -50 to -34 dBm 0.35 dB 0.30 dB
> -34 to -20 dBm 0.25 dB 0.20 dB
> -20 to 0 dBm 0.20 dB 0.15 dB
> 0 to +5 dBm 0.35 dB 0.20 dB
> +5 to +10 dBm 0.65 dB 0.40 dB
TTR500 Specifications and Performance Verification 5

Specifications
Dynamic accuracy, typical
Power range
Frequency +5 to +10 dBm 0 to +5 dBm –30 to 0 dBm –50 to –30 dBm
10 MHz 0.40 dB 0.25 dB 0.15 dB 0.20 dB
105 MHz 0.30 dB 0.25 dB 0.10 dB 0.15 dB
350 MHz 0.30 dB 0.10 dB 0.10 dB 0.15 dB
783.5 MHz 0.30 dB 0.10 dB 0.10 dB 0.15 dB
1.083 GHz 0.25 dB 0.10 dB 0.10 dB 0.15 dB
2 GHz 0.20 dB 0.05 dB 0.10 dB 0.15 dB
3 GHz 0.20 dB 0.05 dB 0.10 dB 0.15 dB
4 GHz 0.15 dB 0.05 dB 0.10 dB 0.15 dB
5.25 GHz 0.15 dB 0.05 dB 0.10 dB 0.15 dB
6 GHz 0.15 dB 0.05 dB 0.10 dB 0.15 dB
6 TTR500 Specifications and Performance Verification
Specifications
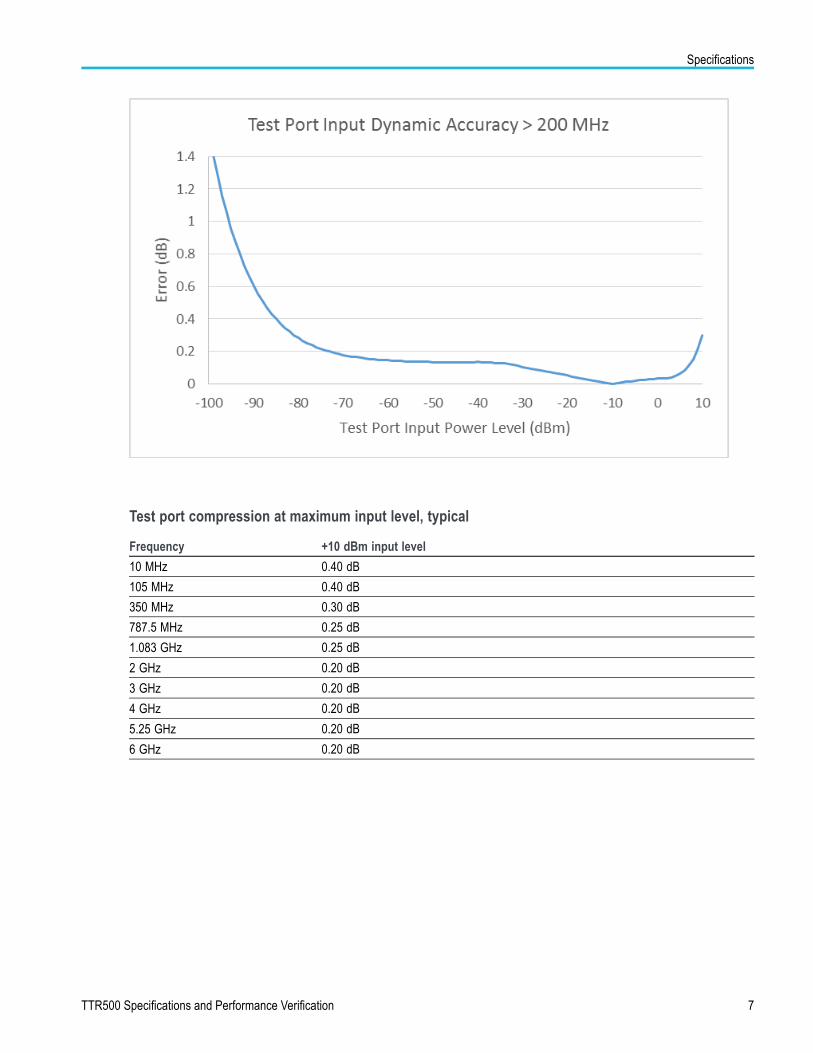
Test port compression at maximum input level, typical
Frequency +10 dBm input level
10 MHz 0.40 dB
105 MHz 0.40 dB
350 MHz 0.30 dB
787.5 MHz 0.25 dB
1.083 GHz 0.25 dB
2 GHz 0.20 dB
3 GHz 0.20 dB
4 GHz 0.20 dB
5.25 GHz 0.20 dB
6 GHz 0.20 dB
TTR500 Specifications and Performance Verification 7

Specifications
Signal flow parametersUncorrected signal flow parameters
User correction OFF
Factory correction ON
IF Bandwidth <= 30 kHz
FrequencyDirectivity(dB)
Sourcematch (dB)
Load match(dB)
Reflectiontracking(dB)
Transmissiontracking(dB)
300 kHz to < 500 kHz –25 –25 –4.5 ±1 ±1
500 kHz to < 2 MHz –25 –25 –4.5 ±1 ±1
2 MHz to < 10 MHz –25 –25 –11 ±1 ±1
10 MHz to < 200 MHz –25 –25 –11 ±1 ±1
200 MHz to < 1.50 GHz –25 –25 –10 ±1 ±1
1.50 GHz to < 4.50 GHz –25 –25 –8 ±1 ±1
4.50 GHz to < 5 GHz –25 –25 –8 ±1 ±1
5 GHz to 6 GHz –25 –25 –7 ±1 ±1
Corrected signal flow parameters, typical — using Type-N Precision mechanical calibrationkit Spinner BN533861
FrequencyDirectiv-ity (dB)
Sourcematch(dB)
Loadmatch:Insertablede-vices(dB)
Loadmatchwith M-Mor F-Fthru (dB)
Reflectiontracking(dB)
Trans-missiontracking(dB)
300 kHz to < 1 MHz –38 –34 –37 –35 0.08 0.05
1 MHz to < 10 MHz –37 –34 –37 –35 0.08 0.02
10 MHz to < 100 MHz –37 –34 –37 –35 0.08 0.01
100 MHz to < 1 GHz –36 –34 –37 –35 0.08 0.01
1 GHz to < 3 GHz –36 –34 –37 –35 0.08 0.02
3 GHz to 6 GHz –36 –34 –36 –35 0.09 0.02
18°C to 28°C, within 1°C of calibration temperature and at the same ambient humidity conditions when the calibrationwas performed.
8 TTR500 Specifications and Performance Verification

Specifications
Corrected signal flow parameters, typical — using 3.5mm Precision mechanical calibrationkit Spinner BN533864
FrequencyDirectiv-ity (dB)
Sourcematch(dB)
Loadmatch:Insertablede-vices(dB)
Loadmatchwith M-Mor F-Fthru (dB)
Reflectiontracking(dB)
Trans-missiontracking(dB)
300 kHz to < 1 MHz –36 –33 –37 –35.5 0.10 0.06
1 MHz to < 10 MHz –35 –33 –37 –35.5 0.10 0.02
10 MHz to < 100 MHz –35 –33 –37 –35.5 0.10 0.01
100 MHz to < 1 GHz –35 –33 –35 –35.5 0.10 0.01
1 GHz to < 4 GHz –35 –33 –35 –35.5 0.10 0.02
4 GHz to 6 GHz –28 –28 –29 –29 0.22 0.03
18°C to 28°C, within 1°C of calibration temperature and at the same ambient humidity conditions when the calibrationwas performed.
TTR500 Specifications and Performance Verification 9
Specifications
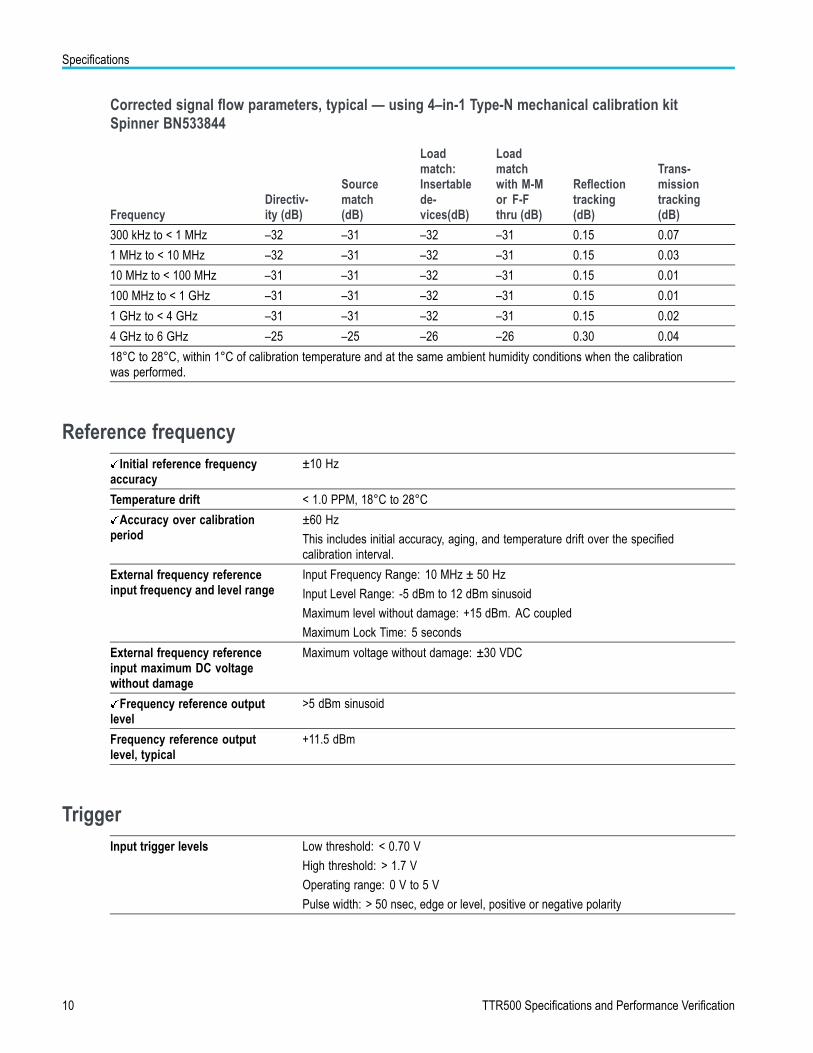
Corrected signal flow parameters, typical — using 4–in-1 Type-N mechanical calibration kitSpinner BN533844
FrequencyDirectiv-ity (dB)
Sourcematch(dB)
Loadmatch:Insertablede-vices(dB)
Loadmatchwith M-Mor F-Fthru (dB)
Reflectiontracking(dB)
Trans-missiontracking(dB)
300 kHz to < 1 MHz –32 –31 –32 –31 0.15 0.07
1 MHz to < 10 MHz –32 –31 –32 –31 0.15 0.03
10 MHz to < 100 MHz –31 –31 –32 –31 0.15 0.01
100 MHz to < 1 GHz –31 –31 –32 –31 0.15 0.01
1 GHz to < 4 GHz –31 –31 –32 –31 0.15 0.02
4 GHz to 6 GHz –25 –25 –26 –26 0.30 0.04
18°C to 28°C, within 1°C of calibration temperature and at the same ambient humidity conditions when the calibrationwas performed.
Reference frequencyInitial reference frequency
accuracy±10 Hz
Temperature drift < 1.0 PPM, 18°C to 28°C
Accuracy over calibrationperiod
±60 Hz
This includes initial accuracy, aging, and temperature drift over the specifiedcalibration interval.
External frequency referenceinput frequency and level range
Input Frequency Range: 10 MHz ± 50 Hz
Input Level Range: -5 dBm to 12 dBm sinusoid
Maximum level without damage: +15 dBm. AC coupled
Maximum Lock Time: 5 seconds
External frequency referenceinput maximum DC voltagewithout damage
Maximum voltage without damage: ±30 VDC
Frequency reference outputlevel
>5 dBm sinusoid
Frequency reference outputlevel, typical
+11.5 dBm
TriggerInput trigger levels Low threshold: < 0.70 V
High threshold: > 1.7 V
Operating range: 0 V to 5 V
Pulse width: > 50 nsec, edge or level, positive or negative polarity
10 TTR500 Specifications and Performance Verification

Specifications
Interfaces, input, and output portsFront panel connections
Connection Description
1 RF Port 1
2 Aux LO A
3 LED indicator
4 Aux LO B
5 RF Port 2
RF ports
Type N, 50 Ω, female, front panel, (2 ports)
Torque 12 in-lbs nominal, <= 15 in-lbs (32Nm + margin)
Type N MIL-STD-348B / MIL-C-39012 Class 2 Female
Use connector savers or cables to extend life.
LO ports
SMA, 50 Ω, front panel (2 ports)
Torque <= 8 in-lbs
LO port input power level range
-12 to +7 dBm
Maximum input level without damage: 10 dBm, 30V DC
TTR500 Specifications and Performance Verification 11
Specifications
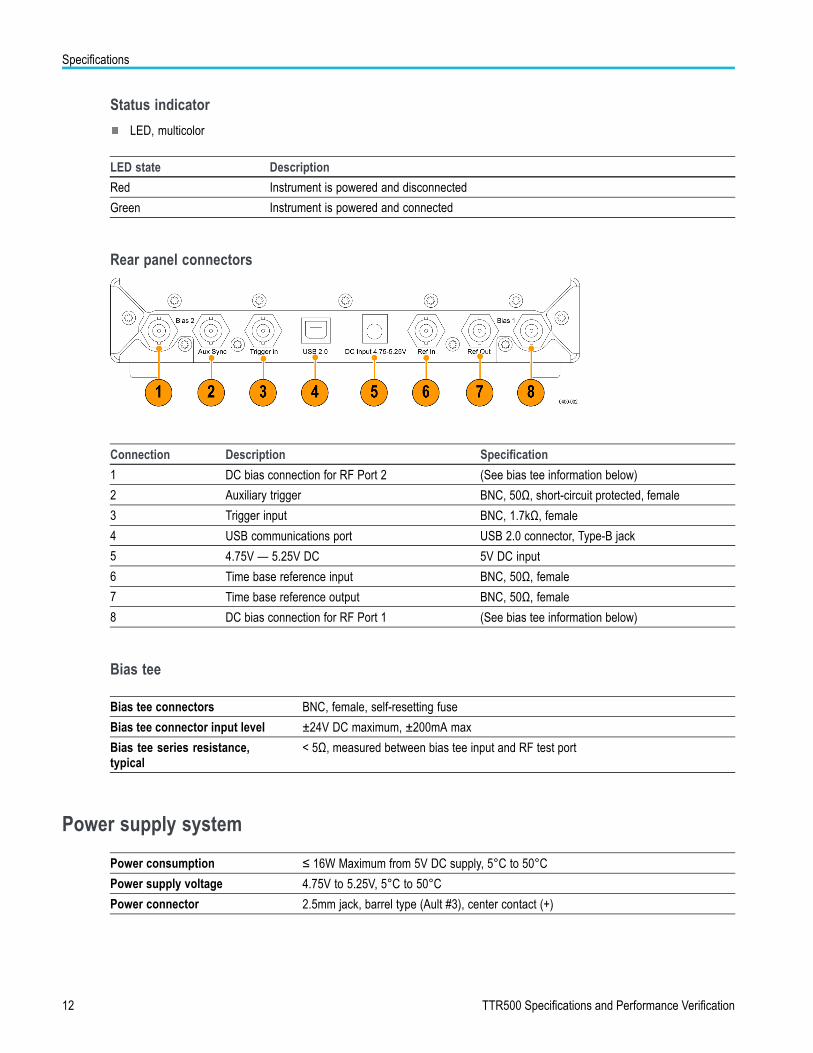
Status indicator
LED, multicolor
LED state Description
Red Instrument is powered and disconnected
Green Instrument is powered and connected
Rear panel connectors
Connection Description Specification
1 DC bias connection for RF Port 2 (See bias tee information below)
2 Auxiliary trigger BNC, 50Ω, short-circuit protected, female
3 Trigger input BNC, 1.7kΩ, female
4 USB communications port USB 2.0 connector, Type-B jack
5 4.75V — 5.25V DC 5V DC input
6 Time base reference input BNC, 50Ω, female
7 Time base reference output BNC, 50Ω, female
8 DC bias connection for RF Port 1 (See bias tee information below)
Bias tee
Bias tee connectors BNC, female, self-resetting fuse
Bias tee connector input level ±24V DC maximum, ±200mA max
Bias tee series resistance,typical
< 5Ω, measured between bias tee input and RF test port
Power supply system
Power consumption ≤ 16W Maximum from 5V DC supply, 5°C to 50°C
Power supply voltage 4.75V to 5.25V, 5°C to 50°C
Power connector 2.5mm jack, barrel type (Ault #3), center contact (+)
12 TTR500 Specifications and Performance Verification

Specifications
Host processorSystem requirements
Minimum PC requirement Intel® Core™ i3 processor, 8 GB RAM, Windows® 7 or higher, 64-bit
To meet all performancespecifications
Intel® Core™ i5 processor with 8 GB solid state drive
Best performance Intel® Core™ i7 processor, 8 GB solid state drive,
Mechanical characteristicsWeight 3.5 lbs (1.59 kg)
Overall dimensions Length: 11.25” (28.58 cm)
Width: 8.125” (20.64 cm)
Depth: 1.75” (4.45 cm)
TTR500 Specifications and Performance Verification 13

Specifications
Environmental performanceClassification General product classification of Portable equipment.
Temperature
Operating +5°C to +50°C
Nonoperating –40°C to +71°C
Humidity, operating Non-condensing under steady state and transient conditions.
5% to 80±5% RH (relative humidity) in the temperature range of +10°C to 30°C(+50°F to 86°F)
5% to 75% ±5% RH from +30 °C to +40 °C (+86°F to 104°F)5% to 45% ±5% RH in the temperature range of above +40 °C to +50 °C (+104°F to+122°F) non-condensing
Altitude
Operating 5000 meters (16,404 feet)
Nonoperating 15,240 meters (50,000 feet)
Dynamics
Random vibration: operating Level (g^2/Hz): 0.0002 from 5 to 350 Hz
Level Slope (dB/octave): -3 from 350 to 500 Hz
Level @ 500 Hz (g^2/Hz): 0.00014
Overall GRMS reference (g): 0.31
Duration per axis (minutes) : 10
Random vibration:non-operating
Level (g^2/Hz): 0.02 from 5 to 100 Hz
Level Slope (dB/octave): -3 from 100 to 200 Hz
Level (g^2/Hz): 0.01 from 200 to 350 Hz
Level Slope (dB/octave): -3 from 350 to 500 Hz
Level @ 500 Hz (g^2/Hz): 0.007
Overall GRMS reference (g): 2.46
Duration per axis (minutes) : 10
Mechanical shock: operating Half-sine mechanical shocks
30 g peak amplitude
11 mSec duration
3 drops in each direction of each axis, 18 total
Mechanical shock:non-operating
Half-sine mechanical shocks
40 g peak amplitude
11 mSec duration
3 drops in each direction of each axis, 18 total
Handling and transit
Bench handling, operating Rotational-edge-drops of appropriate edges on appropriate sides of the equipment
Transit drop, nonoperating Transit drops onto 6 faces and 4 corners of the equipment, from a height of 30 cmfor a total of 10 impacts.
14 TTR500 Specifications and Performance Verification

Performance verification
Performance verification
The procedures in this section verify that your instrument meets key performance specifications. However, the performanceverification procedures are not intended to calibrate the VNA. To calibrate your instrument, return it to a Tektronix servicefacility.
PrerequisitesFor the tests in this section to confirm performance and functionality, these requirements must be satisfied:
You must run a version of VectorVu-PC application that is 1.0.0 or higher.
Operate the instrument in an environment that meets the temperature, altitude, and humidity characteristics listed inthe specifications.
The instrument must be completely assembled and covers installed per factory specification.
The instrument must be operating for a warm-up period of at least for 30 minutes or until the thermometer indicator isgreen, whichever is longer. The warm-up period is calculated after completing these steps:
a. Connect the TTR500 instrument to a power supply.
b. Connect the TTR500 instrument to a PC.
c. Start VectorVu-PC.
d. Ensure that VectorVu-PC is continuously acquiring data.
NOTE. The TTR500 instrument does not fully power on until VectorVu-PC has established communication with theinstrument and is acquiring data.
For small-signal S-parameters, the TTR500 instrument must have been calibrated using the recommended precisioncalibration kit at an ambient temperature within ±1 °C of the current ambient temperature.
NOTE. For information on calibration procedures, marker functions and other operations mentioned in these tests, clickHelp in VectorVu-PC software and refer to user documentation.
TTR500 Specifications and Performance Verification 15

Performance verification
Required equipmentThe performance verification procedures use external, traceable signal sources to directly check warranted characteristics.This table lists the equipment required for these procedures.
Table 1: Test equipment required for TTR500 series
Item Description Qty Model Number Purpose
Desktop or Laptop PC Windows® 7 or higherUSB 2.0 or higher
1 Dell Optiplex 9020 MT, orequivalent
Run VectorVu-PC, USBpower sensor
USB2 cable Cable, USB 2.0 Type A Maleto Type B Male, 6 ft.
1 174-6150-00 (Tekronix P/N)or equivalent
Communication withTTR500
Frequency counter 10-digits/sec RF FrequencyCounter
1 Tektronix FCA3000 seriesOption HS OCXO orequivalent
Verify frequency accuracy.Opt. HS not required ifalternative high accuracyfrequency reference isavailable.
Frequency reference 10 MHz Frequency Standard <±0.25 ppm error
1 Fluke 910 or high accuracyOCXO
Reference for frequencycounter (if needed)
Signal generator < 10 MHz to > 2 GHz RF SignalGenerator, 15 dBm outputpower min.
1 Tektronix TSG4102,TSG4104, TSG4106 *Opt.M00 or E1 or equivalent
Dynamic range, externalreference lock range tests.(Order with Opt. M00 or E1if using as high accuracyfrequency reference.)
Power sensor 100 kHz to 6 GHz 1 Rohde & Schwarz NRP-Z91or Keysight U2004A orequivalent
Verify TTR500 signalamplitude
Power splitter Two resistor type, DC –18 GHz, N
1 Weinschel 1870A orKeysight 11667A orequivalent
Power measurement
3 dB power splitter fl ≤100 MHz, fh ≥2 GHz,Isolation > 17 dB N connectors
1 Pulsar P2-16-411Nor Mini-CircuitsZAPD-2-252-N+ orequivalent
Measure dynamicaccuracy
Precision adapterN(male) to N(male)
DC -18 GHz coaxial adapter 1 Maury Microwave 8828B Power measurements
Type N OSLTcalibration kit
Type-N OSLTcalibration kit MM9 GHz
1 Tektronix P/N015080200(SPINNERBN 533844) or equivalent
Verify specifiedperformance withcalibration
Precision 20 dBattenuator
Type N Metrology grade 20 dBattenuator
1 Weinschel Model 44-20,Keysight 8491B-020
Measuring transmissiontracking
Type N VNAverification kit
Type N 20,40 dB Attenuation,50, 25 Ω Airline
1 Spinner BN533480 Verify specifiedperformance
Precision Type N testcable
Cable, Phase-Stable,Type-N(M) To Type-N(F),60CM
1 Tektronix P/N 012176500 orequivalent
Connect to calibration andverification standards
16 TTR500 Specifications and Performance Verification

Performance verification
Table 1: Test equipment required for TTR500 series (cont.)
Item Description Qty Model Number Purpose
Precision Type N testcable
Cable, Phase-Stable,Type-N(M) To Type-N(M),60CM
1 Tektronix P/N 012176800 Connect to calibration andverification standards
N(M) - N(F) adapter Adapter, Coaxial, 50Ω Type-N(M) To Type-N (F) 18 GHz
1 Tektronix P/N 013041000
Maury CC-A-N-FF
N(F) - N(F) adapter Adapter, Coaxial, 50 Ω Type-N(F) To Type-N (F) 18 GHZ
1 Tektronix P/N 013041000
Maury CC-A-N-FF
N(M) - N(M) adapter Adapter, Coaxial, 50Ω Type-N(M) To Type-N (M) 18 GHZ
1 Tektronix P/N 013041200
Maury CC-A-N-MM
Type N(F)-BNC(M)adapter
Adapter, Coaxial, 50Ω TypeN(F) to BNC(M)
1 If using Type N cableto connect to counter,otherwise use typeN(M)-BNC(M) adapter
Type N(M)-BNC(M)adapter
Adapter, Coaxial, 50 Ω TypeN(M) to BNC(M)
1 If using BNC cable toconnect to counter
BNC cable BNC cable, 1 m 2
Type N termination 50Ω, DC - 6 GHz, N-m, VSWR1.2:1
1 Fairview MicrowaveSTN0610
50Ω terminator for isolationtest
Precision Ntermination
DC -18 GHz, N-m 1 Tektronix P/N 103043500
Maury Microwave 2510B6
Gauge Type N MIL-STD-348B /MIL-C-39012 Class 2 female(socket) contact gauge
1 Spinner BN 53 70 13
Maury A0007A
Measure connector pindepth to check for damage
Torque wrench 12 in-lb - Type N 1 Spinner BN 53 70 91 R000
Maury Microwave 2698C2
N- connector attachments
NOTE. Make sure that any adaptor and cable you use is specified to operate at the frequency range of the test you areperforming.
Preliminary checksComplete these steps before starting the performance verification procedures.
Warm up the instrument
1. Connect the TTR500 USB cable to the host PC. The LED on the TTR500 should initially glow red and then turn greenafter a few moments.
2. Make sure that VectorVu-PC is active and connects to the TTR500 instrument.
TTR500 Specifications and Performance Verification 17

Performance verification
3. View the instrument status bar in the lower left corner of the VectorVu-PC display. Verify that there are no errors ormessages indicating loss of data or invalid calibration data.
4. Let the application acquire data. Allow the instrument to warm up for at least 30 minutes.
Performance verification proceduresInternal reference frequency accuracy over the calibration period
Use this procedure to determine whether the internal time base is within its specified accuracy for a full calibration period.
Procedure.
1. Perform an instrument preset (System > Preset) on the TTR500 instrument.
2. Set these parameters:
Parameter Soft key path Value
Center frequency Stimulus > Center 10 MHz
Span Stimulus > Span 0 MHz
Sweep points Stimulus > Sweep Setup > Points 1
Measurement Response > Measure > S21 S21
Trigger source Stimulus > More > Trigger Source Manual
Point trigger Stimulus > More > Point Trigger ON
3. Connect the input terminal of the frequency counter to port 1 of the TTR500 instrument in one of these ways:
Use a type N test cable with a type N-to-BNC adapter.
Use a BNC cable with a N-male-to-BNC adapter.
4. Set up the frequency counter to measure a 10 MHz, 0 dBm input signal. The counter resolution and averaging should beset to display frequency with 1 Hz or smaller resolution. If the frequency reference of the counter is not accurate to within0.1 Hz/MHz then it should be locked to an accurate external frequency standard.
18 TTR500 Specifications and Performance Verification

Performance verification
5. Use a BNC cable and splitter to connect the TTR external reference input to the same 10 MHz reference as thefrequency counter.
6. In System > More > Reference Clock Source, set the TTR500 reference clock source to External.
7. Trigger a measurement on the TTR500. Verify that the frequency counter reads 10.000000 MHz.
8. Note the measured value in the calculations table. (See Table 2.)
9. Set the TTR500 reference clock source to Internal.
10. Record the frequency measured by the counter in the table for reference accuracy calculations. (See Table 2.) Enter thevalue under ‘Measured frequency’ in the row for internal reference frequency.
11. Compare the measured value with the specification for internal frequency accuracy. Enter the results in the test record.
Table 2: Reference accuracy calculations
Measuredfrequency (MHz)
Frequency error(Hz) Specification Hz
External reference lockcheck frequency
0 (or ≤accuracy offrequency counter) Hz
Measuredfrequency (Hz)
Frequency error(Hz)
Specification Hz
Internal referencefrequency
± 60 Hz
Ext.Ref. Pass/Fail
Int.Ref. Pass/Fail
TTR500 Specifications and Performance Verification 19

Performance verification
Frequency reference output level
Procedure.
1. Reset the TTR500 instrument to factory default settings (Preset > Main).
2. Connect the power sensor to the TTR500 reference output using a BNC cable and appropriate adapters.
3. Set the frequency of the power sensor to 10 MHz.
4. Note the power sensor reading in the table for frequency reference output level. (See Table 3.) Compare the measuredvalue with the specification for output level.
Table 3: Frequency reference output level
Measured (dBm) Specified (dBm) Pass/Fail
Frequency reference output level > 5 dBm
20 TTR500 Specifications and Performance Verification

Performance verification
Maximum output power and output power level accuracy
You test the port output power at four levels:
At 10 dBm to measure the maximum output power
At three lower levels to determine the output power accuracy
Procedure.
1. Power on the power meter/sensor and allow it to warm up to calibrated operating conditions. Perform a calibration andzeroing of the sensor as required by the manufacturer to meet specifications.
2. Perform an instrument preset (System > Preset) on the TTR500 and set these parameters:
Parameter Soft key path Value
Center frequency Stimulus > Center 300 kHz
Span Stimulus > Span 0 Hz
Sweep points Stimulus > Sweep Setup > Points 1
Measurement Response > Measure > S12 S12
Trigger source Stimulus > Trigger > More > Trigger Source Manual
Point trigger Stimulus > Trigger > More > Point Trigger YES
3. Connect the power sensor/power meter to port 1 of the TTR500.
4. If necessary, set the sensor frequency to the same as the TTR center frequency. Some power sensors have sufficientlyflat frequency response over the 300 kHz to 6 GHz range that a default frequency can be used, but this must be verified.
5. Set the TTR power level to the first of the TTR levels listed for the center frequency in the table for output powermeasurements for port 1. (See Table 4.)
6. Execute a manual trigger on the TTR.
7. Measure and record the power meter amplitude. (See Table 4.)
8. Set the TTR power level to the next power listed for this frequency. Execute a manual trigger and record the powermeter reading.
9. Repeat until all power levels for this frequency have been recorded.
TTR500 Specifications and Performance Verification 21
Performance verification
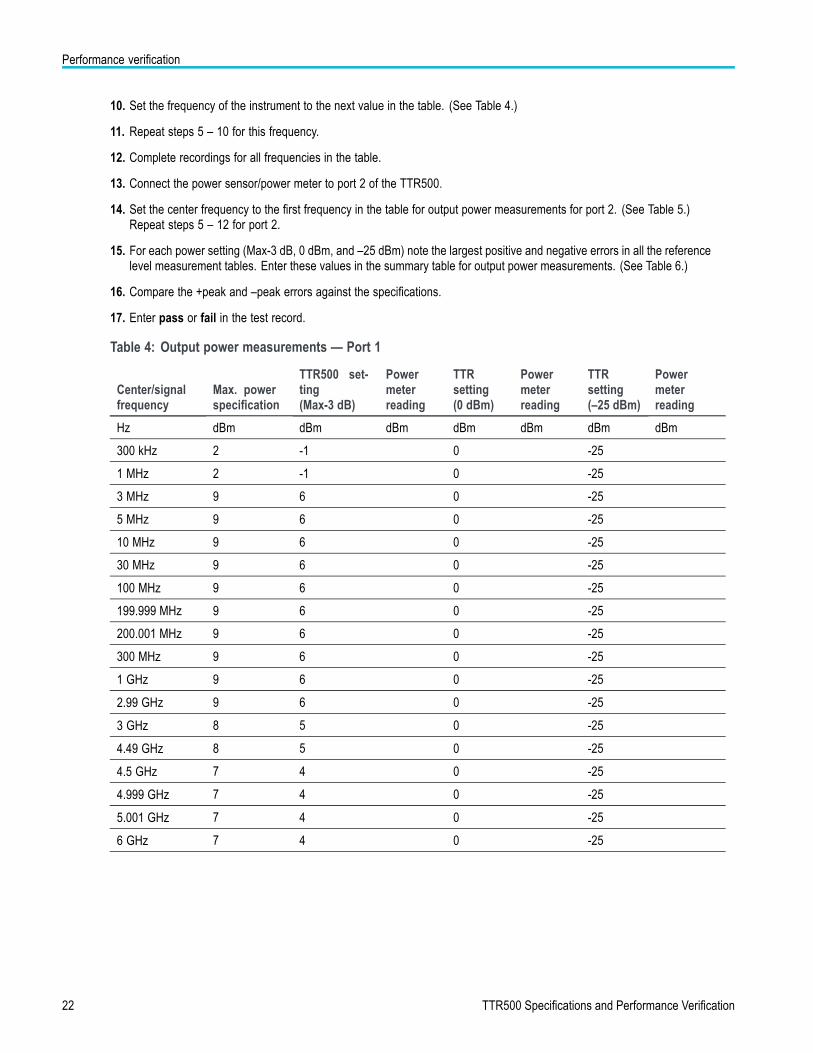
10. Set the frequency of the instrument to the next value in the table. (See Table 4.)
11. Repeat steps 5 – 10 for this frequency.
12. Complete recordings for all frequencies in the table.
13. Connect the power sensor/power meter to port 2 of the TTR500.
14. Set the center frequency to the first frequency in the table for output power measurements for port 2. (See Table 5.)Repeat steps 5 – 12 for port 2.
15. For each power setting (Max-3 dB, 0 dBm, and –25 dBm) note the largest positive and negative errors in all the referencelevel measurement tables. Enter these values in the summary table for output power measurements. (See Table 6.)
16. Compare the +peak and –peak errors against the specifications.
17. Enter pass or fail in the test record.
Table 4: Output power measurements — Port 1
Center/signalfrequency
Max. powerspecification
TTR500 set-ting(Max-3 dB)
Powermeterreading
TTRsetting(0 dBm)
Powermeterreading
TTRsetting(–25 dBm)
Powermeterreading
Hz dBm dBm dBm dBm dBm dBm dBm
300 kHz 2 -1 0 -25
1 MHz 2 -1 0 -25
3 MHz 9 6 0 -25
5 MHz 9 6 0 -25
10 MHz 9 6 0 -25
30 MHz 9 6 0 -25
100 MHz 9 6 0 -25
199.999 MHz 9 6 0 -25
200.001 MHz 9 6 0 -25
300 MHz 9 6 0 -25
1 GHz 9 6 0 -25
2.99 GHz 9 6 0 -25
3 GHz 8 5 0 -25
4.49 GHz 8 5 0 -25
4.5 GHz 7 4 0 -25
4.999 GHz 7 4 0 -25
5.001 GHz 7 4 0 -25
6 GHz 7 4 0 -25
22 TTR500 Specifications and Performance Verification

Performance verification
Table 5: Output power measurements — Port 2
Center/signalfrequency
Max. powerspecification
TTR500 set-ting(Max-3 dB)
Powermeterreading
TTRsetting(0 dBm)
Powermeterreading
TTRsetting(–25 dBm)
Powermeterreading
Hz dBm dBm dBm dBm dBm dBm dBm
300 kHz 2 -1 0 -25
1 MHz 2 -1 0 -25
3 MHz 9 6 0 -25
5 MHz 9 6 0 -25
10 MHz 9 6 0 -25
30 MHz 9 6 0 -25
100 MHz 9 6 0 -25
199.999 MHz 9 6 0 -25
200.001 MHz 9 6 0 -25
300 MHz 9 6 0 -25
1 GHz 9 6 0 -25
2.99 GHz 9 6 0 -25
3 GHz 8 5 0 -25
4.49 GHz 8 5 0 -25
4.5 GHz 7 4 0 -25
4.999 GHz 7 4 0 -25
5.001 GHz 7 4 0 -25
6 GHz 7 4 0 -25
TTR500 Specifications and Performance Verification 23

Performance verification
Table 6: Output power summary
Reference level Frequency rangePeak positiveerror
Peak negativeerror
Specifica-tion Pass/Fail
Port 1
Max.power-3dB
300 kHz to 6 GHz ±2.5 dB
0 dBm
300 kHz to 6 GHz ±2.5 dB
-25 dBm
300 kHz to 6GHz ±2.5 dB
Port 2
Max.power–3 dB
300 kHz to 6 GHz ±2.5 dB
0 dBm
300 kHz to 6 GHz ±2.5 dB
-25 dBm
300 kHz to 6 GHz ±2.5 dB
24 TTR500 Specifications and Performance Verification
Performance verification
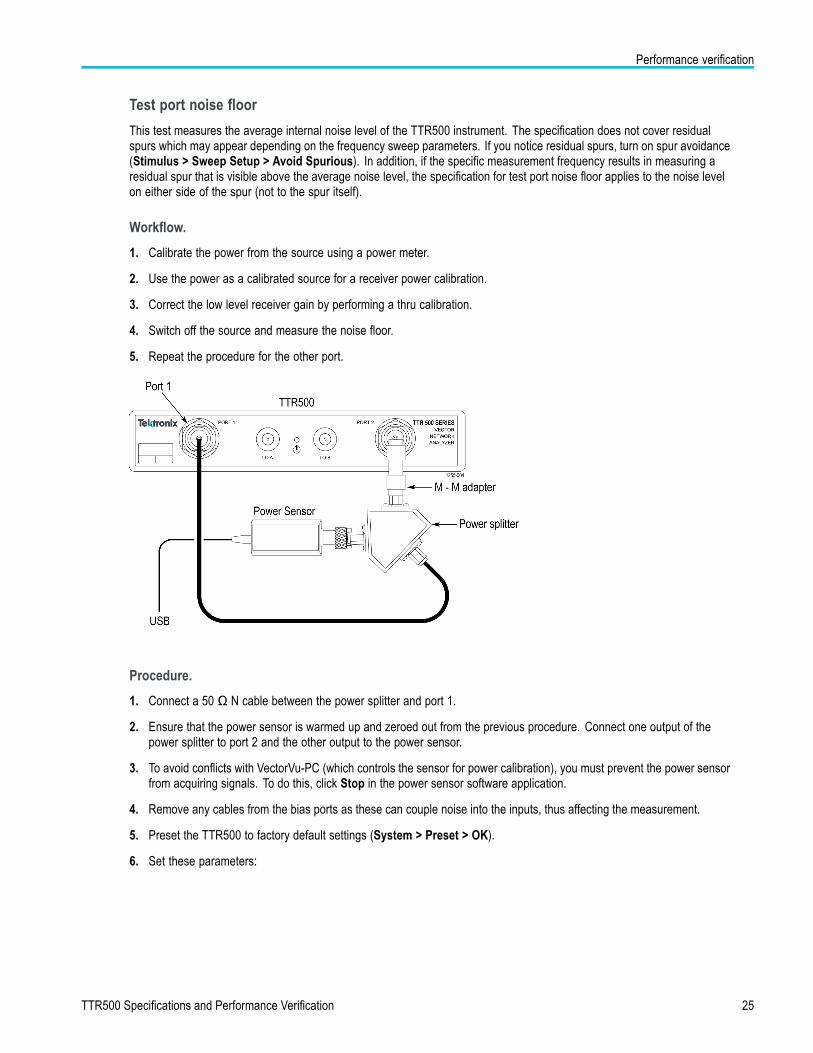
Test port noise floor
This test measures the average internal noise level of the TTR500 instrument. The specification does not cover residualspurs which may appear depending on the frequency sweep parameters. If you notice residual spurs, turn on spur avoidance(Stimulus > Sweep Setup > Avoid Spurious). In addition, if the specific measurement frequency results in measuring aresidual spur that is visible above the average noise level, the specification for test port noise floor applies to the noise levelon either side of the spur (not to the spur itself).
Workflow.
1. Calibrate the power from the source using a power meter.
2. Use the power as a calibrated source for a receiver power calibration.
3. Correct the low level receiver gain by performing a thru calibration.
4. Switch off the source and measure the noise floor.
5. Repeat the procedure for the other port.
Procedure.
1. Connect a 50 Ω N cable between the power splitter and port 1.
2. Ensure that the power sensor is warmed up and zeroed out from the previous procedure. Connect one output of thepower splitter to port 2 and the other output to the power sensor.
3. To avoid conflicts with VectorVu-PC (which controls the sensor for power calibration), you must prevent the power sensorfrom acquiring signals. To do this, click Stop in the power sensor software application.
4. Remove any cables from the bias ports as these can couple noise into the inputs, thus affecting the measurement.
5. Preset the TTR500 to factory default settings (System > Preset > OK).
6. Set these parameters:
TTR500 Specifications and Performance Verification 25
Performance verification
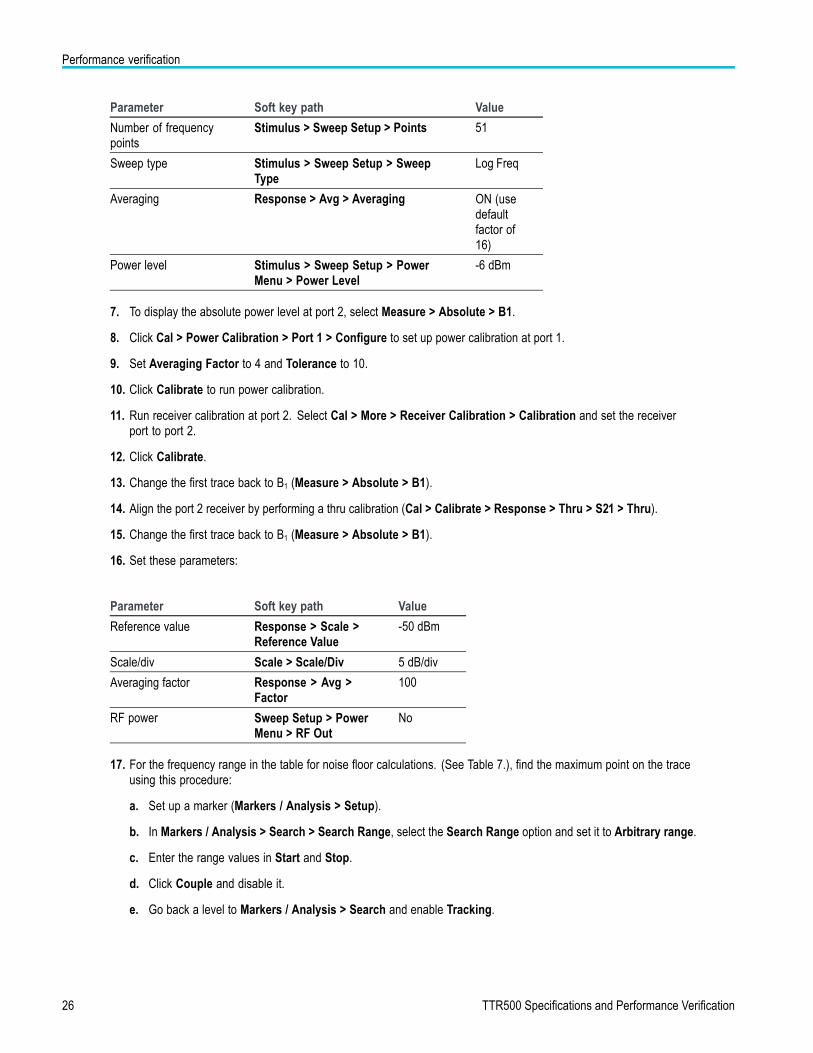
Parameter Soft key path Value
Number of frequencypoints
Stimulus > Sweep Setup > Points 51
Sweep type Stimulus > Sweep Setup > SweepType
Log Freq
Averaging Response > Avg > Averaging ON (usedefaultfactor of16)
Power level Stimulus > Sweep Setup > PowerMenu > Power Level
-6 dBm
7. To display the absolute power level at port 2, select Measure > Absolute > B1.
8. Click Cal > Power Calibration > Port 1 > Configure to set up power calibration at port 1.
9. Set Averaging Factor to 4 and Tolerance to 10.
10. Click Calibrate to run power calibration.
11. Run receiver calibration at port 2. Select Cal > More > Receiver Calibration > Calibration and set the receiverport to port 2.
12. Click Calibrate.
13. Change the first trace back to B1 (Measure > Absolute > B1).
14. Align the port 2 receiver by performing a thru calibration (Cal > Calibrate > Response > Thru > S21 > Thru).
15. Change the first trace back to B1 (Measure > Absolute > B1).
16. Set these parameters:
Parameter Soft key path Value
Reference value Response > Scale >Reference Value
-50 dBm
Scale/div Scale > Scale/Div 5 dB/div
Averaging factor Response > Avg >Factor
100
RF power Sweep Setup > PowerMenu > RF Out
No
17. For the frequency range in the table for noise floor calculations. (See Table 7.), find the maximum point on the traceusing this procedure:
a. Set up a marker (Markers / Analysis > Setup).
b. In Markers / Analysis > Search > Search Range, select the Search Range option and set it to Arbitrary range.
c. Enter the range values in Start and Stop.
d. Click Couple and disable it.
e. Go back a level to Markers / Analysis > Search and enable Tracking.
26 TTR500 Specifications and Performance Verification
Performance verification
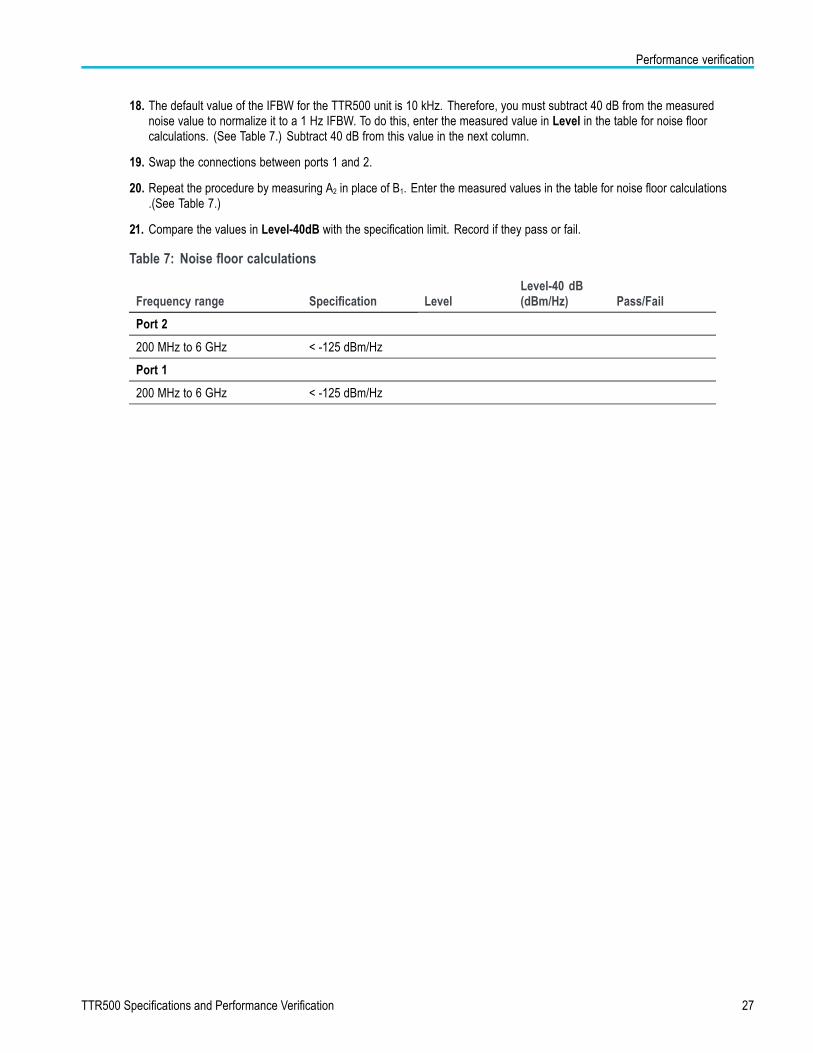
18. The default value of the IFBW for the TTR500 unit is 10 kHz. Therefore, you must subtract 40 dB from the measurednoise value to normalize it to a 1 Hz IFBW. To do this, enter the measured value in Level in the table for noise floorcalculations. (See Table 7.) Subtract 40 dB from this value in the next column.
19. Swap the connections between ports 1 and 2.
20. Repeat the procedure by measuring A2 in place of B1. Enter the measured values in the table for noise floor calculations.(See Table 7.)
21. Compare the values in Level-40dB with the specification limit. Record if they pass or fail.
Table 7: Noise floor calculations
Frequency range Specification LevelLevel-40 dB(dBm/Hz) Pass/Fail
Port 2
200 MHz to 6 GHz < -125 dBm/Hz
Port 1
200 MHz to 6 GHz < -125 dBm/Hz
TTR500 Specifications and Performance Verification 27

Performance verification
Dynamic range
The dynamic range of the system is the difference in dB between the specified maximum RF output power and the receivernoise floor in a 10 Hz IF bandwidth. Use the test to measure the average internal noise level of the instrument.
The specification does not cover residual spurs which may appear depending on the frequency sweep parameters. If younotice any residual spurs, turn on spur avoidance (Stimulus > Sweep Setup > Avoid Spurious).
Workflow.
1. Calibrate the power from the source using a power meter.
2. Use the power as a calibrated source for a receiver power calibration.
3. Correct the low level receiver gain by performing a thru calibration.
4. Switch off the source and measure the noise floor.
5. Repeat the procedure for the other port.
Since you measured the receiver noise in the noise floor test with a 10 kHz IF bandwidth, the noise level measurementscan be scaled by the ratio of bandwidths (10 Hz/10 kHz=0.001 or -30 dB) to compute the noise in a 10 Hz bandwidth. Thedynamic range is the difference between the specified maximum RF output power and the noise power at 10 Hz bandwidth.
Procedure.
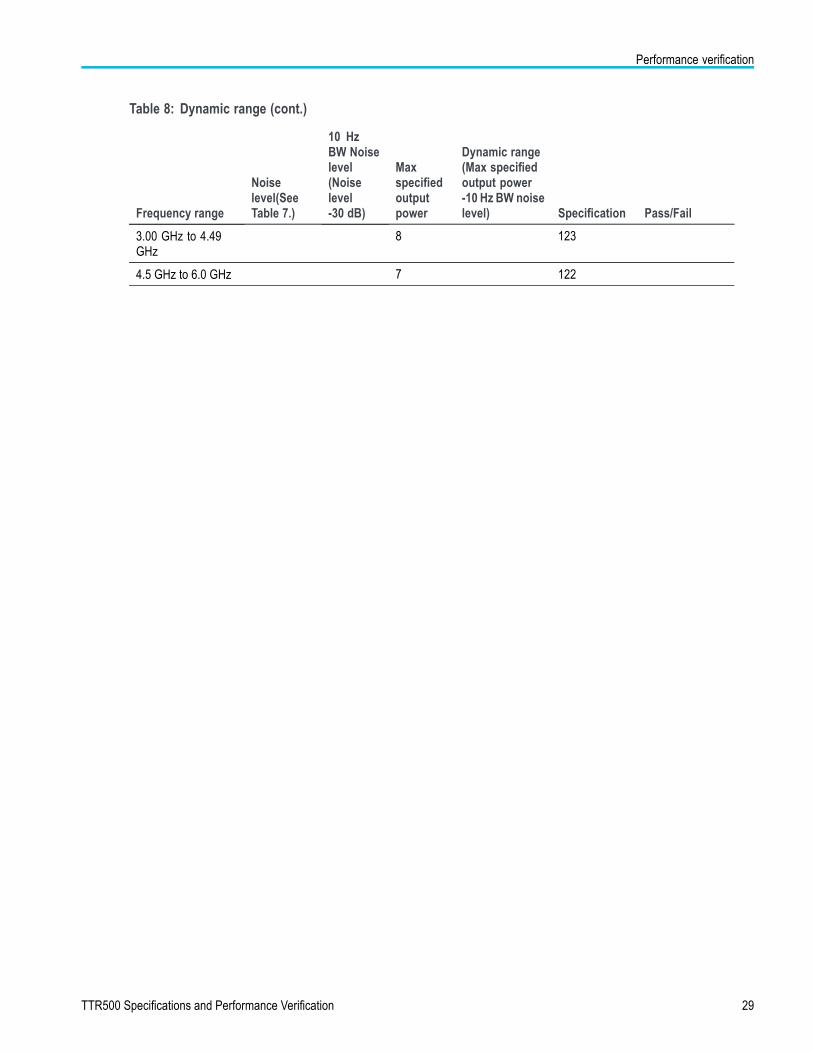
1. Copy the noise level measurements from the table for noise floor calculations (See Table 7.) to the second column inthe table for dynamic range(See Table 8.)
2. Subtract 30 dB from the noise level measurements to compute the noise level in a 10 Hz bandwidth. Enter thesevalues in the third column.
3. Subtract the noise level value in 10 Hz bandwidth from the corresponding value for maximum power. Enter this resultin the column for dynamic range.
4. Compare the result with the specification for dynamic range. Note if the value passed or failed the test.
Table 8: Dynamic range
Frequency range
Noiselevel(SeeTable 7.)
10 HzBW Noiselevel(Noiselevel-30 dB)
Maxspecifiedoutputpower
Dynamic range(Max specifiedoutput power-10 Hz BW noiselevel) Specification Pass/Fail
dBm dBm dBm dB dB
Port 2
200 MHz to 2.99 GHz 9 124
3.00 GHz to 4.49GHz
8 123
4.5 GHz to 6 GHz 7 122
Port 1
200 MHz to 2.99 GHz 9 124
28 TTR500 Specifications and Performance Verification
Performance verification
Table 8: Dynamic range (cont.)
Frequency range
Noiselevel(SeeTable 7.)
10 HzBW Noiselevel(Noiselevel-30 dB)
Maxspecifiedoutputpower
Dynamic range(Max specifiedoutput power-10 Hz BW noiselevel) Specification Pass/Fail
3.00 GHz to 4.49GHz
8 123
4.5 GHz to 6.0 GHz 7 122
TTR500 Specifications and Performance Verification 29

Performance verification
Dynamic accuracy
Use the dynamic accuracy test to measure the power level accuracy of the receiver over its specified range relative to ameasurement at –10 dBm.
Preparation.
Power on the DUT, signal generator, and power meter. Allow them to warm up for 30 minutes.
Perform the test without interruption.
Perform the test in an environment with stable temperature (±1°C).
Procedure.
1. Perform a calibration and zeroing of the sensor per manufacturer specifications.
2. Turn on the signal generator and allow it to warm up per manufacturer specifications.
3. Connect a 50 Ω N cable between the output of the signal generator and the input to the 3 dB power splitter.
4. Connect one output of the 3 dB power splitter to port 2 of the TTR500 instrument using an N male-male adapter.
5. Connect the other output of the power splitter to the power sensor.
30 TTR500 Specifications and Performance Verification

Performance verification
6. Connect a BNC cable between the reference output of the signal generator and the external reference input to theTTR500 instrument.
7. In System > Preset, perform a system preset of the TTR500 instrument to factory defaults.
8. In System > More > Reference Clock Source, select an external reference clock.
9. Perform a system preset of the signal generator to factory defaults.
10. Set these parameters in the signal generator:
Setting Value
Frequency 2 GHz
Output power level -5 dBm
RF output ON
11. Adjust the output level of the signal generator until the power meter reads -10.00 dBm or close to it.
12. Disconnect the power splitter.
13. Swap the output connections of the power splitter and reconnect it. You do this to calibrate the port of the power splitterthat is connected to the TTR500. This action takes into account any power imbalances in the power splitter.
The port that was set to -10 dBm level will now provide that level to the input of the TTR500. The power meter readingchanges by the balance error of the splitter. You will normalize this error in step 15.
14. Set up a measurement in the TTR500 with these specifications:
Specification Soft key path Value
Measurement Response > Measure > Absolute > B1 B1
Center frequency Stimulus > Center 2 GHz
Span Stimulus > Span 10 Hz
Points Stimulus > Sweep Setup > Points 11
Scale/Div Response > Scale > Scale/Div 5 dB
Reference value Response > Scale > Reference Value 0 dBm
Reference position Response > Scale > ReferencePosition
11
15. In Setup > Marker 1, set marker 1 at 2 GHz.
16. Normalize the display (Display > Memory > Normalize).
17. Turn on averaging (Response > Avg > Averaging) and use the default factor of 16. The marker should read 0.00 dBm.
18. Save the power meter reading as a reference and set the meter in relative mode. The power meter should also read0.00 dB, like the marker.
19. Decrease the power level of the signal generator in 5 dB steps. Restart averaging (Response > Avg > Restart) on theTTR500 after each level change.
20. Compare the power meter reading to the marker reading and note the difference.
21. Repeat steps 7 and 8.
22. Save a new reference level to normalize the power meter again.
TTR500 Specifications and Performance Verification 31

Performance verification
23. Normalize the TTR500 reading as in step 15.
24. Return the signal generator to the level that exceeded the error limit. Note the difference.
25. Normalize the power meter by saving a new reference level.
26. Normalize the TTR500 as in step 15.
27. Increase the signal generator level in 5 dB steps, noting the difference between marker and power meter in the table.Repeat until you reach +20 dB on the power sensor.
28. Move the splitter connection from port 2 to port 1 of the TTR500 instrument. Adjust the signal generator level so thatthe relative power meter reading is 0.00 dB.
29. Set the TTR500 instrument to measure A2 (Measure > Absolute > A2).
30. Normalize the display (Display > Memory > Normalize).
31. Restart averaging. The marker should read 0.00 dBm.
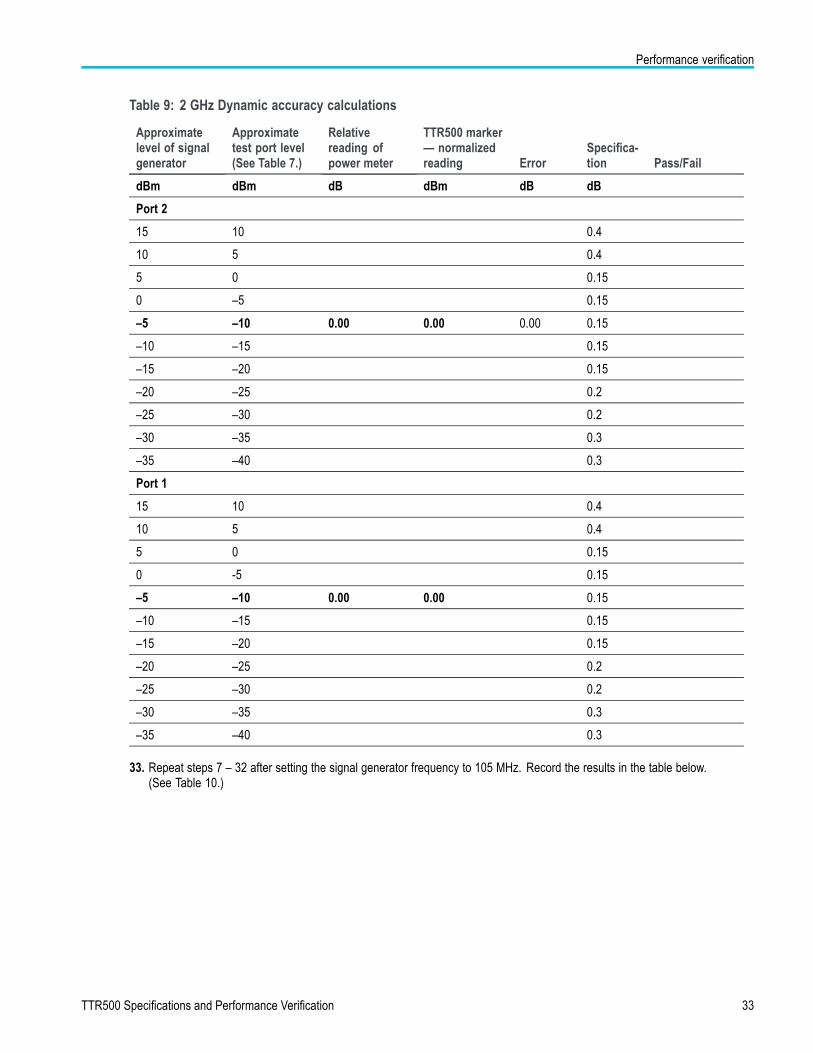
32. Perform steps 19 – 27 and note the results in the table for Port 1. (See Table 9.)
32 TTR500 Specifications and Performance Verification
Performance verification
Table 9: 2 GHz Dynamic accuracy calculations
Approximatelevel of signalgenerator
Approximatetest port level(See Table 7.)
Relativereading ofpower meter
TTR500 marker— normalizedreading Error
Specifica-tion Pass/Fail
dBm dBm dB dBm dB dB
Port 2
15 10 0.4
10 5 0.4
5 0 0.15
0 –5 0.15
–5 –10 0.00 0.00 0.00 0.15
–10 –15 0.15
–15 –20 0.15
–20 –25 0.2
–25 –30 0.2
–30 –35 0.3
–35 –40 0.3
Port 1
15 10 0.4
10 5 0.4
5 0 0.15
0 -5 0.15
–5 –10 0.00 0.00 0.15
–10 –15 0.15
–15 –20 0.15
–20 –25 0.2
–25 –30 0.2
–30 –35 0.3
–35 –40 0.3
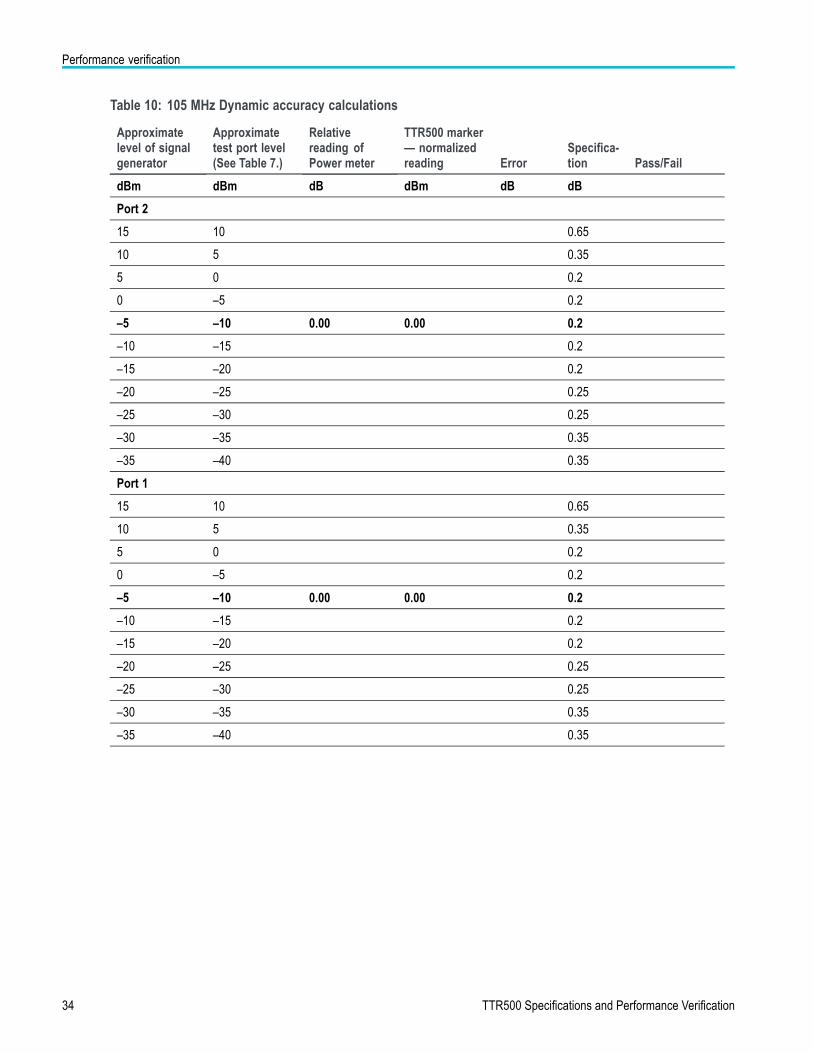
33. Repeat steps 7 – 32 after setting the signal generator frequency to 105 MHz. Record the results in the table below.(See Table 10.)
TTR500 Specifications and Performance Verification 33
Performance verification
Table 10: 105 MHz Dynamic accuracy calculations
Approximatelevel of signalgenerator
Approximatetest port level(See Table 7.)
Relativereading ofPower meter
TTR500 marker— normalizedreading Error
Specifica-tion Pass/Fail
dBm dBm dB dBm dB dB
Port 2
15 10 0.65
10 5 0.35
5 0 0.2
0 –5 0.2
–5 –10 0.00 0.00 0.2
–10 –15 0.2
–15 –20 0.2
–20 –25 0.25
–25 –30 0.25
–30 –35 0.35
–35 –40 0.35
Port 1
15 10 0.65
10 5 0.35
5 0 0.2
0 –5 0.2
–5 –10 0.00 0.00 0.2
–10 –15 0.2
–15 –20 0.2
–20 –25 0.25
–25 –30 0.25
–30 –35 0.35
–35 –40 0.35
34 TTR500 Specifications and Performance Verification
Performance verification
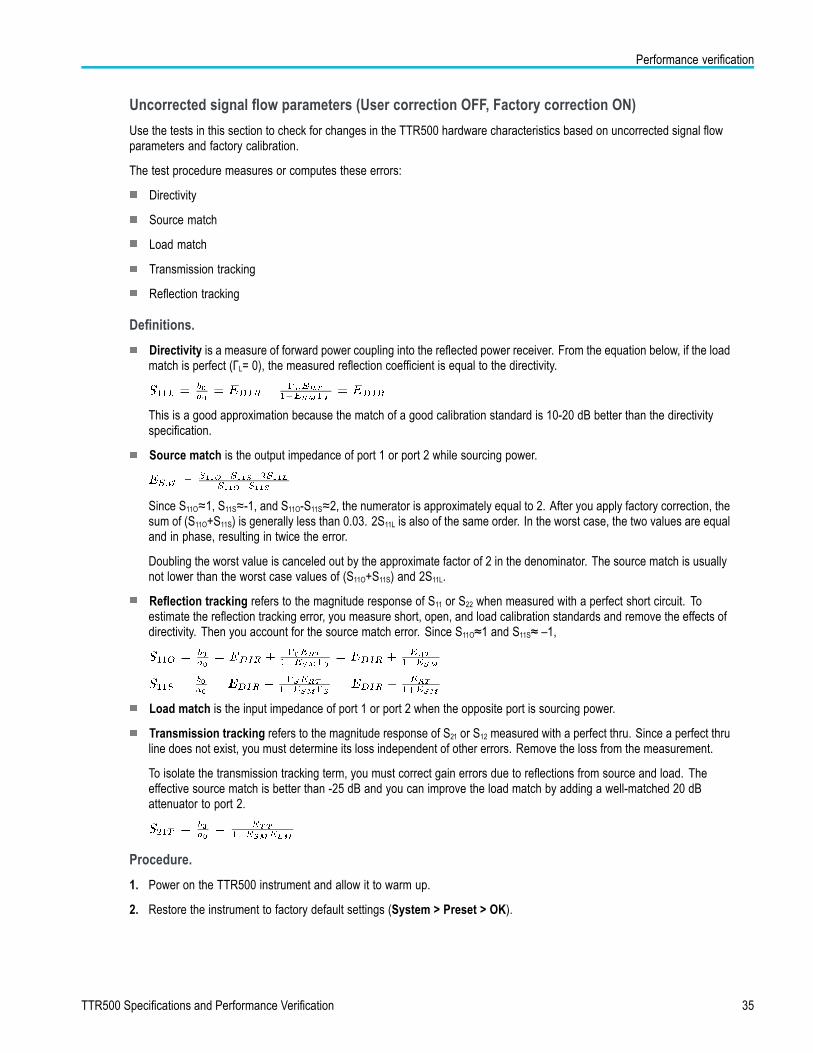
Uncorrected signal flow parameters (User correction OFF, Factory correction ON)
Use the tests in this section to check for changes in the TTR500 hardware characteristics based on uncorrected signal flowparameters and factory calibration.
The test procedure measures or computes these errors:
Directivity
Source match
Load match
Transmission tracking
Reflection tracking
Definitions.
Directivity is a measure of forward power coupling into the reflected power receiver. From the equation below, if the loadmatch is perfect (ΓL= 0), the measured reflection coefficient is equal to the directivity.
This is a good approximation because the match of a good calibration standard is 10-20 dB better than the directivityspecification.
Source match is the output impedance of port 1 or port 2 while sourcing power.
Since S11O≈1, S11S≈-1, and S11O-S11S≈2, the numerator is approximately equal to 2. After you apply factory correction, thesum of (S11O+S11S) is generally less than 0.03. 2S11L is also of the same order. In the worst case, the two values are equaland in phase, resulting in twice the error.
Doubling the worst value is canceled out by the approximate factor of 2 in the denominator. The source match is usuallynot lower than the worst case values of (S11O+S11S) and 2S11L.
Reflection tracking refers to the magnitude response of S11 or S22 when measured with a perfect short circuit. Toestimate the reflection tracking error, you measure short, open, and load calibration standards and remove the effects ofdirectivity. Then you account for the source match error. Since S11O≈1 and S11S≈ –1,
Load match is the input impedance of port 1 or port 2 when the opposite port is sourcing power.
Transmission tracking refers to the magnitude response of S21 or S12 measured with a perfect thru. Since a perfect thruline does not exist, you must determine its loss independent of other errors. Remove the loss from the measurement.
To isolate the transmission tracking term, you must correct gain errors due to reflections from source and load. Theeffective source match is better than -25 dB and you can improve the load match by adding a well-matched 20 dBattenuator to port 2.
Procedure.
1. Power on the TTR500 instrument and allow it to warm up.
2. Restore the instrument to factory default settings (System > Preset > OK).
TTR500 Specifications and Performance Verification 35

Performance verification
3. In Sweep Setup > Sweep Type, select Log Freq for logarithmic frequency sweep.
4. Directivity: Use a 50Ω metrology-grade calibration load in this procedure.
a. Connect the 50Ω load calibration standard to port 1.
b. Measure S11.
c. Measure the maximum value for each band in the specification. Note these values in the table for uncorrected signalflow parameters. Compare them with the specifications for each band. (See Table 11.)
d. Note the maximum reading for each band and note if the readings passed or failed. (See Table 11.)
e. Also note in the test record if the instrument passed this test.
f. Repeat step 4 for port 2. Verify that the S22 parameter at port 2 is lower than the limit for each band in the directivitycolumn.
5. Source match: You calculate the source match by measuring short, open, and load calibration standards.
In Response > Display > Memory,
a. Click Data →Mem to store the load calibration standard S11 to memory.
b. Use Data Math > Data+Memory to add the S11 data trace and memory trace values.
c. Note the maximum value for each frequency band in the specification.
d. Connect the open calibration standard to port 1.
e. Store the S11 parameter to memory using data math operations as described earlier.
f. Connect the short calibration standard to port 1.
g. Measure S11.
h. Note the maximum value of each frequency band in the specification. (See Table 11.)
i. Select the worst of the two results for each frequency band. Compare them with the specification.
j. Note pass/fail in the test record.
k. Repeat step 5 for port 2 to measure S22.
36 TTR500 Specifications and Performance Verification

Performance verification
6. Reflection tracking:
a. Restore the instrument to factory default settings by performing a system preset (System > Preset > OK).
b. In Sweep Setup > Sweep Type, select Log Freq for logarithmic frequency sweep.
c. Connect the 50Ω load calibration standard to port 1.
d. Measure S11.
e. In Display > Memory > Data →Mem, store the load calibration standard S11 to memory.
f. Use Data Math > Data-Memory to subtract from the measurement and remove the directivity error.
g. Connect the open calibration standard to port 1.
h. Adjust Scale > Scale/Div as required.
i. Note the maximum deviation from zero for each frequency band in the specification in the table for uncorrectedsignal flow parameters. (See Table 11.)
j. Connect the short calibration standard to port 1.
k. Note the maximum deviation from zero for each frequency band in the specification.
l. Select the worst of the two results for each frequency band. Compare them with the specification.
m. Note pass/fail in the test record.
n. Repeat step 6 for port 2 by measuring S22.
TTR500 Specifications and Performance Verification 37

Performance verification
7. Load match: You can directly measure the load match by performing a 1–port user calibration at the end of a type-Nmale test cable and then measuring the other port.
a. Restore the instrument to factory default settings by performing a system preset (System > Preset > OK).
b. In Sweep Setup > Sweep Type, select Log Freq for logarithmic frequency sweep.
c. Connect a test cable to port 1.
d. Connect a type-N F-F adapter to the open end of the test cable.
e. Use the BN533844 M-M type-N calibration kit to perform a 1-port SOL calibration referenced to the adapter.
f. After the calibration is complete, connect the thru line of the calibration kit to the adapter.
g. Connect the other end of the thru line to port 2 of the TTR500.
h. Measure S11 (load match of port 2).
i. Note the maximum value for each frequency band in the specification in the table for uncorrected signal flowparameters. (See Table 11.)
j. Note pass/fail in the test record.
k. Repeat step 7 for port 2. Perform a 1-port SOL calibration at the end of the test cable connected to port 2. MeasureS22.
8. Transmission tracking: This is the gain error when measuring a perfect thru line.
a. Restore the instrument to factory default settings by performing a system preset (System > Preset > OK).
b. In Sweep Setup > Sweep Type, select Log Freq for logarithmic frequency sweep.
c. Connect test cable 1 to port 1.
d. Connect a type-N F-F adapter to the open end of test cable 1.
e. Use the BN533844 M-M type-N calibration kit to perform a 2-port SOLT calibration referenced to the adapter.
f. After completing the calibration, connect the 20 dB attenuator to port 2.
g. Connect test cable 2 between the adapter at port 1 and the 20 dB attenuator.
38 TTR500 Specifications and Performance Verification

Performance verification
h. Measure S21 of the cable+attenuator combination.
i. Store the measurement to memory using Display > Memory > Data →Mem.
j. Remove cable 1 and the adapter from port 1.
k. Connect the open end of cable 2 to port 1 of the TTR500 unit.
l. Measure S21 of the cable+attenuator combination.
m. Use Display > Memory > Data Math > Data / Mem to divide the S21 value you measured with the value storedin memory.
n. Autoscale the trace (Response > Scale > Auto Scale), which should be approximately 0 dB.
o. Disable error correction (Cal > Correction). The trace now displays the approximate transmission tracking errorbecause you removed the cable/attenuator loss and used the 20 dB attenuator to minimize the effect of source/loadmatch.
p. Note the maximum value for each frequency band in the specification in the table for uncorrected signal flowparameters. Note if the value passed/failed. (See Table 11.)
q. Repeat step 8 for S12. When you disable error correction, the displayed trace shows the approximate reversetransmission tracking error.
TTR500 Specifications and Performance Verification 39

Performance verification
Table 11: Uncorrected signal flow parameters
Frequency Specification Port 1 measured Port 2 measured Pass/Fail
Directivity (dB)
300 kHz — 6 GHz -25
Source match (dB)
300 kHz — 6 GHz
Load match (dB)
300 kHz — <2 MHz -4.5
2 MHz — <200 MHz -11
200 MHz — <1.5 GHz -10
1.5 GHz — <4.5 GHz -8
4.5 GHz — <6 GHz -7
Reflection tracking(dB)
300 kHz — 6 GHz ±1
Transmissiontracking (dB)
Forward Reverse
300 kHz — 6 GHz ±1
40 TTR500 Specifications and Performance Verification

Performance verification
Test recordRecord the performance test results for the TTR500 vector network analyzer in this section.
Table 12: Test record for TTR500 VNA
Instrument Serial Number:
Temperature:
Date of Calibration:
Certificate Number:
RH %:
Technician:
Instrument performance test Pass/Fail Notes
External frequency reference lock
Internal reference frequency error
Frequency reference output level
Output power level accuracy
Test port noise floor
Dynamic accuracy
Uncorrected signal flow parameters
TTR500 Specifications and Performance Verification 41