tube voltage accuracy and linearity output using exposure indicator and mean gray value
TRANSCRIPT
PHOTOSTIMULABLE-PHOSPHOR PLATE (PSP)
RESPONSES IN COMPUTED RADIOGRAPHY AT
EXPOSURE FACTOR ASCENT RELATED TO TUBE
VOLTAGE ACCURACY & OUTPUT LINEARITY OF
X-RAY MACHINE
DWI ADHIANTO
24040112150010
MEDICAL PHYSICS TRANSFER PROGRAM
SCIENCE AND MATH FACULTY
DIPONEGORO UNIVERSITY
SEMARANG
2014
INTRODUCTION
Accuracy of control panel-radiation output
become one of aim for quality control in
radiology services.
General using of Computed Radiography in
Indonesia .
Linear response of imaging plate to x-ray
intensities
Tube voltage accuracy and linearity of output
from x-ray machine use photostimulable-
phosphor plate responses which is basic of
Computed Radiography technology
PROBLEM FORMULATION
AIM OF RESEARCH
Understanding influence of the gradual ascent
of exposure factor in x-ray machine to
photostimulablephosphor plate responses
related to tube voltage accuracy and linearity
of output x-ray machine.

RESEARCH PROFIT
Giving an alternative way for the Hospital that held
Computed Radiography System to perform
compliance test by using imaging plate responses.
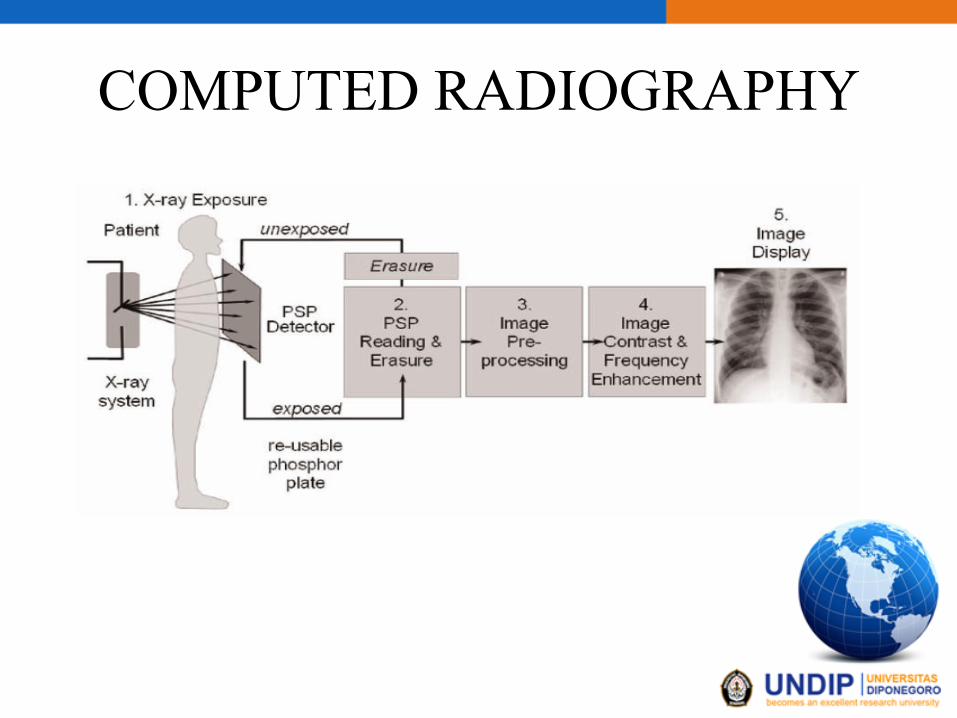
COMPUTED RADIOGRAPHY
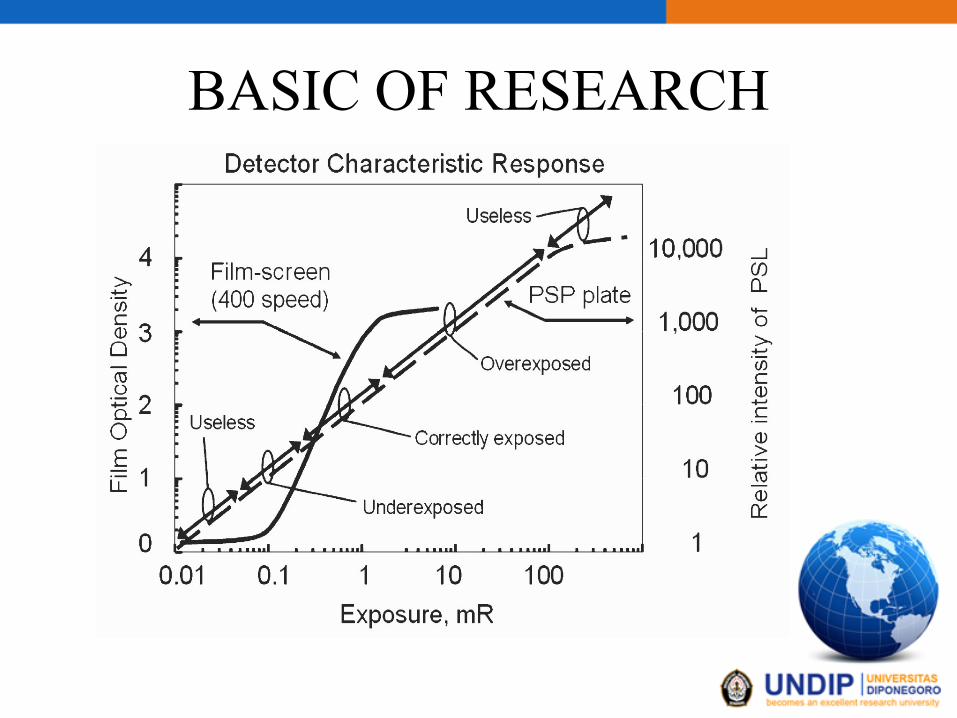
BASIC OF RESEARCH
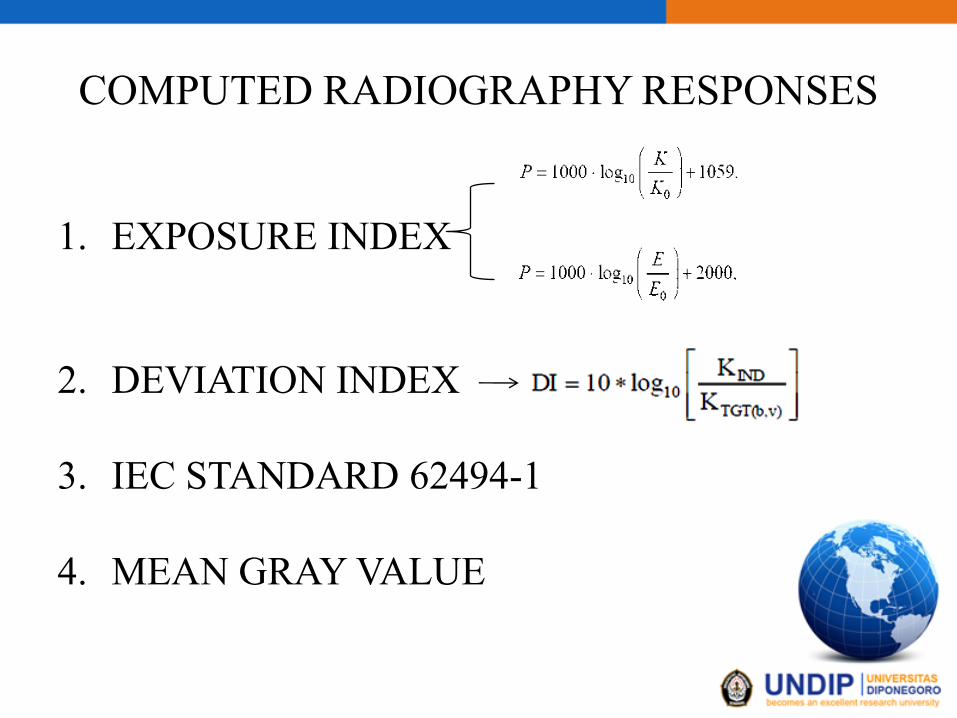
COMPUTED RADIOGRAPHY RESPONSES
1. EXPOSURE INDEX
2. DEVIATION INDEX
3. IEC STANDARD 62494-1
4. MEAN GRAY VALUE

RESEARCH INSTRUMENTATION
&MATERIAL
• RADIODIAGNOSTIC MACHINE
• COMPUTED RADIOGRAPHY
(CARESTREAM)
• X-RAY ANALYZER PIRANHA
• ALLUMINIUM STEPWEDGE
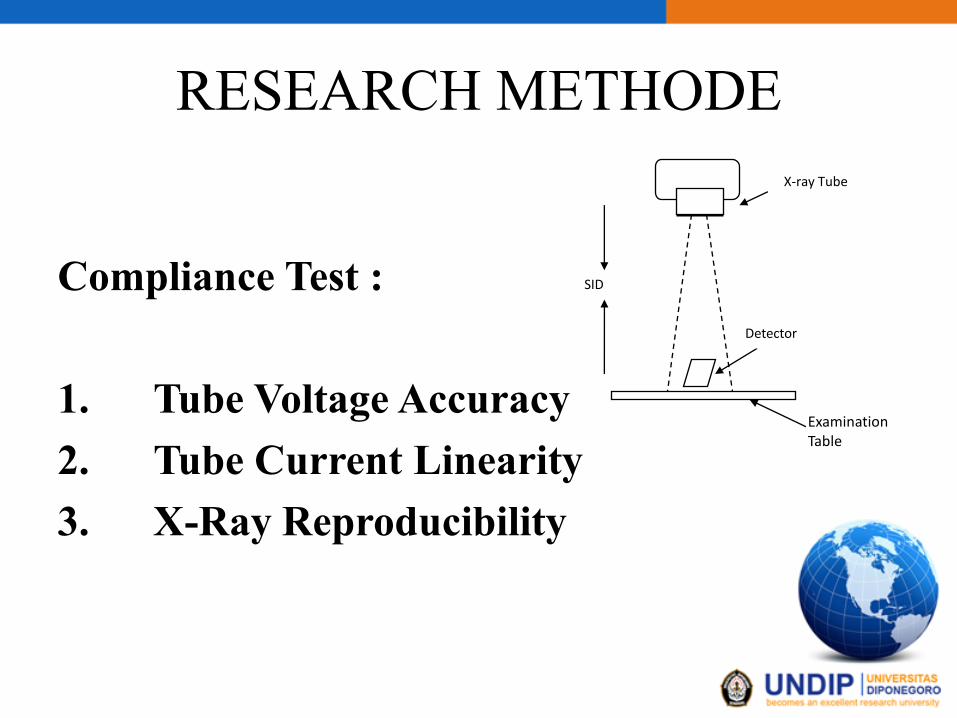
RESEARCH METHODE
Compliance Test :
1. Tube Voltage Accuracy
2. Tube Current Linearity
3. X-Ray Reproducibility
ExaminationTable
X-ray Tube
Detector
SID
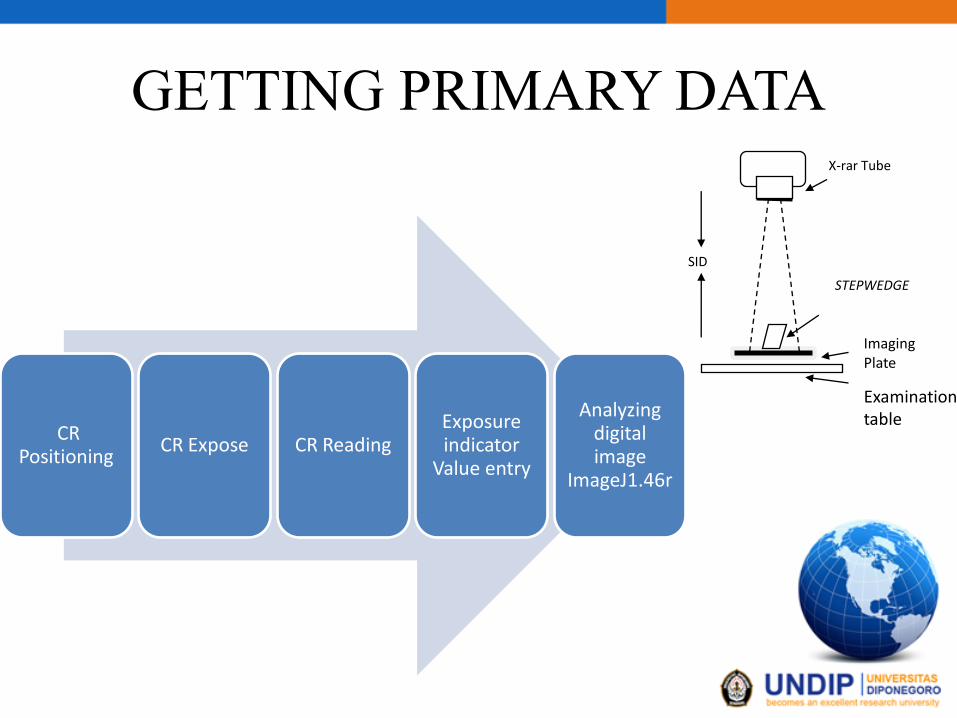
GETTING PRIMARY DATA
CR Positioning
CR Expose CR ReadingExposure indicator
Value entry
Analyzing digital image
ImageJ1.46r
X-rar Tube
STEPWEDGE
SID
Imaging Plate
Examination table
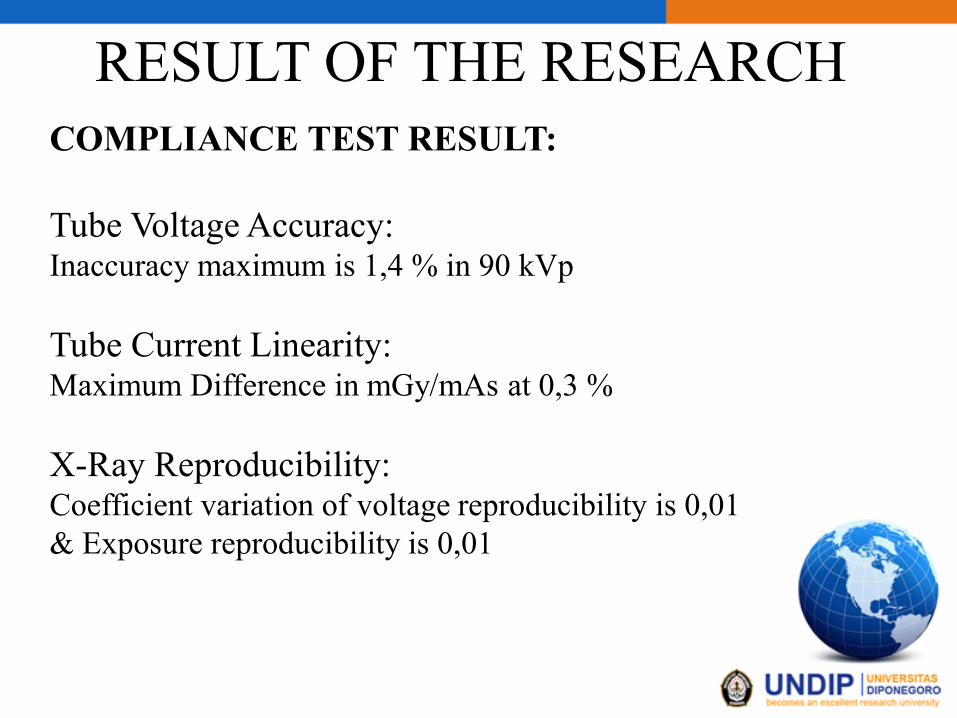
RESULT OF THE RESEARCH
COMPLIANCE TEST RESULT:
Tube Voltage Accuracy: Inaccuracy maximum is 1,4 % in 90 kVp
Tube Current Linearity:Maximum Difference in mGy/mAs at 0,3 %
X-Ray Reproducibility:Coefficient variation of voltage reproducibility is 0,01
& Exposure reproducibility is 0,01

Relation of linear ascent in tube voltage (kVp) with steady
tube current-exposure time (mAs) to Exposure Index
y = 1712.ln(x) - 5669.R² = 0.979
y = 1785.ln(x) - 5720.R² = 0.983
y = 1868.ln(x) - 5815.R² = 0.967
y = 1870.ln(x) - 5574.R² = 0.971
y = 1872.ln(x) - 5300.R² = 0.962
y = 1926.ln(x) - 5275R² = 0.959
0
500
1000
1500
2000
2500
3000
3500
40 50 60 70 80 90 100
Exp
osu
re In
dex
Tube Voltage (kVp)
0,5 mAs
1 mAs
2 mAs
4 mAs
8 mAs
16 mAs
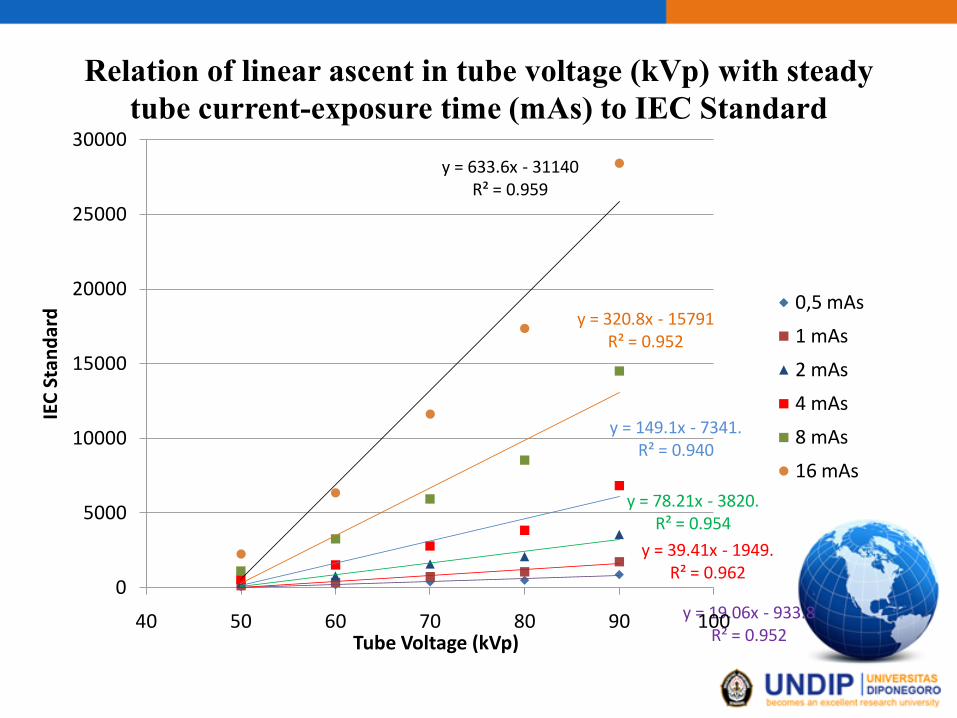
y = 19.06x - 933.8R² = 0.952
y = 39.41x - 1949.R² = 0.962
y = 78.21x - 3820.R² = 0.954
y = 149.1x - 7341.R² = 0.940
y = 320.8x - 15791R² = 0.952
y = 633.6x - 31140R² = 0.959
0
5000
10000
15000
20000
25000
30000
40 50 60 70 80 90 100
IEC
Sta
nd
ard
Tube Voltage (kVp)
0,5 mAs
1 mAs
2 mAs
4 mAs
8 mAs
16 mAs
Relation of linear ascent in tube voltage (kVp) with steady
tube current-exposure time (mAs) to IEC Standard
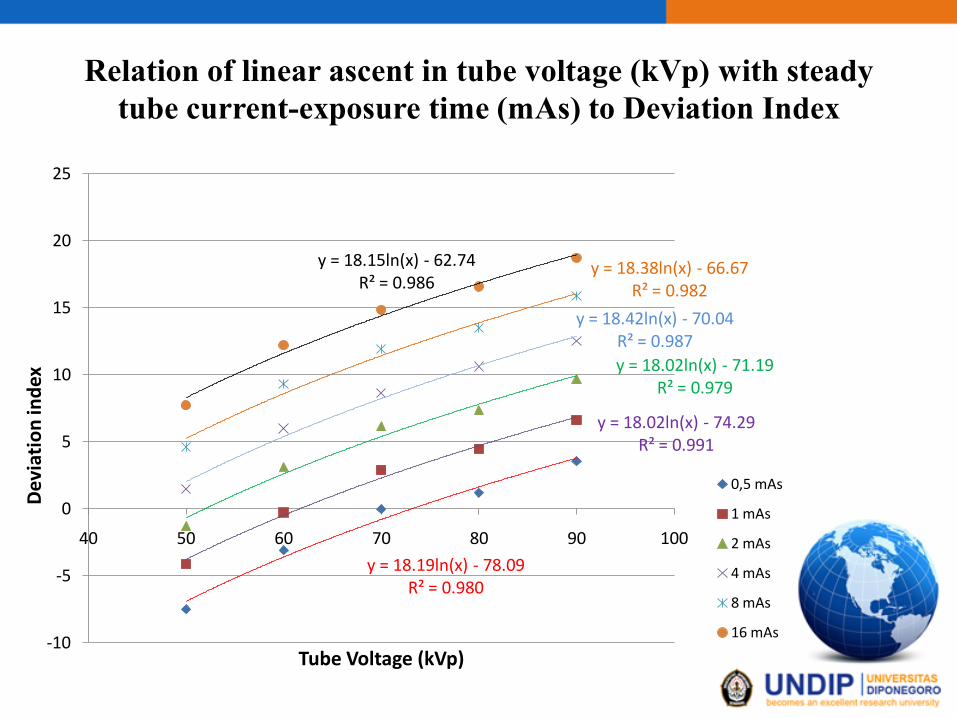
Relation of linear ascent in tube voltage (kVp) with steady
tube current-exposure time (mAs) to Deviation Index
y = 18.19ln(x) - 78.09R² = 0.980
y = 18.02ln(x) - 74.29R² = 0.991
y = 18.02ln(x) - 71.19R² = 0.979
y = 18.42ln(x) - 70.04R² = 0.987
y = 18.38ln(x) - 66.67R² = 0.982
y = 18.15ln(x) - 62.74R² = 0.986
-10
-5
0
5
10
15
20
25
40 50 60 70 80 90 100
Dev
iati
on
ind
ex
Tube Voltage (kVp)
0,5 mAs
1 mAs
2 mAs
4 mAs
8 mAs
16 mAs
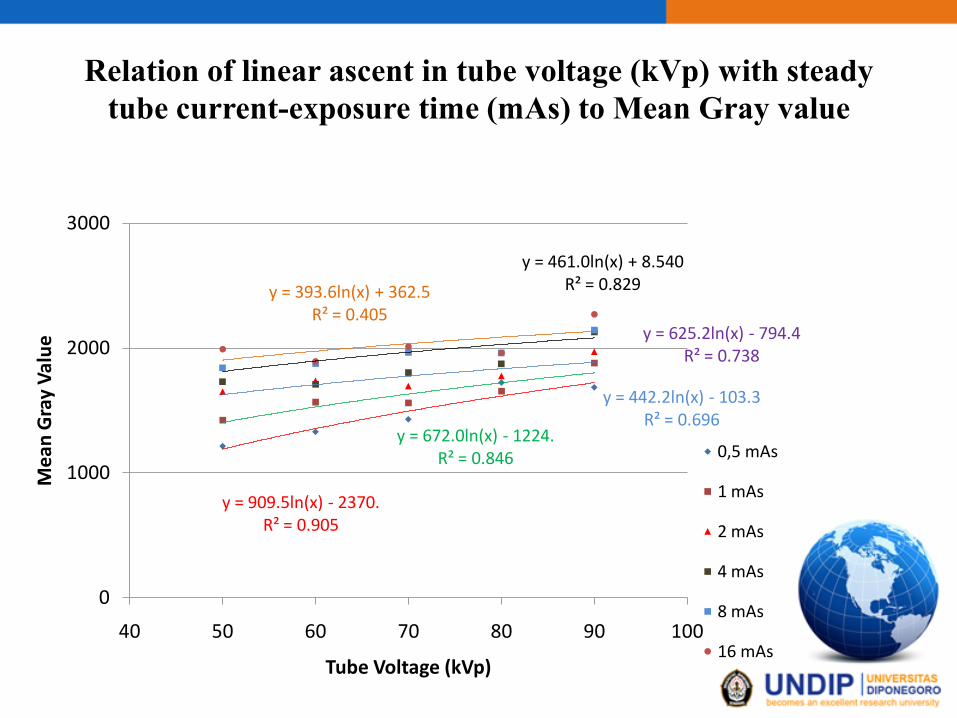
Relation of linear ascent in tube voltage (kVp) with steady
tube current-exposure time (mAs) to Mean Gray value
y = 909.5ln(x) - 2370.R² = 0.905
y = 672.0ln(x) - 1224.R² = 0.846
y = 442.2ln(x) - 103.3R² = 0.696
y = 625.2ln(x) - 794.4R² = 0.738
y = 461.0ln(x) + 8.540R² = 0.829y = 393.6ln(x) + 362.5
R² = 0.405
0
1000
2000
3000
40 50 60 70 80 90 100
Me
an G
ray
Val
ue
Tube Voltage (kVp)
0,5 mAs
1 mAs
2 mAs
4 mAs
8 mAs
16 mAs
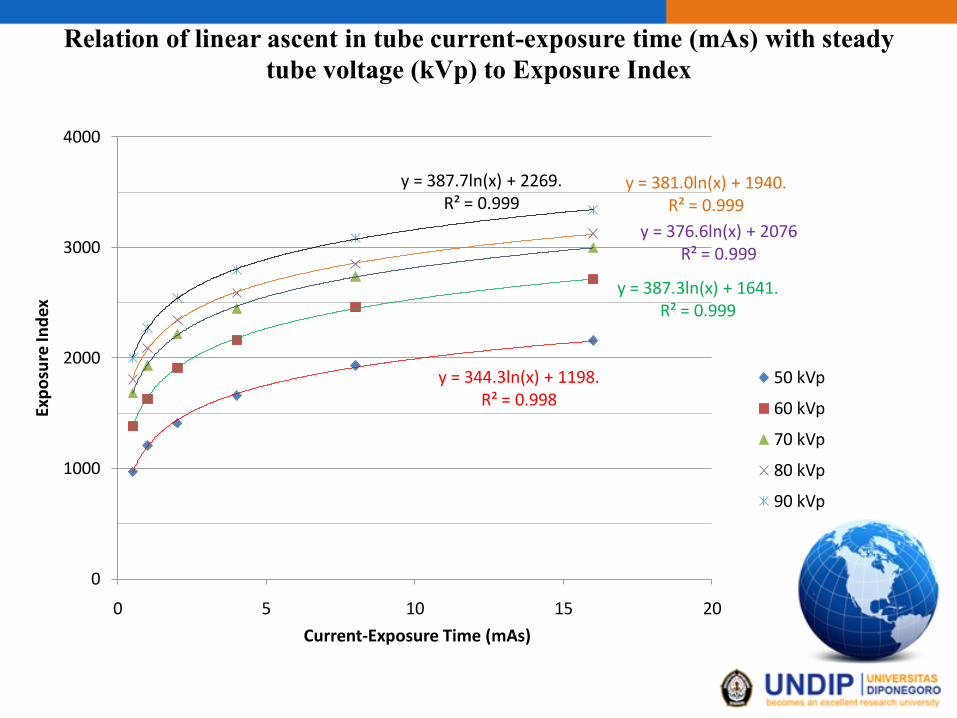
Relation of linear ascent in tube current-exposure time (mAs) with steady
tube voltage (kVp) to Exposure Index
y = 344.3ln(x) + 1198.R² = 0.998
y = 387.3ln(x) + 1641.R² = 0.999
y = 381.0ln(x) + 1940.R² = 0.999
y = 376.6ln(x) + 2076R² = 0.999
y = 387.7ln(x) + 2269.R² = 0.999
0
1000
2000
3000
4000
0 5 10 15 20
Exp
osu
re In
dex
Current-Exposure Time (mAs)
50 kVp
60 kVp
70 kVp
80 kVp
90 kVp
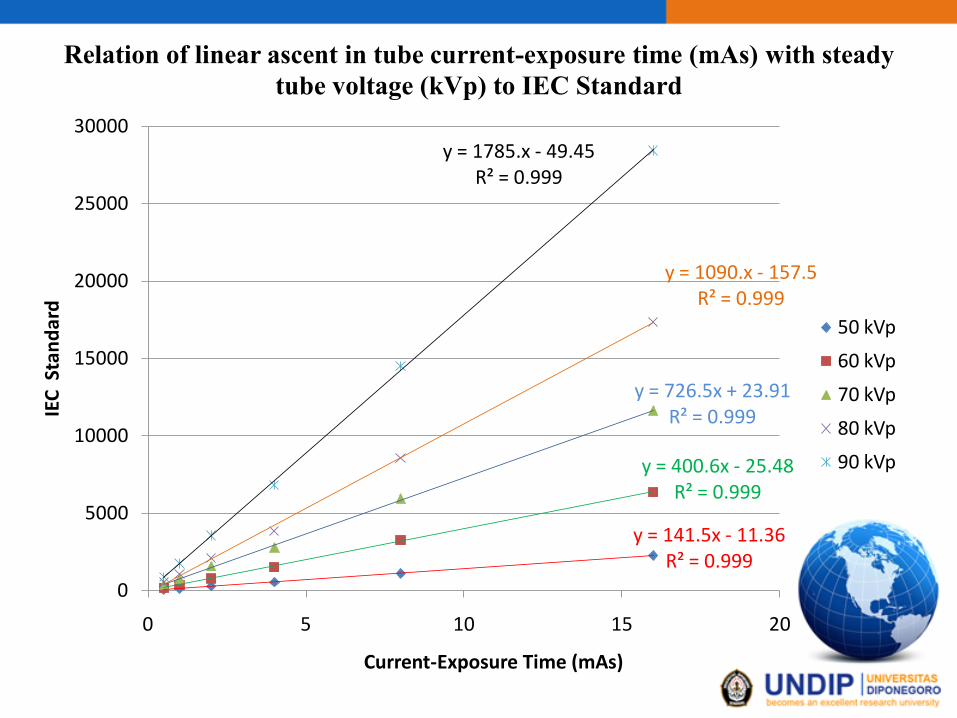
Relation of linear ascent in tube current-exposure time (mAs) with steady
tube voltage (kVp) to IEC Standard
y = 141.5x - 11.36R² = 0.999
y = 400.6x - 25.48R² = 0.999
y = 726.5x + 23.91R² = 0.999
y = 1090.x - 157.5R² = 0.999
y = 1785.x - 49.45R² = 0.999
0
5000
10000
15000
20000
25000
30000
0 5 10 15 20
IEC
Sta
nd
ard
Current-Exposure Time (mAs)
50 kVp
60 kVp
70 kVp
80 kVp
90 kVp
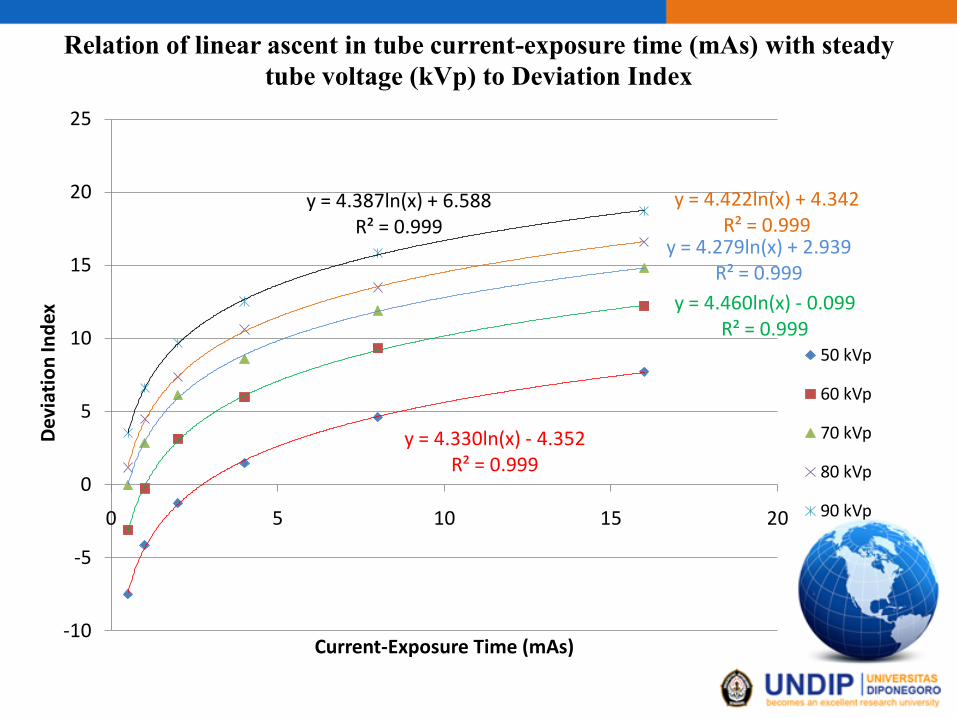
Relation of linear ascent in tube current-exposure time (mAs) with steady
tube voltage (kVp) to Deviation Index
y = 4.330ln(x) - 4.352R² = 0.999
y = 4.460ln(x) - 0.099R² = 0.999
y = 4.279ln(x) + 2.939R² = 0.999
y = 4.422ln(x) + 4.342R² = 0.999
y = 4.387ln(x) + 6.588R² = 0.999
-10
-5
0
5
10
15
20
25
0 5 10 15 20
Dev
iati
on
Ind
ex
Current-Exposure Time (mAs)
50 kVp
60 kVp
70 kVp
80 kVp
90 kVp
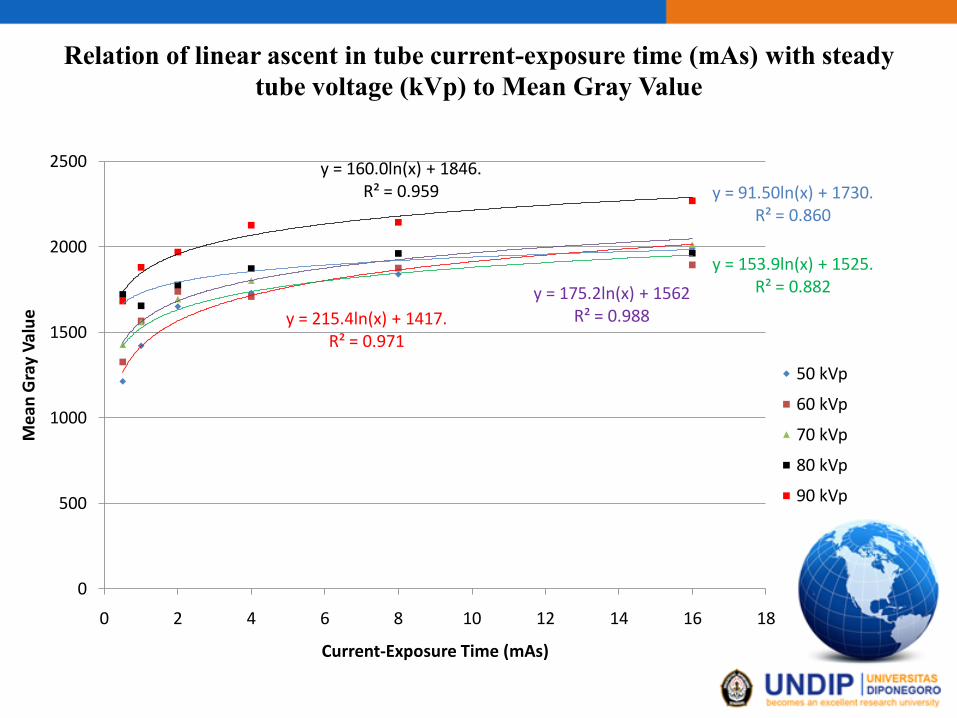
Relation of linear ascent in tube current-exposure time (mAs) with steady
tube voltage (kVp) to Mean Gray Value
y = 215.4ln(x) + 1417.R² = 0.971
y = 153.9ln(x) + 1525.R² = 0.882y = 175.2ln(x) + 1562
R² = 0.988
y = 91.50ln(x) + 1730.R² = 0.860
y = 160.0ln(x) + 1846.R² = 0.959
0
500
1000
1500
2000
2500
0 2 4 6 8 10 12 14 16 18
Mea
n G
ray
Val
ue
Current-Exposure Time (mAs)
50 kVp
60 kVp
70 kVp
80 kVp
90 kVp
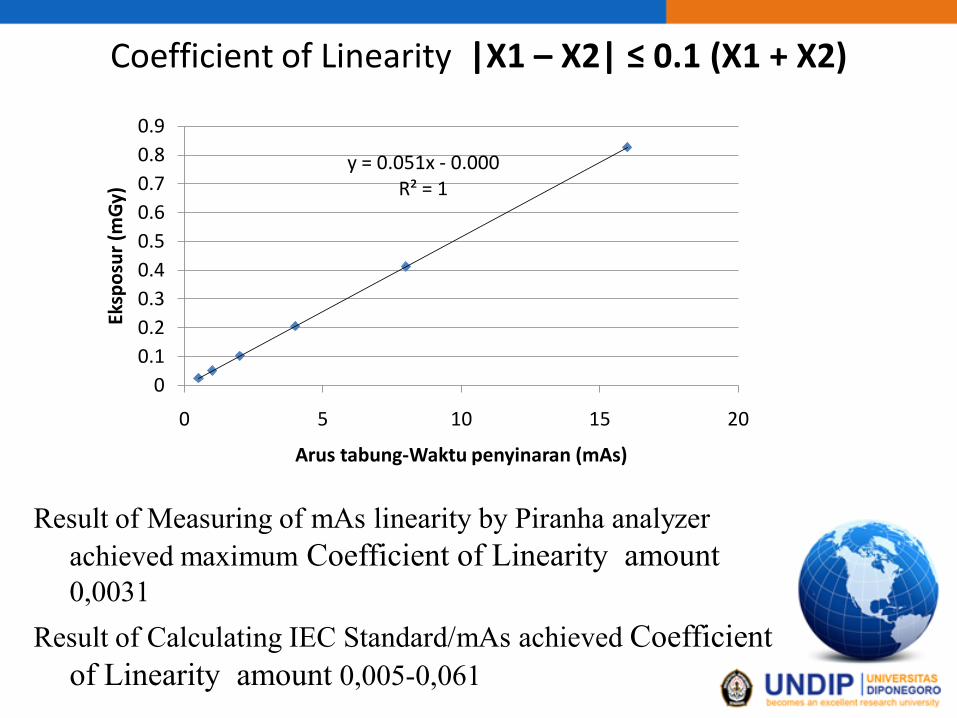
Coefficient of Linearity |X1 – X2| ≤ 0.1 (X1 + X2)
Result of Measuring of mAs linearity by Piranha analyzer
achieved maximum Coefficient of Linearity amount 0,0031
Result of Calculating IEC Standard/mAs achieved Coefficient
of Linearity amount 0,005-0,061
y = 0.051x - 0.000R² = 1
0
0.1
0.2
0.3
0.4
0.5
0.6
0.7
0.8
0.9
0 5 10 15 20
Eksp
osu
r (m
Gy)
Arus tabung-Waktu penyinaran (mAs)
CONCLUSION
• Exposure indicator in CR that used in this research is calibrated because it has linear responses to the radiation output compare to result of compliance test with Piranha Analyzer
• Linearity of mAs can be decided with a calibrated imaging plate
• Deciding a coefficient of mAs linearity can
be done with IEC Standard/mAs data.
CONCLUSION
• Determining of tube voltage accuracy with an
Exposure indicator can be done.
• Mean gray value is able to be an indicator of
mAs linearity because has a coefficient of
correlation more than 0,94.
SUGESTION
• Doing research to density of film print out in
same condition as the research.
• Doing research for the others CR vendor.

THANKS FOR THE ATTENTION