tuesday morning 9:00 am - glexpo.com · quantitiesof-si-in-the-formof-silica gel-sio2.nh2o ......
TRANSCRIPT

Strawberry I
Tuesday morning 9:00 am
Where: Grand Gallery (main level) Room A & B
MI Recertification credits: 2 (1C, COMM CORE, PRIV CORE)
OH Recertification credits: 0.5 (presentations as marked)
CCA Credits: SW(0.5) PM(0.5) CM(1.5)
Moderator: Kevin Schooley, Ontario Berry Growers
9:00 am The Intricacies of Silicon Fertilization (OH: 2B, 0.5 hr)
Richard Belanger, Laval Univ., Quebec
9:45 am Emerging Technologies: How Can These Help Strawberry Growers
Pam Fisher, Ontario Ministry of Agriculture and Food
Kevin Schooley, Ontario Berry Growers
10:15 am Getting the Most out of Your Irrigation System
Jean Caron, Univ. of Laval, Quebec
11:00 am Home Grown Innovations - Show and Tell
Scott Thompson, Thompson Strawberry Farm, Bristol, WI, Panel
Moderator
12:00 noon Session Ends

The intricacies of silicon fertilization Richard Bélanger Département de phytologie, Université Laval, Quebec, Quebec G1V 0A6, Canada [email protected] While being classified as non-essential for plant growth, silicon (Si) has long been recognized for its prophylactic properties against a wide array of biotic and abiotic stresses. However, practical use of Si has been hampered by conflicting reports about its mode of action, application, and mostly about how and what plants can benefit from Si. The recent discovery of Si transporters in rice, along with new developments in genomics and sequencing data now make it possible to investigate with precision what plant species possess the molecular tools to uptake Si from the soil. In this context, strawberry remains enigmatic because it is considered a poor accumulator of Si and yet is the subject of several reports linking Si fertilization with benefits. Over the last few months, we have investigated the presence and expression of Si transporters in strawberry, along with Si accumulation in different cultivars and the effect of Si fertilization against strawberry powdery mildew. As will be discussed in the presentation, combining molecular approaches with field applications should lead to optimal recommendations for strawberry growers interested in exploiting the beneficial properties of Si. References
• Vivancos, J., R. Deshmukh, C. Grégoire, W. Rémus-Borel, F. Belzile, & R.R. Bélanger. (2016). Identification and characterization of silicon efflux transporters in horsetail (Equisetum arvense). J. Plant Physiol. In press
• Deshmukh, R.K., J. Vivancos, G. Ramakrishnan, V. Guérin, G. Carpentier, H. Sonah, C.
Labbé, P. Isenring, F. J. Belzile, & R.R. Bélanger. (2015). A precise spacing between the NPA domains of aquaporins is essential for silicon permeability in plants. The Plant Journal. 83:489-500.
• Deshmukh, R. and R.R. Bélanger. (2015). The functional role of silicon in plant biology-
Molecular evolution of aquaporins and silicon influx in plants. Functional Ecology. Doi: 10.1111/1365-2435.12570.
• Vivancos, J., C. Labbé, J. G. Menzies & R.R. Bélanger. (2015). Silicon-mediated
resistance of Arabidopsis against powdery mildew involves mechanisms other than the salicylic acid (SA)-dependent defence pathway. Mol. Plant Pathol. 16:572-582.
• Guérin, V., Cogliati, E.E., Hartley, S.E., Belzile, F., Menzies, J.G., & Bélanger, R.R.
(2014). A zoospore inoculation method with Phytophthora sojae to assess the prophylactic role of silicon on soybean cultivars. Plant Dis. 98: 1632-1638.
• Ma, J.F., Tamai, K., Yamaji, N., Mitani, N., Konishi, S., Katsuhara, M., Ishiguro, M.,
Murata, Y., and Yano, M. (2006). A silicon transporter in rice. Nature 440: 688-691.

• Mitani-Ueno, N., Yamaji, N., Zhao, F.-J., and Ma, J.F. (2011). The aromatic/arginine
selectivity filter of NIP aquaporins plays a critical role in substrate selectivity for silicon,
boron, and arsenic. J. Exp. Bot. 62: 4391-4398.
• Fauteux, F., Rémus-Borel, W., Menzies, J.G., and Bélanger, R.R. (2005). Silicon and
plant disease resistance against pathogenic fungi. FEMS Microbiol. Lett. 249: 1-6.

16/11/2016
1
Richard Bélanger, Université LAVAL
The Intricacies of Silicon Fertilization
December 6, 2016
2016 North American Berry ConferenceGrand Rapids, Michigan
Silicon
Si14 28.086
What is Si in nature?
• Silicon: Pure Si; virtually absent in nature• Silica: SiO2 : quartz, sand, non soluble• Silicate: SiO2 mixed with sodium, calcium, aluminium and potassium• Low solubility ranging from 0.1 to 0.6 mM in soils• Silicic acid: soluble form of Si in the form Si0H4.Maximum solubility is1.7 mM at physiological pH (5-‐7). Only form that a plant can absorb
Von Sachs, 1860
Essential elements for plant growth
Macronutrients:
Micronutrients
N, P, K, S, Ca, Mg
Fe, Mn, Zn, B, Cu, Mo and Cl
« Si » is not among them…
XIXth Century…
E.g. Graminaceae
Rice and sugarcane accumulate large quantities of Si in the form of silica gel
SiO2.nH2O
Savant et al. 1999
And yet… Si content in plant tissues may varybetween 0.1 to 10%
0 50 100 150 200 250 300 350
Disease resistance
Abiotic stress tolerance
Yield and quality
Silicon as fertilizer
Pub lished repo rts
Silicon in agriculture in the literature
Over 1000 papers reporting beneficial effects…

16/11/2016
2
ü Consensus: prophylactic role
First reports in Chinese and Japanese literature in the 1920’s
First comprehensive report in USA by Wagner in 1940
ü Beneficial in many plant/pathogeninteractions
0 50 100 150 200 250 300 350
D isease re s istance
Ab io tic stre ss to le rance
Y ie ld and qua lity
S ilicon as fe rtilize r
Pub lished repo rtsHow does silicon protect
plants againstdiseases/stress?
The beneficial effects of Si appear to be correlated with the intrinsic ability of a plant to accumulate Si accumulate
ü How does silicon protectplants againstdiseases/stress?
How do plants absorb Si?
ü The beneficial effects of Si appear to be correlated with the intrinsic ability of a plant to accumulate Si
ü How does silicon protectplants againstdiseases/stress?
ü The beneficial effects of Si appear to be correlated with the intrinsic ability of a plant to accumulate Si
ü How do plants absorb Si?
ü How does silicon protectplants againstdiseases/stress?
Water flux
cortex
xylem
Silicic acid Lsi1 Lsi2
Silicon transport in plants
From the roots to the leaves: e.g. WHEAT
Only the soluble formmonosilicicacidSi(OH)4can beabsorbed by the plant

16/11/2016
3
The influx transporter Lsi1 is the essential filter for Si absorption in plants:
…plants absorb or not Si on the basis of presence of Lsi1 or not
Plants lacking Lsi1 and unable to absorb Si : • Arabidopsis • Canola • Rocket• Gerbera
Plants known to have Lsi1 and absorb Si: • Cucurbits• Rice• Sugarcane• Soybean• Others…
Silicon transport in plants
Lsi1
E.g.
Lsi1 proteins specifically belong to the nodulin 26-‐like intrinsic protein (NIPs) a sub-‐family of aquaporins
Silicon transport in plants
Lsi1
GB.C
extracellular
membrane
cytoplasmic
NPA domain
helix
water water
1
2
3
4 5
6
C N
Can we predict if a plant can absorb Si on the basis of the presence of NIP-‐III aquaporins?
Hypothesis
Identification of NIPs in 25 plant species through comparative genomics approach and phylogenetic analysis
All Known Si transporters grouped in NIP-‐III

16/11/2016
4
Maize
??
No report of significant Si accumulation in any of the species belonging to the Solanaceae
Can we predict if a plant can absorb Si on the basis of the presence of NIP-‐III aquaporins?
Hypothesis
Inability may be because of
Structural variation in protein
Tomato known as poor accumulator has putative Si transporter (SlNIP2-‐1)!
GB.C
Lsi1 structure model
108 a.a. between the two NPA loops
Structural variation in protein?
Plant species Gene ID (Froger ’s residues, NPA-‐NPAdistance) Si accumulator (Reference)
Brachypodium distachyon BdNIP2-‐1 (LTAYF, 108), BdNIP2-‐2 (LTAYF, 108) Yes (present study)
Cajanus cajan CcNIP2-‐1 (FTAYF, 108), CcNIP2-‐1 (LTAYF, 108) Yes (Hodson et al., 2005)
Carica papaya CpNIP2-‐1 (LSAYF, 108) ?
Citrus sinensis CsNIP2-‐1 (LTAYL, 43) ?
Elaeis guineensis EgNIP2-‐1 (LTAYL, 108) Yes (Gowda et al., 2004)
Fragaria vesca FvNIP2-‐1 (LTAYM, 108), FvNIP2-‐5 (LTAYV, 108) Yes (Kanto et al., 2004)
Glycine max GmNIP2-‐1 (LTAYM, 108), GmNIP2-‐5 (LTAYV, 108) Yes (present study)
Musa acuminate MaNIP2-‐1 (LTAYF, 108), MaNIP2-‐2 (LTAYL, 108), MaNIP2-‐3 (LTAYF, 108), MaNIP2-‐4 (LTAYF, 108)
Yes (Henriet et al., 2006)
Oryza sativa OsNIP2-‐1 (ITAYF, 108), OsNIP2-‐2 (LTAYF, 108) Yes (Ma et al., 2006)
Prunus persica PpNIP2-‐1 (LTAYV, 108) Yes (LeBlond et al., 2011)
Populus trichocarpa PtNIP2-‐1 (LTAYL, 108) Yes (present study)
Ricinus communis RcNIP2-‐1 (LTAYI, 108) ?
Sorghum bicolor SbNIP2-‐1 (LTAYF, 108), SbNIP2-‐2 (LTAYF, 108) Yes (Lux et al., 2002)
Setaria italic SiNIP2-‐1 (LTAYF, 108), SiNIP2-‐2 (LTAYF, 108) Yes (Weichenthal et al., 2003)
Solanum lycopersicum SlNIP2-‐1 (LSAYI, 109) No (present study)
Vitis vinifera VvNIP2-‐1 (LTAYA, 108) Yes (Blaich and Grundhofer, 1997)
Zea mays ZmNIP2-‐1 (LTAYF, 108), ZmNIP2-‐2 (LTAYF, 108), ZmNIP2-‐3 (LTAYF, 108), ZmNIP2-‐4 (LTAYF, 108)
Yes (Morales et al., 2005)
Citrus sinensis CsNIP2-‐1 (LTAYL, 43) ?
Solanum lycopersicum SlNIP2-‐1 (LSAYI, 109) No (present study)
Structural variation in protein?
Does spacing between NPA domains regulate Si permeability?
Hypothesis
Functional evaluation of NIP2-‐1 genes with different NPA spacing was done by heterologous expression

16/11/2016
5
Functional evaluation of genes with different NPA spacings
o Species confirmed for Si uptake ability
o Candidate genes cloned from poplar and tomato: mutation and heterologous expression in Xenopus oocytes
Results
108
108
109 43
Functional evaluation of genes with different NPA spacings
o Species confirmed for Si uptake ability
o Candidate genes cloned from poplar and tomato: mutation and heterologous expression in Xenopus oocytes
Effect of NPA spacing changes in poplar
Spacing between NPA domains was changed from 108 to 107 and 109 either by adding or removing 1 a.a. in PtNIP2-‐1 of poplar Loss of function
Sl_wildtypeSl_mutant
Sl_wildtypeSl_mutant
Sl_wildtypeSl_mutant
N C
TM1 TM2 TM3 TM4 TM5 TM6LA LB LC LD LE
G S G R
NPA
NPAVal
Attempt to create functional protein in tomato
Si uptake in oocytes
Effect of NPA spacing changes in tomato
Gain of function
16/11/2016
6
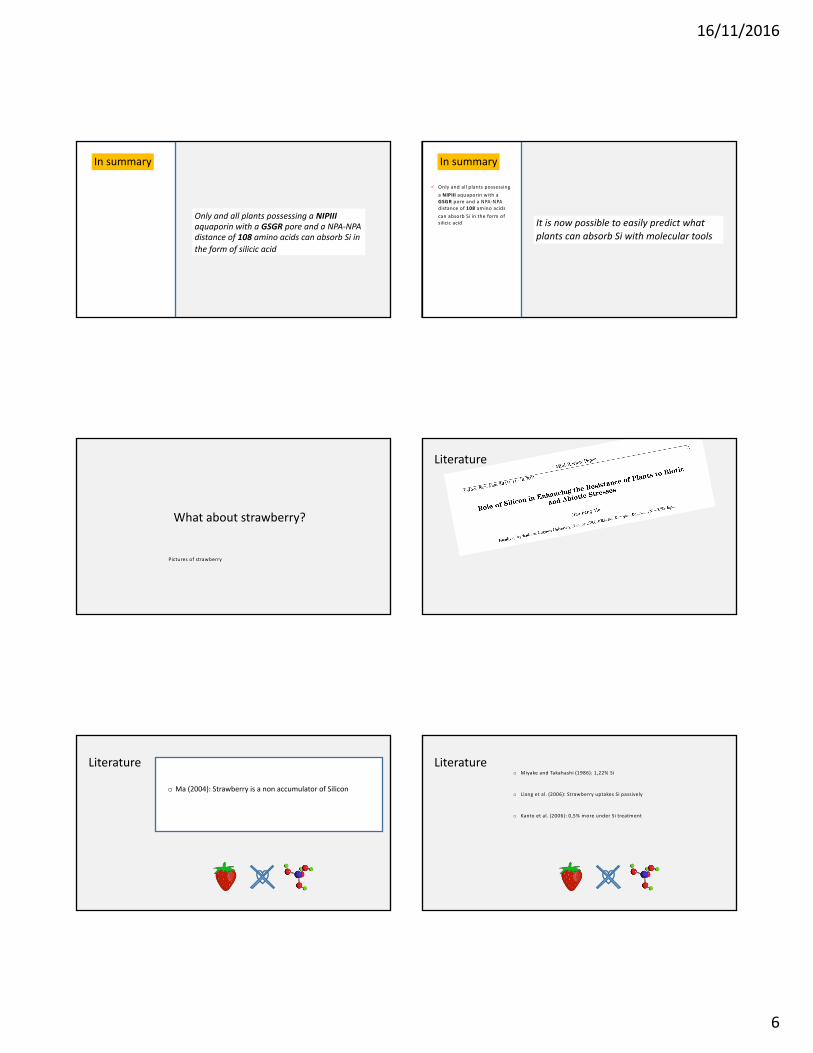
In summary
Only and all plants possessing a NIPIIIaquaporin with a GSGR pore and a NPA-‐NPA distance of 108 amino acids can absorb Si in the form of silicic acid
In summary
ü Only and all plants possessing a NIPIII aquaporin with a GSGR pore and a NPA-‐NPA distance of 108 amino acids can absorb Si in the form of silicic acid It is now possible to easily predict what
plants can absorb Si with molecular tools
What about strawberry?
Pictures of strawberry
Literature
Literature
o Ma (2004): Strawberry is a non accumulator of Silicon
Literature
o Kanto et al. (2006): 0,5% more under Si treatment
o Miyake and Takahashi (1986): 1,22% Si
o Liang et al. (2006): Strawberry uptakes Si passively

16/11/2016
7
Full aquaporin analysis in
Fragaria vescaSr. No
Manually assigned features based on protein sequence alignment
NPA-‐NPA Distance
NPA (LB) NPA (LE)Ar/R filters
H2 H5 LE1 LE2 TM
FvNIP1-1 NPA NPA W V A R 6 109FvNIP1-2 NPA NPA W V A R 6 126FvNIP1-3 NPA NPA W A A R 6 110FvNIP1-4 NPA NPA W V A R 6 109FvNIP1-5 NPA NPA W V A R 6 109FvNIP2-1 --- NPA G S G R 3FvNIP2-2 NPA NPA G S G R 6 109FvNIP2-3 NPA --- G S - - 3
FvNIP2-4 NPA NPA G S G R 6 108FvNIP2-5 NPA NPA G S G R 6 108FvNIP3-1 NPA NPA A V G R 6 108FvNIP3-2 NPA NPV T I A R 6 108FvNIP3-3 NPS NPV A I G R 6 108FvNIP5-1 NPS NPA S I A R 6 108
Genomic search for Lsi1 candidate proteins
FvNIP2-4 NPA NPA G S G R 6 108FvNIP2-5 NPA NPA G S G R 6 108
>FAN_iscf00233045.1.g00001.1_(+1)GGLIVTVMIYAVGHISGAHMNPAVTIAFATFRHFPWKQIGELAGIAVGSAVCITSIFAGPISGGSMNPARTIGPALASAYYNGVWIYMVGPVIGALLGAWSYSFIRVNDKPVQASSPRSLSLQLRRIKSDVNVQAVSICKDPLDFA*
>FAN_iscf00346118.1.g00002.1_(+1)MARTELVSVENPIVEHPFYPPGFLKKVVAEIIATFLLVFVTCGSSALSASDERKVSKLGASMTGGLIVTVMIYAVGHISGAHMNPAVTIAFATFRHFPWKMSKSSESNSDGRVHVCPRDVPDCVDHHRHYKPSGGSMNPARTIGPALASAYYNGIWIYMVGPVIGALLGAWSYSFIRVNDKPVQASPPRSLSLQLRRIKSDVNVQAVSICKDPLDFA*
Homologous genes found in
Fragaria ananassa ALIGNMENT
In theory , strawberry has the proper genetic tools to absorbsilicic acid from the soil…
The role of silicon in the suppression of strawberry powdery mildew

16/11/2016
8
Experimental designSeascapeCharlotteMontereyAlbionAmandineVerity
Ø Day neutral cultivars
Ø Silicon amendment: Liquid potassium silicate (Kasil©) at a concentration of 1.7 mM
Analyses:
Yield and fruit quality
Silicon content
Powdery mildew incidence
Natural powdery mildew infectionØ Disease: Silicon content analysis
Powdery mildew incidence Yield and fruit quality
In conclusion
Strawberry has the proper genetic tools (aquaporins) to absorb Si
During the course of a season, strawberry plants can absorb as much as 3% Si
Silicon feeding had an excellent prophylactic role againstpowdery mildew on strawberry, which led to a better yield
Constant supply of Si in the form of silicic acid is preferable to maximize absorption

2016‐11‐22
1
Getting the Most out of Your Irrigation System in Strawberry
Jean Caron, Lelia Anderson, Guillaume Sauvageau and Laurence GendronUniversité Laval, Département des Sols et de Génie AgroalimentaireCorresponding author: [email protected]
Great Lakes Fruit, Vegetable & Farm Market EXPO Michigan Greenhouse Growers EXPO December 6 ‐ 8, 2016
DeVos Place Convention Center, Grand Rapids, MI
Introduction
86% of the strawberry of North America grown in California, along with Florida (7%) and Québec (3.5%) and Ontario (3.5%)
Water is becoming increasingly scarce in California, and under increasing controlled use elsewhere.
Introduction
Cuts may be imposed to strawberry growers to save water, with
limited information on the impact on crop yield.
This also increases pressure to get more crop per drop
A new approach was recently proposed to manage irrigation and
offers the opportunity to maximize yield and generate water savings
without affecting yield, getting the most of your irrigation system
Daily or Weekly estimates of past eventsto estimate water use (ET)Newer
Real time water use(flux –tension based)
Two commonly used approaches to run irrigation: water flux from soil to the plant or estimated uptake from
weather conditions or from change in soil weight
Evapotranspiration (ETo):Evapotranspiration (ETo):
• ETo is the loss of water by evaporation (from soil and plant surfaces) and transpiration (from plant tissues)
• Estimates of Et for a specific crop and area are used for irrigation scheduling:
Crop Et = ETo x Kc
Daily or Weekly estimates of past eventsto estimate water use (ET)Newer
Real time water use(flux –tension based)
Two commonly used approaches to run irrigation: water flux from soil to the plant or estimated uptake from
weather conditions or from change in soil weight
2016‐11‐22
2
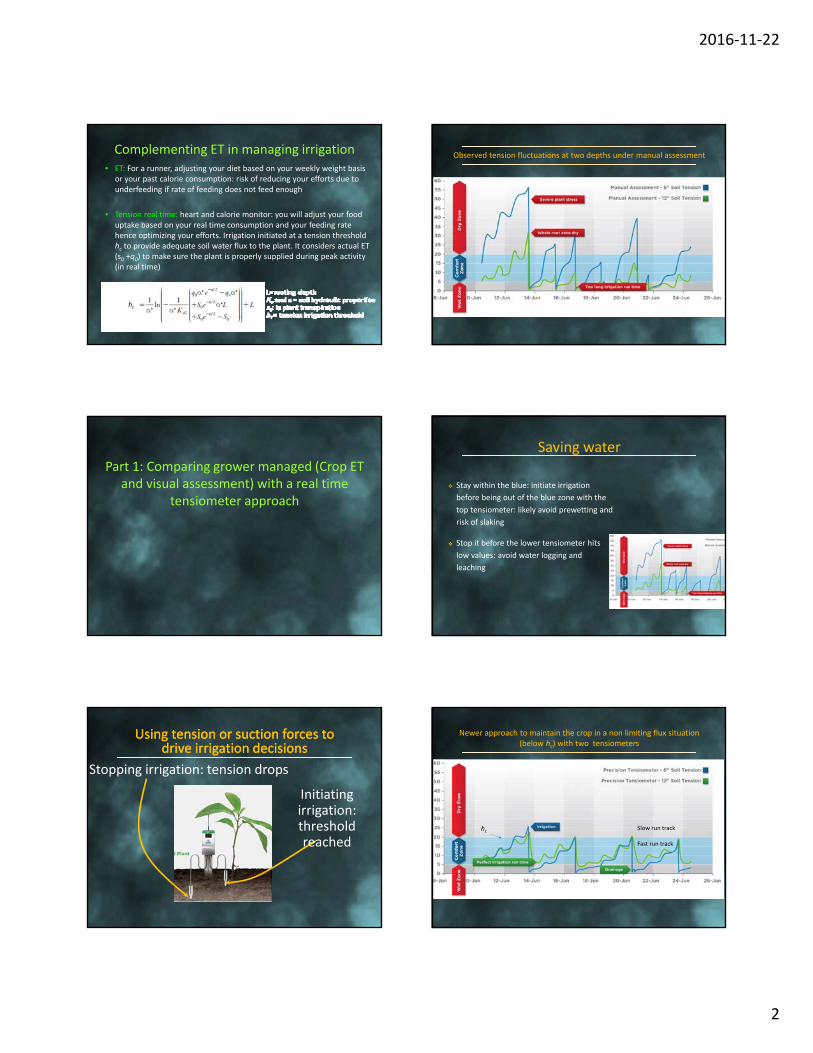
Complementing ET in managing irrigation• ET: For a runner, adjusting your diet based on your weekly weight basis
or your past calorie consumption: risk of reducing your efforts due to underfeeding if rate of feeding does not feed enough
• Tension real time: heart and calorie monitor: you will adjust your food uptake based on your real time consumption and your feeding rate hence optimizing your efforts. Irrigation initiated at a tension threshold hc to provide adequate soil water flux to the plant. It considers actual ET (s0 +q0) to make sure the plant is properly supplied during peak activity (in real time)
hc
Part 1: Comparing grower managed (Crop ET and visual assessment) with a real time
tensiometer approach
Using tension or suction forces to drive irrigation decisions
Using tension or suction forces to drive irrigation decisions
Stopping irrigation: tension drops
Initiating irrigation: threshold reached
Observed tension fluctuations at two depths under manual assessment
Saving water
Stay within the blue: initiate irrigation
before being out of the blue zone with the
top tensiometer: likely avoid prewetting and
risk of slaking
Stop it before the lower tensiometer hits
low values: avoid water logging and
leaching
Newer approach to maintain the crop in a non limiting flux situation (below hc) with two tensiometers
Slow run track
Fast run track
hc

2016‐11‐22
3
Irrigation treatments applied though the growth cycle
(CRBD with 5 replicates)
Comparing irrigation threshold to initiate irrigation (top of the blue band)
Determine hc to get top yield irrespective of water use (2011-2014)
Establishment small roots & low ETC deep rooting & large canopy
‐35 kPa
Parameters Measured
Yield in sub‐sampling sites
Size of the fruits (caliber)
Fruit quality using Brix index
Plant size (canopy area)
Leaf Water Potential (SWP) using
pressure chamber
Leaf temperature with infrared thermometer
Plant performance and hydric stress measurements (Weekly measurements from January to June)
Plant performance and hydric stress measurements (Weekly measurements from January to June)
Parameters Measured
Soil sampling and soil analysis (3 soil samples/plot)Initial properties
Texture Saturated Hydraulic Conductivity (Ksat) Soil Water Retention Curves Salinity (Electrical Conductivity (EC)) and pH
Weekly determination Soil salinity from SSE method (1: 1 suspension) Soil salinity (EC) using suction lysimeter Amount of water/ha using flowmeters (non replicated though)
Initial properties
Texture Saturated Hydraulic Conductivity (Ksat) Soil Water Retention Curves Salinity (Electrical Conductivity (EC)) and pH
Weekly determination Soil salinity from SSE method (1: 1 suspension) Soil salinity (EC) using suction lysimeter Amount of water/ha using flowmeters (non replicated though)
Results for 2012 to 2015 in California and Québec
Plant performance and water used(Weekly measurements from January to June)
15 minute real time soil water potential at 15 cm and 30 cm(3 reps) using wireless Hortau tensiometers
Irrigation initiated by the irrigator (2012,13, 14) or automated (2015)
Plant performance and water used(Weekly measurements from January to June)
15 minute real time soil water potential at 15 cm and 30 cm(3 reps) using wireless Hortau tensiometers
Irrigation initiated by the irrigator (2012,13, 14) or automated (2015)
Watsonville Salinas Oxnard
Soil seriesClear Lake clay
Salinas Clay and
Mocho silty loam
Hueneme sandy
loamYield difference
from optimum thresholds
16% (8,000 pounds
per acre)17% 14%
Optimum tension
cbars (top of blueband)
10 13 8
Acre foot/Acre
difference betweentreatments
0.30 0.15 0.15
Percentage of crop
ET for top yield 75 49 114
Effects of real time irrigation management on strawberry production:
Real-time irrigation: summarizingReal-time irrigation: summarizingReal time management:
Irrigation triggered
Irrigation stopped before leachingFast leaching = 0 kPa
Etc management:
Irrigation triggered too late
Too long irrigation = leachingand waterlogging

2016‐11‐22
4
Yield IncreaseRelative to Grower
Year Soil Type Region Grower ‐10 kPa (%)
2011 Clay CA 100 93 0
Wastonville 2013 Clay CA 144 84 0
2014 Clay CA 83 83 26
2012 Silty Clay Loam CA 163 68 17
2012 Silty Clay Loam CA 100 114 14
2013 Sandy Loam CA 93 128 6
2014 Sandy Loam CA 100 154 7
2012 Gravelly Clay Loam QC 35 42 20
2013 Gravelly Clay Loam QC 49 42 18
2014 Gravelly Clay Loam QC 52 63 0
112 103 10CA: California; QC: Québec
Water Used% of crop ET
Average Water Use in Percentage of Crop ET (CA only):
Salinas
Oxnard
Île d'Orléans
Flux is important to be maintained non limiting through irrigation
Analyse statistique
Fig. 2. Predicted total fresh market yield (1 kgha-1 = 0.89 lbac-1) from average soil matric potential reached before irrigations using data from seven experimental sites (centered regression line).
Soil Matric Potential (kPa)
Fre
sh M
arke
t Yie
ld (
kgha
-1)
R2adj = 0.86
Analyse statistique
Fig. 3. Frequency distribution of average soil matric potentials reached before irrigations considering eight treatments under conventional irrigation management. Treatments consisted of the grower standard procedure, which aimed at applying 100% of crop ET, and of the treatment based on 100% of crop ET.
0
1
2
3
0-10 11-20 21-30 31-40 41-50
Fre
quen
cy D
istr
ibut
ion
of
Soi
l Mat
ric
Pot
enti
als
Intervals of Soil Matric Potential (-kPa)
Field Number
1 2 3 4 5 6 7 8 9 10 11 12 13 14 15 16 17
App
lied
Wat
er (
% o
f cro
p E
T )
0
20
40
60
80
100
120
140
160
Average = 94% Crop ET
Field Number
1 2 3 4 5 6 7 8 9 10 11 12 13 14
Ap
plie
d W
ate
r (%
Cro
p E
T)
0
50
100
150
200
250
January - October
Avg = 146%
Percentage of crop ET applied by growers in 2010 and 2011 in the Watsonville area (drawn from Cahn, 2012)
2010 2011
LOSSES GAINSREDUCED INCOMES INCREASED INCOMES
Yield Gain lbac -1 lb supp. $lb -1 ($)1 290 64 500 1.00 64 500
INCREASED COSTS REDUCED COSTSIncreased Variable Costs Reduced Variable Costs
$lb -1 ($) acftac -1 Tot. Water $acft -1 ($)Operating Costs 0.50 32 250 Water Savings 0.20 10 150 1 500
Increased Fixed Costs Reduced Fixed CostsWireless Tensiometer Technology ($) ᴑ Depreciation (0% intesrest) 4 896 24 480 $ / 5 years ᴑ Annual Service Fees 3 000 ᴑ Initial Costs (Shipping & Installation) 195 975 $ / 5 years
($) ($)Total 40 341 Total 66 000
Payback Period: 0.8 year
ø
Net Change in Profit : 25 659 $
ø
→
Cost-benefit Analysis –Case study of a 50-acre farm
Assumption: conventional management triggers irrigation at -15 kPa, on average. We are looking at the gains and losses associated with the management based on tension at -10 kPa compared to conventional management at -15 kPa, for a 50 acre-farm.
Part 2: Using a real time tensiometer approach to manage deficit irrigation
2016‐11‐22
5
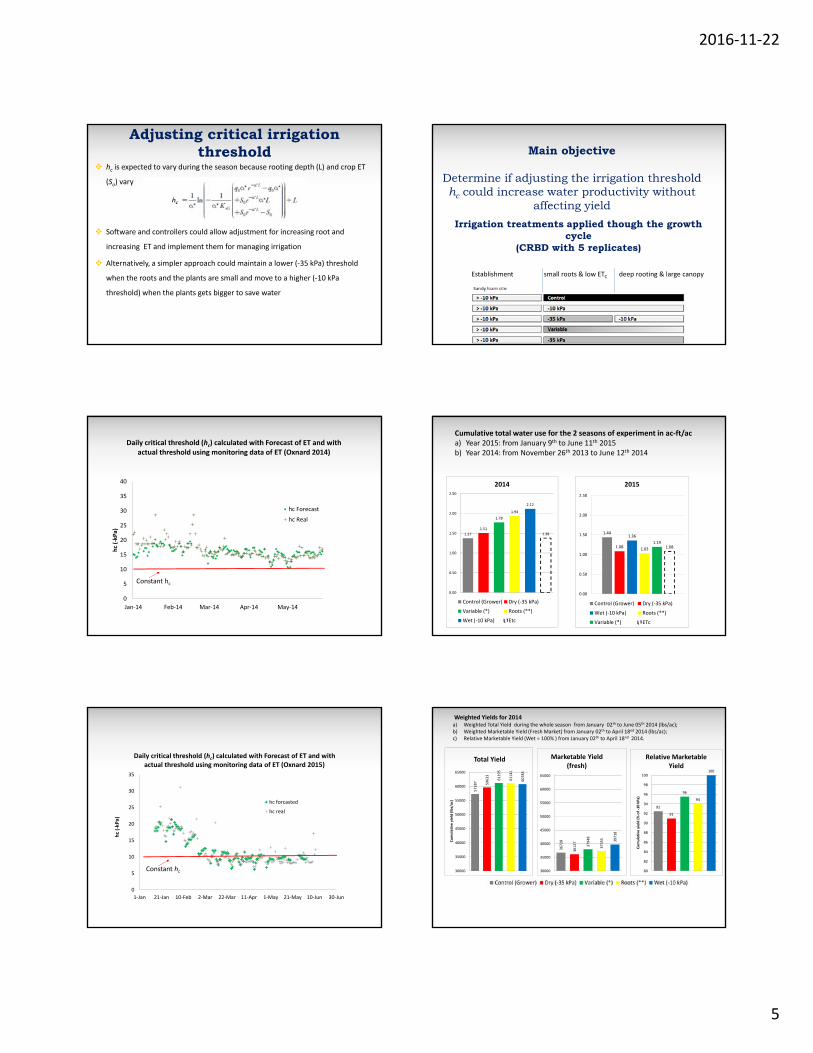
hc is expected to vary during the season because rooting depth (L) and crop ET
(So) vary
Software and controllers could allow adjustment for increasing root and
increasing ET and implement them for managing irrigation
Alternatively, a simpler approach could maintain a lower (‐35 kPa) threshold
when the roots and the plants are small and move to a higher (‐10 kPa
threshold) when the plants gets bigger to save water
Adjusting critical irrigation threshold
0
5
10
15
20
25
30
35
40
Jan‐14 Feb‐14 Mar‐14 Apr‐14 May‐14
hc(‐kPa)
Daily critical threshold (hc) calculated with Forecast of ET and with actual threshold using monitoring data of ET (Oxnard 2014)
hc Forecast
hc Real
Constant hc
0
5
10
15
20
25
30
35
1‐Jan 21‐Jan 10‐Feb 2‐Mar 22‐Mar 11‐Apr 1‐May 21‐May 10‐Jun 30‐Jun
hc (‐kPa)
Daily critical threshold (hc) calculated with Forecast of ET and with actual threshold using monitoring data of ET (Oxnard 2015)
hc forcasted
hc real
Constant hc
Irrigation treatments applied though the growth cycle
(CRBD with 5 replicates)
Main objective
Determine if adjusting the irrigation threshold hc could increase water productivity without
affecting yield
Establishment small roots & low ETC deep rooting & large canopy
1.37
1.51
1.78
1.94
2.12
1.38
0.00
0.50
1.00
1.50
2.00
2.50
2014
Control (Grower) Dry (‐35 kPa)
Variable (*) Roots (**)
Wet (‐10 kPa) Etc
1.44
1.08
1.36
1.03
1.191.08
0.00
0.50
1.00
1.50
2.00
2.50
2015
Control (Grower) Dry (‐35 kPa)
Wet (‐10 kPa) Roots (**)
Variable (*) ETc
Cumulative total water use for the 2 seasons of experiment in ac‐ft/aca) Year 2015: from January 9th to June 11th 2015b) Year 2014: from November 26th 2013 to June 12th 2014
Weighted Yields for 2014a) Weighted Total Yield during the whole season from January 02th to June 05th 2014 (lbs/ac);b) Weighted Marketable Yield (Fresh Market) from January 02th to April 18nd 2014 (lbs/ac);c) Relative Marketable Yield (Wet = 100% ) from January 02th to April 18nd 2014.
57287 59633
61195
61141
60783
30000
35000
40000
45000
50000
55000
60000
65000
Cumulative
yield (lbs/ac)
Total Yield
92
91
96
94
100
80
82
84
86
88
90
92
94
96
98
100
Cumulative
yield (% of ‐10 kPa)
Relative MarketableYield
36728
36127
37948
37355 39718
30000
35000
40000
45000
50000
55000
60000
65000
Marketable Yield (fresh)

2016‐11‐22
6
54611
54258
56121
56225
57589
31000
36000
41000
46000
51000
56000
61000
Weigther 2015 Yields in lbs/ac
Total Yield (fresh + freezer)
34721
32923
34280
36123
36560
31000
36000
41000
46000
51000
56000
61000
Marketable Yield (fresh)
0.95
0.90
0.94
0.99
1.00
0.8
0.9
0.9
0.9
0.9
0.9
1.0
1.0
1.0
1.0
Relative Yield (Wet = 1.00)
Relative Marketable Yield (fresh)
Weighted Yields for 2015a) Weighted Total Yield (Fresh Market = Freezer) during the whole season (January 9th to June 11th 2015);b) Weighted Marketable Yield (Fresh Market) from January 9th to April 2nd 2015;c) Relative Marketable Yield (Wet = 1.00) from January 9th to April 2nd .
Summary of the performances for both years
Irrigation treatments Relative yield1 Water used
% acre‐foot per acre
Grower 91 1.41
‐10 kPa 100 1.74
‐35 kPa 93 1.30
Partial deficit
Roots 94 1.51
Variable 98 1.49
Reference ET ‐ 1.23
1Main effects significant at p=0.05
Treatments
Water use efficiency and relative yield
Statistical analyses were performed using proc mixed and proc GLM in SAS (p<0,05).
Step Wet 50% ET 100% ET Grower
Yield (% of 100% ET) 95 ab 105 a 76 c 100 a 83 bc
Water use efficiency (kg/ha.cm) 1539 a 1407 a 1531 a 1109 b 1208 b
Clay loam
Sandy loam
Statistical analyses were performed using proc mixed and proc GLM in SAS (p<0,05).
Step Dry Variable Wet Grower
Yield (% of Grower) 104 a 105 a 110 a 111 a 100 a
Water use efficiency (kg/ha.cm) 1229 a 1187 a 1118 a 996 b 846 c
Analyse statistique
Fig. 1. Effect of (1) average soil matric potential reached before irrigations and (2) irrigation management method on predicted total WU (1 acft.ac-1 = 3047 m3ha-1) using data from eight experimental sites (centered regression line).
Soil Matric Potential (kPa)
° Conventional Management + Ѱ-based Management
Wat
er U
se (
m3 h
a-1)
R2adj = 0.91
2016‐11‐22
7
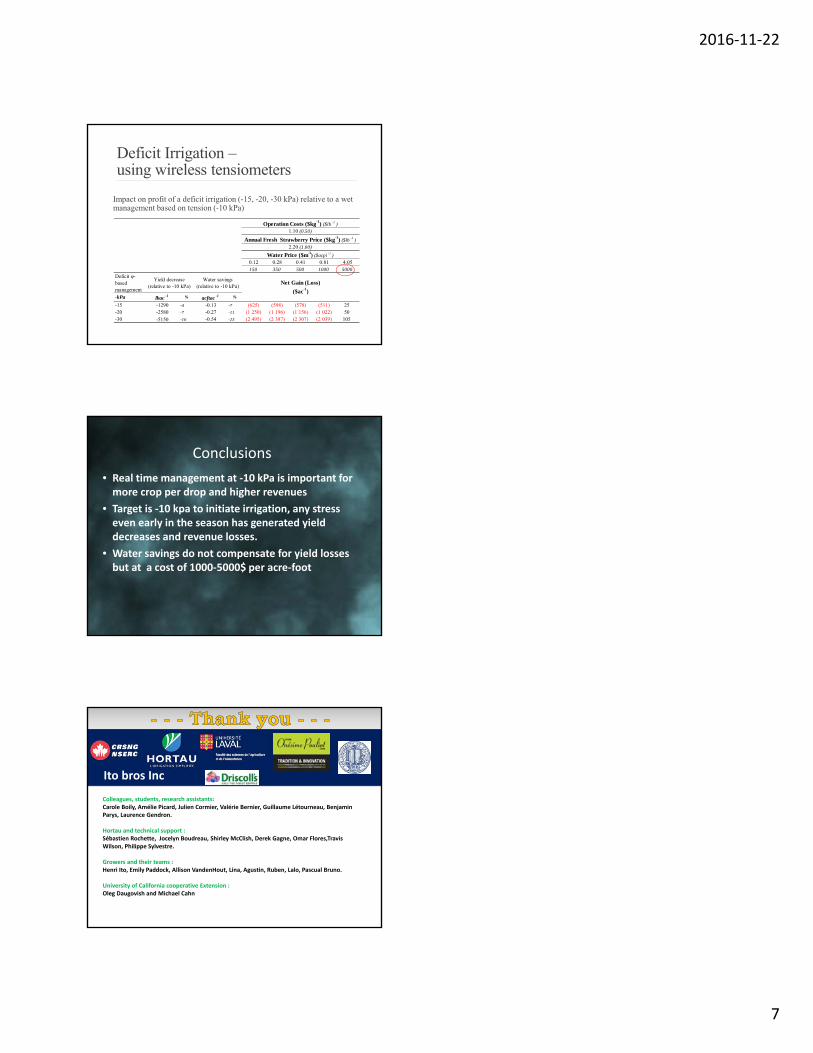
0.12 0.28 0.41 0.81 4.05150 350 500 1000 5000
Deficit ѱ-based management
-kPa lbac -1 % acftac -1 %
-15 -1290 -4 -0.13 -7 (625) (598) (578) (511) 25-20 -2580 -7 -0.27 -11 (1 250) (1 196) (1 156) (1 022) 50-30 -5150 -16 -0.54 -23 (2 495) (2 387) (2 307) (2 039) 105
Yield decrease (relative to -10 kPa)
Water savings (relative to -10 kPa)
Net Gain (Loss)
($ac-1)
Operation Costs ($kg-1) ($lb -1 )
1.10 (0.50)
Annual Fresh Strawberry Price ($kg-1) ($lb -1 )
2.20 (1.00)
Water Price ($m-3) ($acpi -1 )
Deficit Irrigation –using wireless tensiometers
Impact on profit of a deficit irrigation (-15, -20, -30 kPa) relative to a wet management based on tension (-10 kPa)
Conclusions
• Real time management at ‐10 kPa is important for more crop per drop and higher revenues
• Target is ‐10 kpa to initiate irrigation, any stress even early in the season has generated yield decreases and revenue losses.
• Water savings do not compensate for yield losses but at a cost of 1000‐5000$ per acre‐foot
Ito bros Inc
Colleagues, students, research assistants: Carole Boily, Amélie Picard, Julien Cormier, Valérie Bernier, Guillaume Létourneau, Benjamin Parys, Laurence Gendron.
Hortau and technical support :Sébastien Rochette, Jocelyn Boudreau, Shirley McClish, Derek Gagne, Omar Flores,TravisWilson, Philippe Sylvestre.
Growers and their teams : Henri Ito, Emily Paddock, Allison VandenHout, Lina, Agustin, Ruben, Lalo, Pascual Bruno.
University of California cooperative Extension : Oleg Daugovish and Michael Cahn