tui agfinancial year 2006 interim report 1 january – 30 ......q3 2006 1 tui group in figures €...
TRANSCRIPT

TUI AGKarl-Wiechert-Allee 430625 HanoverGermany
TUI AG Financial Year 2006Interim Report 1 January – 30 September 2006

Economic Situation
■ General economic situation 2
■ Consolidated turnover and earnings 2
Turnover by divisions 2
Earnings by divisions 3
Adjusted earnings 4
Group profit 5
■ Events after the closing date 5
■ Development of the divisions
Tourism 6
Shipping 13
Central operations 15
Discontinuing operations 15
■ Group profit 16
■ Net assets and financial position 19
■ Other segment ratios 21
■ Prospects 22
■ Corporate Governance 23
Financial Statements
■ Financial statements
Consolidated profit and loss statement 24
Consolidated balance sheet 26
Statement of recognised income and expenses 27
Cash flow statement 27
■ Notes
Accounting principles 28
Group of consolidated companies 29
Discontinuing operations 31
Notes on the consolidated profit and loss statement 33
Notes on the consolidated balance sheet 34
Changes in equity 35
Contingent liabilities 36
Other financial liabilities 36
Notes on the cash flow statement 36
Statements of changes in equity 37
Segment ratios 37
■ Reservation concerning
future-related statements 39
Table of Contents
Financial calendar 2007
Annual Press Conference 2007 21 March 2007Annual General Meeting 2007 16 May 2007
Imprint
TUI AGKarl-Wiechert-Allee 430625 HanoverGermany
Phone +49.511.566-00Fax +49.511.566-1901E-Mail [email protected] www.tui-group.com
The German version of this report is legally binding. The Company cannot be heldresponsible for any misunderstandings or misinterpretation arising from this trans-lation. Both versions are available on the web: www.tui-group.com

Q3 2006
1
TUI Group in Figures€ million Q3 2006 Q3 2005 9M 2006 9M 2005 Var. %
Continuing operationsTurnover 6,740 6,223 16,242 13,793 + 17.8EBITDAR 993 1,052 1,927 1,639 + 17.6EBITDA 692 829 1,067 1,065 + 0.2EBITA 529 708 548 713 - 23.1of which tourism 584 583 653 521 + 25.3
shipping - 25 95 - 91 218 n. m.central operations - 30 30 - 14 - 26 + 46.2
Discontinuing operationsEBITA 6 61 29 151 - 80.8
GroupEBITA 535 769 577 864 - 33.2Adjusted EBITA 543 715 508 787 - 35.5Group profit 299 604 247 564 - 56.2Basic earnings per share (in €) + 1.09 + 2.98 + 0.83 + 2.88 - 71.2Capital expenditure 145 174 641 611 + 4.9Equity ratio (30 Sept) (in %) – – 26.6 28.5 - 5.2Employees (30 Sept) – – 61,840 66,199 - 6.6
bEarnings by tourism matching 2005 levels in the third quarter.
bIntegration of CP Ships virtually completed.
bEarnings by shipping impacted by persistently difficult market environment and integration costs.

2
General economic situation In the second half of the year, the world economy ran out of steam. The US sawa decline in overall economic capacity utilisation and a weakening of private con-sumption. While production growth also slowed down in Japan, the eurozone con-tinued to record strong economic expansion. However, GDP growth rates in theeurozone topped out in mid 2006 since global economic stimuli weakened andeconomic activity was curbed by the tight monetary policies in almost all industrialisedcountries. The emerging markets in Asia and Latin America continued their robustgrowth path but saw a slowdown in expansion from its recently fast pace due tothe development in the US.
Consolidated turnover and earnings
Turnover by divisions€ million Q3 2006 Q3 2005 9M 2006 9M 2005 Var. %
Tourism 5,160.8 5,285.8 11,312.9 11,294.3 + 0.2Central Europe 2,137.5 2,155.8 4,597.2 4,510.2 + 1.9Northern Europe 1,743.4 1,820.9 3,893.3 3,945.6 - 1.3Western Europe 1,069.9 1,048.1 2,306.3 2,245.3 + 2.7Destinations 206.8 196.5 445.2 406.8 + 9.4Other tourism 3.2 64.5 70.9 186.4 - 62.0Shipping 1,511.0 873.3 4,756.4 2,307.3 + 106.1Central operations 67.9 63.6 172.5 191.5 - 9.9Continuing operations 6,739.7 6,222.7 16,241.8 13,793.1 + 17.8Trading – 252.1 401.0 747.6 - 46.4Special logistics – 109.2 – 325.3 –Discontinuing operations – 361.3 401.0 1,072.9 - 62.6Turnover by divisions 6,739.7 6,584.0 16,642.8 14,866.0 + 12.0
Consolidated turnover of the TUI Group’s continuing operations – tourism, shippingand central operations – was at € 6.74 billion (previous year: € 6.22 billion), 8.3%up year-on-year in the third quarter of 2006. In the first three quarters of 2006,Group turnover totalled € 16.24 billion (previous year: € 13.79 billion), an increaseof 17.8%.
The main growth driver in the third quarter and the first three quarters was theadditional turnover volume in the shipping division resulting from the acquisitionof CP Ships in October 2005. In tourism, turnover declined slightly in the thirdquarter. In the first three quarters of 2006 it matched 2005 levels.
Following the divestment of the steel service companies of Preussag North America,Inc. (PNA) in May 2006, the TUI Group no longer holds any discontinuing operations;so the corresponding turnover was no longer generated in the third quarter of 2006.Accumulated turnover for the first nine months of 2006 declined by 62.6% year-on-year.
Economic situation in Q3 2006
First-time application of several
compulsory revised IFRS
standards in the preparation
of the consolidated financial
statements for 2005. Q3 and
9M 2005 were restated accord-
ingly in order to enhance
comparability.
Turnover of continuing
operations
Turnover of discontinuing
operations

Economic Situation Interim Report 3rd Quarter 2006
3
Total turnover by the TUI Group’s divisions amounted to € 6.74 billion (previousyear: € 6.58 billion) in the third quarter of 2006, up 2.4% year-on-year. It rose by12.0% to € 16.64 billion (previous year: € 14.87 billion) in the first nine months of2006, essentially due to the consolidation of CP Ships.
Earnings by divisions (EBITA)€ million Q3 2006 Q3 2005 9M 2006 9M 2005 Var. %
Tourism 584 583 653 521 + 25.3Central Europe 173 162 137 115 + 19.1Northern Europe 235 229 186 170 + 9.4Western Europe 67 82 28 58 - 51.7Destinations 112 111 156 180 - 13.3Other tourism - 3 - 1 146 - 2 n. m.Shipping - 25 95 - 91 218 n. m.of which operating earnings - 11 95 15 218 - 93.1of which integration costs - 14 – - 106 – –Central operations - 30 30 - 14 - 26 + 46.2Continuing operations 529 708 548 713 - 23.1Trading - 1 11 17 39 - 56.4Special logistics 5 15 5 77 - 93.5Other divestments 2 35 7 35 - 80.0Discontinuing operations 6 61 29 151 - 80.8Earnings by divisions 535 769 577 864 - 33.2
In the third quarter of 2006, earnings by the continuing operations, tourism andshipping as well as central operations, declined 25.3%. The individual sectors showed uneven performance trends.
Earnings by tourism matched 2005 levels, growing by € 1 million (+ 0.2%). WhileCentral Europe sector achieved an increase in earnings from flight operations andNorthern Europe posted earnings growth, the Western Europe source market recorded a significant drop in earnings due to the persistently difficult marketenvironment in France. Earnings by tourism also included restructuring costs of€ 7 million.
The difficult market conditions in container shipping persisted in the third quarterand caused an overall negative profit contribution of the shipping division, down € 120 million year-on-year. Against the backdrop of stagnating volumes and adecrease in average freight rates, this was caused by the persistently high level ofbunker costs and charter rates.
Central operations reported a year-on-year decline in earnings of € 60 million. Thisincluded positive effects in particular from measurements of conversion options fromthe 2003 convertible bond as well as currency and fuel hedges of € 46 million.
Accumulated earnings by the continuing operations for the first three quarters of2006 declined by 23.1% year-on-year.
The significant earnings growth of € 132 million (+ 25.3%) in tourism resulted fromthe book profit (totalling € 149 million) from the divestment of the business travelactivities in the first quarter of 2006. Adjusted for this special effect, earningsdeclined by € 18 million in the first nine months. Besides the drop in the perform-ance of France in the Western Europe sector, another factor impacting earningswere the restructuring expenses of € 27 million in the tourism division.
Turnover TUI Group
Earnings by continuing
operations in Q3
Earnings by continuing
operations in Q1 – Q3

Interim Report 3rd Quarter 2006 Economic Situation
4
Overall, earnings by shipping declined substantially by € 309 million year-on-yeardue to the difficult market environment in container shipping. Adjusted for theaccumulated integration costs (restructuring costs: € 64 million and current integra-tion costs: € 42 million) of € 106 million, however, the remaining profit contributionfrom operating activities totalled € 15 million.
Earnings by central operations rose by € 12 million year-on-year (+ 46.2%) due toone-off effects from a divestment in the real estate segment and the valuation ofconversion options from the 2003 convertible bond.
In the third quarter of 2006, the TUI Group no longer held any discontinuing operations. Earnings of € 6 million primarily resulted from lagging income from thedivestment in rail logistics effected in December 2005. In the first nine months of2006, earnings by the discontinuing operations totalled € 29 million (previous year:€ 151 million). The decline resulted from the complete divestment of rail logisticsin 2005 and the divestment of the trading sector as at 9 May 2006.
Overall, earnings by the TUI Group’s divisions declined by 30.4% to € 535 million(previous year: € 769 million) in the third quarter of 2006. In the first three quarters,earnings by the divisions dropped by 33.2% to € 577 million (previous year: € 864 million).
Adjusted earnings by divisions € million Q3 2006 Q3 2005 9M 2006 9M 2005 Var. %
Earnings by divisions (EBITA) 535 769 577 864 - 33.2Gains on disposal + 61) + 352) + 1603) + 724) + 122.2CP Ships integration costs - 14 – - 106 – –Revaluation of conversion options – + 19 + 15 + 5 + 200.0Adjusted EBITA 543 715 508 787 - 35.5
1) Essentially lagging income from the divestment of rail logistics 2) Purchase price adjustment in connection with the divestment of the Energie Group 3) Of which book profit TQ3 Group: € + 149 million in the first half of 2006 4) Of which gain on disposal from the divestment of rail logistics: € + 37 million in the second quarter
of 2005
Adjusted for the gains on disposal and the cost of the integration of CP Ships,earnings by the divisions were 24.1% down year-on-year in the third quarter of2006. For the first three quarters of 2006, they also declined by 35.5% year-on-year.
With effect from 3 April 2006, TUI AG waived its option, to be exercised unilaterally,of delivering cash if conversion options from the convertible bond issued in 2003were to be converted. Fair value measurement with an effect on results ended asof that date so that the effect of the revaluation of conversion options, requiredaccording to IAS 39 in combination with IAS 32, was recorded for the last time inthe first quarter of 2006.
Earnings by discontinuing
operations
Adjusted earnings

Economic Situation Interim Report 3rd Quarter 2006
5
Group profitIn the third quarter of 2006, Group profit declined by 50.5% year-on-year to € 299.4 million (previous year: € 604.3 million). Accumulated Group profit for thefirst nine months of 2006 dropped by 56.2% to € 246.9 million (previous year: € 564.0 million). This was mainly attributable to the decline in earnings by the divisions (EBITA), caused by the drop in the performance of the shipping divisionand the reduction in the profit contribution by discontinuing operations.
Events after the closing dateWith effect from 5 October 2006, TUI AG sold its majority interest in Wolf GmbH,a company operating in the heating, ventilation and air conditioning sector at a selling price of € 62 million. It was purchased by Centrotec Sustainable AG, Brilon.With this transaction, TUI divested its last remaining industrial shareholding.
The Indian software company Sonata Software Limited will hold a 50.1% share in theIT services company TUI InfoTec and will manage it as a joint venture in cooperationwith TUI, which still holds 49.9% of the joint venture. The selling price for the sharetotalled € 18 million. The transaction is expected to be completed in the fourthquarter of 2006.
In the framework of the reorganisation of business in Germany, the tour operatoractivities of the TUI, 1-2-Fly and Airtours brands and the TUI Leisure TravelManagement sales organisation were merged into one company in the summerof 2006. In this context, the production of tours of the Airtours brand and thusaround 100 jobs have been transferred from Frankfurt to Hanover. The remainingaround 100 jobs are planned to be successively shed.

Turnover tourism
Earnings by tourism
Interim Report 3rd Quarter 2006 Economic Situation
6
Development of the divisions
Tourism
Key figures Tourism€ million Q3 2006 Q3 2005 9M 2006 9M 2005 Var. %
Turnover 5,160.8 5,285.8 11,312.9 11,294.3 + 0.2Earnings by division (EBITA) 584 583 653 521 + 25.3Capital expenditure 129.9 143.0 478.0 393.3 + 21.5Employees (30 Sept) – – 52,552 58,191 - 9.7
Customer numbers (million)Central Europe 3,784 3,669 8,481 8,072 + 5.1Northern Europe 2,357 2,493 5,453 5,627 - 3.1Western Europe 1,619 1,632 3,569 3,642 - 2.0
Total 7,760 7,794 17,503 17,341 + 0.9
In the third quarter, total turnover by tourism dropped slightly year-on-year by2.4%, while accumulated turnover rose slightly by 0.2%. The Central Europe sectorposted a slight decline in turnover of 0.8% in the quarter under review. Accumulatedturnover rose by 1.9%. This was due to an increase in the number of tour operatorcustomers, largely attributable to the low-cost carrier. The Northern Europe sectorposted a 4.3% decline in turnover in the third quarter and a 1.3% decline in accu-mulated turnover for the first three quarters due to declines in customer numbers.In the Western Europe sector, the turnover drop in France and the turnover stag-nation in the Netherlands were more than offset by growth in Belgium, both in thethird quarter and the first three quarters, so that the sector posted overall growthof 2.1% in the third quarter and 2.7% for the first nine months. The destinationssector reported turnover growth of 5.2% and 9.4% in the periods under review,while Other tourism saw a decline in its performance, particularly due to thedivestment of the business travel operations.
In the third quarter of 2006, earnings by the tourism division matched 2005 levels.The drop in the performance of the Western Europe sector caused by the difficultmarket environment in France was completely offset by the substantial improve-ment in earnings in Central Europe and the gratifying earnings level in NorthernEurope. The destinations sector reproduced 2005 earnings levels. In the first ninemonths, earnings by tourism rose by 25.3% due to the divestment of the businesstravel activities in the first quarter of 2006 (total book profit: € 149 million). Adjustedfor this effect, they were € 18 million down year-on-year. Earnings in 2005 hadbenefited from the first-time consolidation of the Toufag Group (three SpanishRobinson Clubs) in the destinations sector. Another reason for the decline was thedrop in earnings in Western Europe. Restructuring costs totalled € 27 million,including € 12 million incurred in Central Europe, € 12 million in Western Europeand € 3 million in the Other tourism.
Key figures Central Europe€ million Q3 2006 Q3 2005 9M 2006 9M 2005 Var. %
Turnover 2,137.5 2,155.8 4,597.2 4,510.2 + 1.9Earnings by division (EBITA) 173 162 137 115 + 19.1Capital expenditure 31.3 5.5 206.0 67.8 + 203.8Employees (30 Sept) – – 9,872 9,761 - 1.1

Economic Situation Interim Report 3rd Quarter 2006
7
In the Central Europe sector (Germany, Austria, Switzerland and airlines Hapag-LloydFlug and Hapag-Lloyd Express), the number of customers rose by 3.2% to 3.78 million(previous year: 3.67 million) in the third quarter of 2006. Accumulated customernumbers for the first three quarters of 2006 totalled 8.48 million (previous year:8.07 million), up 5.1%. Turnover declined slightly by 0.8% in the third quarter of2006. Accumulated turnover for the first three quarters of 2006 grew by 1.9%. This was primarily attributable to the development of business in Germany.
Earnings by the sector grew by 6.8% in the third quarter and by 19.1% in the firstthree quarters of 2006. This was due to a significant improvement in earnings fromflight operations. While income of € 6 million was generated in the third quarterfrom an aircraft sale-and-lease-back agreement, expenses of € 1 million wereincurred in the framework of the restructuring programme launched in Germany toenhance efficiency. Earnings in Austria were impacted by the low booking volumesfor Turkey and Egypt; Switzerland, in contrast, reported a slight increase in earnings.
Customer numbers Central Europe’000 Q3 2006 Q3 2005 9M 2006 9M 2005 Var. %
Germany 3,333 3,226 7,632 7,231 + 5.5Switzerland 105 95 212 205 + 3.1Austria 347 348 637 636 + 0.2Central Europe 3,784 3,669 8,481 8,072 + 5.1
In Germany, the market and competitive environment was difficult in the thirdquarter of 2006. Nevertheless, TUI tour operators managed to achieve a 3.3%increase in customer numbers year-on-year. While the TUI and 1-2-Fly tour operatorsreported declines, the special tour operators managed to grow, in some cases significantly. Demand for the Balearic Islands and Italy was very good, while Turkeyand North Africa continued to suffer from restrained bookings.
The Swiss tour operation market maintained a steady level in the third quarter of2006. Against this backdrop, TUI Suisse tour operators managed to achieve 10.7%growth in customer numbers. This trend was mainly supported by the tour operatorbrands FlexTravel and 1-2-Fly, newly introduced in the summer of 2005. Imholz,which was rebranded TUI in the third quarter, also managed to grow.
In Austria, the continued restraint in bookings of tours to Turkey and Egypt impactedthe market and thus also TUI Austria tour operators. Customer numbers droppedslightly by 0.3%. The Gulet and Magic life brands recorded declines due to theirstrong focus on Turkey, while the TUI and Terra brands achieved growth.
In the third quarter, the number of aircraft operated by Hapag-Lloyd Flug was fouraircraft down year-on-year. Since the fleet structure was also changed so thatfewer passengers could be carried, the number of seat kilometres on offer also
Turnover Central Europe
Earnings Central Europe
Germany
Switzerland
Austria
Hapag-Lloyd Flug/
Hapag-Lloyd Express
Key figures Flight operations Central EuropeNumber of Group-owned aircraft Seat kilometres (million) Seat load factor (%)
Q3 2006 Q3 2005 Var. Q3 2006 Q3 2005 Var. Q3 2006 Q3 2005 Var. abs. % % points
Hapag-Lloyd Flug 33 37 - 4 5,703 6,296 - 9.4 91.9 91.8 + 0.1Hapag-Lloyd Express 18 15 + 3 1,448 1,173 + 23.4 83.4 83.3 + 0.1

Turnover Northern Europe
Earnings Northern Europe
UK
Ireland
Interim Report 3rd Quarter 2006 Economic Situation
8
dropped. Thus, the seat load factor remained constantly high. Hapag-Lloyd Flug’sseat-only business recorded a positive trend in the third quarter 2006. In the periodunder review, a decision was taken to integrate the two German airlines Hapag-Lloyd Flug and Hapag-Lloyd Express. As of the 2007 summer season, they willoperate under a joint flight schedule.
Key figures Northern Europe€ million Q3 2006 Q3 2005 9M 2006 9M 2005 Var. %
Turnover 1,743.4 1,820.9 3,893.3 3,945.6 - 1.3Earnings by division (EBITA) 235 229 186 170 + 9.4Capital expenditure 31.8 14.7 60.0 46.5 + 29.0Employees (30 Sept) – – 15,874 17,180 - 7.6
In the Northern Europe sector (UK, Ireland, Nordic countries as well as airlinesThomsonfly (charter and scheduled flights) and TUIfly Nordic), the number ofcustomers dropped by 5.4% to 2.36 million (previous year: 2.49 million) in a difficultmarket environment in the third quarter of 2006. In the first three quarters of2006, the number of customers travelling with tour operators of this sector totalled5.45 million (previous year: 5.63 million), a decline of 3.1% year-on-year. This trendwas also reflected by turnover, which dropped year-on-year both in the third quarterand the first three quarters by 4.3% and 1.3%, respectively.
Earnings by the Northern Europe sector rose 2.6% in the third quarter and 9.4% inthe first three quarters against 2005 levels. Adjusted for non-periodic income of thecurrent year, operating earnings declined. The restructuring measures implementedin 2005, however, had positive effects, improving cost structures due to commissioncuts in third-party distribution and process optimisations.
Customer numbers Northern Europe’000 Q3 2006 Q3 2005 9M 2006 9M 2005 Var. %
UK 1,822 1,965 4,239 4,403 - 3.7Ireland 157 160 299 302 - 0.9Nordic countries 378 368 915 922 - 0.8Northern Europe 2,357 2,493 5,453 5,627 - 3.1
In the third quarter, the operative business of TUI UK’s tour operators was charac-terised by a persistently unfavourable market environment. Bookings were restraineddue to the unusually good weather and the Football World Cup, so that customernumbers declined by 7.3% against the backdrop of a year-on-year reduction incapacity. In terms of destinations, demand rose for tours to Egypt and Bulgariawhile bookings declined slightly for traditional destinations around the Mediterranean.Demand also dropped for tours to Turkey, but rose year-on-year for long-haul destinations.
Ireland reported a 1.6% decrease in customer numbers in the third quarter sincethe Irish tour operation business, too, was affected by difficult market conditions.Eastern European destinations continued to record strong growth, while demandfor destinations in Spain and Greece, accounting for a large part of the summerprogramme, declined year-on-year.

Economic Situation Interim Report 3rd Quarter 2006
9
In the Nordic countries, the number of customers rose by 2.7% year-on-year in thethird quarter, with the Swedish and Danish markets showing a better trend thanNorway and Finland, which recorded a decline in demand. Bookings of tours toTurkish and Northern African destinations were generally down.
The charter airline increased its seat kilometres since it served a larger number oflong-haul and medium-haul destinations compared with 2005. The decline in theseat load factor was attributable to the low number of tour operator customers. Inthe low-cost scheduled flight segment, the number of seat kilometres was reduced.However, utilisation of the capacity on offer was increased as unprofitable routeswere cancelled from the flight schedule. The Thomsonfly fleet was extended byfour aircraft.
In the Nordic countries, the number of seat kilometres was up year-on-year due tothe enlargement of the aircraft fleet by one aircraft. The seat load factor declinedslightly year-on-year.
Key figures Western Europe€ million Q3 2006 Q3 2005 9M 2006 9M 2005 Var. %
Turnover 1,069.9 1,048.1 2,306.3 2,245.3 + 2.7Earnings by division (EBITA) 67 82 28 58 - 51.7Capital expenditure 20.9 94.8 63.0 190.6 - 66.9Employees (30 Sept) – – 6,639 6,912 - 3.9
In the Western Europe sector (France, the Netherlands, Belgium as well as airlinesCorsair, TUI Airlines Nederland and TUI Airlines Belgium), the number of customerstotalled 1.62 million in the third quarter of 2006, matching 2005 levels (previous year:1.63 million). In the first nine months of 2006, a total of 3.57 million (previous year:3.64 million) customers travelled with tour operators of this sector, a year-on-yeardecline of 2.0%. Turnover in the third quarter of 2006 rose by 2.1%, with accumulatedturnover for the first three quarters growing by 2.7%. In France, turnover declineddue to the market trend and fell short of the previous year’s levels both in thethird quarter and in the first three quarters of 2006. In the Netherlands, turnovermatched 2005 levels in the third quarter, although the special tour operator businesswas divested in the previous quarter. Adjusted for this turnover portion, the sectorachieved growth, resulting, inter alia, from improvements in the product mix andan expansion of the flight business. In Belgium, turnover rose due to an increase incustomer numbers.
Earnings by the sector declined by 18.3% year-on-year in the third quarter and by51.7% in the first nine months of the year. This decline resulted from the deterio-ration in the performance in France. The French market continued to be difficult inthe third quarter so that earnings dropped significantly. Margins declined due to
Nordic countries
Thomsonfly
TUIfly Nordic
Turnover Western Europe
Earnings Western Europe
Key figures Flight operations Northern EuropeNumber of Group-owned aircraft Seat kilometres (million) Seat load factor (%)
Q3 2006 Q3 2005 Var. Q3 2006 Q3 2005 Var. Q3 2006 Q3 2005 Var. abs. % % points
Thomsonfly 47 43 + 4Charter 7,996 7,686 + 4.0 84.8 93.5 - 8.7Scheduled flights 707 867 - 18.5 88.6 80.6 + 8.0
TUIfly Nordic 5 4 + 1 1,032 776 + 33.0 95.1 97.0 - 1.9

Interim Report 3rd Quarter 2006 Economic Situation
10
overcapacity in flight operations; furthermore, oil price-induced increases in aircraftfuel prices could not fully be rolled over to customers. Nouvelles Frontières andCorsair saw their business additionally impacted by restrained demand. Earnings inthe Netherlands – even adjusted for the gain on disposal of € 7 million from thesale of an administrative building – rose year-on-year in the third quarter. Earningsin Belgium were also up year-on-year in the third quarter.
Customer numbers Western Europe ‘000 Q3 2006 Q3 2005 9M 2006 9M 2005 Var. %
France 513 540 1,273 1,381 - 7.8Netherlands 452 456 984 1,025 - 4.0Belgium 654 636 1,312 1,236 + 6.1Western Europe 1,619 1,632 3,569 3,642 - 2.0
The French travel market continued to suffer from weak demand in the third quarterof 2006, which affected in particular the business of Nouvelles Frontières and Corsair. In the summer, demand in the travel market was impacted by the goodperformance of the French team in the World Cup. Customer numbers dropped by5.0% in the quarter under review. As before, the decline was also due to the chikengunya fever in Reunion, an important destination for Nouvelles Frontièresand Corsair. The TUI France brand continued to record growth in booking numbers.
In the Netherlands, the number of customers declined by 0.8% in the third quarter.Adjusted for the customer numbers of the special tour operators sold in the secondquarter of 2006, customer numbers grew in the third quarter. Demand rose in particular for tours to Mediterranean destinations in the eurozone – Spain, Greeceand Portugal – while demand for tours to Turkey declined.
In Belgium, customer numbers grew by 2.8% in the third quarter. In terms of airtours, demand grew for the western Mediterranean destinations but declined fortours to Turkey. Concerning land-based tours, the Group’s market share grew bothin self-drive tours and city trips.
Corsair’s business was impacted by demand behaviour in the French flight market.Corsair managed to partly offset this effect by implementing ad hoc flights forspecial large events and sports events and leasing out aircraft. Nevertheless, keyindicators in flight operations declined in the French market in the 2006 summerseason.
In the period under review, the number of aircraft operated by TUI Airlines Neder-land was one down year-on-year. In order to meet the increase in demand in theNetherlands in the summer season, additional capacity was chartered in the periodunder review.
France
Netherlands
Belgium
Corsair
TUI Airlines Nederland/Arkefly
Key figures Flight operations Western EuropeNumber of Group-owned aircraft Seat kilometres (million) Seat load factor (%)
Q3 2006 Q3 2005 Var. Q3 2006 Q3 2005 Var. Q3 2006 Q3 2005 Var. abs. % % points
Corsair 8 12 - 4 4,253 4,535 - 6.2 80.2 81.7 - 1.5TUI Airlines Nederland 3 4 - 1 1,009 695 + 45.2 90.1 89.5 + 0.6TUI Airlines Belgium 8 7 + 1 1,645 1,472 + 11.8 92.5 92.1 + 0.4
Economic Situation Interim Report 3rd Quarter 2006
11
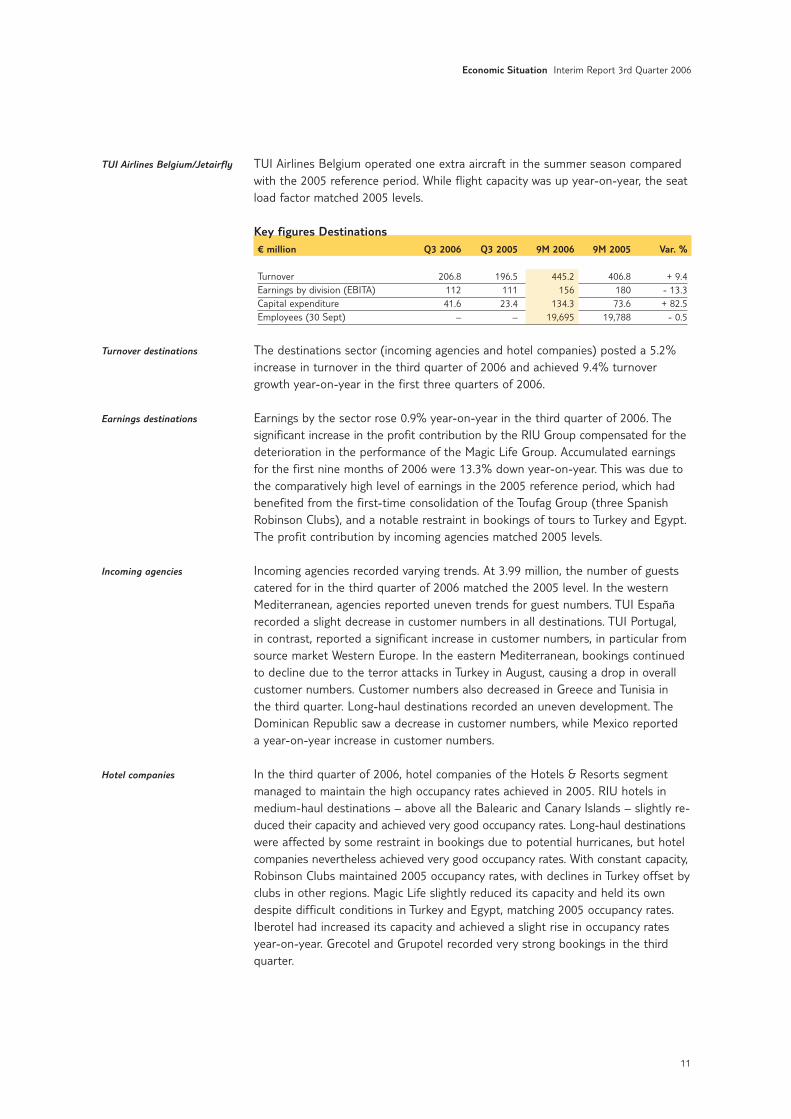
TUI Airlines Belgium operated one extra aircraft in the summer season comparedwith the 2005 reference period. While flight capacity was up year-on-year, the seatload factor matched 2005 levels.
Key figures Destinations€ million Q3 2006 Q3 2005 9M 2006 9M 2005 Var. %
Turnover 206.8 196.5 445.2 406.8 + 9.4Earnings by division (EBITA) 112 111 156 180 - 13.3Capital expenditure 41.6 23.4 134.3 73.6 + 82.5Employees (30 Sept) – – 19,695 19,788 - 0.5
The destinations sector (incoming agencies and hotel companies) posted a 5.2%increase in turnover in the third quarter of 2006 and achieved 9.4% turnovergrowth year-on-year in the first three quarters of 2006.
Earnings by the sector rose 0.9% year-on-year in the third quarter of 2006. Thesignificant increase in the profit contribution by the RIU Group compensated for thedeterioration in the performance of the Magic Life Group. Accumulated earningsfor the first nine months of 2006 were 13.3% down year-on-year. This was due tothe comparatively high level of earnings in the 2005 reference period, which hadbenefited from the first-time consolidation of the Toufag Group (three SpanishRobinson Clubs), and a notable restraint in bookings of tours to Turkey and Egypt.The profit contribution by incoming agencies matched 2005 levels.
Incoming agencies recorded varying trends. At 3.99 million, the number of guestscatered for in the third quarter of 2006 matched the 2005 level. In the westernMediterranean, agencies reported uneven trends for guest numbers. TUI Españarecorded a slight decrease in customer numbers in all destinations. TUI Portugal, in contrast, reported a significant increase in customer numbers, in particular fromsource market Western Europe. In the eastern Mediterranean, bookings continuedto decline due to the terror attacks in Turkey in August, causing a drop in overallcustomer numbers. Customer numbers also decreased in Greece and Tunisia in the third quarter. Long-haul destinations recorded an uneven development. The Dominican Republic saw a decrease in customer numbers, while Mexico reported a year-on-year increase in customer numbers.
In the third quarter of 2006, hotel companies of the Hotels & Resorts segmentmanaged to maintain the high occupancy rates achieved in 2005. RIU hotels inmedium-haul destinations – above all the Balearic and Canary Islands – slightly re-duced their capacity and achieved very good occupancy rates. Long-haul destinationswere affected by some restraint in bookings due to potential hurricanes, but hotelcompanies nevertheless achieved very good occupancy rates. With constant capacity,Robinson Clubs maintained 2005 occupancy rates, with declines in Turkey offset byclubs in other regions. Magic Life slightly reduced its capacity and held its owndespite difficult conditions in Turkey and Egypt, matching 2005 occupancy rates.Iberotel had increased its capacity and achieved a slight rise in occupancy ratesyear-on-year. Grecotel and Grupotel recorded very strong bookings in the thirdquarter.
TUI Airlines Belgium/Jetairfly
Turnover destinations
Earnings destinations
Incoming agencies
Hotel companies

Interim Report 3rd Quarter 2006 Economic Situation
12
Key figures Other tourism€ million Q3 2006 Q3 2005 9M 2006 9M 2005 Var. %
Turnover 3.2 64.5 70.9 186.4 - 62.0Earnings by division (EBITA) - 3 - 1 146 - 2 n. m.Capital expenditure 4.3 4.6 14.7 14.8 - 0.7Employees (30 Sept) – – 472 4,550 - 89.6
In the third quarter of 2006, the Other tourism sector only comprised TUI InfoTec’sIT services companies. The accumulated turnover by the sector fell considerablyyear-on-year since the business travel activities were sold in the previous quarterand thus did not contribute to turnover any longer. The significantly increasedaccumulated earnings comprised restructuring costs of € 3 million as well as thegain on disposal from the divestment of the business travel activities of € 149 mil-lion, generated in the first half of 2006. A 50.1% majority in TUI InfoTec was soldto the Indian software company Sonata Software Limited in September 2006. Thecompletion of the transaction is expected in the fourth quarter 2006.
Economic Situation Interim Report 3rd Quarter 2006
13
Shipping
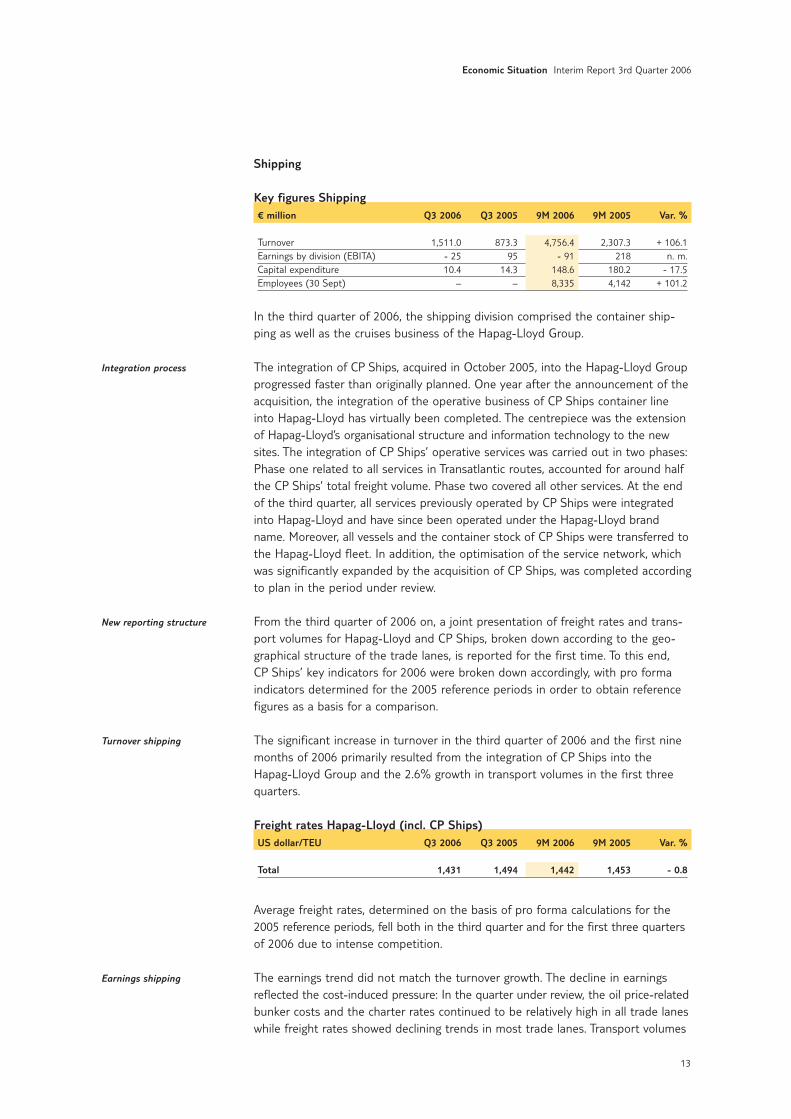
Key figures Shipping€ million Q3 2006 Q3 2005 9M 2006 9M 2005 Var. %
Turnover 1,511.0 873.3 4,756.4 2,307.3 + 106.1Earnings by division (EBITA) - 25 95 - 91 218 n. m.Capital expenditure 10.4 14.3 148.6 180.2 - 17.5Employees (30 Sept) – – 8,335 4,142 + 101.2
In the third quarter of 2006, the shipping division comprised the container ship-ping as well as the cruises business of the Hapag-Lloyd Group.
The integration of CP Ships, acquired in October 2005, into the Hapag-Lloyd Groupprogressed faster than originally planned. One year after the announcement of theacquisition, the integration of the operative business of CP Ships container lineinto Hapag-Lloyd has virtually been completed. The centrepiece was the extensionof Hapag-Lloyd’s organisational structure and information technology to the newsites. The integration of CP Ships’ operative services was carried out in two phases:Phase one related to all services in Transatlantic routes, accounted for around halfthe CP Ships’ total freight volume. Phase two covered all other services. At the endof the third quarter, all services previously operated by CP Ships were integratedinto Hapag-Lloyd and have since been operated under the Hapag-Lloyd brandname. Moreover, all vessels and the container stock of CP Ships were transferred tothe Hapag-Lloyd fleet. In addition, the optimisation of the service network, whichwas significantly expanded by the acquisition of CP Ships, was completed accordingto plan in the period under review.
From the third quarter of 2006 on, a joint presentation of freight rates and trans-port volumes for Hapag-Lloyd and CP Ships, broken down according to the geo-graphical structure of the trade lanes, is reported for the first time. To this end, CP Ships’ key indicators for 2006 were broken down accordingly, with pro formaindicators determined for the 2005 reference periods in order to obtain referencefigures as a basis for a comparison.
The significant increase in turnover in the third quarter of 2006 and the first ninemonths of 2006 primarily resulted from the integration of CP Ships into theHapag-Lloyd Group and the 2.6% growth in transport volumes in the first threequarters.
Freight rates Hapag-Lloyd (incl. CP Ships)US dollar/TEU Q3 2006 Q3 2005 9M 2006 9M 2005 Var. %
Total 1,431 1,494 1,442 1,453 - 0.8
Average freight rates, determined on the basis of pro forma calculations for the2005 reference periods, fell both in the third quarter and for the first three quartersof 2006 due to intense competition.
The earnings trend did not match the turnover growth. The decline in earningsreflected the cost-induced pressure: In the quarter under review, the oil price-relatedbunker costs and the charter rates continued to be relatively high in all trade laneswhile freight rates showed declining trends in most trade lanes. Transport volumes
Integration process
New reporting structure
Turnover shipping
Earnings shipping

Interim Report 3rd Quarter 2006 Economic Situation
14
had grown in previous quarters but stagnated in the third quarter. Earnings includeone-off expenses comprising restructuring costs (severance payments and vacancyrisks) as well as integration costs (agency termination costs and IT restructuring).For the third quarter they totalled € 14 million and for the first nine months 2006they accumulated to € 106 million.
Transport volumes Hapag-Lloyd (incl. CP Ships)‘000 TEU Q3 2006 Q3 2005 9M 2006 9M 2005 Var. %
Far East 302 270 872 755 + 15.5Trans-Pacific 242 216 705 601 + 17.3Atlantic 327 382 1,047 1,183 - 11.5Latin America 191 214 591 622 - 5.0Australasia 179 159 509 467 + 9.1Total 1,241 1,241 3,724 3,628 + 2.6
In the first nine months, Hapag-Lloyd in its new, integrated structure achievedvolume growth of 2.6% as against the 2005 reference period, determined on thebasis of a pro forma calculation. It thus managed to increase its transport volumeoverall year-on-year in the year of integration. In the third quarter, transport volumesmatched the 2005 levels.
In the Far East trade lane, strong volume growth of 12.0% was achieved in thethird quarter. This was mainly due to the persistently high export volume in China,which had a positive effect on the routes from Asia to Europe. However, freightrates considerably dropped by 7.2% due to strong competition on these routes.
The Trans-Pacific trade lane also posted strong growth in transport volumes of12.1% in the third quarter, also attributable to economic growth in China and theassociated export activities. The intensification of the competitive pressure in thecontainer transport market caused a 7.1% decline in freight rates.
In the Atlantic trade lane, the transport volume dropped 14.6%. This decline wascaused by the expected volume losses due to the integration of CP Ships on theone hand and the intensification of the competitive pressure in the market due tothe additional container transport capacity in the market on the other. Averagefreight rates benefited from an increase in rates, in particular on routes betweenNorthern Europe and North America, growing by 6.8% year-on-year in the quarterunder review. However, freight rates grew less strongly than in the first half of theyear.
At 10.8%, the transport volume in the Latin America trade lane fell short of theprevious year’s level since freight volumes from Latin America to Europe contractedsignificantly in the third quarter. Freight rates dropped by 7.3% year-on-year.
The Australasia trade lane achieved strong growth of 12.6% in the third quarter,generating volume growth that matched the volume growth in the first half of theyear. This was partly attributable to the strong growth in inner-Asian containertransports. Freight rates declined by 10.0%, mainly due to the increase in the proportion of inner-Asian transports, which imply shorter distances and thereforelower average freight rates.
Development in
the trade lanes

Economic Situation Interim Report 3rd Quarter 2006
15
In the third quarter of 2006, Hapag-Lloyd Kreuzfahrten continued to record improve-ments in booking numbers. Overall, it reported an increase both in booking volumesand rates, in particular for ‘Hanseatic’ and ‘Bremen’.
Central operations
Key figures Central operations € million Q3 2006 Q3 2005 9M 2006 9M 2005 Var. %
Turnover 67.9 63.6 172.5 191.5 - 9.9Earnings by division (EBITA) - 30 30 - 14 - 26 + 46.2Capital expenditure 4.3 3.2 12.5 10.6 + 17.9Employees (30 Sept) – – 953 2,198 - 56.6
Central operations covered TUI AG’s corporate centre functions and intermediateholding companies non-allocatable to the segments as well as other operating areas,comprising the Group’s real estate companies and the remaining industrial activities.
Turnover by central operations mostly related to other operating sectors.
Earnings in the third quarter of 2006 fell significantly short of 2005 levels. This declinewas attributable to the positive effects from measurements both of convertibleoptions from the 2003 convertible bond and of currency and fuel hedges, includedin 2005 figures. Thus earnings in the first three quarters increased due to one-offeffects of a selling transaction in the real estate segment (Schacht Konrad) and therevaluation of the conversion options from the 2003 convertible bond. Earnings bycentral operations comprised earnings by other operating sectors of € 7 million(previous year: € 7 million) and earnings by the holdings of € - 37 million (previousyear: € 23 million).
Earnings Central operations€ million Q3 2006 Q3 2005 9M 2006 9M 2005 Var. %
Earnings by the holdings - 37 23 - 72 - 48 - 50.0Cost of TUI AG’s corporate centre functions and the inter-mediate holding companies - 29 - 29 - 81 - 83 + 2.4Other expenses and income - 8 52 9 35 - 74.3
Other operating sectors 7 7 58 22 + 163.6Earnings Central operations - 30 30 - 14 - 26 + 46.2
Discontinuing operationsFollowing the divestment of the PNA trading activities, effected in the secondquarter of 2006, the TUI Group no longer holds any discontinuing operations; how-ever, gains on disposal of € 6 million were posted in the quarter under review, largelyresulting from lagging income from the divestment of rail logistics in December 2005.In the first nine months of 2006, earnings by the discontinuing operations totalled€ 29 million (previous year: € 151 million), down 80.8%. The decline resulted fromthe complete divestment of special logistics in 2005 and the divestment of the trading sector as at 9 May 2006.
Hapag-Lloyd Kreuzfahrten
Turnover central operations
Earnings central operations

Interim Report 3rd Quarter 2006 Economic Situation
16
In comparison with previous quarters, the development of the items of the conso-lidated profit and loss statement and earnings before taxes on income of the con-tinuing operations was primarily determined by the business trend in shipping, inparticular the inclusion of CP Ships in consolidation as of October 2005 and itsintegration into Hapag-Lloyd. Further changes were attributable to the divestmentof the business travel operations as at 31 March 2006.
Due to the acquisition of CP Ships, the cost of material and personnel cost ratiosand the structures of other operating income and expenses can no longer be com-pared with the relevant reference figures for 2005. As a matter of principle, ship-ping has a higher cost of material ratio than tourism.
Turnover comprised the turnover of the tourism and shipping divisions and of cen-tral operations, which include TUI AG, the Group’s real estate companies and theremaining industrial activities. At € 6.7 billion, turnover grew by 8.3% year-on-yearin the third quarter of 2006. For the first nine months of 2006, turnover rose by17.8% to € 16.2 billion. A detailed breakdown of turnover and the turnover trendis presented in the section ‘Turnover and earnings’.
Other income primarily comprised profits from the sale of fixed and current assetitems, supplementary transactions, foreign exchange gains, income from cost reim-bursements and income from letting and leasing contracts as well as license agree-ments. At € 120 million, other income declined by € 116 million (49.2%) year-on-year in the third quarter of 2006. For the first nine months of the 2006 financialyear, other income reproduced 2005 levels.
Changes in inventories and other own work capitalised rose year-on-year to € 7million for the third quarter of 2006 and € 14 million for the first nine months of2006. This increase was primarily attributable to the real estate companies com-prised in other operating areas.
Group profit
Condensed consolidated profit and loss statement € million Q3 2006 Q3 2005 9M 2006 9M 2005 Var. %
Turnover 6,739.7 6,222.7 16,241.8 13,793.1 + 17.8Other income 119.5 235.0 581.9 584.2 - 0.4Change in inventories and other own work capitalised 6.7 4.2 14.0 - 3.8 + 468.4Cost of material and purchased services 4,883.6 4,307.5 12,110.1 9,722.8 + 24.6Personnel costs 603.2 568.3 1,848.0 1,637.4 + 12.9Depreciation and amortisation 159.6 122.1 496.5 347.9 + 42.7Impairment of fixed assets 2.8 0.1 19.7 4.6 + 328.3Other expenses 717.8 817.1 1,890.4 2,010.1 - 6.0Financial income 47.4 83.0 159.7 150.3 + 6.3Financial expenses 97.5 78.9 296.1 263.5 + 12.4Earnings from companies measured at equity 24.2 16.2 40.1 30.1 + 33.2Earnings before taxes on income 473.0 667.1 376.7 567.6 - 33.6Income taxes 176.8 111.1 146.0 99.1 + 47.3Result from continuing operations 296.2 556.0 230.7 468.5 - 50.8Result from discontinuing operations 3.2 48.3 16.2 95.5 - 83.0Group profit 299.4 604.3 246.9 564.0 - 56.2- attributable to shareholders of TUI AG 273.0 573.6 207.1 527.0 - 60.7- attributable to minority interests 26.4 30.7 39.8 37.0 + 7.6Group profit 299.4 604.3 246.9 564.0 - 56.2Basic earnings per share (in €) 1.09 2.98 0.83 2.88 - 71.2Diluted earnings per share (in €) 1.05 2.74 0.81 2.68 - 69.8
Turnover
Other income
Changes in inventories and
other own work capitalised

Economic Situation Interim Report 3rd Quarter 2006
17
The cost of materials and purchased services comprised the cost of raw materialsincluding fuel, supplies, purchased merchandise and services. In tourism, this itemmainly related to the cost of third-party services such as rental and operating leasepayments, hotel rental payments, the cost of flight and other transport services aswell as aircraft fuel. In the shipping division, the cost of purchased services prima-rily included the cost of third-party container transport, bunker costs, port andterminal costs as well as charter, rental and operating lease costs for ships andcontainers. The increase in the cost of material and purchased services of 13.4% to€ 4.9 billion in the third quarter of 2006 and of 24.6% to € 12.1 billion in the firstthree quarters of 2006 mainly resulted from the inclusion of CP Ships in consolida-tion and from cost increases in shipping.
Personnel costs included expenses for wages and salaries, social security contribu-tions as well as pension costs (excluding the interest portion) and benefits. Theyalso included expenses for personnel adjustments in the framework of restructur-ing processes. Personnel costs rose by 6.1% to € 603 million in the third quarter of2006 and by 12.9% to € 1.85 billion in the first three quarters of the 2006 financi-al year. This was primarily due to the consolidation of CP Ships and the resultingincrease in the headcount in the shipping division as well as expenses for person-nel adjustments in the framework of restructuring processes in CP Ships of around€ 50 million and in the Central Europe sector of around € 16 million in the periodunder review.
Depreciation and amortisation comprised the amortisation of property, plant andequipment and other intangible assets. At € 160 million, it was 30.7% up year-on-year in the third quarter of 2006; for the first nine months of 2006, it rose by42.7% to € 497 million. This was mainly due to the investments in ships and con-tainers in connection with the acquisition of CP Ships in the fourth quarter of 2005.
Impairments totalled € 3 million for the third quarter of 2006 and € 20 million forthe first three quarters of 2006. They mainly related to depreciation on real estate(incl. leasehold improvements) in connection with the integration of CP Ships andthe divestment of TQ3.
Other expenses included commissions for tourism services, distribution and adver-tising expenses, rental and lease expenses, administrative expenses including con-tributions, charges and fees, expenses for financial and monetary transactions aswell as other taxes. Other expenses dropped by 12.1% to € 718 million in the thirdquarter of 2006 and by 6.0% to € 1.9 billion in the first nine months of 2006. Thelower expenses in tourism (including TQ3) more than compensated the increase inother expenses attributable to changes in consolidation due to CP Ships.
The financial result comprised the net interest result, the net result from invest-ments and marketable securities and the result from changes in the fair value ofderivative financial instruments, which are subject to strong fluctuations as at themeasurement dates and may therefore cause strong fluctuations in financial incomeand expenses over time. At € - 50 million, the financial result declined by € 54 mil-lion year-on-year in the third quarter of 2006 and comprised financial income of€ 47 million (previous year: € 83 million) as well as financial expenses of € 97 million(previous year: € 79 million). In the first three quarters of 2006, the financial resultdeclined by € 23 million (20.4%) from € - 113 million to € - 136 million and com-prised financial income of € 160 million (previous year: € 150 million) and financial
Cost of materials and
purchased services
Personnel costs
Depreciation
and amortisation
Impairments
Other expenses
Financial result

18
expenses of € 296 million (previous year: € 263 million). The change in the finan-cial result included an amount of € 26 million which resulted from a decline in theinterest result. In addition, the earnings effects from the measurement of the con-version options of the convertible bond issued in 2003 were offset by the measure-ment of derivative financial instruments.
The earnings from companies measured at equity comprised the interest in netprofit for the year of the associated companies and joint ventures as well as neces-sary impairments of goodwill of these companies. At € 24 million for the thirdquarter of 2006 and € 40 million for the first three quarters of 2006, it grew by49.4% and 33.2%, respectively. It mainly resulted from the development of ear-nings in the destinations sector. Impairments of goodwill were not required.
Income taxes comprised taxes on the profits from ordinary business activities ofthe continuing operations. Income taxes totalled € 176.8 million in the third quar-ter of 2006 (previous year: € 111.1 million). For the first three quarters of 2006,income taxes totalled € 146.0 million (previous year: € 99.1 million). The increasein the tax rate in the first nine months of the 2006 financial year mainly resultedfrom the change in the breakdown of earnings between the two divisions, tourismand shipping, since the operative shipping companies were subject to tonnagetaxes. Furthermore, due to the uncertainty concerning the future realisability ofloss carryforwards in France, further capitalisation of potential tax savings was dis-pensed with.
Result of the operations classified as discontinuing operations in accordance withIFRS 5 totalled € 3 million for the third quarter of 2006 and € 16 million for thefirst three quarters of 2006. A detailed breakdown of the development of theseearnings is provided in the section ‘Result from the discontinuance of operations’in the notes.
Group profit totalled € 299 million (previous year: € 604 million) in the third quar-ter of 2006, down 50.5%. In the first three quarters of 2006, they declined by56.2% to € 247 million (previous year: € 564 million). While a book profit wasgenerated due to the divestment of the business travel operations, expenses wereincurred in the framework of restructuring processes and the operative business, inparticular in the shipping division.
Minority interests in Group profit totalled € 26 million for the third quarter of 2006and € 40 million for the first three quarters of 2006, thus matching the previous year’slevels. They almost exclusively related to companies in the destinations division.
Earnings per shareAfter deduction of minority shares, TUI AG shareholders accounted for € 273 mil-lion of Group profit in the third quarter of 2006, a decline of 52.4% year-on-year.In the first nine months of 2006, they accounted for € 207 million, down 60.7%year-on-year. Due to the capital increase implemented in September 2005 and theissuance of employee shares, the number of dividend-bearing shares rose to250,732,575. As a result, basic earnings per share declined to € 1.09 (previousyear: € 2.98) in the third quarter and € 0.83 (previous year: € 2.88) in the firstthree quarters of 2006.
Interim Report 3rd Quarter 2006 Economic Situation
Earnings from companies
measured at equity
Income taxes
Result from discontinuing
operations
Group profit
Minority interests

19
In the third quarter of 2006, operating rental expenses of the continuing opera-tions amounted to € 300.8 million (previous year: € 222.7 million). In the first ninemonths of 2006, operating lease expenses of the continuing operations rose to € 860.0 million (previous year: € 573.8 million), in particular due to the acquisitionof CP Ships in the fourth quarter of 2005.
In the third quarter of 2006, the interest result of the continuing operations totalled€ - 56 million (previous year: € - 41 million). In the first three quarters of 2006,the interest result of the continuing operations totalled € - 171.0 million (previousyear: € - 145.1 million). The decline in the interest result was mainly due to theincrease in the average interest rate resulting from the restructuring of the finan-cing structure, despite a reduction in net debt arising due to the divestments.
Net assets and financial positionThe Group’s balance sheet total rose by 1.7% to € 15.6 billion as against the endof 2005. The changes in the consolidated balance sheet essentially resulted fromthe tourism cycle. In addition, the Group’s net assets and financial position wereaffected by the acquisitions and divestments (see section ‘Acquisitions – divest-ments’ in the notes).
Assets and liabilities€ million 30 Sep 2006 31 Dec 2005
Non-current assets 11,594.4 11,864.8Current assets 3,991.3 3,463.6Assets 15,585.7 15,328.4Equity 4,138.9 4,375.2Provisions 2,494.7 2,576.7Financial liabilities 4,349.6 4,358.2Other liabilities 4,602.5 4,018.3Liabilities 15,585.7 15,328.4
Non-current assetsAs at 30 September 2006, non-current assets accounted for 74.4% of total assets,compared with a share of 77.4% as at 31 December 2005. Non-current assetsdropped from € 11.9 billion to € 11.6 billion in the period under review. The de-cline was mainly attributable to the reclassification of the non-current assets ofWolf GmbH and the TUI InfoTec Group, which were classified as disposal groups inaccordance with IFRS 5 as at 30 September 2006 due to the planned divestmentof these companies in the fourth quarter. The non-current assets of Wolf GmbHand TUI InfoTec were therefore summarized under ‘Current assets held for sale’ asat 30 September 2006.
Economic Situation Interim Report 3rd Quarter 2006
Operating rental expenses
Interest result
Profit and loss statement indicators of the continuing operations€ million Q3 2006 Q3 2005 9M 2006 9M 2005 Var. %
Earnings before interest, taxes, depreciation, amortisation and rent (EBITDAR) 992.8 1,052.1 1,926.7 1,639.1 + 17.6Operating rental expenses 300.8 222.7 860.0 573.8 + 49.9Earnings before interest, taxes, depreciation and amortisation (EBITDA) 692.0 829.4 1,066.7 1,065.3 + 0.1Depreciation/amortisation less reversals of depreciation1) 163.0 121.7 519.0 352.6 + 47.2Earnings before interest, taxes and amortisation of goodwill (EBITA) 529.0 707.7 547.7 712.7 - 23.2Amortisation of goodwill 0.0 0.0 0.0 0.0 –Earnings before interest and taxes (EBIT) 529.0 707.7 547.7 712.7 - 23.2Interest result - 56.0 - 40.6 - 171.0 - 145.1 - 17.9Earnings before taxes (EBT) 473.0 667.1 376.7 567.6 - 33.6
1) on property, plant and equipment as well as intangible assets, investments and current assets

Interim Report 3rd Quarter 2006 Economic Situation
20
Current assets As at 30 September 2006, current assets accounted for 25.6% of total assets, upfrom 22.6% as at 31 December 2005. Current assets rose from € 3.5 billion as at31 December 2005 to € 4.0 billion as at 30 September 2006, in particular due tothe increase in cash and cash equivalents from € 0.6 billion as at 31 December2005 to € 1.5 billion as at 30 September 2006. This increase primarily resultedfrom advance payments received in tourism and payments received in the frame-work of the divestment of the business travel activities at the end of the firstquarter and the PNA Group on 9 May 2006. An opposite effect resulted from thedevelopment of the item ‘Assets held for sale’, which declined by € 0.7 billion dueto the completion of the divestment of the business travel activities and the PNAGroup but rose by € 0.2 billion due to the reclassification of the non-currentassets of Wolf GmbH and the TUI InfoTec Group (see section ‘Non-current assets’).
EquityEquity totalled € 4.1 billion as at 30 September 2006. The equity ratio stood at26.6%, compared with 28.5% at the end of the 2005 financial year. Detailed infor-mation on the changes is provided under ‘Changes in equity’ in the notes on thisinterim report.
ProvisionsProvisions mainly included provisions for pension obligations, effective and deferredincome tax provisions and provisions for typical operating risks. As at 30 Septem-ber 2006, they totalled € 2.5 billion and were thus € 82 million or 3.2% down on31 December 2005. This was essentially due to a reduction in pension provisions,resulting from a change in the UK discount rate for pension provisions caused bythe substantial increase in the long-term market interest rate.
Financial liabilitiesAs at 30 September 2006, financial liabilities comprised non-current financial liabi-lities of € 3.1 billion and current financial liabilities of € 1.2 billion. As at 31December 2005, non-current assets stood at € 3.2 billion, with current financialliabilities of € 1.1 billion. Since non-current financing schemes were hedged in2005, the allocation of assets according to maturity did not show any materialchanges. At the end of the first nine months of the 2006 financial year, net debtaccounted for € 2.9 billion (down from € 3.8 billion at the end of the 2005 finan-cial year).
Other liabilitiesAs at 30 September 2006, other liabilities stood at € 4.6 billion, up € 584 millionor 14.5% as against 31 December 2005. This was mainly due to the increase in trade accounts payable.

Economic Situation Interim Report 3rd Quarter 2006
21
Other segment ratios
Capital expenditure € million Q3 2006 Q3 2005 9M 2006 9M 2005 Var. %
Tourism 129.9 143.0 478.0 393.3 + 21.5Central Europe 31.3 5.5 206.0 67.8 + 203.8Northern Europe 31.8 14.7 60.0 46.5 + 29.0Western Europe 20.9 94.8 63.0 190.6 - 66.9Destinations 41.6 23.4 134.3 73.6 + 82.5Other tourism 4.3 4.6 14.7 14.8 - 0.7Shipping 10.4 14.3 148.6 180.2 - 17.5Central operations 4.3 3.2 12.5 10.6 + 17.9Continuing operations 144.6 160.5 639.1 584.1 + 9.4Trading – 1.7 2.0 3.5 - 42.9Special logistics – 11.7 – 23.7 –Discontinuing operations – 13.4 2.0 27.2 - 92.6Total 144.6 173.9 641.1 611.3 + 4.9
Depreciation of property, plant and equipment€ million Q3 2006 Q3 2005 9M 2006 9M 2005 Var. %
Tourism 84.3 93.8 262.8 266.7 - 1.5Central Europe 13.8 14.8 45.2 47.6 - 5.0Northern Europe 29.5 30.9 88.7 86.2 + 2.9Western Europe 17.3 16.0 51.9 34.8 + 49.1Destinations 20.1 21.8 60.8 66.8 - 9.0Other tourism 3.6 10.3 16.2 31.3 - 48.2Shipping 75.1 24.7 236.4 73.9 + 219.9Central operations 3.0 3.7 17.0 11.9 + 42.9Continuing operations 162.4 122.2 516.2 352.5 + 46.4Trading – – – – –Special logistics – – – – –Discontinuing operations – – – – –Total 162.4 122.2 516.2 352.5 + 46.4
Employees30 Sep 2006 31 Dec 2005 Var. %
Tourism 52,552 50,498 + 4.1Central Europe 9,872 9,691 + 1.9Northern Europe 15,874 16,254 - 2.3Western Europe 6,639 6,904 - 3.8Destinations 19,695 12,866 + 53.1Other tourism 472 4,783 - 90.1Shipping 8,335 9,077 - 8.2Central operations 953 2,183 - 56.3Continuing operations 61,840 61,758 + 0.1Trading – 1,189 –Special logistics – – –Discontinuing operations – 1,189 –Total 61,840 62,947 - 1.8

Interim Report 3rd Quarter 2006 Economic Situation
22
ProspectsFor the second half of 2006, economic researchers expect the economic recoveryto continue, albeit at a slightly slower pace. Despite a slight downturn in economicactivity, the development of the economic framework for the TUI Group’s activitiesis expected to continue to be positive. This means that the propensity to consumewill continue to rise in European countries and will thus boost the demand for travel,with growth in world trade and hence container transportation continuing as fore-cast. Nevertheless, individual countries may see below-average market growth intourism, and container shipping may record an adverse effect on freight rates dueto a temporary imbalance of supply and demand in individual trade lanes. As far asexternal factors are concerned, the development of earnings by the divisions willprimarily be impaired by the persistently high crude oil price and its impact on thedevelopment of aircraft fuel and ship bunker costs.
In tourism, the overall restrained upturn in bookings continued in the 2006 summerseason, which ended at the end of October. At Group level, bookings had risen slightlyyear-on-year by end-October with 2.4% growth in the number of customers, whilebooked turnover matched 2005 levels at year-on-year growth of 0.1%. In regional terms,growth was strongest in the smaller markets, some of which recorded substantial growth.Bookings for the 2006/2007 winter season, which started on 1 November, saw off toa good start. At Group level, booked turnover is currently 5.8% up year-on-year, withcustomer numbers up 11.5% on 2005 levels. Besides the large markets Germany andFrance, growth in booking numbers is recorded in particular by the smaller markets,some of which recorded substantial growth. Booked turnover in the UK and Irelandreflects the currently unfavourable market environment in these countries.
Booking numbersYear-on-year Summer 2006 Winter 2006/2007variation in % Turnover Customers Turnover Customers
Germany - 1.4 + 4.4 + 4.3 + 9.2Switzerland + 7.8 + 4.4 + 18.8 + 18.4Austria - 4.3 - 3.6 + 10.3 - 0.9Eastern Europe + 9.8 + 4.7 + 11.7 + 7.4Central Europe - 0.9 + 3.9 + 5.4 + 9.1UK - 3.3 - 0.4 - 7.0 + 11.9Ireland + 2.1 - 1.3 - 0.1 - 6.6Nordic countries + 3.3 + 0,1 + 42,1 + 24.5Northern Europe - 2.0 - 0.4 + 5.1 + 14.3France - 3.3 - 4.5 + 5.3 + 14.7Netherlands + 9.1 + 2.2 + 14.0 + 10.2Belgium + 14.3 + 12.5 + 9.5 + 10.1Western Europe + 5.6 + 2.9 + 8.3 + 12.5Group + 0.1 + 2.4 + 5.8 + 11.5
As at 27 October 2006
Concerning the development of earnings (earnings before interest, taxes andamortisation of goodwill - EBITA) by the individual sectors of the tourism division,an uneven trend emerges for the 2006 financial year. In the Central Europe sector,programmes to improve production workflows and product innovation have againbeen reinforced. Despite the resulting one-off expenses, these programmes willgenerate an improvement in earnings. In the Northern Europe sector, earnings willbenefit from the restructuring programmes implemented in the UK in 2005. Anopposite effect will be caused by the declining trend in the market observed sincethe summer months. The Nordic countries are expected to reproduce 2005 earningslevels. The Western Europe sector is not expected to generate a positive accumulatedprofit contribution due to the market weakness in France, which has persisted
Tourism
Economic Situation Interim Report 3rd Quarter 2006
23
longer than expected. As before, the destinations sector is expected to generate ahigh earnings level again. In addition, Other tourism will substantially benefit fromthe positive gain on disposal from the divestment of the business travel activities.Earnings by the tourism division will additionally be determined by the efficiencyimprovement and cost-cutting programmes to be adopted by year-end.
In shipping, the integration of CP Ships into Hapag-Lloyd will have a substantialeffect on earnings in the 2006 financial year (earnings before interest, taxes andamortisation of goodwill – EBITA). The integration will be fully completed beginning2007 and will entail costs, quantified as slightly more than € 100 million, most ofwhich will be incurred in the 2006 financial year. In the course of the integrationprocess, synergy effects, resulting among others from efficiency improvements andcost cuts, are expected to be realised. They are expected to already positively affectthe earnings situation in 2007 and had originally been expected to initially generateearnings improvements of around € 180 million as of 2008, following the completionof the integration process. The integration process is currently progressing con-siderably faster than originally expected and has shown additional earnings enhance-ment potential, so that synergies worth up to € 220 million are now aimed at.
Turnover of the shipping division is characterised by the first-time consolidation ofCP Ships for a full financial year. Despite an increase in transport volumes, theshipping division is expected to significantly undercut the high earnings levels achievedin 2005. This assumption is based, among others, on the integration costs, thedevelopment of freight rates in individual trade lanes, in particular in Asian trans-ports, the increase in bunker costs and the cost of land-based transport. Fromtoday’s perspective, given the current external framework the shipping division isexpected to generate negative earnings due to the one-off integration costs.
From today’s perspective, central operations are expected to show a significantimprovement, primarily attributable to income from the real estate segment andthe disposal of the heating, ventilation and air conditioning activities.
Overall, turnover by the TUI Group is therefore expected to grow significantly, withrelevant earnings (EBITA) expected to decline year-on-year.
Corporate GovernanceIn the course of the third quarter of 2006, the composition of the Executive Boardof TUI AG changed as follows:
With effect from 1 September 2006, the Supervisory Board appointed Mr ChristophR. Mueller as member of the Executive Board of TUI AG. Mr Mueller will be in chargeof controlling. He will temporarily also be in charge of the operative managementof the two German airlines Hapagfly and Hapag-Lloyd Express. Mr Sebastian Ebel,previously responsible for controlling and tourism platforms, left the ExecutiveBoard of TUI AG by mutual consent.
The current complete composition of the Executive Board and Supervisory Boardhas been published on the Company’s website (www.tui-group.com), where it ispermanently accessible to the public.
TUI AGThe Executive BoardNovember 2006
Shipping

24
Interim Report 3rd Quarter 2006 Financial Statements
Condensed profit and loss statement of the TUI Group for the period from 1 July to 30 SeptemberQ3 2006 Q3 2005 Q3 2005
€ million restated Restatement original
Turnover 6,739.7 6,222.7 – 6,222.7Other income 119.5 235.0 – 235.0Change in inventories and other own work capitalised + 6.7 + 4.2 – + 4.2Cost of materials and purchased services 4,883.6 4,307.5 + 0.5 4,307.0Personnel costs 603.2 568.3 - 15.9 584.2Depreciation and amortisation 159.6 122.1 – 122.1Impairment of fixed assets 2.8 0.1 – 0.1Other expenses 717.8 817.1 - 1.9 819.0Financial income 47.4 83.0 + 18.6 64.4Financial expenses 97.5 78.9 + 26.4 52.5Earnings from companies measured at equity + 24.2 + 16.2 – + 16.2Earnings before taxes on income + 473.0 + 667.1 + 9.5 + 657.6Income taxes + 176.8 + 111.1 + 2.9 + 108.2Result from continuing operations + 296.2 + 556.0 + 6.6 + 549.4Result from discontinuing operations + 3.2 + 48.3 + 0.1 + 48.2Group profit + 299.4 + 604.3 + 6.7 + 597.6Attributable to shareholders of TUI AG + 273.0 + 573.6 + 6.7 + 566.9Attributable to minority interest + 26.4 + 30.7 – + 30.7Group profit for the year + 299.4 + 604.3 + 6.7 + 597.6
Q3 2006 Q3 2005 Q3 2005
€ restated Restatement original
Basic earnings per share + 1.09 + 2.98 + 0.03 + 2.95from continuing operations + 1.08 + 2.75 + 0.03 + 2.72from discontinuing operations + 0.01 + 0.23 – + 0.23Diluted earnings per share + 1.05 + 2.74 + 0.02 + 2.72from continuing operations + 1.04 + 2.53 + 0.02 + 2.51from discontinuing operations + 0.01 + 0.21 – + 0.21

Financial Statements Interim Report 3rd Quarter 2006
25
Condensed profit and loss statement of the TUI Group for the period from 1 January to 30 September9M 2006 9M 2005 9M 2005
€ million restated Restatement original
Turnover 16,241.8 13,793.1 – 13,793.1Other income 581.9 584.2 – 584.2Change in inventories and other own work capitalised + 14.0 - 3.8 – - 3.8Cost of materials and purchased services 12,110.1 9,722.8 - 3.0 9,725.8Personnel costs 1,848.0 1,637.4 - 47.8 1,685.2Depreciation and amortisation 496.5 347.9 – 347.9Impairment of fixed assets 19.7 4.6 – 4.6Other expenses 1,890.4 2,010.1 - 11.7 2,021.8Financial income 159.7 150.3 + 55.7 94.6Financial expenses 296.1 263.5 + 79.1 184.4Earnings from companies measured at equity + 40.1 + 30.1 – + 30.1Earnings before taxes on income + 376.7 + 567.6 + 39.1 + 528.5Income taxes + 146.0 + 99.1 + 12.6 + 86.5Result from continuing operations + 230.7 + 468.5 + 26.5 + 442.0Result from discontinuing operations + 16.2 + 95.5 + 0.2 + 95.3Group profit + 246.9 + 564.0 + 26.7 + 537.3Attributable to shareholders of TUI AG + 207.1 + 527.0 + 26.7 + 500.3Attributable to minority interest + 39.8 + 37.0 – + 37.0Group profit for the year + 246.9 + 564.0 + 26.7 + 537.3
9M 2006 9M 2005 9M 2005
€ restated Restatement original
Basic earnings per share + 0.83 + 2.88 + 0.15 + 2.73from continuing operations + 0.77 + 2.37 + 0.15 + 2.22from discontinuing operations + 0.06 + 0.51 – + 0.51Diluted earnings per share + 0.81 + 2.68 + 0.13 + 2.55from continuing operations + 0.75 + 2.22 + 0.13 + 2.09from discontinuing operations + 0.06 + 0.46 0.00 + 0.46

Interim Report 3rd Quarter 2006 Financial Statements
26
Condensed consolidated balance sheet of the TUI Group€ million 30 Sep 2006 31 Dec 2005
Assets Goodwill 3,801.9 3,756.4Other intangible assets 758.2 898.5Investment property 87.9 90.2Other property, plant and equipment 5,750.3 5,881.0Companies measured at equity 392.0 372.7Other investments 335.6 322.7Fixed assets 11,125.9 11,321.5Receivables from derivative financial instruments 27.4 51.1Other receivables and assets 169.6 192.8Deferred income tax assets 271.5 299.4Non-current receivables 468.5 543.3Non-current assets 11,594.4 11,864.8
Inventories 136.8 150.4Trade accounts receivable 1,129.6 965.3Receivables from derivative financial instruments 79.5 149.1Other receivables and assets 920.2 869.3Current income tax assets 18.8 15.6Current receivables 2,148.1 1,999.3Assets classified as held for sale 209.5 714.7Cash and cash equivalents 1,496.9 599.2Current assets 3,991.3 3,463.6
15,585.7 15,328.4
€ million 30 Sep 2006 31 Dec 2005
Group equity and liabilitiesSubscribed capital 641.0 641.0Reserves 2,931.8 3,172.6Amounts recognised directly in equity relating to non-current assets held for sale 0.0 4.6Hybrid capital 294.8 294.8Equity before minority interests 3,867.6 4,113.0Minority interests 271.3 262.2Group equity 4,138.9 4,375.2
Provisions for pensions and similar obligations 1,170.5 1,260.8Deferred and current income tax provisions 235.1 293.4Other provisions 393.6 401.9Non-current provisions 1,799.2 1,956.1Financial liabilities 3,146.8 3,213.9Liabilities from derivative financial instruments 19.1 32.1Other liabilities 28.7 39.4Non-current liabilities 3,194.6 3,285.4Non-current provisions and liabilities 4,993.8 5,241.5
Provisions for pensions and similar obligations 33.7 32.8Current income tax provisions 86.4 19.8Other provisions 575.4 568.0Current provisions 695.5 620.6Financial liabilities 1,202.8 1,144.3Trade accounts payable 2,642.3 2,103.7Liabilities from derivative financial instruments 120.0 41.0Other liabilities 1,692.1 1,513.6Current liabilities 5,657.2 4,802.6Liabilities from assets classified as held for sale 100.3 288.5Current provisions and liabilities 6,453.0 5,711.7
15,585.7 15,328.4

Financial Statements Interim Report 3rd Quarter 2006
27
Statement of Recognised Income and Expenses€ million 9 M 2006 9 M 2005
Currency translation - 162.5 138.5Reserves for change in value of financial instruments - 213.0 271.9Change in value with no effect on net income from companies measured at equity - 4.1 0.0Actuarial gains and losses from pension provisions and associated fund assets 58.9 0.0Tax item directly offset against equity 58.2 - 111.9Income and expenses directly recognised in equity - 262.5 298.5Group profit 246.9 564.0Total income and expenses recognised in the financial year - 15.6 862.5- attributable to shareholders of TUI AG - 46.2 817.4- attributable to minority interests 30.6 45.1
Condensed cash flow statement for the period from 1 January to 30 September€ million 2006 2005
Cash flow from operating activities 1,136.1 1,453.7Cash flow from investing activities 170.6 - 461.9Cash flow from financing activities - 415.1 246.8Change in funds with cash effect 891.6 1,238.6Change in cash and cash equival. due to changes in consolidation and exchange rate fluctuations - 1.6 9.4Cash and cash equivalents at the beginning of the period 607.5 481.1Cash and cash equivalents at the end of the period 1,497.5 1,729.1of which included in the balance sheet item assets classified held for sale 0.6 0.0Cash and cash equivalents at the end of the period for continuing operations 1,496.9 1,729.1

28
Notes
Accounting principlesThe Group’s interim financial statements as at 30 September 2006 were prepared ina condensed form compared with the consolidated annual financial statements inaccordance with IAS 34 ‘Interim Financial Reporting’. The only deviation from thehistorical cost principle was the accounting method applied in measuring financialinstruments.
As of the beginning of the 2006 financial year, the following standards revised ornewly issued by the IASB were applicable:
IAS 21 The Effects of Changes in Foreign Exchange Rates (amendment concerningnet investments in a foreign operation),
IAS 39 Financial Instruments: Recognition and Measurement (amendment on hedges of forecast intra-Group transactions),
IAS 39 Financial Instruments: Recognition and Measurement (amendment on fairvalue option),
IAS 39 Financial Instruments: Recognition and Measurement (amendment onfinancial guarantee contracts),
IFRS 4 Insurance Contracts (amendment on financial guarantee contracts), IFRS 6 Exploration for and Evaluation of Mineral Resources, IFRIC 4 Determining whether an Agreement contains a Lease, IFRIC 5 Rights to Interest arising from Decommissioning, Restoration and Environ-
mental Rehabilitation Funds,IFRIC 6 Liabilities arising from Participating in a Specific Market – Waste Electrical
and Electronic Equipment.
The application of these standards did not have any material effects on the TUIGroup’s accounting and measurement methods.
In addition, the revised IAS 19 Employee Benefits has been compulsory since 1 January 2006. This standard had already been applied voluntarily since 1 January2005, and the option provided under this standard of offsetting actuarial gains andlosses against equity with no effect on results when they occur had been exercisedsince that date.
With the exception of the changes outlined above, the interim financial statementsas at 30 September 2006 were prepared in accordance with the same accountingand measurement principles as those applied in the preceding consolidated financialstatements as at 31 December 2005.
The 2005 profit and loss statement was restated retrospectively in order to accountfor the effects of the changes in accounting and measurement methods only im-plemented with the consolidated financial statements for 2005. The reversal of the

Notes Interim Report 3rd Quarter 2006
29
amortisation of actuarial gains and losses in the recognition of pension obligationsresulted in a decline in personnel costs of € 24.4 million while deferred income taxexpenses rose by € 7.5 million and earnings from discontinuing operations increasedby € 0.2 million. The interest portion of the measurement of pension obligations wasno longer carried under personnel expenses but was shown under financial expenses.Accordingly, the expected return from the related fund assets was recognised asfinancial income. As a result, personnel costs declined by € 23.4 million, with anincrease in financial expenses of € 79.1 million and financial income of € 55.7 million.
Due to changes in the treatment of costs for the production of holiday brochures,the cost of material and purchased services declined by € 3.0 million and otherexpenses dropped by € 11.7 million, while deferred income tax expenses rose by€ 5.1 million.
In order to enhance the comparability of figures, the restated figures for 2005 arepresented alongside the originally published figures. The accounting and measure-ment methods hitherto applied are outlined in detail in the notes on the consolid-ated financial statements as at 31 December 2005.
Group of consolidated companiesThe consolidated financial statements included all major subsidiaries in which TUI AGwas able to directly or indirectly govern the financial or operating policies such thatthe Group obtained benefits from the activities of these companies.
The interim financial statements as at 30 September 2006 included a total of 41domestic and 349 foreign subsidiaries, besides TUI AG.
Since 31 December 2005, eleven companies were newly included in the group ofconsolidated companies. Five companies were included in consolidation for the firsttime due to acquisitions. One further company was included due to an expansionof its business activities. In addition, five newly founded companies were includedin consolidation for the first time. Ten additions related to the tourism division,with one company added to the shipping division.
Since 31 December 2005, a total of 64 companies were removed from consolidation.Fourty-four companies related to the tourism division. Besides the divestment ofthe TQ3 Group (twelve companies), the liquidation of subsidiaries (20 companies)was the main reason for the reduction in the group of consolidated companies.A further twelve companies were removed from consolidation due to mergers. Fifteen deconsolidated companies related to the trading division. All of these werecompanies operating in the US steel trading business of PNA Group Inc. Five furthercompanies operated in the shipping division.
Acquisitions – divestmentsAs at 31 March 2006, TUI AG completed the sale of the business travel activitiespooled under TQ3 Travel Solutions Management Holding GmbH to the Dutch BCDHoldings N.V. By 31 March 2006, the TQ3 Group generated turnover of € 62.3 millionand earnings after income tax of € - 3.1 million. In the first three quarters of 2005,it posted turnover of € 175.5 million and earnings of € - 12.3 million. A total oftwelve subsidiaries were divested at a selling price of € 232.9 million. Following thededuction of the expenses associated with the divestment of € 18.0 million, thedivestment resulted in overall positive earnings before income taxes of € 149.2

million in the first nine months of 2006, carried under Other tourism. In the frame-work of the divestment, liabilities to TUI AG totalling around € 98 million were offset.
€ million 31 March 2006 31 Dec 2005
Goodwill 104.7 104.9Other intangible assets 2.9 2.5Property, plant and equipment 15.9 23.0Investments 13.5 13.9Trade accounts receivable 84.6 64.8Other receivables and assets 51.4 49.2Deferred income tax claims 4.5 2.3Cash and cash equivalents 30.6 7.3Pension provisions 14.2 13.7Provisions for income taxes 2.5 1.8Other provisions 16.1 14.6Financial liabilities 5.5 6.2Trade accounts payable 60.6 39.7Other liabilities 143.5 118.5Share of TUI AG shareholders in equity 65.7 73.4
Since the sales negotiations entered an increasingly specific stage, the businesstravel activities were already classified as a disposal group in accordance with IFRS 5as at 20 December 2005. The assets and liabilities of the TQ3 Group thereforealready had to be summarized in separate balance sheet items in the annual financialstatements for 2005.
As at 9 May 2006, TUI AG sold its wholly-owned indirect subsidiary PNA Group Inc.to US financial investor Platinum Equity. By 9 May 2006, the PNA Group generatedturnover of € 401.0 million and posted earnings after income taxes of € 19.8 million.In the first three quarters of 2005, turnover had totalled € 747.6 million, with earn-ings of € 22.4 million. The sale of a total of 15 subsidiaries was effected at a sellingprice of € 210.8 million. Including the expenses of € 6.9 million associated with thedivestment, the sale generated overall negative earnings before income taxes of€ 12.6 million for the trading division in the first nine months of 2006.
€ million 9 May 2006 31 Dec 2005
Property, plant and equipment 59.6 63.7Investments 7.0 6.8Trade accounts receivable 137.8 125.1Other receivables and assets 226.9 190.9Deferred income tax claims 10.2 4.2Cash and cash equivalents 0.8 1.7Pension provisions 7.4 7.9Provisions for income taxes 14.4 2.6Other provisions 10.0 13.8Financial liabilities 67.7 50.4Trade accounts payable 120.0 94.0Other liabilities 3.7 5.8Equity 219.1 217.9Minority interests 2.6 2.4Share of TUI AG shareholders in equity 216.5 215.5
With the application of IFRS 5, the US steel service companies were classified asdiscontinuing operations as at 1 January 2005. The assets and liabilities of thePNA Group already had to be summarized in separate balance sheet items in the2005 consolidated financial statements.
30
Interim Report 3rd Quarter 2006 Notes

As at the end of the first half of the year, the special travel activities of TUI Neder-land were sold with effect from 1 January 2006 in the framework of a managementbuy-out. TUI Nederland N.V. sold all assets and liabilities of the special travel com-pany to De Reisspezialisten Groep B.V. at a selling price of € 17.5 million. In thefirst three quarters of 2006, the divestment resulted in positive earnings beforeincome taxes of € 12.4 million. The turnover and profit contribution of the divestedgroup of special travel companies had to be classified as immaterial in relation tothe TUI Group’s consolidated turnover and earnings.
With effect from 5 October 2006, TUI AG sold its 80% share in Wolf GmbH at aselling price of € 61.8 million to CENTROTEC Sustainable AG. By 30 September 2006,Wolf GmbH posted turnover of € 154.1 million with earnings after income taxes of€ 3.6 million. In the first nine months of 2005, turnover had totalled € 138.6 million,with earnings of € 1.3 million. Due to the divestment, the business operations ofWolf GmbH were classified as a disposal group as at 30 September 2006 in accord-ance with IFRS 5. The assets and liabilities of Wolf GmbH were therefore summarizedin separate balance sheet items as at 30 September 2006.
On 27 September 2006, TUI AG sold 50.1% of its shares in TUI InfoTec GmbH toSonata Software Limited, Bangalore, at a selling price of € 18.0 million. The transferof stock ownership will only be effective once several suspensive conditions willhave been met, but not before 31 October 2006. By 30 September 2006, the TUIInfoTec Group posted turnover of € 95.9 million, with balanced earnings after in-come taxes. In the first nine months of 2005, turnover had totalled € 96.8 million,with earnings of € 4.4 million. Due to the divestment, the business operations ofthe TUI InfoTec Group were classified as a disposal group as at 30 September 2006in accordance with IFRS 5. The assets and liabilities of the TUI InfoTec Group weretherefore summarized in separate balance sheet items as at 30 September 2006.
As at 24 August 2006, TUI UK Limited, London, acquired 100% of the shares inExplorers Travel Club Ltd., Camberley (UK) a provider of individual and organiseddiving tours. The purchase price (including incidental acquisition costs) totalledaround € 13.5 million, while net assets amounted to € 3.9 million. The resultinggoodwill of € 9.6 million was initially carried as goodwill since the revaluation ofassets and liabilities was not yet completed.
CarryingCarrying Revaluation amounts
amounts at of assets at date ofacquisition and first-time
€ million date liabilities consolidation
Property, plant and equipment 3.1 – 3.1Inventories 0.2 – 0.2Other receivables and assets 0.8 – 0.8Cash and cash equivalents 1.2 – 1.2Provisions for income taxes 0.1 – 0.1Other liabilities 1.3 – 1.3Group equity 3.9 – 3.9
Discontinuing operationsAt the beginning of the 2005 financial year, both the US steel service companiesand the then remaining special logistics activities were classified as discontinuing
31
Notes Interim Report 3rd Quarter 2006

32
operations in the framework of the first-time application of IFRS 5. The divestmentof the rail logistics business unit of VTG (UB I) to the Luxembourg-based companyCompagnie Européene de Wagons was already successfully completed in December2005. In February 2006, TUI sold its indirect 100% share in the US steel tradingbusiness of PNA Group Inc. to financial investor Platinum Equity subject to a suspensive condition. The sale was completed on 9 May 2006.
Result from the discontinuing operationsBesides the operating income and expenses of these operations, the result from thediscontinuing operations also included effects of the deconsolidation of operationsalready divested.
Interim Report 3rd Quarter 2006 Notes
Result from the discontinuing operations (after income tax)€ million Q3 2006 Q3 2005 9M 2006 9M 2005
Special logistics – 7.5 – 18.8Trading – 6.6 19.8 22.4Energy – – – –Sub-total – Result after income tax – 14.1 19.8 41.2Special logistics 3.0 - 0.1 3.0 20.0Trading - 0.5 – - 12.6 –Other divestments 0.7 34.3 6.0 34.3Sub-total – Result from divestment/deconsolidation 3.2 34.2 - 3.6 54.3Special logistics 3.0 7.4 3.0 38.8Trading - 0.5 6.6 7.2 22.4Other divestments 0.7 34.3 6.0 34.3Total – Result from the discontinuing operations 3.2 48.3 16.2 95.5
Material items of the profit and loss statement of the discontinuing operationsSpecial logistics Trading
€ million Q3 2006 Q3 2005 9M 2006 9M 2005 Q3 2006 Q3 2005 9M 2006 9M 2005
Turnover – 109.2 – 325.3 – 252.1 401.0 747.6Operating income – 3.3 – 10.5 – 0.4 0.3 0.6Depreciation/amortisation – – – – – – – –Other operating expenses – 98.1 – 298.1 – 242.6 372.1 711.0Financial income – 0.4 – 2.4 – 0.3 0.4 1.0Financial expenses – 2.5 – 7.6 – 1.4 1.4 4.8Result from companies measured at equity – 0.5 – 0.8 – 0.4 0.6 1.1Earnings before taxes on income – 12.8 – 33.3 – 9.2 28.8 34.5Income taxes – 5.3 – 14.5 – 2.6 9.0 12.1Earnings after taxes on income – 7.5 – 18.8 – 6.6 19.8 22.4
Material assets and liabilities of the discontinuing operationsTrading
€ million 30 Sept 2006 31 Dec 2005
Non-current assets – 74.7Current assets – 317.7Non-current provisions and liabilities – 50.3Current provisions and liabilities – 124.2

33
Notes on the consolidated profit and loss statement The year-on-year development of the consolidated profit and loss statement wasessentially characterised by changes in the group of consolidated companies. Onthe one hand, the TQ3 Group was only included in continuing operations until 31 March 2006. On the other hand, the first-time consolidation of the CP ShipsGroup was not effected until the fourth quarter of 2005. A year-on-year comparisonof the performance of the continuing operations for the first nine months of 2006is therefore of limited use only.
As at 30 September 2006, the operative business of CP Ships’ container line wasalmost completely integrated into Hapag-Lloyd. In the period under review, earningsby the shipping division were impacted by the restructuring of CP Ships of € 64million, comprising in particular the cost of personnel layoffs and of rental agree-ments for administrative buildings. Overall, earnings by the shipping division declineddue to the development of freight rates and an increase in short-term charter ratesand bunker oil costs.
The year-on-year development of earnings by the tourism division was essentiallycharacterised by the income of around € 149 million from the divestment of theTQ3 Group, carried under Other tourism.
Earnings by the tourism division for the first nine months of 2006, adjusted for theincome from the divestment of the TQ3 Group, fell short of 2005 levels althoughsource markets Central Europe and Northern Europe recorded a year-on-yearincrease in earnings. The main reason for this decline was the persistently difficultmarket environment in France. While the destinations sector reported an increasein operating earnings in parts of its operations, its overall performance declinedyear-on-year due to one-off effects in 2005. In the first three quarters of 2005,the destinations sector had posted income of € 12.0 million from the reversal of thenegative goodwill resulting from the acquisition of the shares in Touristik Finanz AG.
In the first nine months the Western Europe sector generated income of € 12 million from the divestment of the special travel activities of TUI Nederland, € 7million from the sale of an administrative building and € 5 million from two aircraftsale-and-lease-back agreements. In addition, restructuring expenses of € 12 mil-lion were incurred for staffing level adjustment measures initiated and implementedin France. In the Central Europe sector, earnings in the period under review wereimpacted by restructuring expenses of € 12 million resulting from staffing leveladjustment measures, but at the same time benefited from income of € 25 millionfrom four aircraft sale-and-lease-back agreements. In the Other tourism sector,
Cash flows from the operating activities as well as the investing and financing activities of the discontinuing operations
Special logistics Trading
€ million Q3 2006 Q3 2005 9M 2006 9M 2005 Q3 2006 Q3 2005 9M 2006 9M 2005
Cash flow from operating activities – 14.6 – 30.5 – 47.2 - 17.4 101.2Cash flow from investing activities – - 11.1 – - 23.3 – - 2.1 - 2.0 - 3.4Cash flow from financing activities – - 2.8 – - 4.9 – - 46.1 18.4 - 95.7Change in cash and cash equivalents due to exchange rate fluctuations – – – – – 0.1 0.1 - 0.3Development of cash and cash equivalents – 0.7 – 2.3 – - 0.9 - 0.9 1.8
Notes Interim Report 3rd Quarter 2006

provisions of € 3 million were formed for social plan expenses in connection withthe divestment of the TUI InfoTec Group.
In the Other operative companies sector, the Group’s real estate companies postedone-off income of € 40.8 million from the selling agreement for the ‘Schacht Konrad’,already concluded at the end of the 1980s. Due to suspensive conditions, theseearnings had not yet been realized.
The 2005 reference period benefited from valuation earnings of around € 5 millionfrom the fair value measurement of the conversion options from the convertiblebond issued in October 2003. In the first quarter of the period under review, in con-trast, fair value measurement generated income of € 15 million. Since, with effectfrom 3 April 2006, TUI AG irrevocably waived its option, to be exercised unilaterally,of being able to deliver cash if a conversion option is exercised, the conversionoptions were treated as equity instruments again as of the date of the waiver. Thus, fair value measurement with an effect on results ceased to be effected as of3 April 2006.
Overall, the earnings situation was characterised by the seasonal nature of the tourism business. Due to the business cycles, profit contributions in the tourismdivision predominantly arise in the second and third quarter of any one year.
In the first three quarters of the 2006 financial year, net unusual expenses afterincome tax of around € 4 million were carried under ‘Result from the discontinuingoperations’. These expenses mainly resulted from the cost of deconsolidation of thePNA Group of around € 13 million as well as income of € 5 million from the pay-ment of previously disputed dividend claims on a company of the Preussag EnergieGroup and income from a reimbursement of pension payments, associated withthe disposal of the special logistics activities (UB I). In 2005, earnings from discon-tinuing operations comprised unusual income after income tax of around € 54 mil-lion from the reversal of provisions no longer required (around € 20 million) andfrom purchase price adjustments in connection with the divestment of the PreussagEnergie Group (around € 34 million).
Notes on the consolidated balance sheet The changes in the consolidated balance sheet in comparison with 31 December2005 mainly resulted from the cycle of the tourism business. Both trade accountsreceivable and the corresponding trade accounts payable in the tourism divisionrose due to the development of the tourism season. Due to the increase in advancetourism payments, other liabilities as well as liquid funds also rose within that period.
Goodwill rose as against its level on 31 December 2005, mainly due to changes inexchange rate parities – in particular against the British pound sterling – of thegoodwill recognised in the functional currencies of the respective subsidiaries. Inaddition, goodwill of € 9.6 million arose from the acquisition of Explorers TravelClub Ltd., Camberley (UK).
34
Interim Report 3rd Quarter 2006 Notes

Notes Interim Report 3rd Quarter 2006
35
Assets held for sale and related liabilities€ million 30 Sept 2006 31 Dec 2005
Trading – 392.4TQ3 Group – 263.9Wolf GmbH 112.9 –TUI InfoTec Group 60.2 –Other non-current assets 36.4 58.4Assets held for sale 209.5 714.7Trading – 171.7TQ3 Group – 114.4Wolf GmbH 62.1 –TUI InfoTec Group 38.2 –Liabilities related to other non-current assets – 2.4Liabilities from assets classified as held for sale 100.3 288.5
The reduction in assets held for sale and the related liabilities mainly resulted fromthe divestment of the TQ3 Group to the Dutch company BCD Holdings N.V. as at31 March 2006 and the sale of PNA Group Inc. to US financial investor PlatinumEquity as at 9 May 2006. Since Wolf GmbH and the TUI InfoTec Group will bedivested in the fourth quarter of 2006, the business activities of these companieswere classified as disposal groups in accordance with IFRS 5 as at 30 September2006. The assets and liabilities of Wolf GmbH and TUI InfoTec Group were thereforepooled under ‘Assets held for sale and related liabilities’ as at 30 September 2006.
Changes in equityThe TUI Group exercises the option offered by IAS 19 of offsetting actuarial gainsand losses against equity with no effect on results when they occur. In this con-text, provisions for pensions were reduced by € 58.9 million in the period underreview, primarily due to the increase in the long-term interest rate level observedin the UK since the beginning of the year. Taking account of deferred taxes of€ 17.7 million to be carried, equity rose accordingly by € 41.2 million with no effecton results.
Group equity rose by a further € 7.2 million due to the reclassification of the conversion options from the convertible bond issued in 2003, previously carried asderivative liabilities, to capital reserves with no effect on results. Reclassification withno effect on results was possible since TUI AG irrevocably waived its option of deli-vering cash should a conversion option be exercised with effect from 3 April 2006.Conversion options have therefore had to be treated as equity instruments againsince the waiver date and will no longer create any earnings effects as a result offair value measurement with an effect on results.
Group equity also rose due to positive consolidated earnings of € 246.9 million.
Group equity declined due to differences in the currency translation of financialstatements of foreign subsidiaries.
A further reason for the year-on-year decline in equity was the resolution, adoptedby the Annual General Meeting of TUI AG on 10 May 2006, to pay a dividend totalling€ 193.1 million for the 2005 financial year.
Equity also declined due to changes in the value of financial instruments, used tohedge against exposure to payment flow risks, carried with no effect on results.

Interim Report 3rd Quarter 2006 Notes
36
Contingent liabilitiesAs at 30 September 2006, the TUI Group’s contingent liabilities totalled around € 251 million (31 December 2005: around € 306 million). Contingent liabilities werecarried at the level of potential availment as at the balance sheet date. They mainlyrelated to remaining guarantees and warranties from the former plant engineeringand shipbuilding activities, which serve to settle ongoing business transactions andwere reduced in the first nine months of 2006.
Other financial liabilitiesFinancial liabilities from operating rental, lease and charter agreements declinedslightly at the end of the third quarter of 2006 to € 4.0 billion, down from € 4.4billion as at 31 December 2005. The fair value dropped accordingly from € 3.8 billionto € 3.5 billion.
The remaining other financial liabilities dropped to € 3.4 billion as at the end of thethird quarter of 2006, down from € 4.2 billion as at the end of the 2005 financialyear. At € 3.0 billion, the fair value declined year-on-year from € 3.7 billion. Whileorder commitments for tourism services declined slightly by € 0.9 billion to € 2.1billion for seasonal reasons, order commitments for investments stayed on pre-vious year’s level by € 1.1 billion.
Notes on the cash flow statementIn the period under review, cash and cash equivalents rose by € 890.0 million to € 1,497.5 million.
The inflow of cash from operating activities declined by € 317.6 million to € 1,136.1million year-on-year, primarily due to the divestment of the PNA Group and therail logistics of VTG and also to the earnings in the shipping division.
The inflow of cash from investing activities totalled € 170.6 million (previous year:outflow of € 461.9 million) in the current financial year. The inflow of cash in thecurrent financial year mainly resulted from the divestment of the TQ3 Group to theDutch company BCD Holdings N.V. and of PNA Group Inc. to US financial investorPlatinum Equity. On the other hand, payments of around € 565 million were madefor capital expenditure and investments in intangible assets, primarily for aircraftand hotels in the tourism division and for ships and containers in the shippingdivision.
The outflow of cash from financing activities totalled € 415.1 million (previous year:inflow of € 246.8 million). The high inflow of cash in 2005 was mainly attributableto the capital increase of € 1.0 billion implemented in the third quarter of 2005.
Cash and cash equivalents decreased by € 1.6 million due to changes in exchangerates and changes in the group of consolidated companies.

Notes Interim Report 3rd Quarter 2006
37
Statements of changes in equity
Segment ratios
External turnover with non-Group third parties according to divisions and sectors € million Q3 2006 Q3 2005 9M 2006 9M 2005
Tourism 5,160.8 5,285.8 11,312.9 11,294.3Shipping 1,511.0 873.3 4,756.4 2,307.3Other operative sectors 67.5 62.7 171.5 189.4Holding companies 0.4 0.9 1.0 2.1Continuing operations 6,739.7 6,222.7 16,241.8 13,793.1Special logistics – 109.2 – 325.3Trading – 252.1 401.0 747.6Discontinuing operations – 361.3 401.0 1,072.9Total 6,739.7 6,584.0 16,642.8 14,866.0
Condensed statement of changes in equity for the period from 1 January to 30 September 2006 Equity before
Subscribed Capital Revenue Hybrid minority Minority€ million capital reserves reserves capital interests interests Equity
Balance as at 1 January 2006 641.0 2,385.0 792.3 294.8 4,113.1 262.2 4,375.3Dividend payments 0.0 0.0 - 209.9 0.0 - 209.9 - 18.9 - 228.8Changes without effect on net income 0.0 7.2 - 249.9 0.0 - 242.7 - 11.8 - 254.5Reclassification convertible bond 0.0 7.2 0.0 0.0 7.2 0.0 7.2Final consolidation 0.0 0.0 3.4 0.0 3.4 - 2.6 0.8Differences from currency translation 0.0 0.0 - 154.6 0.0 - 154.6 - 7.9 - 162.5Measurement changes with no effect on results 0.0 0.0 - 156.3 0.0 - 156.3 - 1.9 - 158.2Tax items directly offset against equity 0.0 0.0 57.6 0.0 57.6 0.6 58.2Group profit 0.0 0.0 207.1 0.0 207.1 39.8 246.9Balance as at 30 September 2006 641.0 2,392.2 539.6 294.8 3,867.6 271.3 4,138.9
Condensed statement of changes in equity for the period from 1 January to 30 September 2005Equity before
Subscribed Capital Revenue minority Minority€ million capital reserves reserves interests interests Equity
Balance as at 1 January 2005 457.0 1,566.3 400.0 2,423.3 236.4 2,659.7Dividend payments 0.0 0.0 - 134.8 - 134.8 - 8.4 - 143.2Changes without effect on net income 0.0 0.0 292.0 292.0 - 6.8 285.2Differences from currency translation 0.0 0.0 130.4 130.4 8.1 138.5Measurement changes with no effect on results 0.0 0.0 271.9 271.9 0.0 271.9Tax items directly offset against equity 0.0 0.0 - 111.9 - 111.9 0.0 - 111.9First time consolidation 0.0 0.0 0.0 0.0 - 7.3 - 7.3Final consolidation 0.0 0.0 0.0 0.0 - 7.6 - 7.6Offsetting difference from theacquisition of minority interest 0.0 0.0 - 9.7 - 9.7 0.0 - 9.7Effect from business combination achieved in stages 0.0 0.0 11.3 11.3 0.0 11.3Capital Increase 182.8 813.3 0.0 996.1 0.0 996.1Group profit 0.0 0.0 527.0 527.0 37.0 564.0Balance as at 30 September 2005 639.8 2,379.6 1,084.2 4,103.6 258.2 4,361.8

Interim Report 3rd Quarter 2006 Notes
38
Earnings before interest, taxes and amortisation of goodwill according to divisions and sectors (EBITA)€ million Q3 2006 Q3 2005 9M 2006 9M 2005
Tourism 584 583 653 521Shipping - 25 95 - 91 218Other operative sectors 7 7 58 22Holding companies 14 81 - 18 39Consolidation - 51 - 58 - 54 - 87Continuing operations 529 708 548 713Special logistics 5 15 5 77Trading - 1 11 17 39Other divestments 2 35 7 35Discontinuing operations 6 61 29 151Consolidation – – – –Total 535 769 577 864
In the first three quarters of 2006, earnings before interest, taxes and amortisationof goodwill (EBITA) comprised the following results from the companies measuredat equity: tourism € 35.2 million (previous year: € 28.0 million), shipping € 4.9 million(previous year € 2.1 million), other operative sectors € 0.0 million (previous year: € 0.0 million), holding companies € 0.0 million (previous year: € 0.0 million), speciallogistics € 0.0 million (previous year: 0.9 million) and trading € 0.6 million (previousyear: € 1.1 million).
Events after the closing dateWith effect from 5 October 2006, TUI AG sold its majority interest in Wolf GmbH,a company operating in the heating, ventilation and air conditioning sector at a selling price of € 62 million. It was purchased by Centrotec Sustainable AG, Brilon.With this transaction, TUI divested its last remaining industrial shareholding.
The Indian software company Sonata Software Limited will hold a 50.1% share in theIT services company TUI InfoTec and will manage it as a joint venture in cooperationwith TUI, which still holds 49.9% of the joint venture. The selling price for the sharetotalled € 18 million. The transaction is expected to be completed in the fourthquarter of 2006.
In the framework of the reorganisation of business in Germany, the tour operatoractivities of the TUI, 1-2-Fly and Airtours brands and the TUI Leisure TravelManagement sales organisation were merged into one company in the summerof 2006. In this context, the production of tours of the Airtours brand and thusaround 100 jobs have been transferred from Frankfurt to Hanover. The remainingaround 100 jobs are planned to be successively shed.

Reservation concerning future-related statements Interim Report 3rd Quarter 2006
39
Reservation concerning future-related statementsThis interim report contains a number of statements related to the future develop-ment of TUI. These statements are based both on assumptions and estimates. Although we are convinced that these future-related statements are realistic, wecannot guarantee them, for our assumptions involve risks and uncertainties whichmay give rise to situations in which the actual results differ substantially from theexpected ones. The potential reasons for such differences include market fluctua-tions, the development of world market commodity prices, the development ofexchange rates or fundamental changes in the economic environment. TUI doesnot intend or assume any obligation to update any forward-looking statement toreflect events or circumstances after the date of these materials.

Economic Situation
■ General economic situation 2
■ Consolidated turnover and earnings 2
Turnover by divisions 2
Earnings by divisions 3
Adjusted earnings 4
Group profit 5
■ Events after the closing date 5
■ Development of the divisions
Tourism 6
Shipping 13
Central operations 15
Discontinuing operations 15
■ Group profit 16
■ Net assets and financial position 19
■ Other segment ratios 21
■ Prospects 22
■ Corporate Governance 23
Financial Statements
■ Financial statements
Consolidated profit and loss statement 24
Consolidated balance sheet 26
Statement of recognised income and expenses 27
Cash flow statement 27
■ Notes
Accounting principles 28
Group of consolidated companies 29
Discontinuing operations 31
Notes on the consolidated profit and loss statement 33
Notes on the consolidated balance sheet 34
Changes in equity 35
Contingent liabilities 36
Other financial liabilities 36
Notes on the cash flow statement 36
Statements of changes in equity 37
Segment ratios 37
■ Reservation concerning
future-related statements 39
Table of Contents
Financial calendar 2007
Annual Press Conference 2007 21 March 2007Annual General Meeting 2007 16 May 2007
Imprint
TUI AGKarl-Wiechert-Allee 430625 HanoverGermany
Phone +49.511.566-00Fax +49.511.566-1901E-Mail [email protected] www.tui-group.com
The German version of this report is legally binding. The Company cannot be heldresponsible for any misunderstandings or misinterpretation arising from this trans-lation. Both versions are available on the web: www.tui-group.com

TUI AGKarl-Wiechert-Allee 430625 HanoverGermany
TUI AG Financial Year 2006Interim Report 1 January – 30 September 2006