tumour karyotype spectral karyotyping showing chromosomal aberrations in cancer cell lines
Post on 18-Dec-2015
236 views
TRANSCRIPT
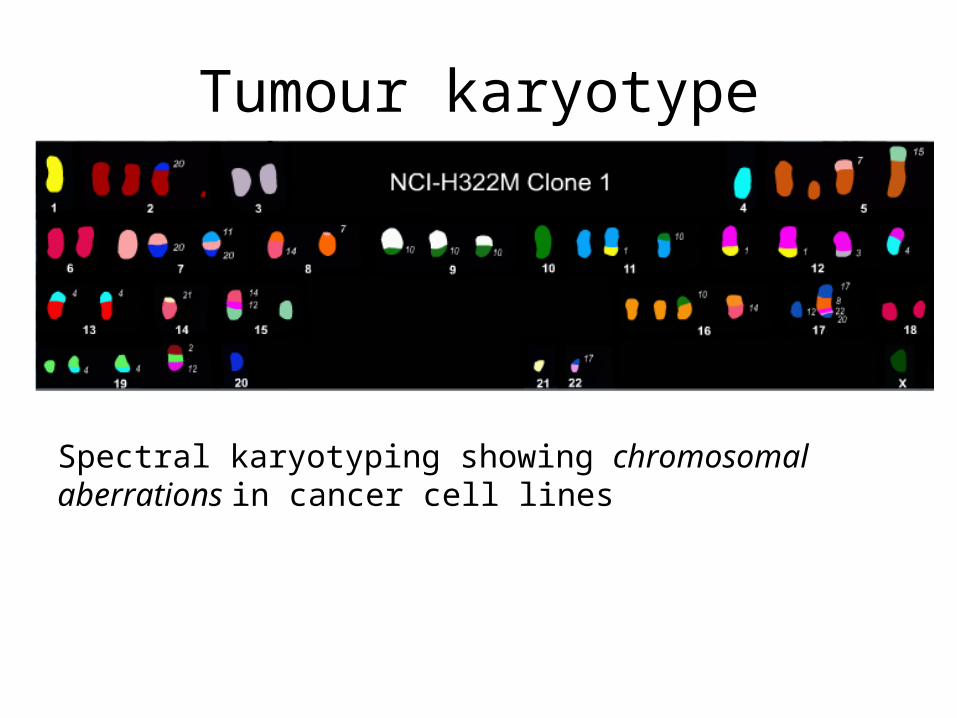
Tumour karyotype
Spectral karyotyping showing chromosomal aberrations in cancer cell lines
Chromosomal aberrations• Segments of DNA that get duplicated
– Gains
• Segments of DNA that get deleted– Losses
• Chromosomal aberrations are being investigated as diagnostic indicators of cancer and other diseases– Better diagnosis of disease– Potentially reveals biomolecular mechanisms of disease
• This research is done using:– array comparative genomic hybridization (aCGH)– Measures DNA copy number changes
Array CGH
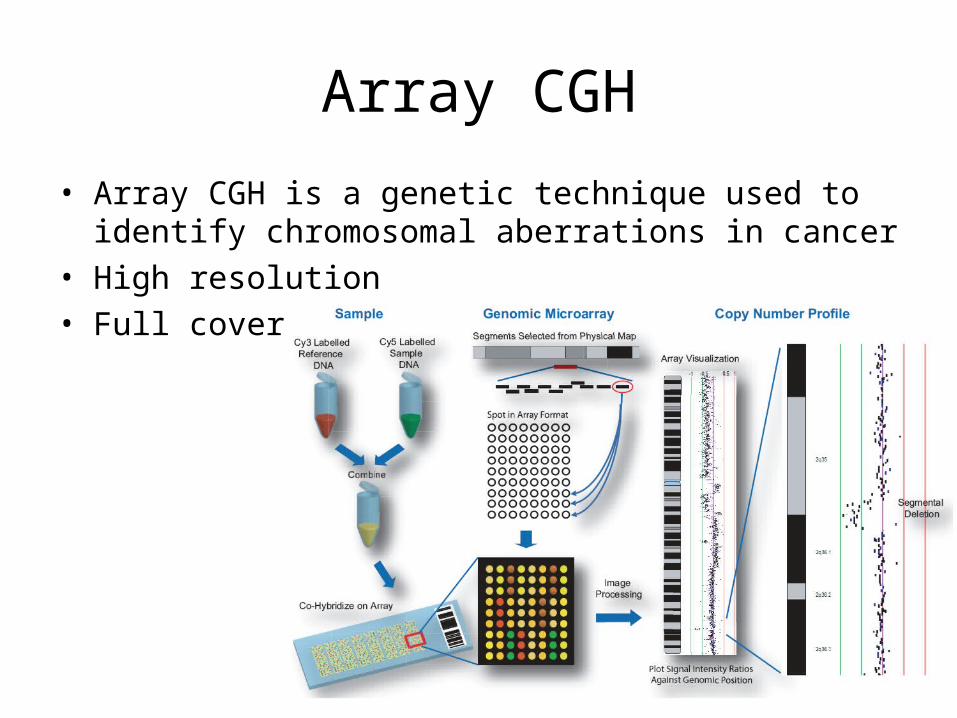
• Array CGH is a genetic technique used to identify chromosomal aberrations in cancer
• High resolution• Full coverage
Array CGH data
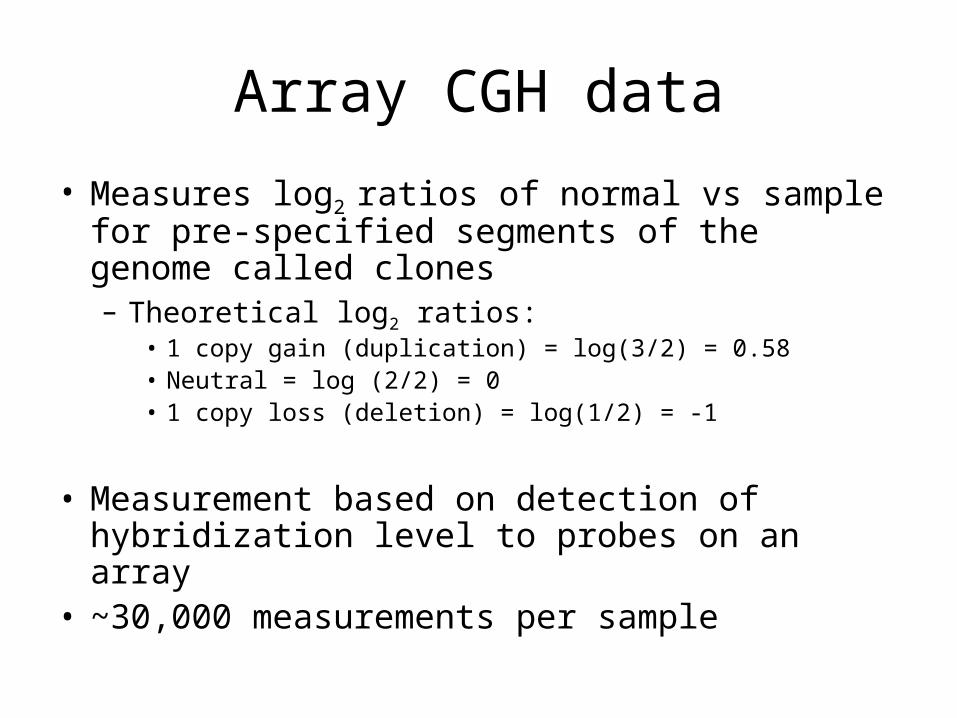
• Measures log2 ratios of normal vs sample for pre-specified segments of the genome called clones– Theoretical log2 ratios:
• 1 copy gain (duplication) = log(3/2) = 0.58• Neutral = log (2/2) = 0• 1 copy loss (deletion) = log(1/2) = -1
• Measurement based on detection of hybridization level to probes on an array
• ~30,000 measurements per sample
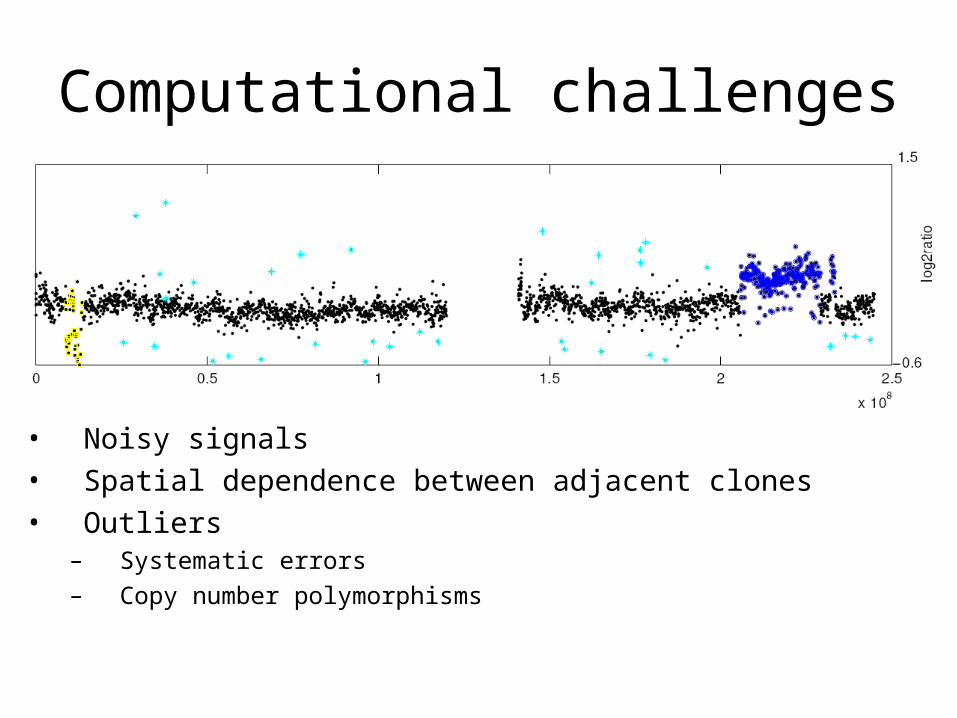
Computational challenges
• Noisy signals• Spatial dependence between adjacent clones• Outliers
– Systematic errors– Copy number polymorphisms
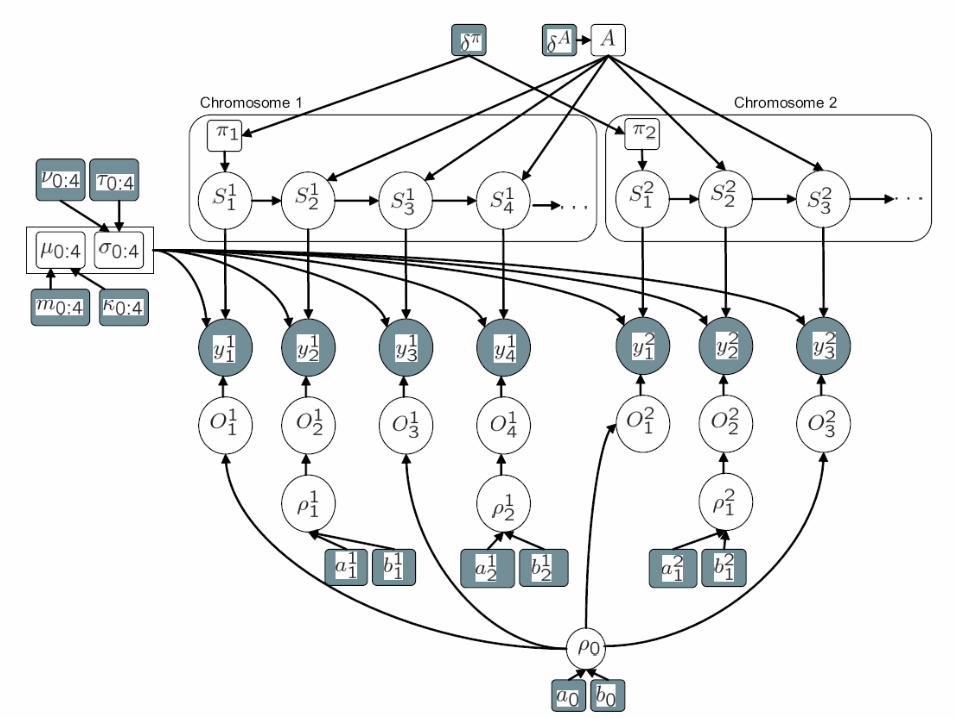
Our approach• Use a “supervised” hidden Markov model (HMM) to model spatial
dependency between clones– States are loss, neutral, gain-one, gain-many– Infer the unobserved state sequence from the data using a standard
efficient algorithm called for forwards-backwards– This part of the model is standard
Use a Gaussian mixture model to model the outliers separately from the inliers• Inliers have spatial dependence• Outliers do not
Use prior knowledge about locations of CNPs to ‘inform’ the model about possible locations of outliers• Several published lists of CNPs are available• Internally generated list more comprehensive
Pool data across chromosomes to gain “statistical strength”
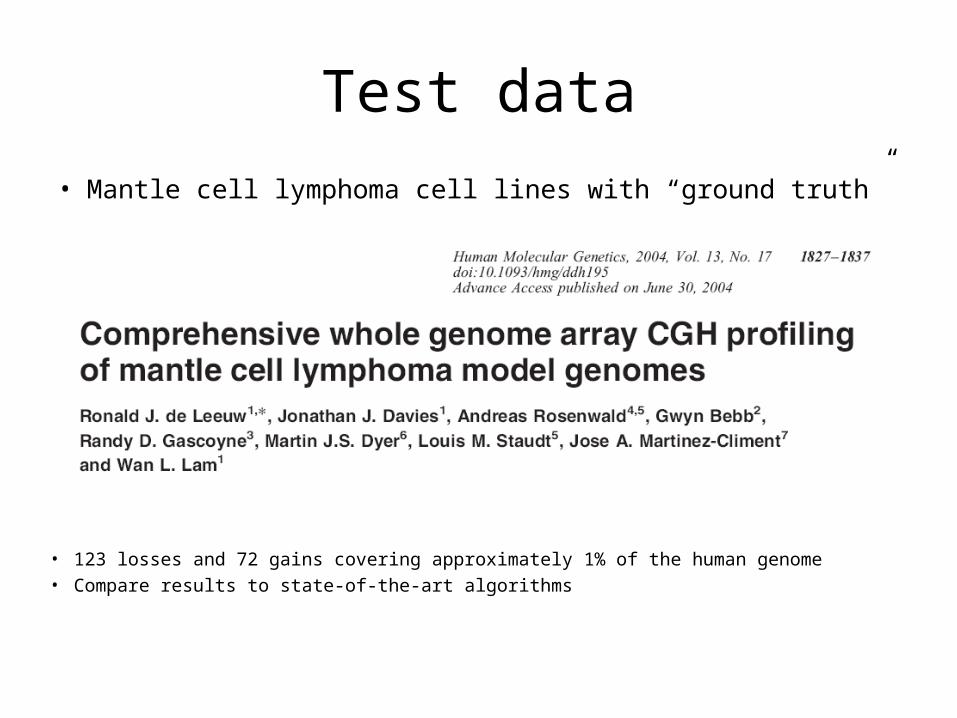
Test data
• Mantle cell lymphoma cell lines with “ground truth”
• 123 losses and 72 gains covering approximately 1% of the human genome• Compare results to state-of-the-art algorithms
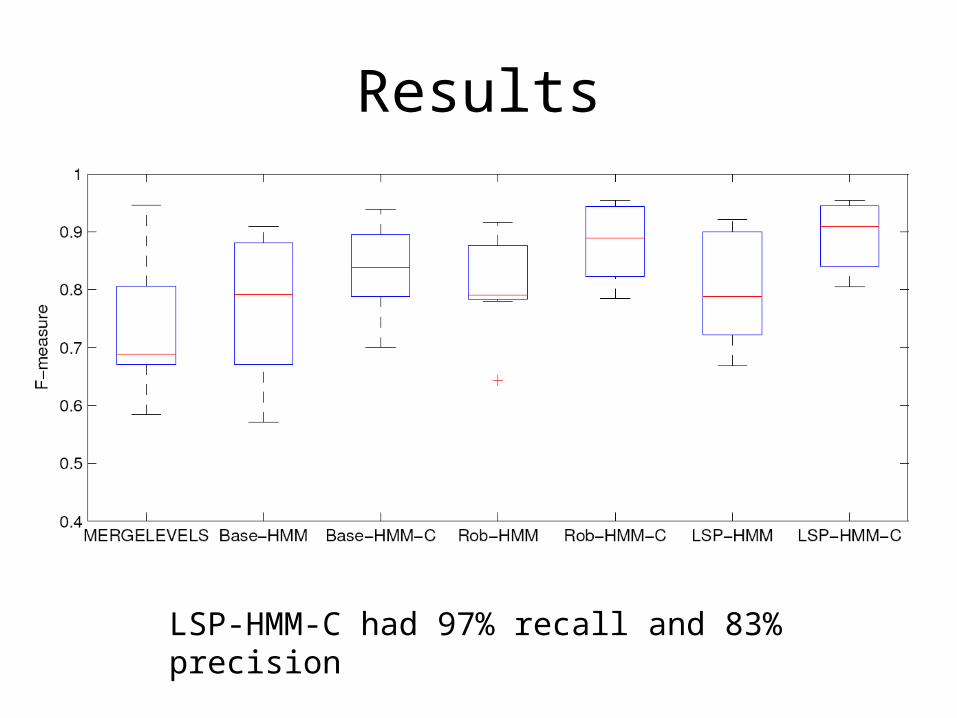
Results
LSP-HMM-C had 97% recall and 83% precision
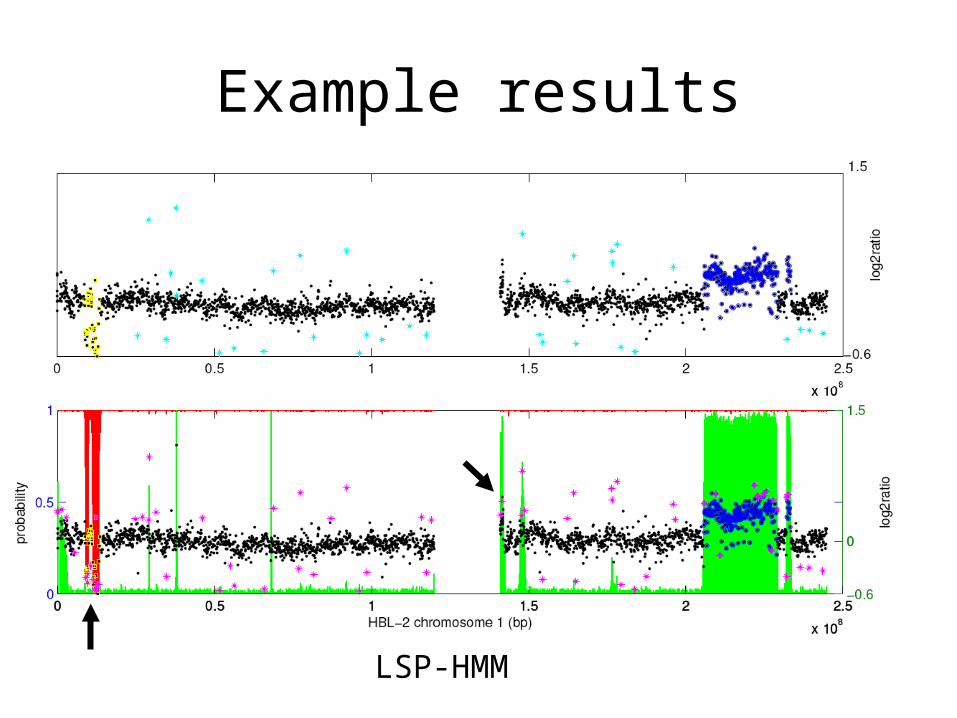
Example results
LSP-HMM
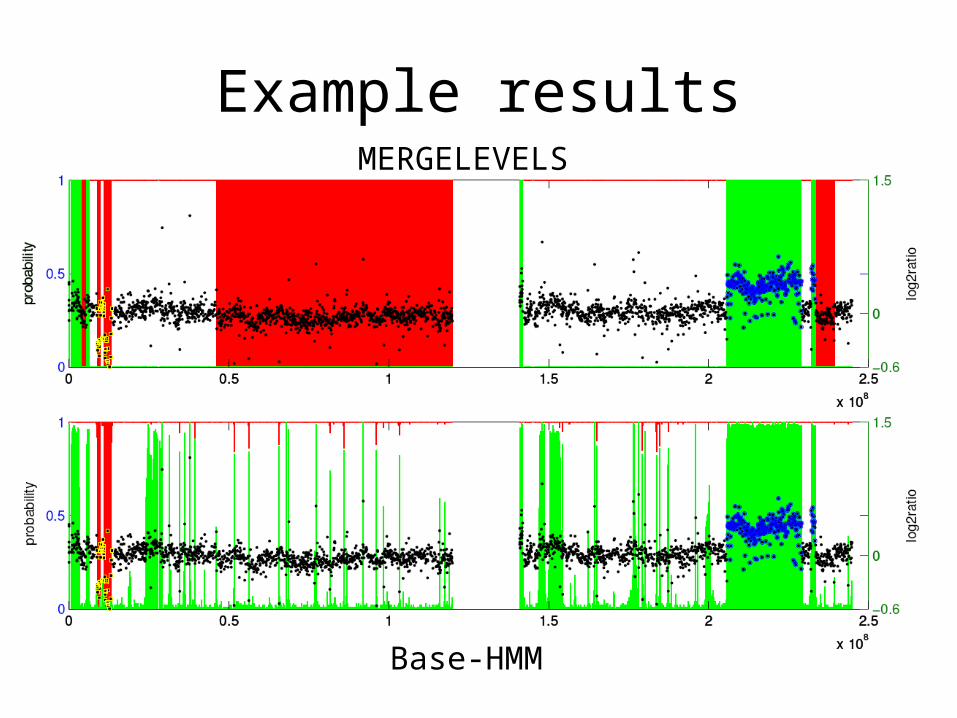
Example resultsMERGELEVELS
Base-HMM
Conclusions• HMM framework superior to MergeLevels
• Adding robustness further improves performance over the ‘Base-HMM’
• Adding LSP information improves performance marginally over robust HMM, but importantly does not make results worse– Motivation for using more comprehensive lists to improve results– Some false positives – are they real?
• Pooling across chromosomes results in big gains– Data more easily overwhelms incorrect priors– Makes the algorithm less sensitive to parameter settings