tuning elasticsearch indexing pipeline for logs
TRANSCRIPT

Tuning Elasticsearch Indexing Pipeline
for Logs
Radu GheorgheRafał Kuć

Who are we?Radu Rafał
Logsene

The next hour
Logs
Logs
Logs
Logs
Logs
Logs
Logs
Logs
Logs
Logs
Logs
Logs
Logs
Logs
Logs
Logs
Logs
Logs Logs
Logs

The tools
Logsene
2.0 SNAPSHOT8.9.01.5 RC2

Let the games begin

Logstash
Multiple inputs
Lots of filters
Several outputs
Lots of plugins

How Logstash works
input(thread per input)
filetcp
redis...
filter(multiple workers)
grokgeoip
...
elasticsearchsolr...
output(multiple workers)

Scaling Logstash

Logstash basic
input { syslog { port => 13514 }}
output { elasticsearch { protocol => "http” manage_template => false index => "test-index” index_type => "test-type" }}

Logstash basic
4K events per second
~130% CPU utilization
299MB RAM used

Logstash basic

Logstash with mutate
output { elasticsearch { protocol => "http” manage_template => false index => "test-index” index_type => "test-type” flush_size => 1000 workers => 5 }}
filter { mutate { remove_field => [ "severity", "facility", "priority", "@version", "timestamp", "host" ] }}
3 filter threads!
-w 3

Logstash with mutate
5K events per second
~250% CPU utilization
289MB RAM used

Logstash with mutate

Logstash with grok and tcpfilter { grok { match => [ "message", "<%{NUMBER:priority}>%{SYSLOGTIMESTAMP:date} %{DATA:hostname} %{DATA:tag} %{DATA:what}:%{DATA:number}:" ] } mutate { remove_field => [ "message", "@version", "@timestamp", "host" ] }}
input { tcp { port => 13514 }}

Logstash with grok and tcp
8K events per second
~310% CPU utilization
327MB RAM used

Logstash with grok and tcp

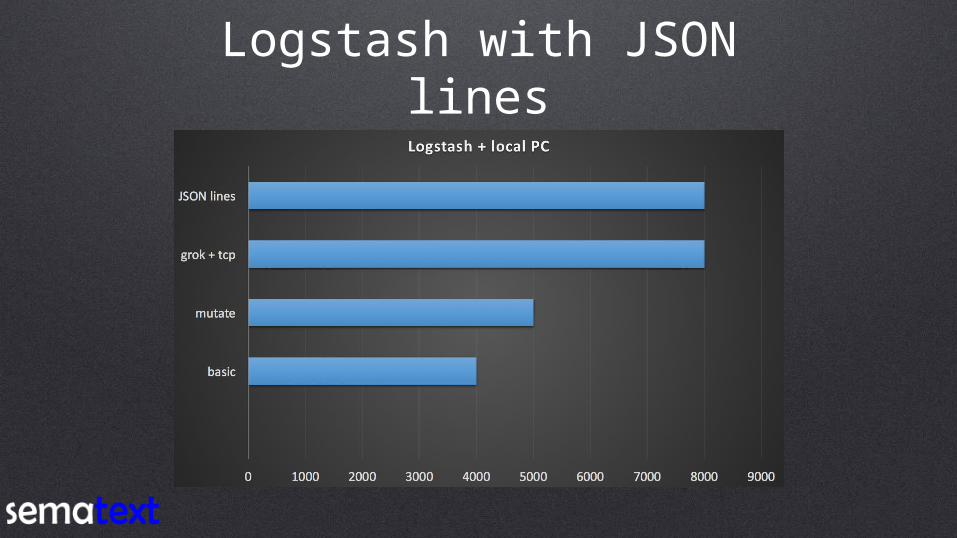
Logstash with JSON lines
input { tcp { port => 13514 codec => "json_lines" }}

Logstash with JSON lines
8K events per second
~260% CPU utilization
322MB RAM used
Logstash with JSON lines

Rsyslog
Very fast
Very light

How rsyslog works
im*
imfileimtcp
imjournal...
mm* om*
mmnormalizemmjsonparse
...
omelasticsearchomredis
...

Using rsyslog

Rsyslog basicmodule(load="impstats" interval="10" resetCounters="on" log.file="/tmp/stats")module(load="imtcp") module(load="omelasticsearch")
input(type="imtcp" port="13514")
action(type="omelasticsearch" template="plain-syslog" searchIndex="test-index" searchType="test-type" bulkmode="on" action.resumeretrycount="-1" )
template(name="plain-syslog" type="list") { constant(value="{") constant(value="\"@timestamp\":\"") property(name="timereported" dateFormat="rfc3339") constant(value="\",\"host\":\"") property(name="hostname") constant(value="\",\"severity\":\"") property(name="syslogseverity-text") constant(value="\",\"facility\":\"") property(name="syslogfacility-text") constant(value="\",\"syslogtag\":\"") property(name="syslogtag" format="json") constant(value="\",\"message\":\"") property(name="msg" format="json") constant(value="\"}") }
*http://blog.sematext.com/2015/04/13/monitoring-rsyslogs-performance-with-imstats-and-elasticsearch

Rsyslog basic
6K events per second
~20% CPU utilization
50MB RAM used

Rsyslog basic

Rsyslog queue and workers
main_queue( queue.size="100000" # capacity of the main queue queue.dequeuebatchsize="5000" # process messages in batches of 5K queue.workerthreads="4" # 4 threads for the main queue)
action(name="send-to-es" type="omelasticsearch" template="plain-syslog" # use the template defined earlier searchIndex="test-index" searchType="test-type" bulkmode="on" # use bulk API action.resumeretrycount="-1" # retry indefinitely if ES is unreachable)

Rsyslog queue and workers
25K events per second
~100% CPU utilization (1 core)
75MB RAM used (queue dependent)

Rsyslog queue and workers

Rsyslog + mmnormalizemodule(load="mmnormalize")
action(type="mmnormalize" ruleBase="/opt/rsyslog_rulebase.rb" useRawMsg="on")
template(name="lumberjack" type="list") { property(name="$!all-json")}
$ cat /opt/rsyslog_rulebase.rbrule=:<%priority:number%>%date:date-rfc3164% %host:word% %syslogtag:word% %what:char-to:\x3a%:%number:char-to:\x3a%:

Rsyslog + mmnormalize
16K events per second
~200% CPU utilization
100MB RAM used (queue dependent)

Rsyslog + mmnormalize

Rsyslog with JSON parsing
module(load="mmjsonparse")action(type="mmjsonparse")

Rsyslog with JSON parsing
20K events per second
~130% CPU utilization
70MB RAM used (queue dependent)

Rsyslog with JSON parsing

Disk-assisted queues
main_queue( queue.filename="main_queue" # write to disk if needed queue.maxdiskspace="5g" # when to stop writing to disk
queue.highwatermark="200000" # start spilling to disk at this size queue.lowwatermark="100000" # stop spilling when it gets back to this size
queue.saveonshutdown="on" # write queue contents to disk on shutdown
queue.dequeueBatchSize="5000" queue.workerthreads="4" queue.size="10000000" # absolute max queue size)

Elasticsearch

How Elasticsearch works
JSON bulk, single doc
transaction log
inverted index
analysis
primary
transaction log
inverted index
analysis
replica
Elasticsearch
replicate

ES horizontal scaling
Node
shard

ES horizontal scaling
Node
shard
Node
shard

ES horizontal scaling
Node
shard
Node
shard
Node
shard

ES horizontal scaling
Node
shard shard
shard shard
Node
shard shard
shard shard
Node
shard shard
shard shard

ES horizontal scaling
Node
shard shard
shard shard
replica
replica
replica
replica
Node
shard shard
shard shard
replica
replica
replica
replica
Node
shard shard
shard shard
replica
replica
replica
replica

Elasticsearch for tools tests
Nothing is indexed No JVM
tuning
Nothing is stored
_source disabled
_all disabled
-1 refresh
30m sync
translogsize: 2g
interval: 30m

Tuning Elasticsearch
refresh_interval: 5s*
doc_values: true
store.throttle.max_bytes_per_sec: 200mb
*http://blog.sematext.com/2013/07/08/elasticsearch-refresh-interval-vs-indexing-performance/

Tests: hardware and data
2 x EC2 c3.large instances(2vCPU, 3.5GB RAM,2x16GB SSD in RAID0)
vs
Logs
Logs
Logs
Logs
Logs
Logs
Logs
Logs
Logs
Logs
Logs
Logs
Logs
Logs
Logs
Logs
Logs
Logs Logs
Logs
Apache logs

Test requestsFilters Aggregations
filter by client IP date histogram
filter by word in user agent top 10 response codes
wildcard filter on domain # of unique IPs
top IPs per response per time

Test runs
1. Write throughput
2. Capacity of a single index
3. Capacity with time-based indices on
hot/cold setup

Write throughput (one index)

Capacity of one index (3200 EPS)
20 seconds @ 40 - 50M

Capacity of one index (400 EPS)
15 seconds @ 40 - 50M

Time-based indices: ideal shard size
smaller indiceslighter indexingeasier to isolate hot data from cold dataeasier to relocate
bigger indicesless RAMless management overheadsmaller cluster state
without indexing, equal latency when dividing 32M data into 1/2/4/8/16/32M indices

Time-based. 2 hot and 2 cold nodes
Before: 3200 After: 4800

Time-based. 2 hot and 2 cold nodes
Before:15s
After:5s

That's all folks!

What to remember?
log in JSON
parallelizewhen
possible
use time based indices
use hot / cold nodes policy

We are hiring
Dig Search?Dig Analytics?Dig Big Data?Dig Performance?Dig Logging?Dig working with and in open – source?We’re hiring world – wide!
http://sematext.com/about/jobs.html

Thank you!Radu Gheorghe @radu0gheorghe [email protected]
Rafał Kuć @kucrafal [email protected]
Sematext @sematext http://sematext.com