turban online ch06
TRANSCRIPT
W6-1
Neural Networks for Data Mining
Learning Objectives◆ Understand the concept and different types of artificial neural networks (ANN)
◆ Learn the advantages and limitations of ANN
◆ Understand how backpropagation neural networks learn
◆ Understand the complete process of using neural networks
◆ Appreciate the wide variety of applications of neural networks
Neural networks have emerged as advanced data mining tools in cases where othertechniques may not produce satisfactory predictive models. As the term implies,
neural networks have a biologically inspired modeling capability, but are essentiallystatistical modeling tools. In this chapter, we study the basics of neural network model-ing, some specific applications, and the process of implementing a neural networkproject.
6.1 Opening Vignette: Using Neural Networks to Predict Beer Flavors with Chemical Analysis
6.2 Basic Concepts of Neural Networks
6.3 Learning in Artificial Neural Networks (ANN)
6.4 Developing Neural Network–Based Systems
6.5 A Sample Neural Network Project
6.6 Other Neural Network Paradigms
6.7 Applications of Artificial Neural Networks
6.8 A Neural Network Software Demonstration
ONLINECHAPTER
6
6.1 OPENING VIGNETTE: USING NEURAL NETWORKS TO PREDICT BEER FLAVORS WITH CHEMICAL ANALYSIS
Coors Brewers Ltd., based in Burton-upon-Trent, Britain’s brewing capital, is proud ofhaving the United Kingdom’s top beer brands, a 20 percent share of the market, yearsof experience, and of the best people in the business. Popular brands include Carling(the country’s best-selling lager), Grolsch, Coors Fine Light Beer, Sol, and Korenwolf.
TURBMW06_013234761X.QXD 3/7/07 8:07 PM Page 1
◆ W6-2 Business Intelligence: A Managerial Approach
PROBLEM
Today’s customer is confronted with variety of options regarding what he or she drinks.A drinker’s choice depends on various factors, such as mood, venue, and occasion. Thegoal of Coors is to ensure that the customer chooses a Coors brand every time.
According to Coors, creativity is the key to being successful in the long term.To be thecustomer’s choice brand, Coors needs to be creative and anticipative about the customer’sever-changing moods.An important issue with beers is the flavor; each beer has a distinc-tive flavor. These flavors are mostly determined through panel tests. However, such teststake time. If Coors could understand the beer flavor based solely on its chemical compo-sition, it would open up new avenues to create beer that would suit customer expectations.
The relationship between chemical analysis and beer flavor is not clearly understoodyet. Substantial data exists about its chemical composition and sensory analysis. Coorsneeded a mechanism to link those two together. Neural networks were applied to createthe link between chemical composition and sensory analysis.
SOLUTION
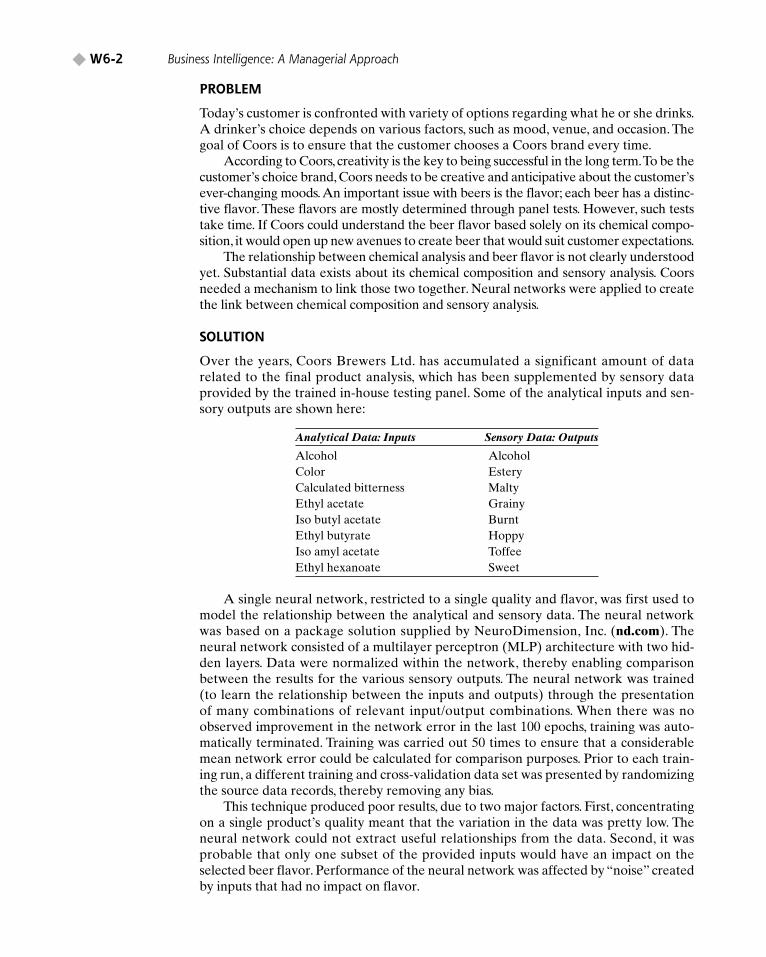
Over the years, Coors Brewers Ltd. has accumulated a significant amount of datarelated to the final product analysis, which has been supplemented by sensory dataprovided by the trained in-house testing panel. Some of the analytical inputs and sen-sory outputs are shown here:
Analytical Data: Inputs Sensory Data: Outputs
Alcohol AlcoholColor EsteryCalculated bitterness MaltyEthyl acetate GrainyIso butyl acetate BurntEthyl butyrate HoppyIso amyl acetate ToffeeEthyl hexanoate Sweet
A single neural network, restricted to a single quality and flavor, was first used tomodel the relationship between the analytical and sensory data. The neural networkwas based on a package solution supplied by NeuroDimension, Inc. (nd.com). Theneural network consisted of a multilayer perceptron (MLP) architecture with two hid-den layers. Data were normalized within the network, thereby enabling comparisonbetween the results for the various sensory outputs. The neural network was trained(to learn the relationship between the inputs and outputs) through the presentationof many combinations of relevant input/output combinations. When there was noobserved improvement in the network error in the last 100 epochs, training was auto-matically terminated. Training was carried out 50 times to ensure that a considerablemean network error could be calculated for comparison purposes. Prior to each train-ing run, a different training and cross-validation data set was presented by randomizingthe source data records, thereby removing any bias.
This technique produced poor results, due to two major factors. First, concentratingon a single product’s quality meant that the variation in the data was pretty low. Theneural network could not extract useful relationships from the data. Second, it wasprobable that only one subset of the provided inputs would have an impact on theselected beer flavor. Performance of the neural network was affected by “noise” createdby inputs that had no impact on flavor.
TURBMW06_013234761X.QXD 3/7/07 8:07 PM Page 2
CHAPTER 6 Neural Networks for Data Mining W6-3 ◆
A more diverse product range was included in the training range to address the firstfactor. It was more challenging to identify the most important analytical inputs. Thischallenge was addressed by using a software switch that enabled the neural network tobe trained on all possible combinations of inputs. The switch was not used to disable asignificant input; if the significant input were disabled, we could expect the networkerror to increase. If the disabled input was insignificant, then the network error wouldeither remain unchanged or be reduced due to the removal of noise. This approach iscalled an exhaustive search because all possible combinations are evaluated. The tech-nique, although conceptually simple, was computationally impractical with the numer-ous inputs; the number of possible combinations was 16.7 million per flavor.
A more efficient method of searching for the relevant inputs was required.A genetic algorithm was the solution to the problem. A genetic algorithm was able tomanipulate the different input switches in response to the error term from the neuralnetwork. The objective of the genetic algorithm was to minimize the network errorterm. When this minimum was reached, the switch settings would identify the analyti-cal inputs that were most likely to predict the flavor.
RESULTS
After determining what inputs were relevant, it was possible to identify which flavorscould be predicted more skillfully. The network was trained using the relevant inputspreviously identified multiple times. Before each training run, the network data wererandomized to ensure that a different training and cross-validation data set was used.Network error was recorded after each training run. The testing set used for assessingthe performance of the trained network contained approximately 80 records out ofthe sample data. The neural network accurately predicted a few flavors by using thechemical inputs. For example, “burnt” flavor was predicted with a correlation coeffi-cient of 0.87.
Today, a limited number of flavors are being predicted by using the analytical data.Sensory response is extremely complex, with many potential interactions and hugelyvariable sensitivity thresholds. Standard instrumental analysis tends to be of grossparameters, and for practical and economical reasons, many flavor-active compoundsare simply not measured. The relationship of flavor and analysis can be effectivelymodeled only if a large number of flavor-contributory analytes are considered. What ismore, in addition to the obvious flavor-active materials, mouth-feel and physical con-tributors should also be considered in the overall sensory profile.
With further development of the input parameters, the accuracy of the neural net-work models will improve.
Sources: C.I. Wilson and L. Threapleton, “Application of Artificial Intelligence for Predicting BeerFlavours from Chemical Analysis,” Proceedings of the 29th European Brewery Congress, Dublin,May 17–22, 2003, neurosolutions.com/resources/apps/beer.html (accessed April 2006); R. Nischwitz,M. Goldsmith, M. Lees, P. Rogers, and L. MacLeod, “Developing Functional Malt Specificationsfor Improved Brewing Performance,” The Regional Institute Ltd., regional.org.au/au/abts/1999/ nischwitz.htm (accessed April 2006); and coorsbrewers.com (accessed April 2006).
Questions for the Opening Vignette
1. Why is beer flavor important to the profitability of Coors?
2. What is the objective of the neural network used at Coors?
3. Why were the results of the Coors neural network initially poor, and what wasdone to improve the results?
TURBMW06_013234761X.QXD 3/7/07 8:07 PM Page 3
◆ W6-4 Business Intelligence: A Managerial Approach
4. What benefits might Coors derive if this project is successful?
5. What modifications would you provide to improve the results of beer flavorprediction?
WHAT WE CAN LEARN FROM THIS VIGNETTE
As you will see in this chapter, applications of neural networks abound in many areas,from standard business problems of assessing creditworthiness of individuals to manu-facturing, security, and health applications.This vignette illustrates an innovative appli-cation in a setting where human expertise may be considered the only way to assessquality. The vignette shows that the imagination of an analyst is the only limitation toexploring applications of data mining techniques in general and neural networks inparticular. We also learn that in many real-life applications, we have to combine morethan one advanced technique in order to create a useful application. In this particularsituation, neural networks were combined with genetic algorithms, but other combina-tions are possible as well.
6.2 BASIC CONCEPTS OF NEURAL NETWORKS
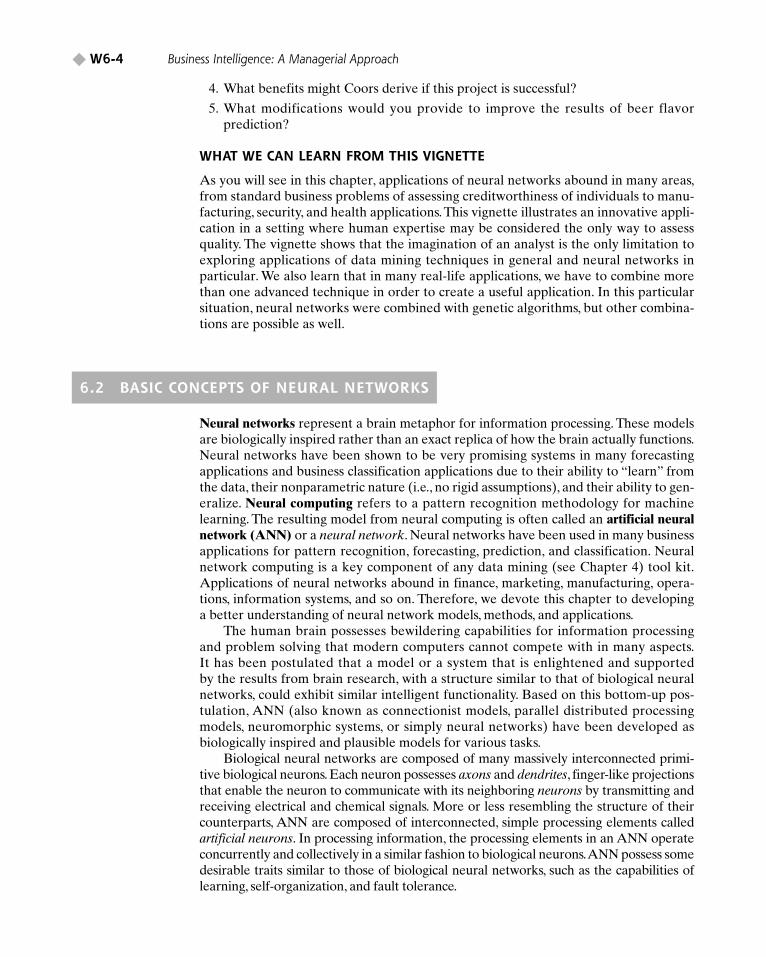
Neural networks represent a brain metaphor for information processing. These modelsare biologically inspired rather than an exact replica of how the brain actually functions.Neural networks have been shown to be very promising systems in many forecastingapplications and business classification applications due to their ability to “learn” fromthe data, their nonparametric nature (i.e., no rigid assumptions), and their ability to gen-eralize. Neural computing refers to a pattern recognition methodology for machinelearning. The resulting model from neural computing is often called an artificial neuralnetwork (ANN) or a neural network. Neural networks have been used in many businessapplications for pattern recognition, forecasting, prediction, and classification. Neuralnetwork computing is a key component of any data mining (see Chapter 4) tool kit.Applications of neural networks abound in finance, marketing, manufacturing, opera-tions, information systems, and so on. Therefore, we devote this chapter to developinga better understanding of neural network models, methods, and applications.
The human brain possesses bewildering capabilities for information processingand problem solving that modern computers cannot compete with in many aspects.It has been postulated that a model or a system that is enlightened and supportedby the results from brain research, with a structure similar to that of biological neuralnetworks, could exhibit similar intelligent functionality. Based on this bottom-up pos-tulation, ANN (also known as connectionist models, parallel distributed processingmodels, neuromorphic systems, or simply neural networks) have been developed asbiologically inspired and plausible models for various tasks.
Biological neural networks are composed of many massively interconnected primi-tive biological neurons. Each neuron possesses axons and dendrites, finger-like projectionsthat enable the neuron to communicate with its neighboring neurons by transmitting andreceiving electrical and chemical signals. More or less resembling the structure of theircounterparts, ANN are composed of interconnected, simple processing elements calledartificial neurons. In processing information, the processing elements in an ANN operateconcurrently and collectively in a similar fashion to biological neurons.ANN possess somedesirable traits similar to those of biological neural networks, such as the capabilities oflearning, self-organization, and fault tolerance.
TURBMW06_013234761X.QXD 3/7/07 8:07 PM Page 4

CHAPTER 6 Neural Networks for Data Mining W6-5 ◆
Coming along a winding journey, ANN have been investigated by researchers formore than half a century. The formal study of ANN began with the pioneering work ofMcCulloch and Pitts in 1943. Stimulated by results of biological experiments andobservations, McCulloch and Pitts (1943) introduced a simple model of a binary artifi-cial neuron that captures some functions of a living neuron. Considering informationprocessing machines as a means for modeling the brain, McCulloch and Pitts built theirneural networks model using a large number of interconnected binary artificial neu-rons. Led by a school of researchers, neural network research was quite popular in thelate 1950s and early 1960s. After a thorough analysis of an early neural network model(called the perceptron, which used no hidden layer) as well as a pessimistic evaluationof the research potential by Minsky and Papert in 1969, the interest in neural networksdiminished.
During the past two decades, there has been an exciting resurgence in the studiesof ANN due to the introduction of new network topologies, new activation functions,and new learning algorithms, as well as progress in neuroscience and cognitive science.On the one hand, advances in theory and methodology have overcome many obstaclesthat hindered neural network research a few decades ago. Evidenced by the appealingresults of numerous studies, neural networks are gaining acceptance and popularity.On the other hand, as complex problems solvers, ANN have been applied to solvenumerous problems in a variety of application settings.The desirable features in neuralinformation processing make neural networks attractive for solving complex problems.The initial success in neural network applications has inspired renewed interest fromindustry and business.
BIOLOGICAL AND ARTIFICIAL NEURAL NETWORKS
The human brain is composed of special cells called neurons. These cells do not diewhen a human is injured (all other cells reproduce to replace themselves and then die).This phenomenon may explain why we retain information. Information storage spanssets of neurons.The estimated number of neurons in a human brain is 50 to 150 billion,of which there are more than 100 different kinds. Neurons are partitioned into groupscalled networks. Each network contains several thousand highly interconnected neu-rons. Thus, the brain can be viewed as a collection of neural networks.
The ability to learn and react to changes in our environment requires intelligence.The brain and the central nervous system control thinking and intelligent behavior.People who suffer brain damage have difficulty learning and reacting to changing envi-ronments. Even so, undamaged parts of the brain can often compensate with newlearning.
A portion of a network composed of two cells is shown in Figure 6.1. The cell itselfincludes a nucleus (the central processing portion of the neuron). To the left of cell 1,the dendrites provide input signals to the cell. To the right, the axon sends output sig-nals to cell 2 via the axon terminals. These axon terminals merge with the dendrites ofcell 2. Signals can be transmitted unchanged, or they can be altered by synapses.A synapse is able to increase or decrease the strength of the connection from neuronto neuron and cause excitation or inhibition of a subsequent neuron. This is whereinformation is stored.
An ANN model emulates a biological neural network. Neural computing actuallyuses a very limited set of concepts from biological neural systems (see Technology Insights6.1). It is more of an analogy to the human brain than an accurate model of it. Neuralconcepts are usually implemented as software simulations of the massively parallelprocesses that involve processing elements (also called artificial neurons, or neurodes)
TURBMW06_013234761X.QXD 3/7/07 8:07 PM Page 5

◆ W6-6 Business Intelligence: A Managerial Approach
Neuron j� wij xi
wij
w2 j
w1 j x1
x2
xi
InputsWeights
Summations Transfer function
Yj
Output
Dendrites
Nucleus
Soma
Cell (neuron) 1
Axon
Synapse
Cell (neuron) 2
interconnected in a network architecture. The artificial neuron receives inputs analogousto the electrochemical impulses the dendrites of biological neurons receive from otherneurons.The output of the artificial neuron corresponds to signals sent out from a biolog-ical neuron over its axon. These artificial signals can be changed by weights in a mannersimilar to the physical changes that occur in the synapses (see Figure 6.2).
Several ANN paradigms have been proposed for applications in a variety of prob-lem domains. For example, see Application Case 6.2. Perhaps the easiest way to dif-ferentiate between the various models is on the basis of how these models structurallyemulate the human brain, the way in which the neural model processes informationand how the neural models learn to perform their designated tasks.
As they are biologically inspired, the main processing elements of a neural net-work are individual neurons, analogous to the brain’s neurons. These artificial neurons
FIGURE 6.1 Portion of a Network: Two Interconnected Biological Cells
FIGURE 6.2 Processing Information in an Artificial Neuron
TURBMW06_013234761X.QXD 3/7/07 8:07 PM Page 6
CHAPTER 6 Neural Networks for Data Mining W6-7 ◆
receive the sum “information” from other neurons or external input stimuli, perform atransformation on the inputs, and then pass on the transformed information to otherneurons or external outputs. This is similar to how it is presently thought that thehuman brain works. Passing information from neuron to neuron can be thought of as away to activate, or trigger a response from certain neurons based on the information orstimulus received.
Thus, how information is processed by a neural network is inherently a function ofits structure. Neural networks can have one or more layers of neurons. These neuronscan be highly or fully interconnected, or only certain layers can be connected together.Connections between neurons have an associated weight. In essence, the “knowledge”possessed by the network is encapsulated in these interconnection weights. Each neu-ron calculates a weighted sum of the incoming neuron values, transforms this input, andpasses on its neural value as the input to subsequent neurons. Typically, although notalways, this input/output transformation process at the individual neuron level is donein a nonlinear fashion.
Application Case 6.2
Neural Networks Help Reduce Telecommunications FraudThe Forum of International Irregular Network Access(FIINA) estimates that telecommunications fraud resultsin a loss of US$55 billion per year worldwide. SouthAfrica’s largest telecom operator was losing over US$37million per year to fraud. Subscription fraud—in which acustomer either provides fraudulent details or gives valid
details and then disappears—was the company’s biggestcause of revenue leakage. By the time the telecomprovider is alerted about the fraud, the fraudster hasalready moved to other target victims. Other types of fraudinclude phone card manipulation, which involves tamper-ing and cloning of phone cards. In clip-on fraud, a fraudster
TECHNOLOGY INSIGHTS 6.1
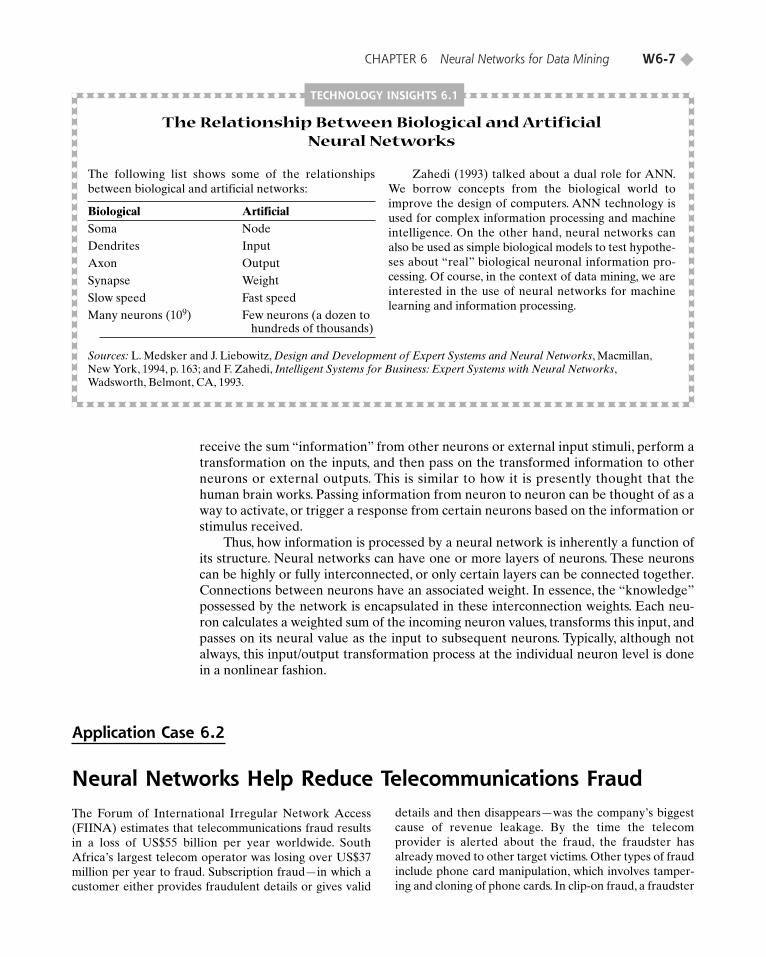
The Relationship Between Biological and Artificial Neural Networks
The following list shows some of the relationshipsbetween biological and artificial networks:
Biological ArtificialSoma NodeDendrites InputAxon OutputSynapse WeightSlow speed Fast speedMany neurons (109) Few neurons (a dozen to
hundreds of thousands)
Zahedi (1993) talked about a dual role for ANN.We borrow concepts from the biological world toimprove the design of computers. ANN technology isused for complex information processing and machineintelligence. On the other hand, neural networks canalso be used as simple biological models to test hypothe-ses about “real” biological neuronal information pro-cessing. Of course, in the context of data mining, we areinterested in the use of neural networks for machinelearning and information processing.
Sources: L. Medsker and J. Liebowitz, Design and Development of Expert Systems and Neural Networks, Macmillan,New York, 1994, p. 163; and F. Zahedi, Intelligent Systems for Business: Expert Systems with Neural Networks,Wadsworth, Belmont, CA, 1993.
TURBMW06_013234761X.QXD 3/7/07 8:07 PM Page 7
◆ W6-8 Business Intelligence: A Managerial Approach
clips on to customers’ telephone lines and then sells calls tooverseas destinations for a fraction of normal rates.
Minotaur, developed by Neural Technologies (neuralt.com), was implemented to prevent fraud. Minotaur uses ahybrid mixture of intelligent systems and traditional com-puting techniques to provide customer subscription andreal-time call monitoring fraud detection. It processes datafrom numerous fields, such as event data records (e.g.,switch/CDR, SS#7, IPDRs, PIN/authentication) and cus-tomer data (e.g., billing and payment, point of sale, provi-sioning), using a multistream analysis capacity. Frauds aredetected on several levels, such as on an individual basisusing specific knowledge about the subscriber’s usage, andon a global basis, using generic knowledge about subscriberusage and known fraud patterns. The neural capability ofMinotaur means it learns from experience, making useof adaptive feedback to keep up-to-date with changingfraud patterns. A combination of call/network data andsubscriber information is profiled and then processed, usingintelligent neural, rule-based, and case-based techniques.Probable frauds are identified, collected into cases, andtracked to completion by means of a powerful and flexibleworkflow-based operational process.
In the first three months of installation of this neuralnetwork–based software:
ELEMENTS OF ANN
A neural network is composed of processing elements organized in different ways to formthe network’s structure.The basic processing unit is the neuron.A number of neurons areorganized into a network. There are many ways to organize neurons; they are referred toas topologies. One popular approach, known as the feedforward-backpropagation paradigm (or simply backpropagation), allows all neurons to link the output in one layerto the input of the next layer, but it does not allow any feedback linkage (Haykin, 1999).This is the most commonly used paradigm.
Processing ElementsThe processing elements (PE) of an ANN are artificial neurons. Each of the neuronsreceives inputs, processes them, and delivers a single output, as shown in Figure 6.2.Theinput can be raw input data or the output of other processing elements. The output canbe the final result (e.g., 1 means yes, 0 means no), or it can be inputs to other neurons.
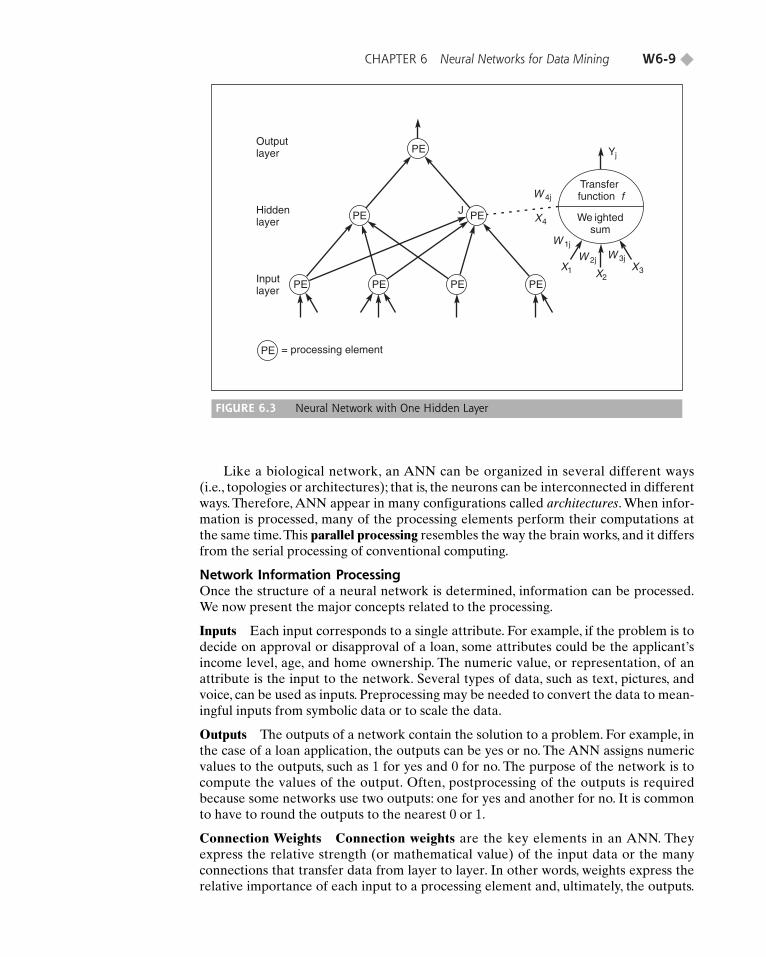
Network StructureEach ANN is composed of a collection of neurons, grouped in layers. A typical struc-ture is shown in Figure 6.3. Note the three layers: input, intermediate (called the hiddenlayer), and output. A hidden layer is a layer of neurons that takes input from the previ-ous layer and converts those inputs into outputs for further processing. Several hiddenlayers can be placed between the input and output layers, although it is quite commonto use only one hidden layer. In that case, the hidden layer simply converts inputs intoa nonlinear combination and passes the transformed inputs to the output layer. Themost common interpretation of the hidden layer is as a feature extraction mechanism.That is, the hidden layer converts the original inputs in the problem into some higher-level combinations of such inputs.
• The average fraud loss per case was reduced by 40 percent.
• The detection time was reduced by 83 percent.• The average time taken to analyze suspected fraud
cases was reduced by 75 percent.• The average detection hit rate was improved by
74 percent.
The combination of neural, rule-based, and case-basedtechnologies provides a fraud detection rate superior tothat of conventional systems. Furthermore, the multistreamanalysis capability makes it extremely accurate.
Sources: Combating Fraud: How a Leading TelecomCompany Solved a Growing Problem, neuralt.com/iqs/dlsfa.list/ dlcpti.7/downloads.html; A. Shukla, NeuralTechnologies and Sevis Partner to Eliminate FraudulentCalls in Fixed and Mobile Networks, February 3, 2006,news.tmcnet.com/news/-neural-sevis-fraud-mobile/2006/02/03/1340423.htm (accessed April 2006); P.A.Estévez, M.H. Claudio, and C.A. Perez, Prevention inTelecommunications Using Fuzzy Rules and NeuralNetworks, cec.uchile.cl/~pestevez/RI0.pdf (accessed April2006); and Members and Associate Members Success Stories,gsm.org/about/membership/success/nt.shtml (accessedApril 2006).
TURBMW06_013234761X.QXD 3/7/07 8:07 PM Page 8
CHAPTER 6 Neural Networks for Data Mining W6-9 ◆
= processing element
Inputlayer
Hiddenlayer
Outputlayer
PE
PE PE
PE
PE
PE PEJ
PE
Transferfunction f
We ightedsum
Yj
X1
W 1j
W 2j W 3j
W 4j
X2X3
X4
Like a biological network, an ANN can be organized in several different ways(i.e., topologies or architectures); that is, the neurons can be interconnected in differentways. Therefore, ANN appear in many configurations called architectures. When infor-mation is processed, many of the processing elements perform their computations atthe same time.This parallel processing resembles the way the brain works, and it differsfrom the serial processing of conventional computing.
Network Information ProcessingOnce the structure of a neural network is determined, information can be processed.We now present the major concepts related to the processing.
Inputs Each input corresponds to a single attribute. For example, if the problem is todecide on approval or disapproval of a loan, some attributes could be the applicant’sincome level, age, and home ownership. The numeric value, or representation, of anattribute is the input to the network. Several types of data, such as text, pictures, andvoice, can be used as inputs. Preprocessing may be needed to convert the data to mean-ingful inputs from symbolic data or to scale the data.
Outputs The outputs of a network contain the solution to a problem. For example, inthe case of a loan application, the outputs can be yes or no. The ANN assigns numericvalues to the outputs, such as 1 for yes and 0 for no. The purpose of the network is tocompute the values of the output. Often, postprocessing of the outputs is requiredbecause some networks use two outputs: one for yes and another for no. It is commonto have to round the outputs to the nearest 0 or 1.
Connection Weights Connection weights are the key elements in an ANN. Theyexpress the relative strength (or mathematical value) of the input data or the manyconnections that transfer data from layer to layer. In other words, weights express therelative importance of each input to a processing element and, ultimately, the outputs.
FIGURE 6.3 Neural Network with One Hidden Layer
TURBMW06_013234761X.QXD 3/7/07 8:07 PM Page 9
◆ W6-10 Business Intelligence: A Managerial Approach
Weights are crucial in that they store learned patterns of information. It is throughrepeated adjustments of weights that a network learns.
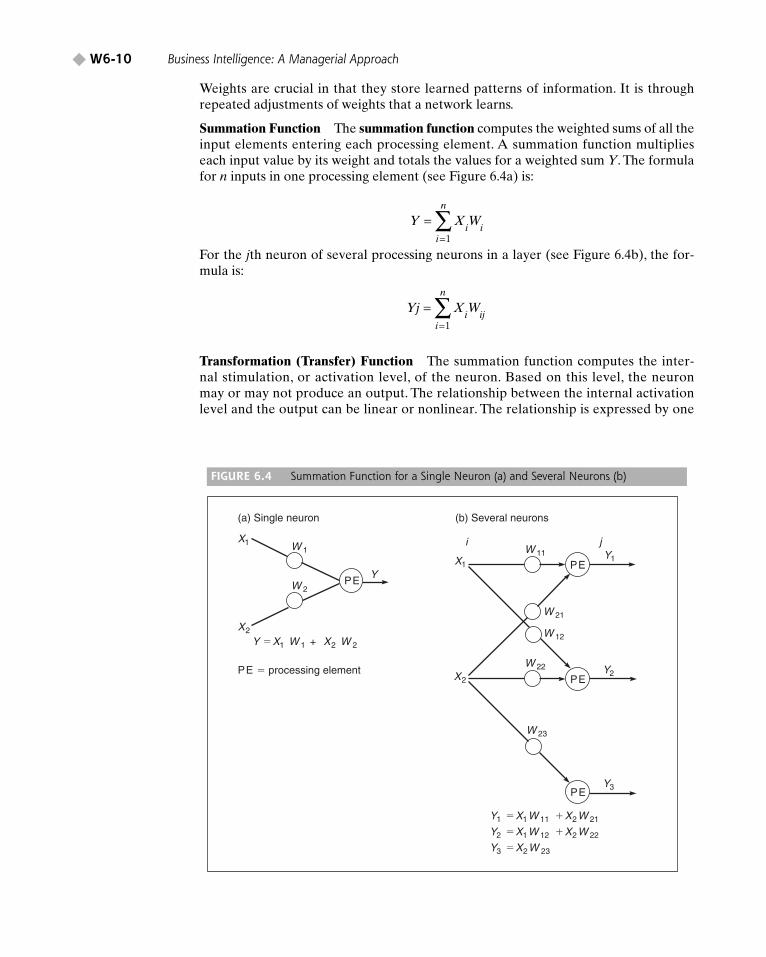
Summation Function The summation function computes the weighted sums of all theinput elements entering each processing element. A summation function multiplieseach input value by its weight and totals the values for a weighted sum Y. The formulafor n inputs in one processing element (see Figure 6.4a) is:
For the jth neuron of several processing neurons in a layer (see Figure 6.4b), the for-mula is:
Transformation (Transfer) Function The summation function computes the inter-nal stimulation, or activation level, of the neuron. Based on this level, the neuronmay or may not produce an output. The relationship between the internal activationlevel and the output can be linear or nonlinear. The relationship is expressed by one
Yj X Wi ij
i
n
==∑
1
Y X Wi i
i
n
==∑
1
(a) Single neuron (b) Several neurons
PE � processing element
Y � X1 W 1 + X2 W 2
Y1 � X1W 11 � X2W 21
Y2 � X1W 12 � X2W 22
Y3 � X2W 23
X1
X2
W 21
W 12
W 22
W 11 Y1
Y2
Y3
PE
PE
PE
PE
X1
X2
W 23
W 1
W 2
Y
i j
FIGURE 6.4 Summation Function for a Single Neuron (a) and Several Neurons (b)
TURBMW06_013234761X.QXD 3/7/07 8:07 PM Page 10
CHAPTER 6 Neural Networks for Data Mining W6-11 ◆
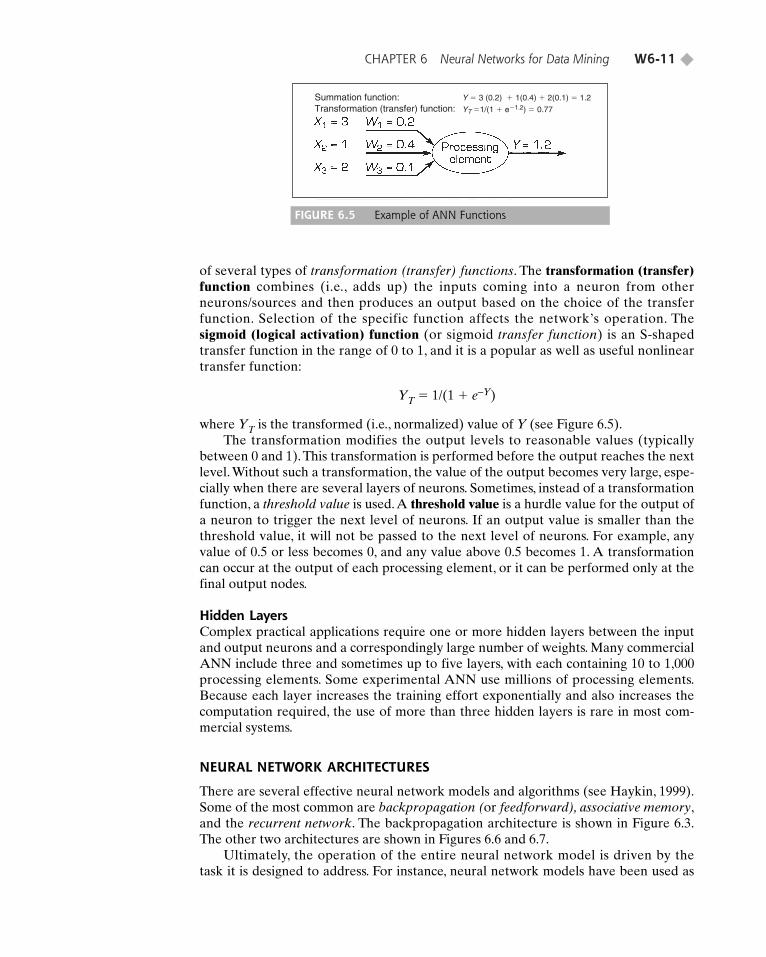
of several types of transformation (transfer) functions. The transformation (transfer)function combines (i.e., adds up) the inputs coming into a neuron from otherneurons/sources and then produces an output based on the choice of the transferfunction. Selection of the specific function affects the network’s operation. Thesigmoid (logical activation) function (or sigmoid transfer function) is an S-shapedtransfer function in the range of 0 to 1, and it is a popular as well as useful nonlineartransfer function:
YT � 1/(1 � e−Y)
where YT is the transformed (i.e., normalized) value of Y (see Figure 6.5).The transformation modifies the output levels to reasonable values (typically
between 0 and 1). This transformation is performed before the output reaches the nextlevel. Without such a transformation, the value of the output becomes very large, espe-cially when there are several layers of neurons. Sometimes, instead of a transformationfunction, a threshold value is used. A threshold value is a hurdle value for the output ofa neuron to trigger the next level of neurons. If an output value is smaller than thethreshold value, it will not be passed to the next level of neurons. For example, anyvalue of 0.5 or less becomes 0, and any value above 0.5 becomes 1. A transformationcan occur at the output of each processing element, or it can be performed only at thefinal output nodes.
Hidden LayersComplex practical applications require one or more hidden layers between the inputand output neurons and a correspondingly large number of weights. Many commercialANN include three and sometimes up to five layers, with each containing 10 to 1,000processing elements. Some experimental ANN use millions of processing elements.Because each layer increases the training effort exponentially and also increases thecomputation required, the use of more than three hidden layers is rare in most com-mercial systems.
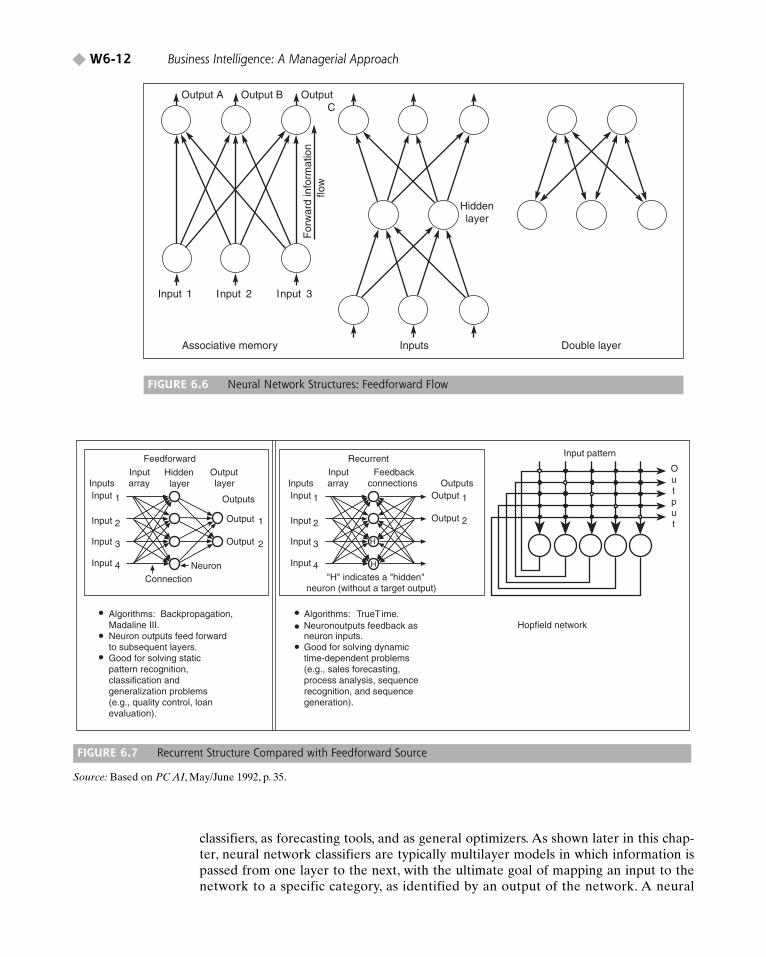
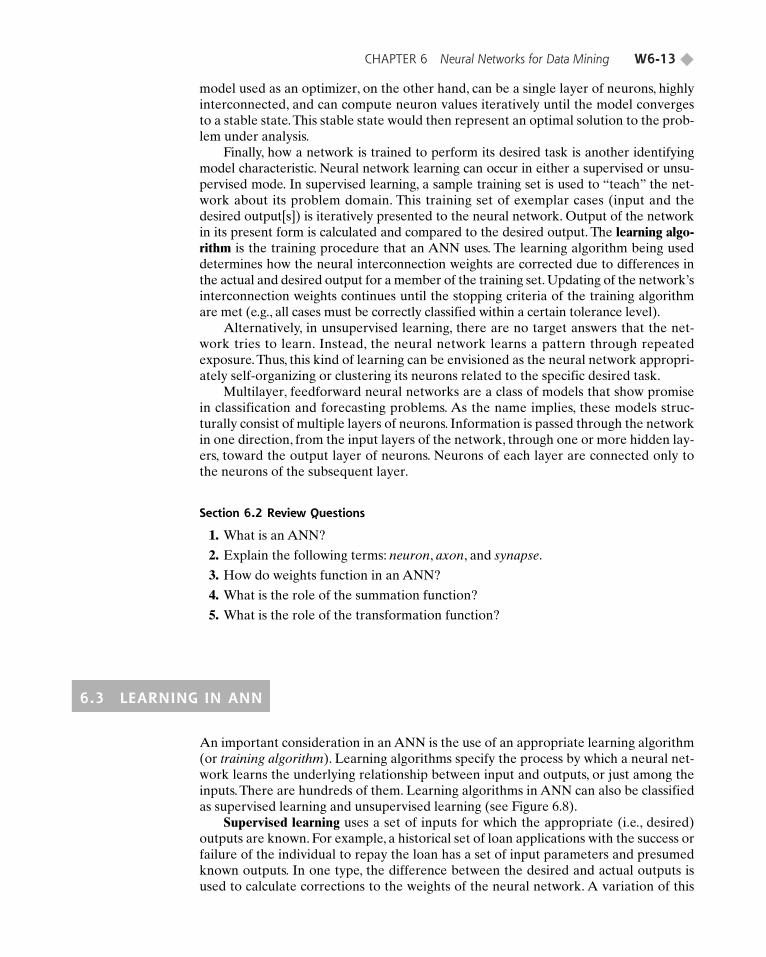
NEURAL NETWORK ARCHITECTURES
There are several effective neural network models and algorithms (see Haykin, 1999).Some of the most common are backpropagation (or feedforward), associative memory,and the recurrent network. The backpropagation architecture is shown in Figure 6.3.The other two architectures are shown in Figures 6.6 and 6.7.
Ultimately, the operation of the entire neural network model is driven by thetask it is designed to address. For instance, neural network models have been used as
Summation function: Y � 3 (0.2) � 1(0.4) � 2(0.1) � 1.2Transformation (transfer) function: YT �1/(1 � e�1.2) � 0.77
FIGURE 6.5 Example of ANN Functions
TURBMW06_013234761X.QXD 3/7/07 8:07 PM Page 11
◆ W6-12 Business Intelligence: A Managerial Approach
Feedforward
InputsInput 1
Input 2
Input 3
Input 4
Inputarray
Hiddenlayer
Outputlayer
Connection
Output 1
Output 2
Algorithms: Backpropagation,Madaline III.Neuron outputs feed forwardto subsequent layers.Good for solving staticpattern recognition,classification andgeneralization problems(e.g., quality control, loanevaluation).
Outputs
Recurrent
InputsInput 1
Input 2
Input 3
Input 4
Inputarray
Feedbackconnections
Output 1
Output 2
Outputs
"H" indicates a "hidden"neuron (without a target output)
Algorithms: TrueTime.Neuronoutputs feedback asneuron inputs.Good for solving dynamictime-dependent problems(e.g., sales forecasting,process analysis, sequencerecognition, and sequencegeneration).
Input pattern
Output
Hopfield network
H
HNeuron
Input 1 Input 2 Input 3
InputsAssociative memory Double layer
Hiddenlayer
Output A Output B Output C
For
war
d in
form
atio
nflo
w
classifiers, as forecasting tools, and as general optimizers. As shown later in this chap-ter, neural network classifiers are typically multilayer models in which information ispassed from one layer to the next, with the ultimate goal of mapping an input to thenetwork to a specific category, as identified by an output of the network. A neural
FIGURE 6.6 Neural Network Structures: Feedforward Flow
FIGURE 6.7 Recurrent Structure Compared with Feedforward Source
Source: Based on PC AI, May/June 1992, p. 35.
TURBMW06_013234761X.QXD 3/7/07 8:07 PM Page 12
CHAPTER 6 Neural Networks for Data Mining W6-13 ◆
model used as an optimizer, on the other hand, can be a single layer of neurons, highlyinterconnected, and can compute neuron values iteratively until the model convergesto a stable state.This stable state would then represent an optimal solution to the prob-lem under analysis.
Finally, how a network is trained to perform its desired task is another identifyingmodel characteristic. Neural network learning can occur in either a supervised or unsu-pervised mode. In supervised learning, a sample training set is used to “teach” the net-work about its problem domain. This training set of exemplar cases (input and thedesired output[s]) is iteratively presented to the neural network. Output of the networkin its present form is calculated and compared to the desired output. The learning algo-rithm is the training procedure that an ANN uses. The learning algorithm being useddetermines how the neural interconnection weights are corrected due to differences inthe actual and desired output for a member of the training set. Updating of the network’sinterconnection weights continues until the stopping criteria of the training algorithmare met (e.g., all cases must be correctly classified within a certain tolerance level).
Alternatively, in unsupervised learning, there are no target answers that the net-work tries to learn. Instead, the neural network learns a pattern through repeatedexposure.Thus, this kind of learning can be envisioned as the neural network appropri-ately self-organizing or clustering its neurons related to the specific desired task.
Multilayer, feedforward neural networks are a class of models that show promisein classification and forecasting problems. As the name implies, these models struc-turally consist of multiple layers of neurons. Information is passed through the networkin one direction, from the input layers of the network, through one or more hidden lay-ers, toward the output layer of neurons. Neurons of each layer are connected only tothe neurons of the subsequent layer.
Section 6.2 Review Questions
1. What is an ANN?
2. Explain the following terms: neuron, axon, and synapse.
3. How do weights function in an ANN?
4. What is the role of the summation function?
5. What is the role of the transformation function?
6.3 LEARNING IN ANN
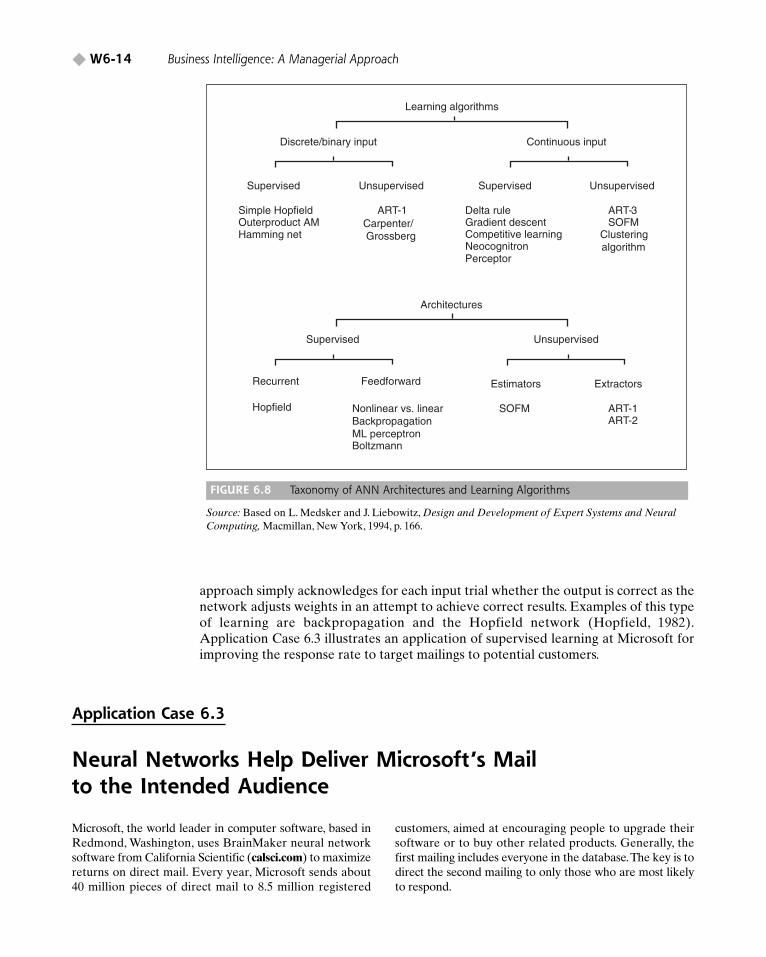
An important consideration in an ANN is the use of an appropriate learning algorithm(or training algorithm). Learning algorithms specify the process by which a neural net-work learns the underlying relationship between input and outputs, or just among theinputs. There are hundreds of them. Learning algorithms in ANN can also be classifiedas supervised learning and unsupervised learning (see Figure 6.8).
Supervised learning uses a set of inputs for which the appropriate (i.e., desired)outputs are known. For example, a historical set of loan applications with the success orfailure of the individual to repay the loan has a set of input parameters and presumedknown outputs. In one type, the difference between the desired and actual outputs isused to calculate corrections to the weights of the neural network. A variation of this
TURBMW06_013234761X.QXD 3/7/07 8:07 PM Page 13
◆ W6-14 Business Intelligence: A Managerial Approach
Application Case 6.3
Neural Networks Help Deliver Microsoft’s Mail to the Intended Audience
Learning algorithms
Discrete/binary input Continuous input
Supervised Unsupervised
Simple HopfieldOuterproduct AMHamming net
ARTCarpenter/Grossberg
-1
Supervised
Delta ruleGradient descentCompetitive learningNeocognitronPerceptor
Clusteringalgorithm
Unsupervised
ART-3SOFM
Architectures
Supervised
Hopfield Nonlinear vs. linearBackpropagationML perceptronBoltzmann
Estimators
SOFM
Unsupervised
ART-1ART-2
Recurrent ExtractorsFeedforward
Microsoft, the world leader in computer software, based inRedmond, Washington, uses BrainMaker neural networksoftware from California Scientific (calsci.com) to maximizereturns on direct mail. Every year, Microsoft sends about40 million pieces of direct mail to 8.5 million registered
customers, aimed at encouraging people to upgrade theirsoftware or to buy other related products. Generally, thefirst mailing includes everyone in the database.The key is todirect the second mailing to only those who are most likelyto respond.
FIGURE 6.8 Taxonomy of ANN Architectures and Learning Algorithms
Source: Based on L. Medsker and J. Liebowitz, Design and Development of Expert Systems and NeuralComputing, Macmillan, New York, 1994, p. 166.
approach simply acknowledges for each input trial whether the output is correct as thenetwork adjusts weights in an attempt to achieve correct results. Examples of this typeof learning are backpropagation and the Hopfield network (Hopfield, 1982).Application Case 6.3 illustrates an application of supervised learning at Microsoft forimproving the response rate to target mailings to potential customers.
TURBMW06_013234761X.QXD 3/7/07 8:07 PM Page 14
CHAPTER 6 Neural Networks for Data Mining W6-15 ◆
Several variables were fed into the BrainMaker neuralnetwork to get productive results.The first step was to iden-tify the variables that were relevant and to eliminate thevariables that did not cause any effect. The following weresome of the significant variables:
• Recency, calculated in number of days, which mea-sures the last time something was bought and regis-tered. It is likely that the more recently a customerhas bought something, the better the chance thathe or she is going to buy more.
• First date to file, which is the date an individualmade his or her first purchase. This is a measure ofloyalty. Chances are high that a customer will buyagain if he or she has been a loyal customer.
• The number of products bought and registered.• The value of the products bought and registered,
calculated at the standard reselling price.• The number of days between the time the product
came out and when it was purchased; research hasshown that people who tend to buy things as soonas they are available are the key individuals to bereached.
Several other personal characteristics were also addedand scored with yes/no responses.
Before training, the information obtained from the cus-tomer responses was fed into a format the network could use,and yes/no responses were transformed to numeric data.Minimums and maximums were set on certain variables.
Initially, the network was trained with 25 variables.The data were taken from seven or eight campaigns tomake it varied and represent all aspects of the business,including the Mac and Windows sides, from high and lowprice-point products.
Before Microsoft began using BrainMaker, an aver-age mailing would get a response rate of 4.9 percent. Byusing BrainMaker, the response rate has increased to 8.2percent. The neural network was tested on data from 20different campaigns with known results not used duringtraining. The results showed repeated and consistentsavings. An average mailing resulted in a 35 percent costsavings for Microsoft.
Sources: California Scientific, “Maximize Returns on DirectMail with BrainMaker Neural Networks Software,”calsci.com/DirectMail.html; and G. Piatesky-Shapiro,ISR:Microsoft Success Using Neural Network for DirectMarketing, Kdnuggets.com/news/94/n9.txt (accessed March 2006).
In unsupervised learning, only input stimuli are shown to the network.The network isself-organizing; that is, it organizes itself internally so that each hidden processing elementresponds strategically to a different set of input stimuli (or groups of stimuli). No knowl-edge is supplied about which classifications (i.e., outputs) are correct, and those that thenetwork derives may or may not be meaningful to the network developer (this is usefulfor cluster analysis). However, by setting model parameters, we can control the number ofcategories into which a network classifies the inputs. Regardless, a human must examinethe final categories to assign meaning and determine the usefulness of the results.Examples of this type of learning are adaptive resonance theory (ART) (i.e., a neural net-work architecture that is aimed at being brain-like in unsupervised mode) and Kohonenself-organizing feature maps (i.e., neural network models for machine learning).
As mentioned earlier, many different and distinct neural network paradigms havebeen proposed for various decision-making domains. A neural model that has beenshown appropriate for classification problems (e.g., bankruptcy prediction) is the feed-forward MLP. Multilayered networks have continuously valued neurons (i.e., process-ing elements), are trained in a supervised manner, and consist of one or more layers ofnodes (i.e., hidden nodes) between the input and output nodes. A typical feedforwardneural network is shown in Figure 6.3. Input nodes represent where information is pre-sented to the network, output nodes provide the “decision” of the neural network, andthe hidden nodes via the interconnection weights contain the proper mapping of inputsto outputs (i.e., decisions).
The backpropagation learning algorithm is the standard way of implementingsupervised training of feedforward neural networks. It is an iterative gradient-descenttechnique designed to minimize an error function between the actual output of thenetwork and its desired output, as specified in the training set of data. Adjustment ofthe interconnection weights, which contain the mapping function per se, starts at theoutput node where the error measure is initially calculated and is then propagated
TURBMW06_013234761X.QXD 3/7/07 8:07 PM Page 15

◆ W6-16 Business Intelligence: A Managerial Approach
back through the layers of the network, toward the input layer. More details areincluded in the following section.
THE GENERAL ANN LEARNING PROCESS
In supervised learning, the learning process is inductive; that is, connection weights arederived from existing cases. The usual process of learning involves three tasks (see Figure 6.9):
1. Compute temporary outputs.2. Compare outputs with desired targets.3. Adjust the weights and repeat the process.
When existing outputs are available for comparison, the learning process starts bysetting the connection weights, either via rules or randomly. The difference betweenthe actual output (Y or YT) and the desired output (Z) for a given set of inputs is anerror called delta (in calculus, the Greek symbol delta, ∆, means “difference”).
The objective is to minimize the delta (i.e., reduce it to 0 if possible), which is done byadjusting the network’s weights. The key is to change the weights in the right direction,making changes that reduce the delta (i.e., error).We will show how this is done later.
Information processing with an ANN consists of an attempt to recognize patternsof activities (i.e., pattern recognition). During the learning stages, the interconnectionweights change in response to training data presented to the system.
Different ANN compute delta in different ways, depending on the learning algo-rithm being used. There are hundreds of learning algorithms for various situations andconfigurations, some of which are discussed later in this chapter.
HOW A NETWORK LEARNS
Consider a single neuron that learns the inclusive OR operation—a classic problem insymbolic logic. There are two input elements, X1 and X2. If either or both of them havea positive value, the result is also positive. This can be shown as follows:
FIGURE 6.9 Learning Process of an ANN
TURBMW06_013234761X.QXD 3/7/07 8:07 PM Page 16
CHAPTER 6 Neural Networks for Data Mining W6-17 ◆
Inputs
Case X1 X2 Desired Results
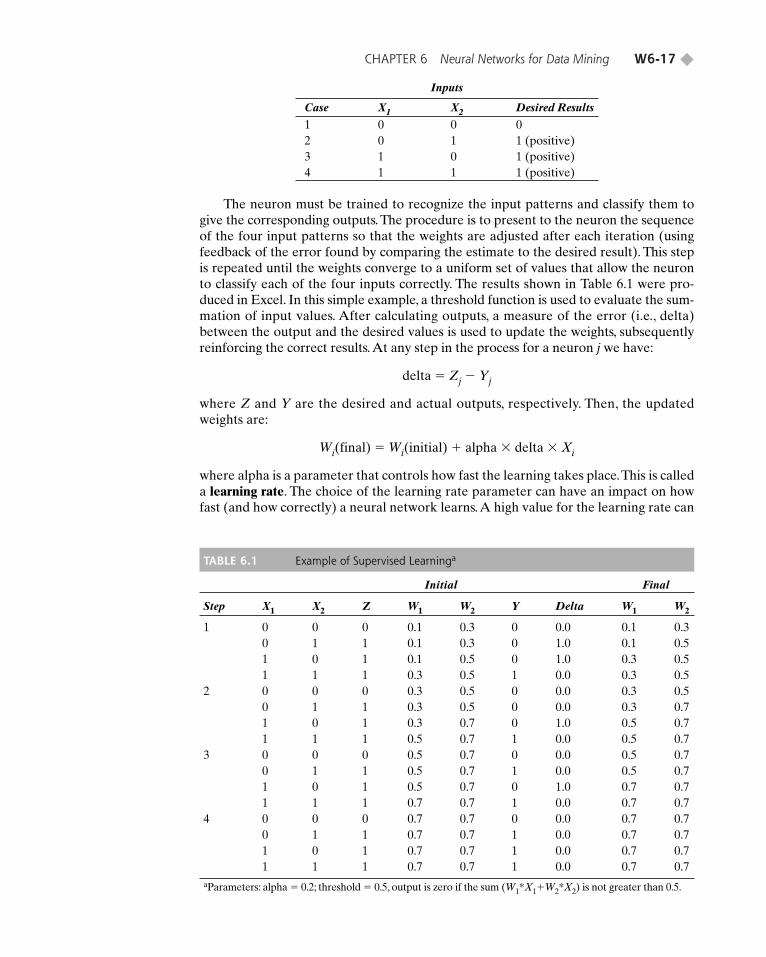
1 0 0 02 0 1 1 (positive)3 1 0 1 (positive)4 1 1 1 (positive)
The neuron must be trained to recognize the input patterns and classify them togive the corresponding outputs. The procedure is to present to the neuron the sequenceof the four input patterns so that the weights are adjusted after each iteration (usingfeedback of the error found by comparing the estimate to the desired result). This stepis repeated until the weights converge to a uniform set of values that allow the neuronto classify each of the four inputs correctly. The results shown in Table 6.1 were pro-duced in Excel. In this simple example, a threshold function is used to evaluate the sum-mation of input values. After calculating outputs, a measure of the error (i.e., delta)between the output and the desired values is used to update the weights, subsequentlyreinforcing the correct results. At any step in the process for a neuron j we have:
delta � Zj � Yj
where Z and Y are the desired and actual outputs, respectively. Then, the updatedweights are:
Wi(final) � Wi(initial) � alpha � delta � Xi
where alpha is a parameter that controls how fast the learning takes place.This is calleda learning rate. The choice of the learning rate parameter can have an impact on howfast (and how correctly) a neural network learns.A high value for the learning rate can
TABLE 6.1 Example of Supervised Learninga
Initial Final
Step X1 X2 Z W1 W2 Y Delta W1 W2
1 0 0 0 0.1 0.3 0 0.0 0.1 0.30 1 1 0.1 0.3 0 1.0 0.1 0.51 0 1 0.1 0.5 0 1.0 0.3 0.51 1 1 0.3 0.5 1 0.0 0.3 0.5
2 0 0 0 0.3 0.5 0 0.0 0.3 0.50 1 1 0.3 0.5 0 0.0 0.3 0.71 0 1 0.3 0.7 0 1.0 0.5 0.71 1 1 0.5 0.7 1 0.0 0.5 0.7
3 0 0 0 0.5 0.7 0 0.0 0.5 0.70 1 1 0.5 0.7 1 0.0 0.5 0.71 0 1 0.5 0.7 0 1.0 0.7 0.71 1 1 0.7 0.7 1 0.0 0.7 0.7
4 0 0 0 0.7 0.7 0 0.0 0.7 0.70 1 1 0.7 0.7 1 0.0 0.7 0.71 0 1 0.7 0.7 1 0.0 0.7 0.71 1 1 0.7 0.7 1 0.0 0.7 0.7
aParameters: alpha � 0.2; threshold � 0.5, output is zero if the sum (W1*X1�W2*X2) is not greater than 0.5.
TURBMW06_013234761X.QXD 3/7/07 8:07 PM Page 17
◆ W6-18 Business Intelligence: A Managerial Approach
lead to too much correction in the weight values, resulting in going back and forthamong possible weights values and never reaching the optimal, which may lie some-where in between the endpoints. Too low a learning rate may slow down the learningprocess. In practice, a neural network analyst may try using many different choices oflearning rates to achieve optimal learning.
Most implementations of the learning process also include a counterbalancingparameter called momentum to provide a balance to the learning rate. Essentially,whereas learning rate is aimed at correcting for the error, momentum is aimed at slow-ing down the learning. Many of the software programs available for neural networkstoday can automatically select these parameters for the user or let the user experimentwith many different combinations of such parameters.
As shown in Table 6.1, each calculation uses one of the X1 and X2 pairs and thecorresponding value for the OR operation, along with the initial values W1 and W2 ofthe neuron’s weights. Initially, the weights are assigned random values, and the learningrate, alpha, is set low. Delta is used to derive the final weights, which then become theinitial weights in the next iteration (i.e., row).
The initial values of weights for each input are transformed using the equationshown earlier to assign the values that are used with the next input (i.e., row). Thethreshold value (0.5) sets the output Y to 1 in the next row if the weighted sum of inputsis greater than 0.5; otherwise, Y is set to 0. In the first step, two of the four outputs areincorrect (delta � 1), and a consistent set of weights has not been found. In subsequentsteps, the learning algorithm improves the results, until it finally produces a set ofweights that give the correct results (W1 � W2 � 0.7 in step 4 of Table 6.1). Oncedetermined, a neuron with these weight values can quickly perform the OR operation.
In developing an ANN, an attempt is made to fit the problem characteristic to oneof the known learning algorithms. There are software programs for all the differentalgorithms, such as backpropagation, which we describe next. Many variants of thisalgorithm exist, but the core concepts of them all are similar.
BACKPROPAGATION
Backpropagation (short for back-error propagation) is the most widely used super-vised learning algorithm in neural computing (Principe et al., 2000). It is very easy toimplement. A backpropagation network includes one or more hidden layers. This typeof network is considered feedforward because there are no interconnections betweenthe output of a processing element and the input of a node in the same layer or in apreceding layer. Externally provided correct patterns are compared with the neuralnetwork’s output during (supervised) training, and feedback is used to adjust theweights until the network has categorized all the training patterns as correctly as possi-ble (the error tolerance is set in advance).
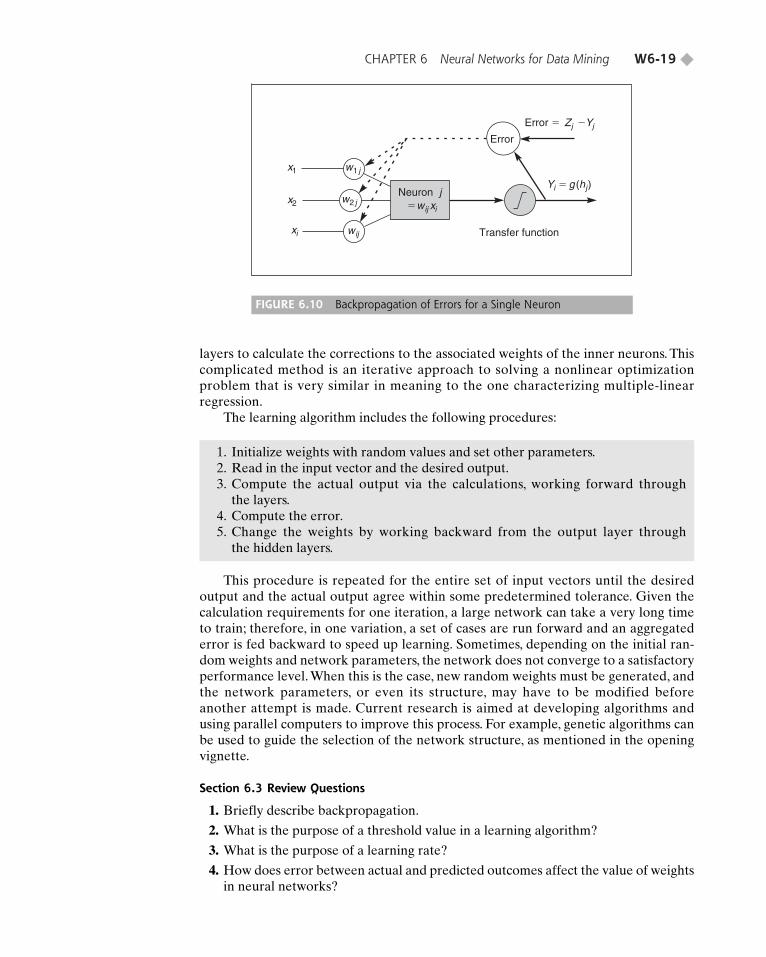
Starting with the output layer, errors between the actual and desired outputs areused to correct the weights for the connections to the previous layer (see Figure 6.10).For any output neuron j, the error (delta) � (Zj � Yj)(df/dx), where Z and Y are thedesired and actual outputs, respectively. Using the sigmoid function, f � [1 � exp(�x)]−1,where x is proportional to the sum of the weighted inputs to the neuron, is an effectiveway to compute the output of a neuron in practice. With this function, the derivative ofthe sigmoid function df/dx � f(1 � f ) and the error is a simple function of the desiredand actual outputs. The factor f(1 � f) is the logistic function, which serves to keep theerror correction well bounded. The weights of each input to the jth neuron are thenchanged in proportion to this calculated error. A more complicated expression can bederived to work backward in a similar way from the output neurons through the hidden
TURBMW06_013234761X.QXD 3/7/07 8:07 PM Page 18
CHAPTER 6 Neural Networks for Data Mining W6-19 ◆
Neuron jwij xi
wij
w2 j
w1 j x1
x2
xi
Error
Transfer function
Error � Zj � Yj
Yi � g (hj)
�
FIGURE 6.10 Backpropagation of Errors for a Single Neuron
layers to calculate the corrections to the associated weights of the inner neurons. Thiscomplicated method is an iterative approach to solving a nonlinear optimizationproblem that is very similar in meaning to the one characterizing multiple-linearregression.
The learning algorithm includes the following procedures:
1. Initialize weights with random values and set other parameters.2. Read in the input vector and the desired output.3. Compute the actual output via the calculations, working forward through
the layers.4. Compute the error.5. Change the weights by working backward from the output layer through
the hidden layers.
This procedure is repeated for the entire set of input vectors until the desiredoutput and the actual output agree within some predetermined tolerance. Given thecalculation requirements for one iteration, a large network can take a very long timeto train; therefore, in one variation, a set of cases are run forward and an aggregatederror is fed backward to speed up learning. Sometimes, depending on the initial ran-dom weights and network parameters, the network does not converge to a satisfactoryperformance level. When this is the case, new random weights must be generated, andthe network parameters, or even its structure, may have to be modified beforeanother attempt is made. Current research is aimed at developing algorithms andusing parallel computers to improve this process. For example, genetic algorithms canbe used to guide the selection of the network structure, as mentioned in the openingvignette.
Section 6.3 Review Questions
1. Briefly describe backpropagation.
2. What is the purpose of a threshold value in a learning algorithm?
3. What is the purpose of a learning rate?
4. How does error between actual and predicted outcomes affect the value of weightsin neural networks?
TURBMW06_013234761X.QXD 3/7/07 8:07 PM Page 19
◆ W6-20 Business Intelligence: A Managerial Approach
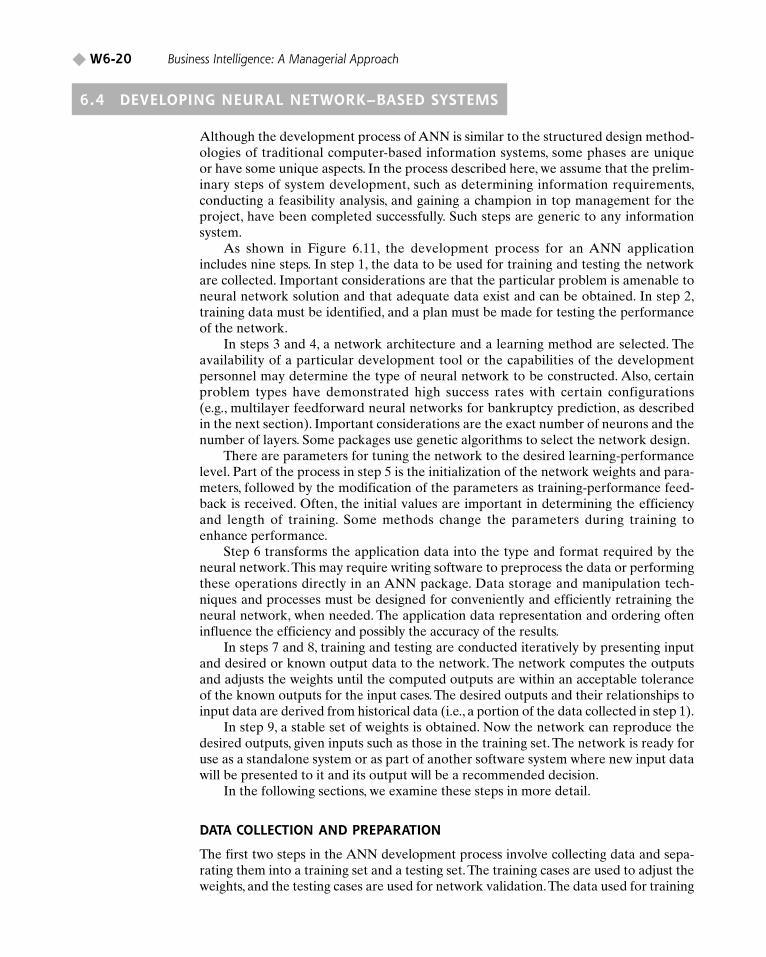
6.4 DEVELOPING NEURAL NETWORK–BASED SYSTEMS
Although the development process of ANN is similar to the structured design method-ologies of traditional computer-based information systems, some phases are uniqueor have some unique aspects. In the process described here, we assume that the prelim-inary steps of system development, such as determining information requirements,conducting a feasibility analysis, and gaining a champion in top management for theproject, have been completed successfully. Such steps are generic to any informationsystem.
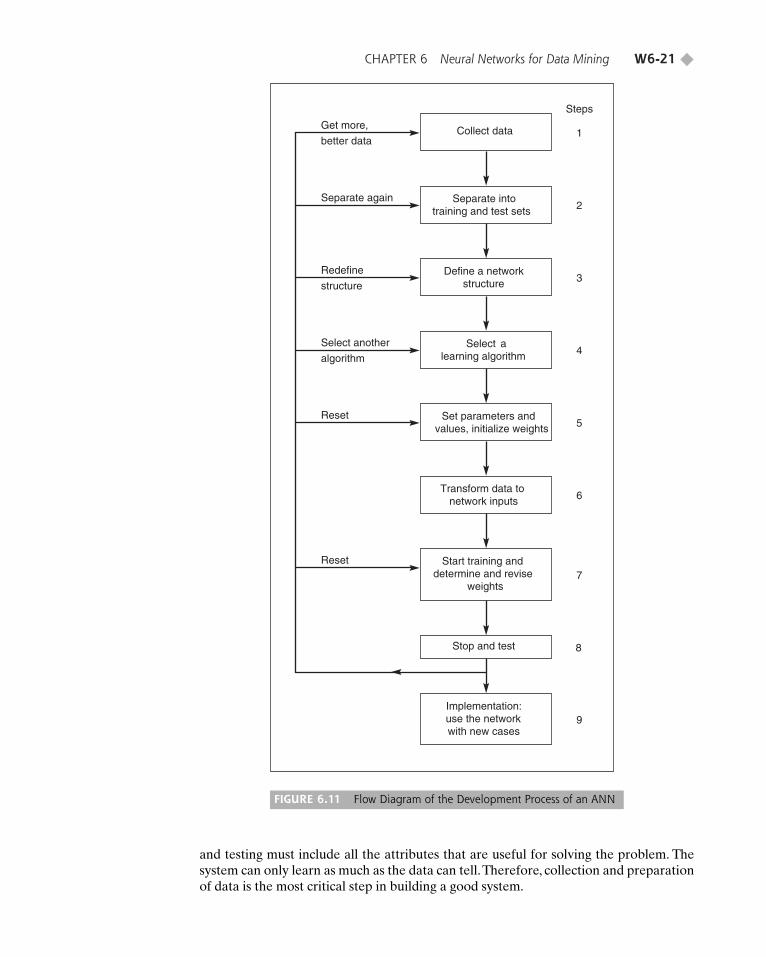
As shown in Figure 6.11, the development process for an ANN applicationincludes nine steps. In step 1, the data to be used for training and testing the networkare collected. Important considerations are that the particular problem is amenable toneural network solution and that adequate data exist and can be obtained. In step 2,training data must be identified, and a plan must be made for testing the performanceof the network.
In steps 3 and 4, a network architecture and a learning method are selected. Theavailability of a particular development tool or the capabilities of the developmentpersonnel may determine the type of neural network to be constructed. Also, certainproblem types have demonstrated high success rates with certain configurations (e.g., multilayer feedforward neural networks for bankruptcy prediction, as describedin the next section). Important considerations are the exact number of neurons and thenumber of layers. Some packages use genetic algorithms to select the network design.
There are parameters for tuning the network to the desired learning-performancelevel. Part of the process in step 5 is the initialization of the network weights and para-meters, followed by the modification of the parameters as training-performance feed-back is received. Often, the initial values are important in determining the efficiencyand length of training. Some methods change the parameters during training toenhance performance.
Step 6 transforms the application data into the type and format required by theneural network.This may require writing software to preprocess the data or performingthese operations directly in an ANN package. Data storage and manipulation tech-niques and processes must be designed for conveniently and efficiently retraining theneural network, when needed. The application data representation and ordering ofteninfluence the efficiency and possibly the accuracy of the results.
In steps 7 and 8, training and testing are conducted iteratively by presenting inputand desired or known output data to the network. The network computes the outputsand adjusts the weights until the computed outputs are within an acceptable toleranceof the known outputs for the input cases. The desired outputs and their relationships toinput data are derived from historical data (i.e., a portion of the data collected in step 1).
In step 9, a stable set of weights is obtained. Now the network can reproduce thedesired outputs, given inputs such as those in the training set. The network is ready foruse as a standalone system or as part of another software system where new input datawill be presented to it and its output will be a recommended decision.
In the following sections, we examine these steps in more detail.
DATA COLLECTION AND PREPARATION
The first two steps in the ANN development process involve collecting data and sepa-rating them into a training set and a testing set.The training cases are used to adjust theweights, and the testing cases are used for network validation.The data used for training
TURBMW06_013234761X.QXD 3/7/07 8:07 PM Page 20
CHAPTER 6 Neural Networks for Data Mining W6-21 ◆
Get more,
better dataCollect data 1
Steps
Separate again Separate intotraining and test sets 2
Redefine
structureDefine a network
structure 3
Select another
algorithmSelect a
learning algorithm 4
Reset Set parameters andvalues, initialize weights 5
Transform data tonetwork inputs 6
Reset Start training anddetermine and revise
weights7
Stop and test 8
Implementation:use the networkwith new cases
9
FIGURE 6.11 Flow Diagram of the Development Process of an ANN
and testing must include all the attributes that are useful for solving the problem. Thesystem can only learn as much as the data can tell.Therefore, collection and preparationof data is the most critical step in building a good system.
TURBMW06_013234761X.QXD 3/7/07 8:07 PM Page 21
◆ W6-22 Business Intelligence: A Managerial Approach
In general, the more data used, the better. Larger data sets increase processing timeduring training but improve the accuracy of the training and often lead to faster conver-gence to a good set of weights. For a moderately sized data set, typically 80 percent ofthe data are randomly selected for training and 20 percent are selected for testing; forsmall data sets, typically all the data are used for training and testing; and for large datasets, a sufficiently large sample is taken and treated like a moderately sized data set.
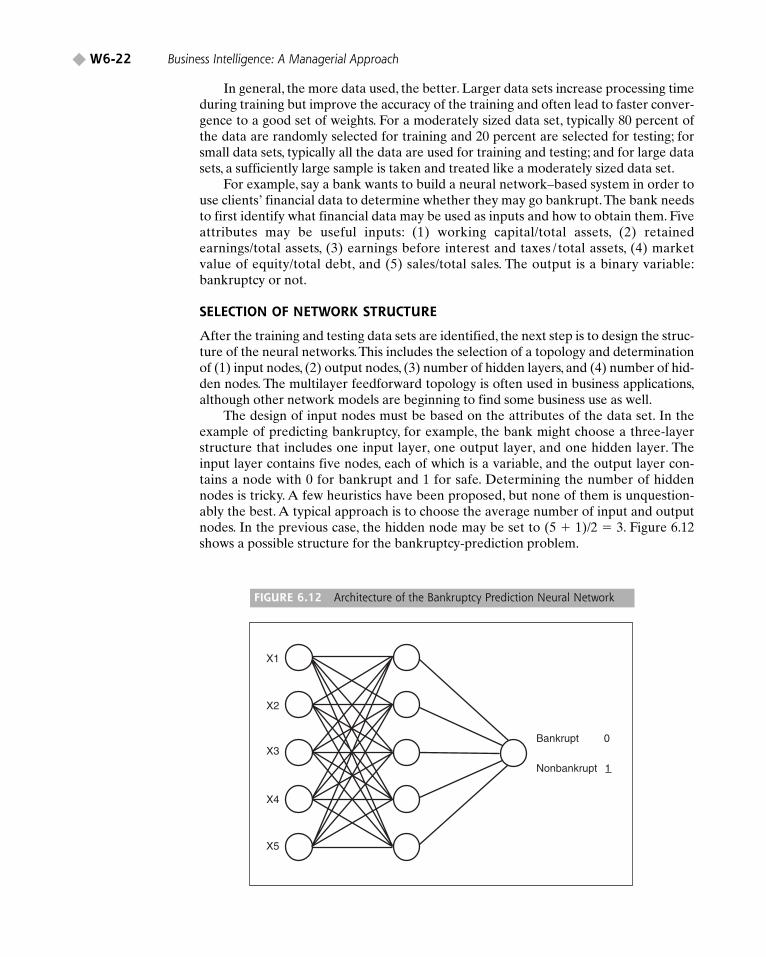
For example, say a bank wants to build a neural network–based system in order touse clients’ financial data to determine whether they may go bankrupt.The bank needsto first identify what financial data may be used as inputs and how to obtain them. Fiveattributes may be useful inputs: (1) working capital/total assets, (2) retainedearnings/total assets, (3) earnings before interest and taxes / total assets, (4) marketvalue of equity/total debt, and (5) sales/total sales. The output is a binary variable:bankruptcy or not.
SELECTION OF NETWORK STRUCTURE
After the training and testing data sets are identified, the next step is to design the struc-ture of the neural networks.This includes the selection of a topology and determinationof (1) input nodes, (2) output nodes, (3) number of hidden layers, and (4) number of hid-den nodes. The multilayer feedforward topology is often used in business applications,although other network models are beginning to find some business use as well.
The design of input nodes must be based on the attributes of the data set. In theexample of predicting bankruptcy, for example, the bank might choose a three-layerstructure that includes one input layer, one output layer, and one hidden layer. Theinput layer contains five nodes, each of which is a variable, and the output layer con-tains a node with 0 for bankrupt and 1 for safe. Determining the number of hiddennodes is tricky. A few heuristics have been proposed, but none of them is unquestion-ably the best. A typical approach is to choose the average number of input and outputnodes. In the previous case, the hidden node may be set to (5 � 1)/2 � 3. Figure 6.12shows a possible structure for the bankruptcy-prediction problem.
X1
X2
X3
X4
X5
Bankrupt 0
Nonbankrupt 1
FIGURE 6.12 Architecture of the Bankruptcy Prediction Neural Network
TURBMW06_013234761X.QXD 3/7/07 8:07 PM Page 22
CHAPTER 6 Neural Networks for Data Mining W6-23 ◆
LEARNING ALGORITHM SELECTION
After the network structure is chosen, we need to find a learning algorithm to identifya set of connection weights that best cover the training data and have the best predic-tive accuracy. For the feedforward topology we chose for the bankruptcy-predictionproblem, a typical approach is to use the backpropagation algorithm. Because manycommercial packages are available on the market, there is no need to implement thelearning algorithm by ourselves. Instead, we can choose a suitable commercial packageto analyze the data.Technology Insights 6.4 summarizes information on different typesof neural network software packages that are available.
NETWORK TRAINING
Training of ANN is an iterative process that starts from a random set of weights andgradually enhances the fitness of the network model and the known data set. The itera-tion continues until the error sum is converged to below a preset acceptable level. In the
TECHNOLOGY INSIGHTS 6.4
ANN Software
There are many tools for developing neural networks(see this book’s Web site and the periodic resource lists inPC AI, pcai.com). Some of these tools function likeexpert system shells.They provide a set of standard archi-tectures, learning algorithms, and parameters, along withthe ability to manipulate the data. Some developmenttools can support up to several dozen network paradigmsand learning algorithms.
Neural network implementations are also availablein most of the comprehensive data mining tools, such asthe SAS Enterprise Miner, Clementine, and STATIS-TICA Data Miner. WEKA is an open source collectionof machine learning algorithms for data mining tasks,and it includes neural network capabilities. WEKA canbe downloaded from cs.waikato.ac.nz/~ml/weka.STATISTICA is available on trial basis to adopters ofthis book.
Many specialized neural network tools enable thebuilding and deployment of a neural network model inpractice. Any listing of such tools would be incomplete.Online resources such as Wikipedia (en.wikipedia.org/wiki/Artificial_neural_network), the Google or Yahoosoftware directory, and vendor listings on pcai.comare good places to locate the latest information onneural network software vendors. Some of the vendorsthat have been around for a while and have reportedindustrial applications of their neural network softwareinclude California Scientific (BrainMaker), NeuralWare,NeuroDimension Inc.,Ward Systems Group (Neuroshell),and Megaputer. Again, the list can never be complete.
Some ANN development tools are spreadsheetadd-ins. Most can read spreadsheet, database, and text
files. Some are freeware or shareware. Some ANN sys-tems have been developed in Java to run directly on theWeb and are accessible through a Web browser inter-face. Other ANN products are designed to interfacewith expert systems as hybrid development products.
Developers may instead prefer to use more generalprogramming languages, such as C��, or a spreadsheetto program the model and perform the calculations. Avariation on this is to use a library of ANN routines. Forexample, hav.Software (hav.com) provides a library ofC�� classes for implementing standalone or embed-ded feedforward, simple recurrent, and random-orderrecurrent neural networks. Computational softwaresuch as MATLAB also includes neural network–specific libraries.
How are neural networks implemented in prac-tice? After the analyst/developer has conducted enoughtests to ascertain that a neural network can do a goodjob for the application, the network needs to be imple-mented in the existing systems. A number of neural net-work shells can generate code, in C��, Java, or VisualBasic, that can be embedded in another system that canaccess source data or is called directly by a graphicaluser interface for deployment, independently of thedevelopment system. Or, after training an ANN in adevelopment tool, given the weights, network structure,and transfer function, one can easily develop one’s ownimplementation in a third-generation programming lan-guage such as C��. Most of the ANN developmentpackages as well as data mining tools can generate suchcode. The code can then be embedded in a standaloneapplication or in a Web server application.
TURBMW06_013234761X.QXD 3/7/07 8:07 PM Page 23
◆ W6-24 Business Intelligence: A Managerial Approach
backpropagation algorithm, two parameters, learning rate and momentum, can beadjusted to control the speed of reaching a solution.These determine the ratio of the dif-ference between the calculated value and the actual value of the training cases. Somesoftware packages may have their own parameters in their learning heuristics to speedup the learning process. It is important to read carefully when using this type of software.
Some data conversion may be necessary in the training process. This includes(1) changing the data format to meet the requirements of the software, (2) normalizingthe data scale to make the data more comparable, and (3) removing problematic data.When the training data set is ready, it is loaded into the package, and the learning pro-cedure is executed. Depending on the number of nodes and the size of the trainingdata set, reaching a solution may take from a few thousand to millions of iterations.
TESTING
Recall that in step 2 of the development process shown in Figure 6.11, the availabledata are divided into training and testing data sets. When the training has been com-pleted, it is necessary to test the network.Testing (step 8) examines the performance ofthe derived network model by measuring its ability to classify the testing data correctly.Black-box testing (i.e., comparing test results to historical results) is the primaryapproach for verifying that inputs produce the appropriate outputs. Error terms can beused to compare results against known benchmark methods.
The network is generally not expected to perform perfectly (zero error is difficult,if not impossible, to attain), and only a certain level of accuracy is really required. Forexample, if 1 means nonbankrupt and 0 means bankrupt, then any output between 0.1 and 1 might indicate a certain likelihood of nonbankrupty. The neural networkapplication is usually an alternative to another method that can be used as a bench-mark against which to compare accuracy. For example, a statistical technique such asmultiple regression or another quantitative method may be known to classify inputscorrectly 50 percent of the time.
The neural network implementation often improves on this. For example, Liang(1992) reported that ANN performance was superior to the performance of multiple dis-criminant analysis and rule induction. Ainscough and Aronson (1999) investigated theapplication of neural network models in predicting retail sales, given a set of several inputs(e.g., regular price, various promotions). They compared their results to those of multipleregression and improved the adjusted R2 (correlation coefficient) from .5 to .7. If theneural network is replacing manual operations, performance levels and speed of humanprocessing can be the standard for deciding whether the testing phase is successful.
The test plan should include routine cases as well as potentially problematic situa-tions. If the testing reveals large deviations, the training set must be reexamined, andthe training process may have to be repeated (some “bad” data may have to be omittedfrom the input set).
Note that we cannot equate neural network results exactly with those found usingstatistical methods. For example, in stepwise linear regression, input variables aresometimes determined to be insignificant, but because of the nature of neural comput-ing, a neural network uses them to attain higher levels of accuracy.When they are omit-ted from a neural network model, its performance typically suffers.
IMPLEMENTATION OF AN ANN
Implementation of an ANN (step 9) often requires interfaces with other computer-based information systems and user training. Ongoing monitoring and feedback to thedevelopers are recommended for system improvements and long-term success. It is
TURBMW06_013234761X.QXD 3/7/07 8:07 PM Page 24
CHAPTER 6 Neural Networks for Data Mining W6-25 ◆
also important to gain the confidence of users and management early in the deploy-ment to ensure that the system is accepted and used properly.
Section 6.4 Review Questions
1. List the nine steps in conducting a neural network project.
2. What are some of the design parameters for developing a neural network?
3. Describe different types of neural network software available today.
4. How are neural networks implemented in practice when the training/testing iscomplete?
5. What parameters may need to be adjusted in the neural network training process?
6.5 A SAMPLE NEURAL NETWORK PROJECT
We next describe a typical application of neural networks to predict bankruptcy ofcompanies using the same data and a similar experimental design as used by Wilsonand Sharda (1994). For comparative purposes, the performance of neural networks iscontrasted with logistic regression.
The Altman (1968) study has been used as the standard of comparison for manybankruptcy classification studies using discriminant analysis and logistic regression;follow-up studies have identified several other attributes to improve prediction perfor-mance. We use the same financial ratios as in Altman’s study, realizing that moresophisticated inputs to the neural network model should only enhance its perfor-mance. These ratios are as follows:
X1: Working capital/total assetsX2: Retained earnings/total assetsX3: Earnings before interest and taxes/total assetsX4: Market value of equity/total debtX5: Sales/total assets
Step 1 consists of collecting relevant data. The sample of firms for which theseratios was obtained from Moody’s Industrial Manuals. It consisted of firms that eitherwere in operation or went bankrupt between 1975 and 1982. The sample consists of atotal of 129 firms, 65 of which went bankrupt during the period and 64 nonbankruptfirms matched on industry and year. Data used for the bankrupt firms are from the lastfinancial statements issued before the firms declared bankruptcy. Thus, the predictionof bankruptcy is to be made about 1 year in advance.
Step 2 requires us to break the data set into a training set and a testing set. Becausethe determination of the split may affect experimental findings, a resampling proce-dure can be used to create many different pairs of training and testing sets, which alsoensures that there is no overlap in the composition of the matched training and testingsets. For example, a training set of 20 patterns can be created by randomly setting 20records from the collected set. A set of 20 other patterns/records can be created as atest set.
In addition, the results of this (and any other) study could be affected by the pro-portion of nonbankrupt firms to bankrupt firms in both the training and testing sets;that is, the population of all firms contains a certain proportion of firms on the verge ofbankruptcy.This base rate may have an impact on a prediction technique’s performance
TURBMW06_013234761X.QXD 3/7/07 8:07 PM Page 25
◆ W6-26 Business Intelligence: A Managerial Approach
in two ways. First, a technique may not work well when the firms of interest (i.e., thosethat are bankrupt) constitute a very small percentage of the population (i.e., a low baserate). This would be due to a technique’s inability to identify the features necessary forclassification. Second, there are differences in base rates between training samples andtesting samples. If a classification model is built using a training sample with a certainbase rate, does the model still work when the base rate in the test population is differ-ent? This issue is important for one more reason: If a classification model based on acertain base rate works across other proportions, it may be possible to build a modelusing a higher proportion of cases of interest than actually occur in the population.
To study the effects of this proportion on the predictive performance of the twotechniques, we create three proportions (or base rates) for the testing set compositionwhile holding the composition of the training set fixed at a 50/50 base rate. The firstfactor level (or base rate) can be a 50/50 proportion of bankrupt to nonbankrupt cases,the second level could be an 80/20 proportion (80 percent nonbankrupt, 20 percentbankrupt), and the third level could be an approximate 90/10 proportion. We do notreally know the actual proportion of firms going bankrupt; the 80/20 and 90/10 casesshould be close.
Within each of the three different testing set compositions, 20 different training–testing set pairs could be generated via Monte Carlo resampling from the original 129firms.Thus, a total of 60 distinct training and testing data set pairs were generated fromthe original data. In each case, the training set and test set pairs contained unique firms(i.e., no overlap was allowed). This restriction provides a stronger test of a technique’sperformance. To summarize, neural networks and logistic regression models are devel-oped using training sets of equal proportions of firms to determine the classificationfunction but are evaluated with test sets containing 50/50, 80/20, and 90/ 10 base rates.(The data set used here is available from this book’s Web site.)
Steps 3 through 6 relate to getting ready for a neural network experiment. We canuse any neural network software package that implements the aforementioned back-propagation training algorithm to construct and test trained neural network models.We would have to decide on the size of the neural network, including the number ofhidden layers and the number of neurons in the hidden layer. For example, one possi-ble structure to use here is 5 input neurons (1 for each financial ratio), 10 hidden neu-rons, and 2 output neurons (1 indicating a bankrupt firm and the other indicating anonbankrupt firm). (Figure 6.13 illustrates this network configuration.) Neural outputvalues range from 0 to 1. Output node BR indicates a firm to be classified as likely togo bankrupt, and the node NBR, not so.
A user of a neural network has two difficult decisions to make in the trainingprocess (step 6): At what point has the neural network appropriately learned the rela-tionships, and what is the threshold of error with regard to determining correct classifi-cations of the test set? Typically, these issues are addressed by using training tolerancesand testing tolerances that state the acceptable levels of variance for considering clas-sifications as “correct.”
Step 7 refers to the actual neural network training. In training the networks in thisexample, a heuristic backpropagation algorithm was used to ensure convergence (i.e., allfirms in the training set classified correctly). The training set is presented to the neuralnetwork software repeatedly until the software has sufficiently learned the relationshipbetween the attributes of the cases and whether the firm is distressed.Then, to accuratelyassess the prediction efficacy of the network, the holdout sample (i.e., test set) is pre-sented to the network, and the number of correct classifications are noted (step 8).
In determining correct classifications, a testing threshold of 0.49 was used. Thus,the output node with a value over 0.5 was used to assess whether the network provided
TURBMW06_013234761X.QXD 3/7/07 8:07 PM Page 26

CHAPTER 6 Neural Networks for Data Mining W6-27 ◆
a correct classification. Cases in which both output neurons provided output levelseither less than 0.5 or greater than 0.5 were automatically treated as misclassifications.
To compare the performance of the neural network against using classical statisticaltechniques, a logistic regression approach was implemented via SYSTAT, a statisticalsoftware package. Table 6.2 represents the average percentage of correct classificationsprovided by the two different techniques when evaluated by the 20 holdout samples foreach of the three different test set base rates. When the testing sets contained an equalnumber of the two cases, neural networks correctly classified 97.5 percent of the holdout cases, whereas logistic regression was correct 93.25 percent of the time.Similarly, when the testing sets contained 20,070 bankrupt firms, neural networks classi-fied at a 95.6 percent correct rate, whereas logistic regression correctly classified at a92.2 percent rate.
A nonparametric test, the Wilcoxon test for paired observations, was undertakento assess whether the correct classification percentages for the two techniques weresignificantly different. Those instances where statistically significant differences werefound are indicated in Table 6.2 by footnotes. In general, neural networks performedsignificantly better than logistic regression.
Table 6.2 also illustrates the correct percentages of bankrupt firm predictions andnonbankrupt firm predictions. In the prediction of bankrupt cases, neural networkspredicted significantly better than logistic regression for test sets of equal proportion,
FIGURE 6.13 A Typical Neural Network Model for Bankruptcy Prediction
TURBMW06_013234761X.QXD 3/7/07 8:07 PM Page 27
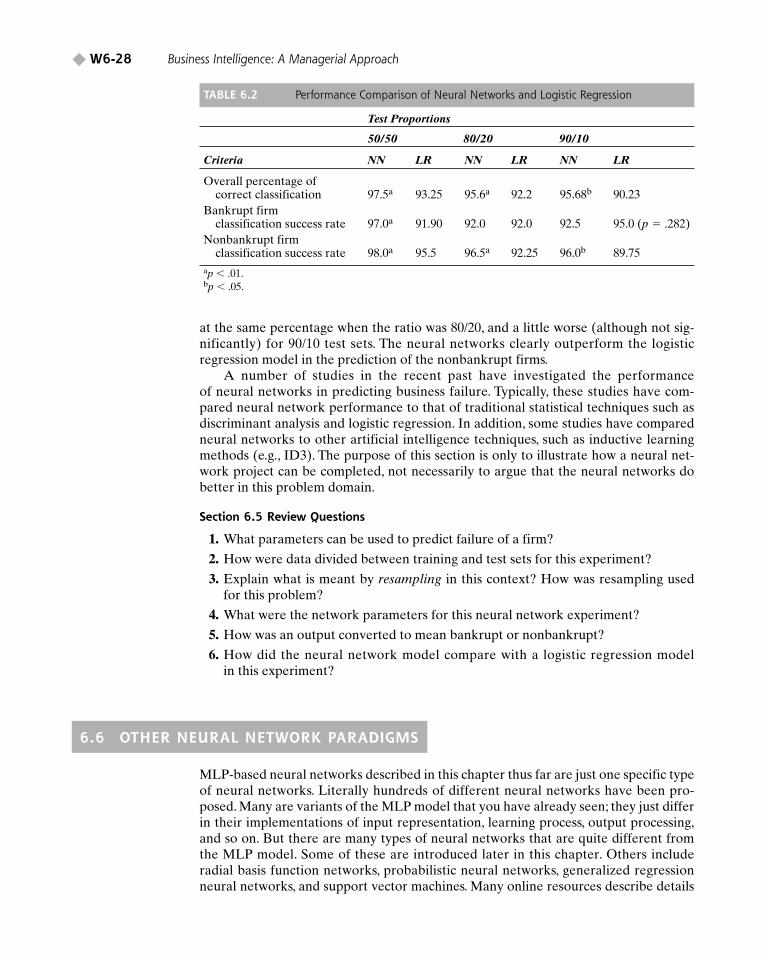
◆ W6-28 Business Intelligence: A Managerial Approach
at the same percentage when the ratio was 80/20, and a little worse (although not sig-nificantly) for 90/10 test sets. The neural networks clearly outperform the logisticregression model in the prediction of the nonbankrupt firms.
A number of studies in the recent past have investigated the performance of neural networks in predicting business failure. Typically, these studies have com-pared neural network performance to that of traditional statistical techniques such asdiscriminant analysis and logistic regression. In addition, some studies have comparedneural networks to other artificial intelligence techniques, such as inductive learningmethods (e.g., ID3). The purpose of this section is only to illustrate how a neural net-work project can be completed, not necessarily to argue that the neural networks dobetter in this problem domain.
Section 6.5 Review Questions
1. What parameters can be used to predict failure of a firm?
2. How were data divided between training and test sets for this experiment?
3. Explain what is meant by resampling in this context? How was resampling used for this problem?
4. What were the network parameters for this neural network experiment?
5. How was an output converted to mean bankrupt or nonbankrupt?
6. How did the neural network model compare with a logistic regression model in this experiment?
TABLE 6.2 Performance Comparison of Neural Networks and Logistic Regression
Test Proportions
50/50 80/20 90/10
Criteria NN LR NN LR NN LR
Overall percentage of correct classification 97.5a 93.25 95.6a 92.2 95.68b 90.23
Bankrupt firm classification success rate 97.0a 91.90 92.0 92.0 92.5 95.0 (p � .282)
Nonbankrupt firm classification success rate 98.0a 95.5 96.5a 92.25 96.0b 89.75
ap � .01.bp � .05.
6.6 OTHER NEURAL NETWORK PARADIGMS
MLP-based neural networks described in this chapter thus far are just one specific typeof neural networks. Literally hundreds of different neural networks have been pro-posed. Many are variants of the MLP model that you have already seen; they just differin their implementations of input representation, learning process, output processing,and so on. But there are many types of neural networks that are quite different fromthe MLP model. Some of these are introduced later in this chapter. Others includeradial basis function networks, probabilistic neural networks, generalized regressionneural networks, and support vector machines. Many online resources describe details
TURBMW06_013234761X.QXD 3/7/07 8:07 PM Page 28
CHAPTER 6 Neural Networks for Data Mining W6-29 ◆
of these types of neural networks. A good resource introduced in Chapter 4 is thee-book StatSoft (statsoft.com/textbook/stathome.html). The next subsection introducessome of the classic varieties of neural networks.
HOPFIELD NETWORKS
A neural network model of interest is the Hopfield network (Hopfield, 1982). JohnHopfield showed in a series of papers in the 1980s how highly interconnected networksor nonlinear neurons can be extremely effective in computing. These networks pro-vided a rapid computed solution for problems stated in terms of desired optima, oftensubject to constraints.
A general Hopfield network is a single large layer of neurons with total interconnectivity—that is, each neuron is connected to every other neuron. In addition,the output of each neuron may depend on its previous values. One use of Hopfieldnetworks has been in solving constrained optimization problems, such as the classictraveling salesman problem (TSP). In this type of application, each neuron representsthe desirability of a city n being visited in position m of a TSP tour. Interconnectionweights are specified, representing the constraints of feasible solution to the TSP (e.g., forcing a city to appear in a tour only once). An energy function is specified,which represents the objective of the model solution process (e.g., minimize totaldistance in the TSP tour) and is used in determining when to stop the neural networkevolution to a final state. The network starts with random neuron values and, using thestated interconnection weights, the neuron values are updated over time. Gradually,the neuron values stabilize, evolving into a final state (as driven by the global energyfunction) that represents a solution to the problem. At this point in the network evolu-tion, the value of neuron (n,m) represents whether city n should be in location m of theTSP tour. While Hopfield and Tank (1985) and others claimed great success in solvingthe TSP, further research has shown those claims to be somewhat premature.Nonetheless, this novel approach to a classic problem offers promise for optimizationproblems, especially when technology allows for taking advantage of the inherent par-allelism of neural networks.
Hopfield networks are distinct from feedforward networks because the neuronsare highly interconnected, weights between neurons tend to be fixed, and there is notraining per se. The complexity and challenge in using a Hopfield network for opti-mization problems is in the correct specification of the interconnection weights and theidentification of the proper global energy function to drive the network evolutionprocess.
SELF-ORGANIZING NETWORKS
Kohonen’s network, also known as a self-organizing network is another neural net-work model. Such networks learn in an unsupervised mode. The biological basis ofthese models is the conjecture that some organization takes place in the human brainwhen an external stimulus is provided. Kohonen’s algorithm forms “feature maps,”where neighborhoods of neurons are constructed. These neighborhoods are organizedsuch that topologically close neurons are sensitive to similar inputs into the model.Self-organizing maps, or self-organizing feature maps, can sometimes be used todevelop some early insight into the data. For example, self-organizing maps could learnto identify clusters of data so that an analyst could build more refined models for eachsubset/cluster. In cases in which the analyst does not have a good idea of the number ofclasses or output or actual output class for any given pattern, the self-organizing mapscan work well.
TURBMW06_013234761X.QXD 3/7/07 8:07 PM Page 29
◆ W6-30 Business Intelligence: A Managerial Approach
Section 6.6 Review Questions
1. List some of the different types of neural networks.
2. What is one key difference between an MLP network and a Kohonen network?
3. What is another name for a Kohonen network?
4. Briefly describe a Hopfield network.
6.7 APPLICATIONS OF ANN
ANN have been applied in many domains.A survey of their applications in finance canbe found in Fadlalla and Lin (2001). There have been several tests of neural networksin financial markets. Collard (1990) stated that his neural network model for commod-ity training would have resulted in significant profits over other trading strategies.Kamijo and Tanigawa (1990) used a neural network to chart Tokyo Stock Exchangedata. They found that the results of the model would beat a “buy and hold” strategy.Finally, a neural model for predicting percentage change in the S&P 500 five daysahead, using a variety of economic indicators, was developed (Fishman et al., 1991).The authors claim that the model has provided more accurate prediction than allegedexperts in the field using the same indicators.
Neural networks have been successfully trained to determine whether loan appli-cations should be approved (Gallant, 1988). It has also been shown that neural net-works can predict mortgage applicant solvency better than mortgage writers (Collinset al., 1988). Predicting rating of corporate bonds and attempting to predict their prof-itability is another area where neural networks have been successfully applied (seeDutta and Shakhar, 1988; and Surkan and Singleton, 1990). Neural networks outper-formed regression analysis and other mathematical modeling tools in predicting bondrating and profitability. The main conclusion reached was that neural networks pro-vided a more general framework for connecting financial information of a firm to therespective bond rating.
Fraud prevention is another area of neural network application in business. ChaseManhattan Bank successfully used neural networks in dealing with credit card fraud(Rochester, 1990), with the neural network models outperforming traditional regres-sion approaches. Also, neural networks have been used in the validation of bank sig-natures (see Francett, 1989; and Mighell, 1989). These networks identified forgeriessignificantly better than any human expert.
Another significant area of statistical application of neural networks is in time-series forecasting. Several studies have attempted to use neural networks for time-seriesprediction. Examples include Fozzard et al. (1989), Tang et al. (1991), and Hill et al.(1994). The general conclusion is that neural networks appear to do at least as well asthe Box-Jenkins forecasting technique.
Because neural networks have been a subject of intense study since late 1980s,there have been many applications of as well as experiments with applications.You cando simple Web searches to find recent examples in addition to the ones listed in thischapter. Other recent reports include live intrusion tracking (see Thaler, 2002), Webcontent filtering (Lee et al., 2002), exchange rate prediction (Davis et al., 2001), andhospital bed allocation (Walczak et al., 2002). Newer applications are emerging inhealth care and medicine. See Application Case 6.5, for example.
TURBMW06_013234761X.QXD 3/7/07 8:07 PM Page 30
CHAPTER 6 Neural Networks for Data Mining W6-31 ◆
Application Case 6.5
Neural Networks for Breast Cancer Diagnosis
ANN have proven to be a useful tool in pattern recogni-tion and classification tasks in diverse areas, including clin-ical medicine. Despite the wide applicability of ANN, thelarge amount of data required for training makes usingthem an unsuitable classification technique when the avail-able data are scarce. Magnetic resonance spectroscopy(MRS) plays a pivotal role in the investigation of cell bio-chemistry and provides a reliable method for detection ofmetabolic changes in breast tissue.The scarcity of data andthe complexity of interpretation of relevant physiologicalinformation impose extra demands that prohibit theapplicability of most statistical and machine learning tech-niques developed. Knowledge-based artificial neural net-works (KBANN) help to prevail over such difficulties andcomplexities. A KBANN combines knowledge from adomain, in the form of simple rules, with connectionistlearning. This combination trains the network through theuse of small sets of data (as is typical of medical diagnosistasks). The primary structure is based on the dependenciesof a set of known domain rules, and it is necessary to refinethose rules through training.
The KBANN process consists of two algorithms.One is the Rules-to-Network algorithm, in which the maintask is the translation process between a knowledge basecontaining information about a domain theory and the ini-tial structure of a neural network.This algorithm maps thestructure of an approximately correct domain theory, with
all the rules and their dependencies, into a neural networkstructure. The defined network is then trained using thebackpropagation learning algorithm.
Feedback mechanisms, which inhibit or stimulate thegrowth of normal cells, control the division and replace-ment of cells in normal tissues. In the case of tumors, thatprocess is incapable of controlling the production of newcells, and the division is done without any regard to theneed for replacement, disturbing the structure of normaltissue. Changes observed in phospholipid metabolite con-centrations, which are associated with differences in cellproliferation in malignant tissues, have served as the basicinputs for the identification of relevant features present inmalignant or cancerous tissues but not in normal tissues.The abnormal levels of certain phospholipid characteris-tics are considered indicators of tumors. These include several parameters, such as PDE, PME, Pi, PCr, γATP,αATP, and βATP. KBANN produced an accurate tumorclassification of 87 percent from a set of 26, with an averagepattern error of 0.0500 and a standard deviation of 0.0179.
Sources: M. Sordo, H. Buxton, and D. Watson, “A HybridApproach to Breast Cancer Diagnosis,” in PracticalApplications of Computational Intelligence Techniques, Vol.16, in L. Jain and P. DeWilde (eds.), Kluwer, Norwell, MA,2001, acl.icnet.uk/PUBLICATIONS/sordo/chapter2001.pdf(accessed March 2006).
In general, ANN are suitable for problems whose inputs are both categorical andnumeric, and where the relationships between inputs and outputs are not linear or theinput data are not normally distributed. In such cases, classical statistical methods maynot be reliable enough. Because ANN do not make any assumptions about the datadistribution, their power is less affected than traditional statistical methods when dataare not properly distributed. Finally, there are cases in which the neural networks sim-ply provide one more way of building a predictive model for the situation at hand.Given the ease of experimentation using the available software tools, it is certainlyworth exploring the power of neural networks in any data modeling situation.
Section 6.7 Review Questions
1. List some applications of neural networks in accounting/finance.
2. What are some engineering applications of neural networks?
3. How have neural networks been used in the health care field?
4. What are some applications of neural networks in information security?
5. Conduct a Web search to identify homeland security applications of neural networks.
TURBMW06_013234761X.QXD 3/7/07 8:07 PM Page 31
◆ W6-32 Business Intelligence: A Managerial Approach
6.8 A NEURAL NETWORK SOFTWARE DEMONSTRATION
Online Tutorial T4 provides a software demonstration of using neural networks. Thatsection is used, with permission, from STATISTICA Software Tutorial. Students andprofessors using this book are eligible to receive a six-month license to use STATIS-TICA software for completion of the exercises in Chapters 4 and 6. Request for thiscopy of the software is to be made by the instructor by completing the coupon avail-able on the Companion Website www.prenhall.com/turban. Note that similar softwareprojects can also be completed by using tools identified in Technology Insights 6.4.
Chapter Highlights
• Neural computing involves a set of methods thatemulate the way the human brain works. The basicprocessing unit is a neuron. Multiple neurons aregrouped into layers and linked together.
• In a neural network, the knowledge is stored in theweight associated with each connection between twoneurons.
• Backpropagation is the most popular paradigm inbusiness applications of neural networks. Most busi-ness applications are handled using this algorithm.
• A backpropagation-based neural network consists ofan input layer, an output layer, and a certain numberof hidden layers (usually one). The nodes in one layerare fully connected to the nodes in the next layer.Learning is done through a trial-and-error process ofadjusting the connection weights.
• Each node at the input layer typically represents asingle attribute that may affect the prediction.
• Neural network learning can occur in supervised orunsupervised mode.
• In supervised learning mode, the training patternsinclude a correct answer/classification/forecast.
• In unsupervised learning mode, there are no knownanswers. Thus, unsupervised learning is used for clus-tering or exploratory data analysis.
• The usual process of learning in a neural networkinvolves three steps: (1) compute temporary outputsbased on inputs and random weights, (2) compute out-puts with desired targets, and (3) adjust the weightsand repeat the process.
• The delta rule is commonly used to adjust theweights. It includes a learning rate and a momentumparameter.
• Developing neural network–based systems requires astep-by-step process. It includes data preparation andpreprocessing, training and testing, and conversion ofthe trained model into a production system.
• Neural network software is available to allow easyexperimentation with many models. Neural networkmodules are included in all major data mining soft-ware tools. Specific neural network packages are alsoavailable. Some neural network tools are available asspreadsheet add-ins.
• After a trained network has been created, it is usuallyimplemented in end-user systems through program-ming languages such as C++, Java, and Visual Basic.Most neural network tools can generate codes for thetrained network in these languages.
• Many neural network models beyond backpropaga-tion exist, including radial basis functions, supportvector machines, Hopfield networks, and Kohonen’sself-organizing maps.
• Neural network applications abound in almost allbusiness disciplines as well as in virtually all otherfunctional areas.
• Business applications of neural networks includedfinance, firm failure prediction, time series forecast-ing, and so on.
• New applications of neural networks are emerging inhealth care, security, and so on.
Key Terms• adaptive resonance theory (ART)• artificial neural network (ANN)• axon• backpropagation
• black-box testing• connection weight• dendrite• hidden layer
• Kohonen self-organizing feature map
• learning algorithm• learning rate
TURBMW06_013234761X.QXD 3/7/07 8:07 PM Page 32

CHAPTER 6 Neural Networks for Data Mining W6-33 ◆
• momentum• neural computing• neural network• neuron• nucleus• parallel processing
• pattern recognition• perceptron• processing element (PE)• self-organizing• sigmoid (logical activation) function• summation function
• supervised learning• synapse• threshold value• topology• transformation (transfer) function• unsupervised learning
QUESTIONS FOR DISCUSSION
1. Compare artificial and biological neural networks.What aspects of biological networks are not mimic-ked by artificial ones? What aspects are similar?
2. The performance of ANN relies heavily on the sum-mation and transformation functions. Explain thecombined effects of the summation and transforma-tion functions and how they differ from statisticalregression analysis.
3. ANN can be used for both supervised and unsuper-vised learning. Explain how they learn in a supervisedmode and in an unsupervised mode.
4. Explain the difference between a training set and atesting set. Why do we need to differentiate them?Can the same set be used for both purposes? Why orwhy not?
5. Say that a neural network has been constructed to pre-dict the creditworthiness of applicants. There are twooutput nodes: one for yes (1 � yes, 0 � no) and one forno (1 � no, 0 � yes). An applicant receives a score of0.83 for the “yes” output node and a 0.44 for the “no”output node. Discuss what may have happened andwhether the applicant is a good credit risk.
6. Everyone would like to make a great deal of moneyon the stock market. Only a few are very successful.Why is using an ANN a promising approach? Whatcan it do that other decision support technologiescannot do? How could it fail?
Exercises
Teradata University and Other Hands-onExercises
1. Go to Teradata Student Network Web site (atteradatastudentnetwork.com) or the URL given byyour instructor. Locate Web seminars related todata mining and neural networks. Specifically, viewthe seminar given by Professor Hugh Watson atthe SPIRIT2005 conference at Oklahoma StateUniversity. Then answer the following questions:
a. Which real-time application at Continental Airlinesmay have used a neural network?
b. What inputs and outputs can be used in building aneural network application?
c. Given that Continental’s data mining applicationsare real-time, how might Continental implement aneural network in practice?
d. What other neural network applications wouldyou propose for the airline industry?
2. Go to Teradata Student Network Web site (atteradatastudentnetwork.com) or the URL given by
your instructor. Locate the Harrah’s case. Read thecase and answer the following questions:
a. Which of the Harrah’s data applications are mostlikely implemented using neural networks?
b. What other applications could Harrah’s developusing the data it is collecting from its customers?
c. What are some concerns you might have as a cus-tomer at this casino?
3. This exercise relates to the sample project in thischapter. Bankruptcy prediction problem can beviewed as a problem of classification. The data setyou will be using for this problem includes fiveratios that have been computed from the financialstatements of real-world firms. These five ratioshave been used in studies involving bankruptcy pre-diction. The first sample includes data on firms thatwent bankrupt and firms that didn’t. This will beyour training sample for the neural network. Thesecond sample of 10 firms also consists of somebankrupt firms and some nonbankrupt firms. Yourgoal is to train a neural network, using the first20 data, and then test its performance on the other
TURBMW06_013234761X.QXD 3/7/07 8:07 PM Page 33
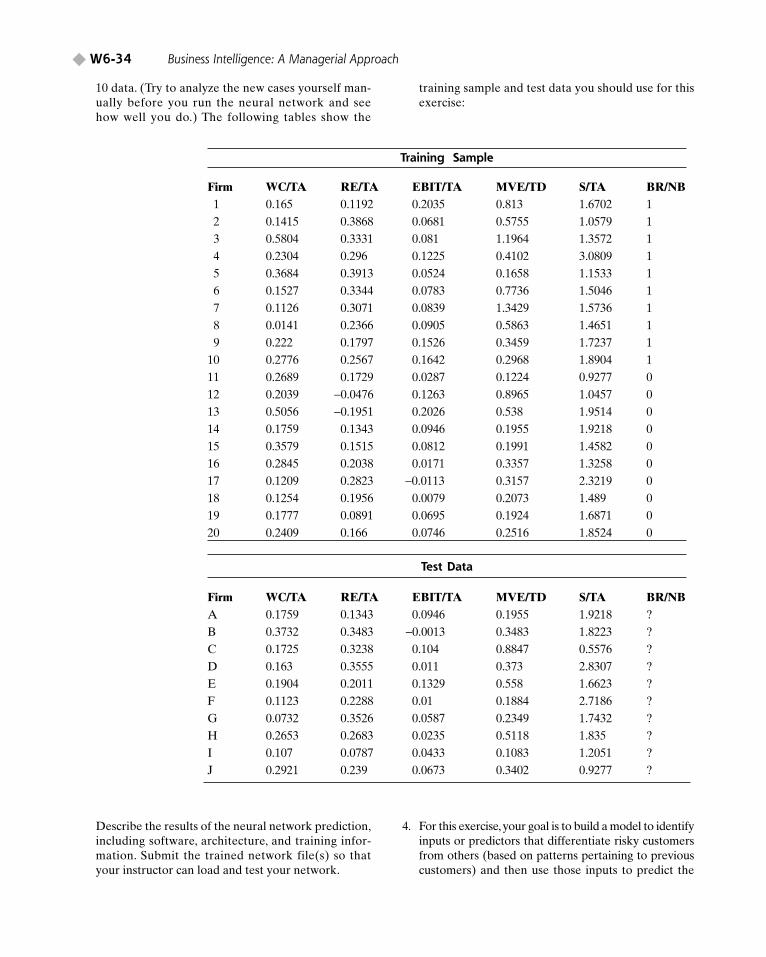
◆ W6-34 Business Intelligence: A Managerial Approach
10 data. (Try to analyze the new cases yourself man-ually before you run the neural network and seehow well you do.) The following tables show the
Training Sample
Firm WC/TA RE/TA EBIT/TA MVE/TD S/TA BR/NB1 0.165 0.1192 0.2035 0.813 1.6702 12 0.1415 0.3868 0.0681 0.5755 1.0579 13 0.5804 0.3331 0.081 1.1964 1.3572 14 0.2304 0.296 0.1225 0.4102 3.0809 15 0.3684 0.3913 0.0524 0.1658 1.1533 16 0.1527 0.3344 0.0783 0.7736 1.5046 17 0.1126 0.3071 0.0839 1.3429 1.5736 18 0.0141 0.2366 0.0905 0.5863 1.4651 19 0.222 0.1797 0.1526 0.3459 1.7237 1
10 0.2776 0.2567 0.1642 0.2968 1.8904 111 0.2689 0.1729 0.0287 0.1224 0.9277 012 0.2039 −0.0476 0.1263 0.8965 1.0457 013 0.5056 −0.1951 0.2026 0.538 1.9514 014 0.1759 0.1343 0.0946 0.1955 1.9218 015 0.3579 0.1515 0.0812 0.1991 1.4582 016 0.2845 0.2038 0.0171 0.3357 1.3258 017 0.1209 0.2823 −0.0113 0.3157 2.3219 018 0.1254 0.1956 0.0079 0.2073 1.489 019 0.1777 0.0891 0.0695 0.1924 1.6871 020 0.2409 0.166 0.0746 0.2516 1.8524 0
Test Data
Firm WC/TA RE/TA EBIT/TA MVE/TD S/TA BR/NBA 0.1759 0.1343 0.0946 0.1955 1.9218 ?B 0.3732 0.3483 −0.0013 0.3483 1.8223 ?C 0.1725 0.3238 0.104 0.8847 0.5576 ?D 0.163 0.3555 0.011 0.373 2.8307 ?E 0.1904 0.2011 0.1329 0.558 1.6623 ?F 0.1123 0.2288 0.01 0.1884 2.7186 ?G 0.0732 0.3526 0.0587 0.2349 1.7432 ?H 0.2653 0.2683 0.0235 0.5118 1.835 ?I 0.107 0.0787 0.0433 0.1083 1.2051 ?J 0.2921 0.239 0.0673 0.3402 0.9277 ?
training sample and test data you should use for thisexercise:
Describe the results of the neural network prediction,including software, architecture, and training infor-mation. Submit the trained network file(s) so thatyour instructor can load and test your network.
4. For this exercise,your goal is to build a model to identifyinputs or predictors that differentiate risky customersfrom others (based on patterns pertaining to previouscustomers) and then use those inputs to predict the
TURBMW06_013234761X.QXD 3/7/07 8:07 PM Page 34

CHAPTER 6 Neural Networks for Data Mining W6-35 ◆
new risky customers. This sample case is typical for thisdomain.
The sample data to be used in this exercise is posted onwww.prenhall.com/turban, file name: CreditRisk.xls.The data set has 425 cases and 15 variables pertainingto past and current customers who borrowed from abank for various reasons. The data set contains variousinformation related to the customers, financial stand-ing, reason to loan, employment, demographic informa-tion, and so on, and finally the outcome or dependentvariable for credit standing, classifying each case asgood or bad, based on the institution’s past experience.
You should take 400 of the cases as training cases anduse the other 25 for testing. Then build a neuralnetwork model to learn the characteristics of theproblem and test its performance on the other 25cases. Report on your model’s learning and testingperformance. Prepare a report that identifies theneural network architecture, training parameters, andresulting performance on the test set.
(This exercise is courtesy of StatSoft, Inc., based ona German data set from ftp://ftp.ics.uci.edu/pub/machine-learning-databases/statlog/german renamedCreditRisk and altered.)
5. Forecasting box-office receipts for a particularmotion picture is an interesting challenge. Despitethe difficulty associated with the unpredictablenature of the problem domain, several researchershave tried to predict the total box-office receipt ofmotion pictures after a movie’s initial theatricalrelease. In this problem, you explore forecasting thefinancial performance of a movie at the box officebefore its theatrical release by converting the forecast-ing problem into a classification problem. That is,rather than forecasting the point estimate of box-officereceipts, you classify a movie based on its box-officereceipts in one of nine categories, ranging from flopto blockbuster, taking into account a number of fac-tors decided by feedback received from the industryexperts and previous studies. The following is the listof the variables:
Attributes Values- range Type
MPAA 5 possible rating categories: Binary rating G, PG, PG-13, R, NR (0,1)
Competition 3 pseudo-variables: high, Binary medium, low competition (0,1)
Star value 3 variables of degree of Binary star value: A+/A (high), (0,1)B (medium),C (insignificant)
Content 10 categories: sci-fi, historic Binary category epic drama, modern drama, (0,1)(genre) politically related, thriller,
horror, comedy, cartoon,action, documentary
Technical 3 binary independent Binary effects variables: high, (0,1)
medium, low technical effects ratings
Sequel 1 variable to specify Binary whether a movie is a (0,1)sequel
Number of Continuous variable Positive screens integer
Each categorical-independent variable (except thegenre variable) is converted into a 1-of-N binary rep-resentation. For example, the 5 MPAA ratings arerepresented as five 0–1 variables. In the process ofvalue assignment, all such pseudo-representations ofa categorical variable are given the value of 0, exceptthe one that holds true for the current case, which isgiven the value of 1. For a movie of rating PG, the sec-ond input variable is at level 1, the others (1 and 3–5)are at level 0.
The variable of interest here is box-office gross rev-enues. A movie based on its box-office receipts isclassified in one of nine categories, ranging from aflop to a blockbuster. The dependent variable can beconverted into nine classes, using the followingbreakpoints:
Class Number Range (in millions)1 �1 (flop)2 �1 and �103 �10 and �204 �20 and �405 �40 and �656 �65 and �1007 �100 and �1508 �150 and �2009 �200 (blockbuster)
Download the training set data from www.prenhall.com/turban, file name: movietrain.xls, which has 184 recordsand is in Microsoft Excel format. Use the data descriptionhere to understand the domain and the problem you are try-ing to solve. Pick and choose your independent variables;develop at least three classification models (e.g., decisiontree, logistic regression, neural networks). Compare theaccuracy results (using 10-fold cross validation and percent-age split techniques), use confusion matrices, and commenton the outcome. Test the models developed on the test set
TURBMW06_013234761X.QXD 3/7/07 8:07 PM Page 35
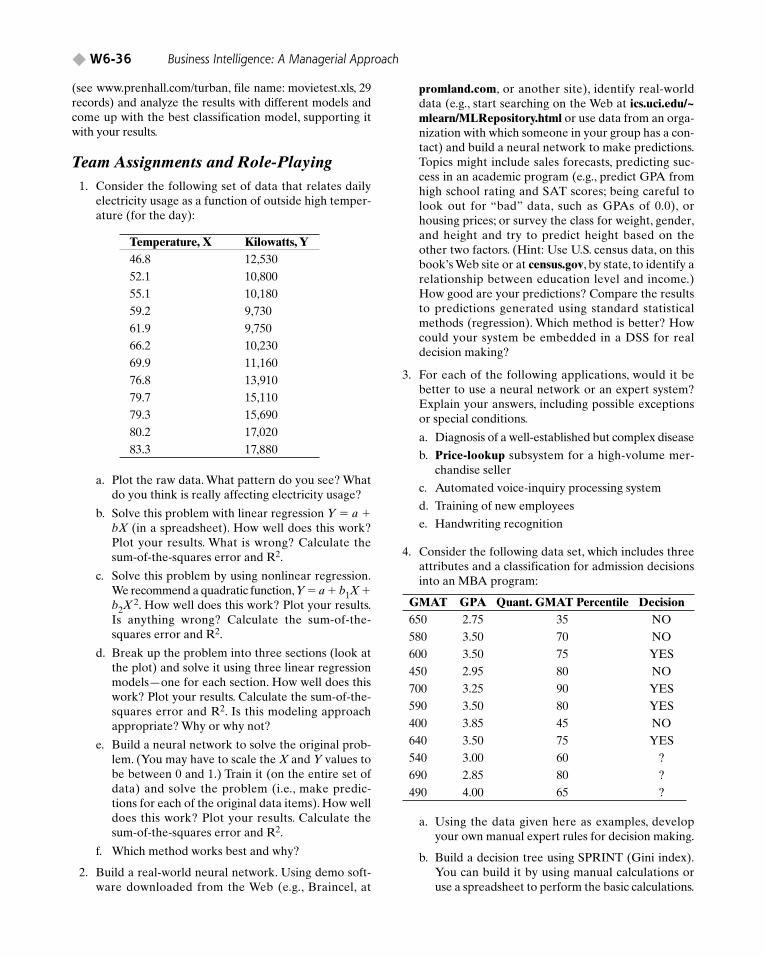
◆ W6-36 Business Intelligence: A Managerial Approach
Team Assignments and Role-Playing1. Consider the following set of data that relates daily
electricity usage as a function of outside high temper-ature (for the day):
Temperature, X Kilowatts, Y46.8 12,53052.1 10,80055.1 10,18059.2 9,73061.9 9,75066.2 10,23069.9 11,16076.8 13,91079.7 15,11079.3 15,69080.2 17,02083.3 17,880
a. Plot the raw data. What pattern do you see? Whatdo you think is really affecting electricity usage?
b. Solve this problem with linear regression Y � a �bX (in a spreadsheet). How well does this work?Plot your results. What is wrong? Calculate thesum-of-the-squares error and R2.
c. Solve this problem by using nonlinear regression.We recommend a quadratic function,Y � a � b1X �b2X 2. How well does this work? Plot your results.Is anything wrong? Calculate the sum-of-the-squares error and R2.
d. Break up the problem into three sections (look atthe plot) and solve it using three linear regressionmodels—one for each section. How well does thiswork? Plot your results. Calculate the sum-of-the-squares error and R2. Is this modeling approachappropriate? Why or why not?
e. Build a neural network to solve the original prob-lem. (You may have to scale the X and Y values tobe between 0 and 1.) Train it (on the entire set ofdata) and solve the problem (i.e., make predic-tions for each of the original data items). How welldoes this work? Plot your results. Calculate thesum-of-the-squares error and R2.
f. Which method works best and why?
2. Build a real-world neural network. Using demo soft-ware downloaded from the Web (e.g., Braincel, at
promland.com, or another site), identify real-worlddata (e.g., start searching on the Web at ics.uci.edu/~mlearn/MLRepository.html or use data from an orga-nization with which someone in your group has a con-tact) and build a neural network to make predictions.Topics might include sales forecasts, predicting suc-cess in an academic program (e.g., predict GPA fromhigh school rating and SAT scores; being careful tolook out for “bad” data, such as GPAs of 0.0), orhousing prices; or survey the class for weight, gender,and height and try to predict height based on theother two factors. (Hint: Use U.S. census data, on thisbook’s Web site or at census.gov, by state, to identify arelationship between education level and income.)How good are your predictions? Compare the resultsto predictions generated using standard statisticalmethods (regression). Which method is better? Howcould your system be embedded in a DSS for realdecision making?
3. For each of the following applications, would it bebetter to use a neural network or an expert system?Explain your answers, including possible exceptionsor special conditions.
a. Diagnosis of a well-established but complex disease
b. Price-lookup subsystem for a high-volume mer-chandise seller
c. Automated voice-inquiry processing system
d. Training of new employees
e. Handwriting recognition
4. Consider the following data set, which includes threeattributes and a classification for admission decisionsinto an MBA program:
GMAT GPA Quant. GMAT Percentile Decision650 2.75 35 NO580 3.50 70 NO600 3.50 75 YES450 2.95 80 NO700 3.25 90 YES590 3.50 80 YES400 3.85 45 NO640 3.50 75 YES540 3.00 60 ?690 2.85 80 ?490 4.00 65 ?
a. Using the data given here as examples, developyour own manual expert rules for decision making.
b. Build a decision tree using SPRINT (Gini index).You can build it by using manual calculations oruse a spreadsheet to perform the basic calculations.
(see www.prenhall.com/turban, file name: movietest.xls, 29records) and analyze the results with different models andcome up with the best classification model, supporting itwith your results.
TURBMW06_013234761X.QXD 3/7/07 8:07 PM Page 36

CHAPTER 6 Neural Networks for Data Mining W6-37 ◆
c. Build another decision tree, using the entropy andinformation gain (ID3) approach. You can use aspreadsheet calculator for this exercise.
d. Although the data set here is extremely small, tryto build a little neural network for it.
e. Use automated decision tree software (e.g., See5;download a trial version from rulequest.com) tobuild a tree for these data.
f. Report the predictions on the last three observa-tions from each of the five classification approaches.
g. Comment on the similarity and differences of theapproaches.What did you learn from this exercise?
5. You have worked on neural networks and other datamining techniques. Give examples of where each ofthese has been used. Based on your knowledge, howwould you differentiate among these techniques?Assume that a few years from now, you come across asituation in which neural network or other data min-ing techniques could be used to build an interestingapplication for your organization. You have an internworking with you to do the grunt work. How will youdecide whether the application is appropriate for aneural network or for another data mining model?Based on your homework assignments, what specificsoftware guidance can you provide to get your internto be productive for you quickly? Your answer forthis question might mention the specific software,describe how to go about setting up the model/neuralnetwork, and validate the application.
Internet Exercises1. Explore the Web sites of several neural network ven-
dors, such as California Scientific Software (calsci.com), NeuralWare (neuralware.com), and WardSystems Group (wardsystems.com), and review someof their products. Download at least two demos andinstall, run, and compare them.
2. There is a very good repository of data that has beenused to test the performance of neural network andother machine learning algorithms. This repositorycan be accessed at ics.uci.edu/~mlearn/MLRepository.html. Some of the data sets are really meant to testthe limits of current machine learning algorithms andcompare their performance against new approachesto learning. However, some of the smaller data
sets can be useful for exploring the functionality ofthe software you might download in InternetExercise 1 or the software that is available ascompanion software with this book, such as STATISTICA Data Miner. Download at least onedata set from the UCI repository (e.g., CreditScreening Databases, Housing Database).Then applyneural networks as well as decision tree methods, asappropriate. Prepare a report on your results. (Someof these exercises could also be completed in a groupor may even be proposed as semester-long projectsfor term papers and so on.)
3. Go to calsci.com and read about various businessapplications. Prepare a report that summarizes theapplications.
4. Go to nd.com. Read about the company’s applica-tions in investment and trading. Prepare a reportabout them.
5. Go to nd.com. Download the trial version ofNeurosolutions for Excel and experiment with it,using one of the data sets from the exercises in thischapter. Prepare a report about your experience withthe tool.
6. Go to neoxi.com. Identify at least two software toolsthat have not been mentioned in this chapter. VisitWeb sites of those tools and prepare a brief report onthe capabilities of those tools.
7. Go to neuroshell.com. Look at Gee Whiz examples.Comment on the feasibility of achieving the resultsclaimed by the developers of this neural networkmodel.
8. Go to easynn.com. Download the trial version of thesoftware. After the installation of the software, findthe sample file called Houseprices.tvq. Retrain theneural network and test the model by supplying somedata. Prepare a report about your experience withthis software.
9. Visit statsoft.com. Go to Downloads and downloadat least three white papers of applications. Whichof these applications may have used neuralnetworks?
10. Go to neuralware.com. Prepare a report about theproducts the company offers.
TURBMW06_013234761X.QXD 3/7/07 8:07 PM Page 37

◆ W6-38 Business Intelligence: A Managerial Approach
End of Chapter Case
Sovereign Credit Ratings Using Neural Networks
Companies such as Standard & Poor’s Corporation,Moody’s Investors Service, and Fitch Ratings providealphabetical indicators of credit risk. Over a long period oftime, these ratings have been in use to assess companiesand financial institutions. However, issuing sovereign rat-ings is relatively new but has seen rapid expansion inrecent years.The number of rated sovereigns grew from 17in 1989 to 63 in 1998. Sovereign credit ratings are receivinga lot of global importance, as both a measure of credit riskfor a country and of the firms that operate within the coun-try. The Bank for International Settlements (bis.org) hasbeen at the forefront in using credit ratings prominently indetermining capital adequacy.
Multiple factors are used in performing credit riskanalysis for sovereign country ratings. These include finan-cial ratios; the economic, political, and regulatory environ-ment; and industry trends. In the context of quantitativemodels, using financial, economic, and business data toarrive at a credit rating is a challenging process due to thecomplex and nonlinear interactions between differentvariables. However, this risk assessment process lacks awell-defined theory, which makes it difficult to apply con-ventional mathematical or rule-based techniques, althoughthere are numerous quantitative approaches.
ANN are suited for modeling the determinants ofratings because they do not require prior specification oftheoretical models. Their particular strength in classifyingoutcomes lends itself to producing a calibrated ratingscale. ANN provide an alternative to the econometricapproaches in that there are no assumptions with respectto the underlying properties and relationships within thedata. ANN score above all other models in deriving mean-ing from complicated or imprecise data. A successful ANNimplementation will generate a system of relationshipsthat has been learned from observing past examples, and itcan generalize and apply these lessons to new examples.
Bennell et al. (2006) compared ANN implementationsto the standard credit risk analysis approach of probit. Thesample set included 1,383 annual (end-of-calendar-year)observations of long-term foreign-currency sovereigncredit ratings, assigned by 11 international credit ratingagencies to 70 sovereign borrowers during the period from1989 to 1999.The input variables were chosen to be consis-tent with the factors stressed in both the theoretical andempirical literature as determining the capacity and will-ingness of sovereign borrowers to service external debt.Some of the economic indicators that were chosen asexplanatory variables are as follows:
Input Variable Description
External debt/export Total external debt relative to exports for the previous year
Fiscal balance Average annual central government deficit (�) or surplus (�) relative to GDP for the previous three years (percentage)
External balance Average annual current account balance relative to GDP for the previous three years (percentage)
Rate of inflation Average annual consumer price inflation rate for the previous three years (percentage)
GDP per capita GDP for the previous year (U.S. dollars)
GDP growth Average annual real GDP growth on a year-over-year basis for the previous four years (percentage)
Development International Monetary Fund indicator country classification for the
current year (1 � industrial,0 � not industrial)
Source: Adapted from J. Bennell, D. Crabbe, S. Thomas, andO. Gwilym, “Modelling Sovereign Credit Ratings: NeuralNetworks Versus Ordered Probit,” Expert Systems withApplications, April 2006, pp. 415–425.
In addition to the macroeconomic variables specifiedhere, two sets of indicator variables were included to cap-ture effects on sovereign ratings in a given year: sovereignrating assigned by other rating agencies and the sover-eign’s location in a specific geographic region.
The data were split into three distinct groups: training(in sample), testing (out of sample), and cross-validation.A target split of the data of 65 percent, 20 percent, and 15percent was set for training, testing, and cross-validation,respectively. However, the partitioning of the data wasconstrained by the 16 replications of ratings by differentagencies. Multilayer feedforward networks, each with onehidden layer, were implemented. The number of neu-rons in the hidden layer was optimized by sequentiallyadding additional neurons until no further improvementin out-of-sample classification was achieved.
TURBMW06_013234761X.QXD 3/7/07 8:07 PM Page 38
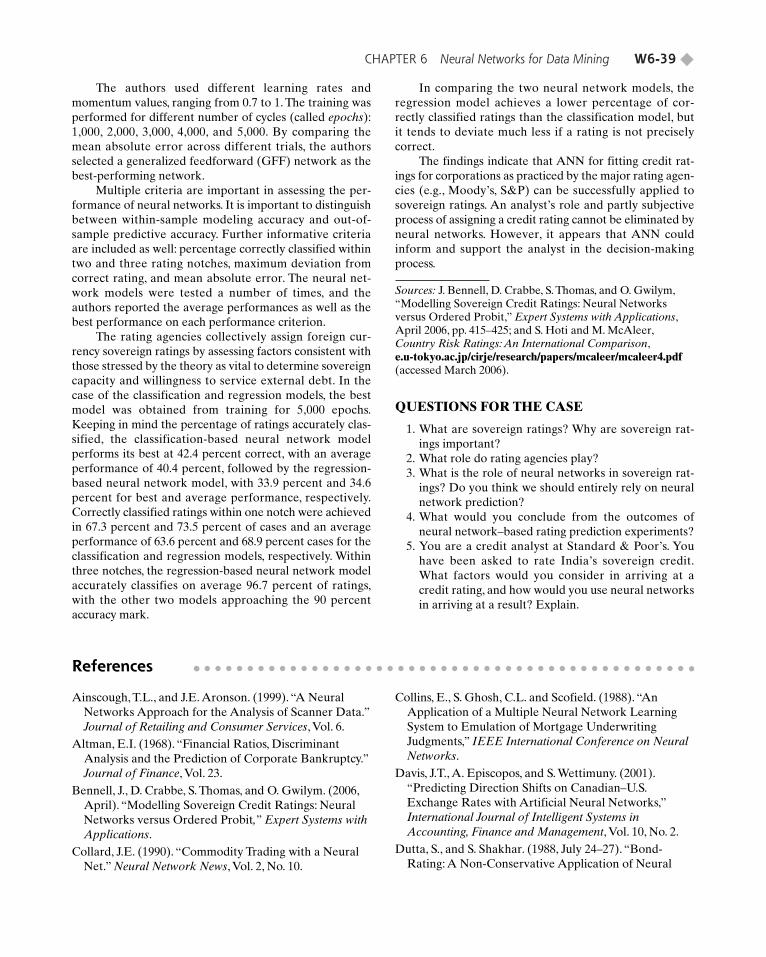
CHAPTER 6 Neural Networks for Data Mining W6-39 ◆
The authors used different learning rates andmomentum values, ranging from 0.7 to 1. The training wasperformed for different number of cycles (called epochs):1,000, 2,000, 3,000, 4,000, and 5,000. By comparing themean absolute error across different trials, the authorsselected a generalized feedforward (GFF) network as thebest-performing network.
Multiple criteria are important in assessing the per-formance of neural networks. It is important to distinguishbetween within-sample modeling accuracy and out-of-sample predictive accuracy. Further informative criteriaare included as well: percentage correctly classified withintwo and three rating notches, maximum deviation fromcorrect rating, and mean absolute error. The neural net-work models were tested a number of times, and theauthors reported the average performances as well as thebest performance on each performance criterion.
The rating agencies collectively assign foreign cur-rency sovereign ratings by assessing factors consistent withthose stressed by the theory as vital to determine sovereigncapacity and willingness to service external debt. In thecase of the classification and regression models, the bestmodel was obtained from training for 5,000 epochs.Keeping in mind the percentage of ratings accurately clas-sified, the classification-based neural network modelperforms its best at 42.4 percent correct, with an averageperformance of 40.4 percent, followed by the regression-based neural network model, with 33.9 percent and 34.6percent for best and average performance, respectively.Correctly classified ratings within one notch were achievedin 67.3 percent and 73.5 percent of cases and an averageperformance of 63.6 percent and 68.9 percent cases for theclassification and regression models, respectively. Withinthree notches, the regression-based neural network modelaccurately classifies on average 96.7 percent of ratings,with the other two models approaching the 90 percentaccuracy mark.
In comparing the two neural network models, theregression model achieves a lower percentage of cor-rectly classified ratings than the classification model, butit tends to deviate much less if a rating is not preciselycorrect.
The findings indicate that ANN for fitting credit rat-ings for corporations as practiced by the major rating agen-cies (e.g., Moody’s, S&P) can be successfully applied tosovereign ratings. An analyst’s role and partly subjectiveprocess of assigning a credit rating cannot be eliminated byneural networks. However, it appears that ANN couldinform and support the analyst in the decision-makingprocess.
Sources: J. Bennell, D. Crabbe, S. Thomas, and O. Gwilym,“Modelling Sovereign Credit Ratings: Neural Networksversus Ordered Probit,” Expert Systems with Applications,April 2006, pp. 415–425; and S. Hoti and M. McAleer,Country Risk Ratings: An International Comparison,e.u-tokyo.ac.jp/cirje/research/papers/mcaleer/mcaleer4.pdf(accessed March 2006).
QUESTIONS FOR THE CASE
1. What are sovereign ratings? Why are sovereign rat-ings important?
2. What role do rating agencies play?3. What is the role of neural networks in sovereign rat-
ings? Do you think we should entirely rely on neuralnetwork prediction?
4. What would you conclude from the outcomes ofneural network–based rating prediction experiments?
5. You are a credit analyst at Standard & Poor’s. Youhave been asked to rate India’s sovereign credit.What factors would you consider in arriving at acredit rating, and how would you use neural networksin arriving at a result? Explain.
Ainscough, T.L., and J.E. Aronson. (1999). “A NeuralNetworks Approach for the Analysis of Scanner Data.”Journal of Retailing and Consumer Services, Vol. 6.
Altman, E.I. (1968). “Financial Ratios, DiscriminantAnalysis and the Prediction of Corporate Bankruptcy.”Journal of Finance, Vol. 23.
Bennell, J., D. Crabbe, S. Thomas, and O. Gwilym. (2006,April). “Modelling Sovereign Credit Ratings: NeuralNetworks versus Ordered Probit,” Expert Systems withApplications.
Collard, J.E. (1990). “Commodity Trading with a NeuralNet.” Neural Network News, Vol. 2, No. 10.
Collins, E., S. Ghosh, C.L. and Scofield. (1988). “AnApplication of a Multiple Neural Network LearningSystem to Emulation of Mortgage UnderwritingJudgments,” IEEE International Conference on NeuralNetworks.
Davis, J.T., A. Episcopos, and S. Wettimuny. (2001).“Predicting Direction Shifts on Canadian–U.S.Exchange Rates with Artificial Neural Networks,”International Journal of Intelligent Systems inAccounting, Finance and Management, Vol. 10, No. 2.
Dutta, S., and S. Shakhar. (1988, July 24–27). “Bond-Rating: A Non-Conservative Application of Neural
References
TURBMW06_013234761X.QXD 3/7/07 8:07 PM Page 39

◆ W6-40 Business Intelligence: A Managerial Approach
Networks” Proceedings of the IEEE InternationalConference on Neural Networks, San Diego.
Fadlalla, A., and C. Lin. (2001). “An Analysis of theApplications of Neural Networks in Finance.”Interfaces, Vol. 31, No. 4.
Fishman, M., D. Barr, and W. Loick. (1991, April). “UsingNeural Networks in Market Analysis,” TechnicalAnalysis of Stocks and Commodities.
Fozzard, R., G. Bradshaw, and L. Ceci. (1989).“A Connectionist Expert System for Solar FlareForecasting,” in D.S. Touretsky (ed.), Advances inNeural Information Processing Systems Vol.1. SanMateo, CA: Kaufman Publishing.
Francett, B. (1989, January). “Neural Nets Arrive.”Computer Decisions.
Gallant, S. (1988, February). “Connectionist ExpertSystems,” Communications of the ACM, Vol. 31, No. 2.
Haykin, S.S. (1999). Neural Networks: A ComprehensiveFoundation, 2nd ed. Upper Saddle River, NJ: PrenticeHall.
Hill, T., T. Marquez, M. O’Connor, and M. Remus. (1994).“Neural Network Models for Forecasting and DecisionMaking,” International Journal of Forecasting, Vol. 10.
Hopfield, J. (1982, April). “Neural Networks and PhysicalSystems with Emergent Collective ComputationalAbilities.” Proceedings of National Academy of Science,Vol. 79, No. 8.
Hopfield, J.J., and D.W. Tank. (1985). “NeuralComputation of Decisions in Optimization Problems,”Biological Cybernetics, Vol. 52.
Kamijo, K., and T. Tanigawa. (1990, June 7–11). “StockPrice Pattern Recognition: A Recurrent NeuralNetwork Approach,” International Joint Conferenceon Neural Networks, San Diego.
Lee, P.Y., S.C. Hui, and A.C.M. Fong. (2002,September/October). “Neural Networks for WebContent Filtering.” IEEE Intelligent Systems.
Liang, T.P. (1992). “A Composite Approach to AutomatedKnowledge Acquisition.” Management Science, Vol. 38,No. 1.
McCulloch, W.S., and W.H. Pitts. (1943). “A LogicalCalculus of the Ideas Imminent in Nervous Activity.”Bulletin of Mathematical Biophysics, Vol. 5.
Mighell, D. (1989). “Back-Propagation and ItsApplication to Handwritten Signature Verification,” inD. S. Touretsky (ed.), Advances in Neural InformationProcessing Systems. San Mateo, CA: Kaufman.
Minsky, M., and S. Papert. (1969). Perceptrons.Cambridge, MA: MIT Press.
Principe, J.C., N.R. Euliano, and W.C. Lefebvre. (2000).Neural and Adaptive Systems: Fundamentals ThroughSimulations. New York: Wiley.
Rochester, J. (ed.). (1990, February). “New Business Usesfor Neurocomputing.” I/S Analyzer.
Surkan, A., and J. Singleton. (1990). “Neural Networks forBond Rating Improved by Multiple Hidden Layers.”Proceedings of the IEEE International Conference onNeural Networks, Vol. 2.
Tang, Z., C. de Almieda, and P. Fishwick. (1991). “Time-Series Forecasting Using Neural Networks vs. Box-Jenkins Methodology.” Simulation, Vol. 57, No. 5.
Thaler, S.L. (2002, January/February). “AI for NetworkProtection: LITMUS:—Live Intrusion Tracking viaMultiple Unsupervised STANNOs.” PC AI.
Walczak, S., W.E. Pofahi, and R.J. Scorpio. (2002).“A Decision Support Tool for Allocating Hospital BedResources and Determining Required Acuity of Care.”Decision Support Systems, Vol. 34, No. 4.
Wilson, R., and R. Sharda. (1994). “BankruptcyPrediction Using Neural Networks.” DecisionSupport Systems, Vol. 11.
Zahedi, F. (1993). Intelligent Systems for Business: ExpertSystems with Neural Networks. Belmont, CA:Wadsworth.
TURBMW06_013234761X.QXD 3/7/07 8:07 PM Page 40