turbid of water by using fuzzy c- means and hard k- means
TRANSCRIPT
Open Access Baghdad Science Journal P-ISSN: 2078-8665
2020, 17(3) Supplement (September):988-993 E-ISSN: 2411-7986
988
DOI: http://dx.doi.org/10.21123/bsj.2020.17.3(Suppl.).0988
Turbid of Water By Using Fuzzy C- Means and Hard K- Means
Rand Muhaned Fawzi1 Iden Hassan Alkanani2
1Department of Accounting, Al-Esraa University College, Baghdad, Iraq.([email protected], 07702892807) 1(https://orcid.org/0000-0003-0106-6688) 2Department of Mathematics, College of Science of Woman, University of Baghdad, Baghdad,
Iraq.([email protected]). 2(https://orcid.org/0000-0002-6492-8196)
Received 30/5/2019, Accepted 20/1/2020, Published 8/9/2020
This work is licensed under a Creative Commons Attribution 4.0 International License.
Abstract In this research two algorithms are applied, the first is Fuzzy C Means (FCM) algorithm and the
second is hard K means (HKM) algorithm to know which of them is better than the others these two algorithms are applied on a set of data collected from the Ministry of Planning on the water turbidity of five
areas in Baghdad to know which of these areas are less turbid in clear water to see which months during the
year are less turbid in clear water in the specified area.
Key words: Clustering, Turbid water, Fuzzy C Means algorithm, Hard K Means algorithm.
Introduction: The cluster analysis is a branch of
statistical multivariate analysis and unsupervised
pattern recognition learning. The cluster is a
process of classifying observations into different groups by partitioning the dataset while the
elements within a group (cluster) possess high
similarity while they differ from the elements in a different group (cluster). [1]
The cluster analysis is divided into two types :
1- Fuzzy clustering
2- Hard Clustering In fuzzy clustering techniques elements
(observations ) in the dataset may belong to two
clusters or more with different degrees of
membership. That means x∈ [0,1]. In hard
clustering techniques each element (observation )
in the dataset belongs to a definite cluster then it could not be included in another cluster. That
means x∈ {0,1}. [1,2,3]
In this study we take FCM algorithm as one of
Fuzzy clustering algorithms and HKM as one of Hard clustering.
This study is organized as follows: section two
contains the FCM and HKM algorithms .Section three contains the Experiment. Section four
contains the results and discussion. Section Five
contains the conclusion
Fuzzy C means (FCM) and Hard K Means
(HKM) algorithm
Fuzzy C means (FCM) Algorithm
The FCM algorithm was introduced by Dunn in ( 1973 ) and was developed by Bezdek in ( 1981 ).
The FCM algorithm belongs to the family of
algorithms that build fuzzy partition. It is one of the most used fuzzy clustering. In this algorithm
the observations can belong to many clusters in the
same time with different membership degree. [1]
This algorithm is an iterative clustering algorithm that produces an optimal K cluster by minimizing
the weight within group sum of squared error
objective function 𝐽 𝐹𝐶𝑀
𝐽 𝐹𝐶𝑀 = 𝐽(𝐗; 𝑈, 𝐶)
= ∑ ∑(𝑈𝑖𝑗)𝑚𝑑2(𝑥𝑖 , 𝑐𝑗) … . (1)
𝑘
𝑗 = 1
𝑛
𝑖= 1
Where X = {𝑥1 , 𝑥2 , … . , 𝑥𝑛 } is the dataset
(observations ) matrix with 𝑛 × 𝑝 dimensional, k is
the number of clusters with 2 ≤ k ≤ 𝑛 , Uij represent the degree of membership of X, m is the
weight exponent on each fuzzy membership,
1≤m≤∞ , 𝑐𝑗 is the center of cluster j, 𝑑2(𝑥𝑖 , 𝑐𝑗) represent the distance measure between the
elements xi and cluster center cj. [2] The steps of FCM algorithm as follows :
Open Access Baghdad Science Journal P-ISSN: 2078-8665
2020, 17(3) Supplement (September):988-993 E-ISSN: 2411-7986
989
1- Generate 𝑈𝑖𝑗 partition matrix randomly but to
constraints this matrix we should satisfy the three
conditions :
1- 0≤ u ij ≤1 for i ∈ {1,2,….. ,n} , j ∈
{1,2 , …,k}.
2- 0 < ∑ 𝑢𝑖𝑗 < 𝑛 𝑓𝑜𝑟 𝑗 ∈ {1,2, … . . , 𝑘}𝑛𝑖=1
3- ∑ 𝑢𝑖𝑗 = 1𝑘𝑗=1 𝑓𝑜𝑟 𝑖 ∈ {1,2, … . , 𝑛}.
2- Putting the data set X={x1,x2,….,xn} where X is
called dataset (observations) matrix with
dimension 𝑛 × 𝑝
3- Determine, the number of clusters 2 ≤ k ˂ n ,the fuzziness exponential m, where 1≤m≤∞ . 4- Compute the centroid of each cluster by the
formula :
𝐶𝑗 =∑ (𝑈𝑖𝑗)
𝑚𝑋𝑖
𝑛𝑖=1
∑ (𝑈𝑖𝑗)𝑚𝑛
𝑖=1
…… (2)
The formula by the elements is :
𝐶𝑗𝑡 =∑ ∑ (𝑈𝑖𝑗)
𝑚𝑋𝑖𝑡
𝑘𝑗=1
𝑛𝑖=1
∑ ∑ (𝑈𝑖𝑗)𝑚𝑘
𝑗=1𝑛𝑖=1
𝑡 = 1,2, … , 𝑝 … (3)
Where the dimension of the matrix center 𝑘 × 𝑝
5- Calculate the distance between data (
observations) matrix X and cluster center C by
square Euclidean norm, by formula :
𝑑𝑖𝑗 = [(𝑥𝑖 − 𝑐𝑗)𝑇(𝑥𝑖 − 𝑐𝑗)]
12
6- Calculate the update the membership matrix Uij
by using the formula :
𝑈𝑖𝑘 =
{
1
∑ (𝑑𝑖𝑗
𝑑𝑟𝑗)
2𝑚 − 1𝑘
𝑟=1
𝑖𝑓 𝑑𝑟𝑗 > 0 𝑓𝑜𝑟 𝑖 = 1 , 2, … , 𝑛
𝑗 = 1 , 2, … . . 𝑘 𝑎𝑛𝑑 𝑖 ≠ 𝑟0 𝑑𝑖𝑗 < 0
.. (4)
When 𝑑𝑖𝑗 = 0 the value of 𝑈𝑖𝑗 represented by
𝑈𝑖𝑗 = [0 𝑓𝑜𝑟 𝑖∉𝐼1 𝑓𝑜𝑟 𝑠𝑜𝑚𝑒 𝑖∈𝐼 ⊆{ 1,2,….,𝑛}
7- Compare 𝑈𝐼+1 with 𝑈𝐼 where I is the iteration
number for membership matrix if satisfying
the ‖𝑈𝐼 − 𝑈𝐼−1‖ < ∈ Presently if the condition in 7 fulfilled stop,
generally come back to step (4). [4]
Figure )1(. Chart FCM algorithm steps
Hard K Means Algorithm The HKM algorithm clustering (or Called Lloyd
Forgy algorithm ) was developed by James
Macqueen in 1967.
The HKM algorithm was known to be fast clustering but it is sensitive to the choice of
starting point and inefficient for solving clustering
problems in the large observations. For this the HKM could be applied to large dataset. [5]
The HKM clustering groups the data points based
on their nearness to each other according to the Euclidean distance . The aim of this algorithm is to
partition a collection of data points into cluster of
similar data point in the same cluster and
maximize the different with another clusters. Computationally, this algorithm is similar to the
technique of variance analysis, but inversely. This
algorithm begins with k clusters and randomly putting initial cluster centers and then assigns the
observation to the nearest cluster center
HKM is an iterative algorithm. It depends on minimizing the sum of distances from each data
point (observations) to its cluster center. The data
point is moved between clusters until the sum
should not be decreased any more. [6] To compute the minimizing objective function of
HKM the following formula is used :
𝐽𝐻𝐾𝑀 = 𝐽(𝑋; 𝐶) =∑∑𝑑2(𝑥𝑖 , 𝑐𝑗)… (5)
𝑘
𝑗=1
𝑛
𝑖=1
The steps of HKM algorithm as follows :
Calculate Center 𝐶𝑗
Calculate Distance 𝑑𝑖𝑗
ijU Calculate New Membership
E = ‖𝑈𝐼 − 𝑈𝐼−1‖ < ∈
Stop
Initial Membership Matrix
U, (m>1),(∈>0), error
Start

Open Access Baghdad Science Journal P-ISSN: 2078-8665
2020, 17(3) Supplement (September):988-993 E-ISSN: 2411-7986
990
1) The centroids of K clusters will be chosen from
𝑿 randomly where 𝑿 represented the dataset matrix.
2) Calculate the distances between cluster center
and the data point.
3) Each data point (observation) is putting on closest centroid cluster .
4) the matrix of cluster center are updated by the
formula:
𝑐𝑗 = ∑ 𝑥𝑖𝑛𝑟𝑖=1
𝑛𝑟 1 ≤ j ≤ k , 𝑥𝑖 ∈ 𝐴𝑗 …..(6)
Where 𝐴𝑗 represent the elements in cluster jth and
𝑛𝑟 is the number of elements in 𝐴𝑗
5) Recalculated the distance of cluster center was refreshing.
6) This algorithm is stopped if the new cluster has
no data point assigned, otherwise the steps are
repeated from (3) to (5) for any possible movements of data points between the clusters. [2]
Experiment In this research, the study of clear water turbidity is done in two recitations of five areas in Baghdad
city.These recitations are for one year. This study
was done in the Iraqi Ministry of Planning / Central Organization for Standardization and
Quality Control/ Nutrition Laboratory.
The idea of this study is to determine which areas are less turbid in clear water by using FCM
algorithm through the objective function values
and the error term .After that employing the HKM
algorithm was to determine which months during the year that was less turbid water clear.
Results and discussion: 1- The numerical results are computed for all cities
which are studied in this research by using the
FCM algorithm :
Table )1(. The objective function and error term of FCM algorithm for three clusters
As shown in Table (1) Al Amerya city that have
the smallest objective function compared with the other cities but it have a big error compared with
error term of other cities
Therefore the new Baghdad city is chosen which is the best city for less turbidity in the water because
it has minimum error term and a good objective
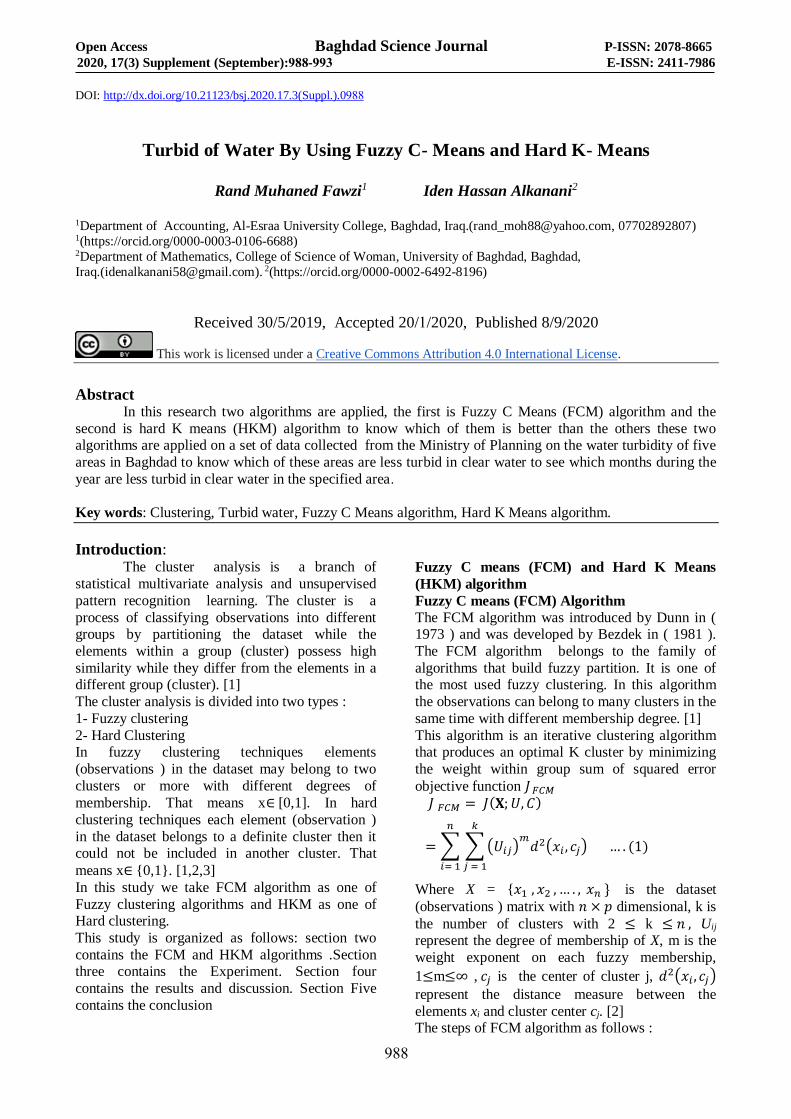
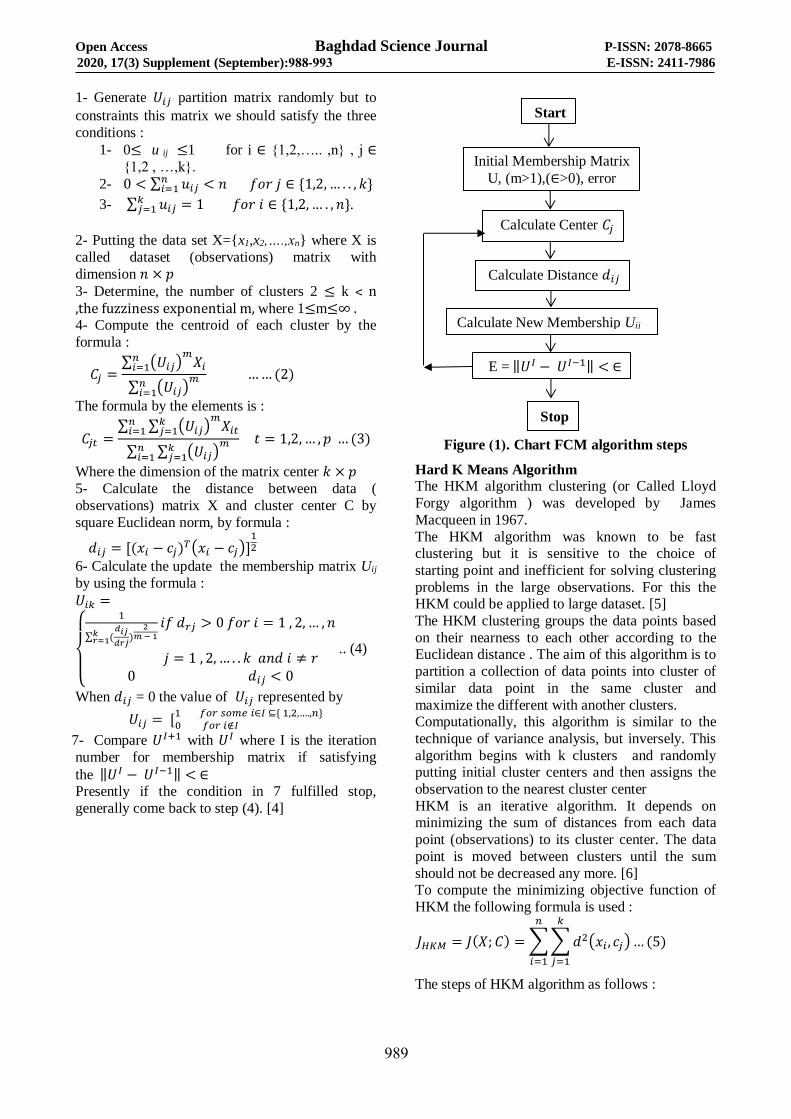
function. 2- Now, employing the HKM to choose the months
that are of less turbidity for all cities. In the
beginning, the diagrams are drawn to show the
expanse turbid water in all months of the year in the first column. The second column shows the
minimum expanse turbid water in any month of
the year, the third column shows the maximum expanse turbid water in any month of the year, the
fourth column shows the arithmetic mean for
expanse turbid water and the fifth column shows the standard deviation for expanse turbid water
Figure (2).The two recitations was closed ( Al
Bayaa city)
Figure (3). The two recitations was closed (New
Baghdad city )
City
Term
Al Bayaa New Baghdad Al
Amreya
Al doora Alsader city
Objective function values 0.5213 0.0432 0.022 0.2438 0.0756
Error term 0.0179 0.000058 0.0445 0.0091 0.000033
Open Access Baghdad Science Journal P-ISSN: 2078-8665
2020, 17(3) Supplement (September):988-993 E-ISSN: 2411-7986
991
Figure (4). The two recitations was closed (Al
Amryaa city )
Figure (5). The two recitations was closed (Al
Doraa city )
Figure (6). The two recitations was closed (Al
Sader city )
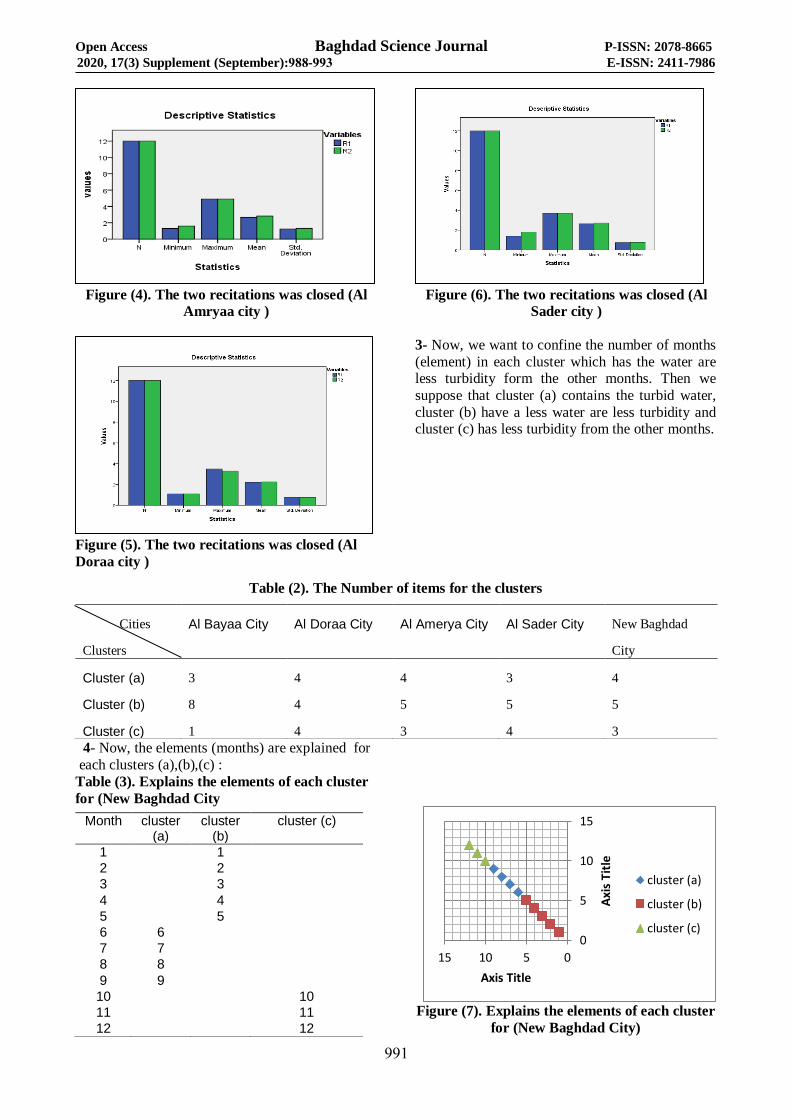
3- Now, we want to confine the number of months
(element) in each cluster which has the water are less turbidity form the other months. Then we
suppose that cluster (a) contains the turbid water,
cluster (b) have a less water are less turbidity and cluster (c) has less turbidity from the other months.
Table (2). The Number of items for the clusters
4- Now, the elements (months) are explained for
each clusters (a),(b),(c) :
Table (3). Explains the elements of each cluster
for (New Baghdad City
Figure (7). Explains the elements of each cluster
for (New Baghdad City)
0
5
10
15
051015
Axi
s T
itle
Axis Title
cluster (a)
cluster (b)
cluster (c)
Cities
Clusters
Al Bayaa City Al Doraa City Al Amerya City Al Sader City New Baghdad
City
Cluster (a) 3 4 4 3 4
Cluster (b) 8 4 5 5 5
Cluster (c) 1 4 3 4 3
Month cluster (a)
cluster (b)
cluster (c)
1 1
2 2
3 3
4 4
5 5
6 6
7 7
8 8
9 9
10 10
11 11
12 12

Open Access Baghdad Science Journal P-ISSN: 2078-8665
2020, 17(3) Supplement (September):988-993 E-ISSN: 2411-7986
992
As shown in Table(3) and Figure (7) the New
Baghdad city in cluster (a) was more turbid in water specially in months (6,7,8,9) and in the
cluster (b) was less water turbidity specially in
months (1,2,3,4,5). That means, these months are
convenient for reality since when the Ministry of Water Resources is asked which months has more
turbidity water in Iraq, the Ministry says the
summer season but when the ministry is asked which are the months has less turbidity water, it
says the winter season.
Conclusions: It is noted that when the FCM algorithm
was applied, on the real dataset which were collected from the ministry of Planning the best
area was the New Baghdad city and when the
HKM algorithm was applied it showed that the months (6,7,8,9) were more turbidity water in the
year which belongs to summer season and the
months (1,2,3,4,5) were less turbidity water in the
year which belongs to winter season. That's mean the water was less turbid in winter season.
Authors' declaration: - Conflicts of Interest: None.
- We hereby confirm that all the Figures and
Tables in the manuscript are mine ours. Besides, the Figures and images, which are not
mine ours, have been given the permission for
re-publication attached with the manuscript. - The author has signed an animal welfare
statement.
- Ethical Clearance: The project was approved by
the local ethical committee in University of Baghdad.
References: 1. Alsheikhly R.M.F.Cluster Analysis .Classification
Data by Using Fuzzy Cluster Analysis with Practical
Application. M.Sc. Thesis.Baghdad. College of
Education for Pure Science (Ibn Al-Haitham).
University of Baghdad.2013.
2. Zeynel Cebeci, Figen Yildiz,. Comparison of K-
Means and Fuzzy C-Means Algorithms on Different
Cluster structures. Journal of Agricultural Informatics
(ISSN 2061-862x). Vol. 6,No. 3:13-23.
3. Raghuvira Pratap A, K Suvarna Vani, J Rama Devi,
Dr.K Nageswara Rao.An Efficient Density based
Improved K- Medoids Clustering Algorithm.
International Journal of Advanced Science and
Applications (IJACSA).2011. Vol. 2,No 6.
4. Alshekh W.S.H.. The use of cluster analysis to
classify processes with practical application. M.SC.
Thesis, College of Administration and Economics.
University of Mustansiriyah. 2006.
5. Kalpit G. Soni, Dr. Atul Patel.Comparative Analysis
of K-means and K-medoids Algorithm on IRIS Data. International Journal of Computational Intelligence
Research( ISSN 0973-1873). Volume 13. Number 5
(2017). pp. 899-906.
6. Norazam Arbin, Nur Suhailayani Suhaimi, Nurul
Zafirah Mokhtar, Zalinda Othman.Comparative
Analysis between K-Means and K-Medoids for
Statistical Clustering. 2015 Third International
Conference on Artificial Intelligence. Modelling and
Simulation.

Open Access Baghdad Science Journal P-ISSN: 2078-8665
2020, 17(3) Supplement (September):988-993 E-ISSN: 2411-7986
993
الحادة Kالضبابية و طريقة متوسطات Cالمياه بأستخدام طريقة متوسطات ) عكرة ( تلوث
ايدن حسن الكناني 2 رند مهند فوزي 1
)[email protected], 0( قسم المحاسبة , كلية الاسراء الجامعة ,بغداد , العراق. 1 )[email protected](قسم الرياضيات , كلية العلوم بنات , جامعة بغداد ,بغداد, العراق. 2
الملخصما الأفضل لمعرفة ايه Hard K Means (KM)و الثانية Fuzzy C Means (FCM)في هذا البحث طبقنا طريقتين الأولى
حيث طبقنا كلتاهما على مجموعة من البيانات التي جمعت من وزارة التخطيط عن تلوث )عكرة ( المياه لخمس مناطق في بغداد وذلك لمعرفة
Hardأي من هذه المناطق اقل تلوث )عكرة ( في الماء الصافي وبعد ان نحدد المنطقة الأقل تلوث )عكره( في الماء الصافي نطبق طريقة
K Means (KM) . لمعرفة أي الأشهر خلال السنة اقل تلوث )عكرة( في الماء الصافي في المنطقة المحددة
الحادة. Kالضبابية ، خوارزمية متوسطات Cتلوث الماء، خوارزمية متوسطات ،العنقدة الكلمات المفتاحية :