turbo roundabouts: multicriterion assessment on …abastos/outputs/congressos internacional/trb 2014...
TRANSCRIPT
TURBO ROUNDABOUTS: MULTICRITERION ASSESSMENT ON 1 INTERSECTION CAPACITY, SAFETY, AND EMISSIONS 2
3 Luís Vasconcelos, MSc. 4
Adjunct Professor, Department of Civil Engineering 5 Polytechnic Institute of Viseu 6
Campus Politécnico de Repeses 7 3504-510 Viseu – Portugal 8
Phone: (+351) 232 480 500, E-mail: [email protected] 9 (corresponding author) 10
11 Ana Bastos Silva, PhD. 12
Assistant Professor, Department of Civil Engineering 13 University of Coimbra 14
Rua Luís Reis Santos - Pólo II 15 3030-788 Coimbra – Portugal 16
Phone: (+351) 239 797 100, E-mail: [email protected] 17 18
Álvaro Maia Seco, PhD. 19 Associated Professor, Department of Civil Engineering 20
University of Coimbra 21 Rua Luís Reis Santos - Pólo II 22 3030-788 Coimbra – Portugal 23
Phone: (+351) 239 797 100, E-mail: [email protected] 24 25
Paulo Fernandes, MSc. 26 Graduate Student, Mechanical Engineering 27
University of Aveiro 28 Dept. Mechanical Engineering / Centre for Mechanical Technology and 29
Automation (TEMA) 30 Campus Universitário de Santiago, 3810-193 Aveiro - Portugal 31
Phone: (+351) 234 370 830, E-mail: [email protected] 32 33
Margarida C. Coelho, PhD. 34 Assistant Professor, Mechanical Engineering 35
University of Aveiro 36 Dept. Mechanical Engineering / Centre for Mechanical Technology and 37
Automation (TEMA) 38 Campus Universitário de Santiago, 3810-193 Aveiro - Portugal 39 Phone: (+351) 234 370 830, E-mail: [email protected] 40
41 42
Submitted for consideration for publication and presentation at the 93rd Annual 43 Meeting of the Transportation Research Board, January 12-16, 2014. 44
45 Resubmitted with reviewers comments addressed: November 10, 2013 46
47 Total number of words (excluding references): 4741 (text) + 9 (figures/tables) = 48
6991 words (Max 7000 words). 49

ABSTRACT 1
2 A turbo-roundabout is a variation of the conventional multi-lane roundabout 3
where spiral road markings and raised lane dividers force drivers to follow a very 4 specific path according to their intended destination. This geometry eliminates weaving 5 and cut-in conflicts by guiding drivers continuously from entry to exit. Turbo-6 roundabouts were conceived with the main aim of improving safety but their practical 7 benefits are relatively unknown. Likewise, the few existing studies on this subject do 8 not allow definitive conclusions to be drawn about their performance concerning delays 9 and emissions, thus further research is needed. This research is focused on using 10 appropriate modeling methodologies to understand the effects of turbo-roundabouts on 11 capacity, safety and emissions, in comparison with conventional single-lane and double-12 lane roundabouts. The results indicate that turbo-roundabouts have capacity levels 13 comparable to two-lane roundabouts, but are less robust concerning the directional split 14 of the entry traffic; the turbo-roundabouts leads to fewer traffic conflicts, but with a 15 higher degree of severity; concerning emissions, the results show that there are no 16 advantages on implementing turbo-roundabouts when the main concern are CO2 and/or 17 NOx. 18
19 20
KEYWORDS: Turbo-roundabouts, Capacity, Safety, Emissions. 21

1
INTRODUCTION AND OBJECTIVES 22
A turbo-roundabout is a variation of the conventional multi-lane roundabout, 23 where drivers are forced to follow a specific path according to their intended 24 destination. The carriageway consists of continuous spiral paths, using curbs to separate 25 lanes in the entry, circulatory and exit zones. The installation of curb dividers has two 26 major benefits: the elimination of conflict points caused by weaving maneuvers, and 27 speed reduction due to increased deflection (1). On the negative side, raised curbs 28 difficult snow removal and may be a risk for motorcyclists (2). The first turbo-29 roundabouts were installed in 2000, in the Netherlands. Since then, more than 190 30 turbo-roundabouts have been implemented and the Dutch government no longer 31 constructs multi-lane conventional roundabouts, having adopted turbo-roundabouts as 32 current practice (1). This was followed by their adoption in Poland and most recently in 33 Germany, Finland, Norway and Slovenia (3). There is also a growing interest about this 34 new layout in the United States (4). 35
Turbo-roundabouts are usually compared with conventional single-lane and two-36 lane roundabouts at two levels: capacity/delays and safety. In terms of capacity, the 37 results are not consensual. Initial research based on simplified approaches concluded 38 that in general terms turbo-roundabouts offer higher capacity than conventional 39 roundabouts of similar size (5; 6). More recent works indicate that the relative 40 performance of turbo-roundabouts is highly dependent on the demand flows at the 41 major and minor entries (7). A new lane-based capacity method (8) allows quantifying 42 the importance of the directional split at each entry and reveals that only in very specific 43 demand scenarios, that are uncommon in real-world networks, a standard turbo-44 roundabout can be expected to provide more capacity than the equivalent two-lane 45 roundabout. This happens namely when the proportion of drivers at each entry turning 46 right is abnormally high (usually above 60%). 47
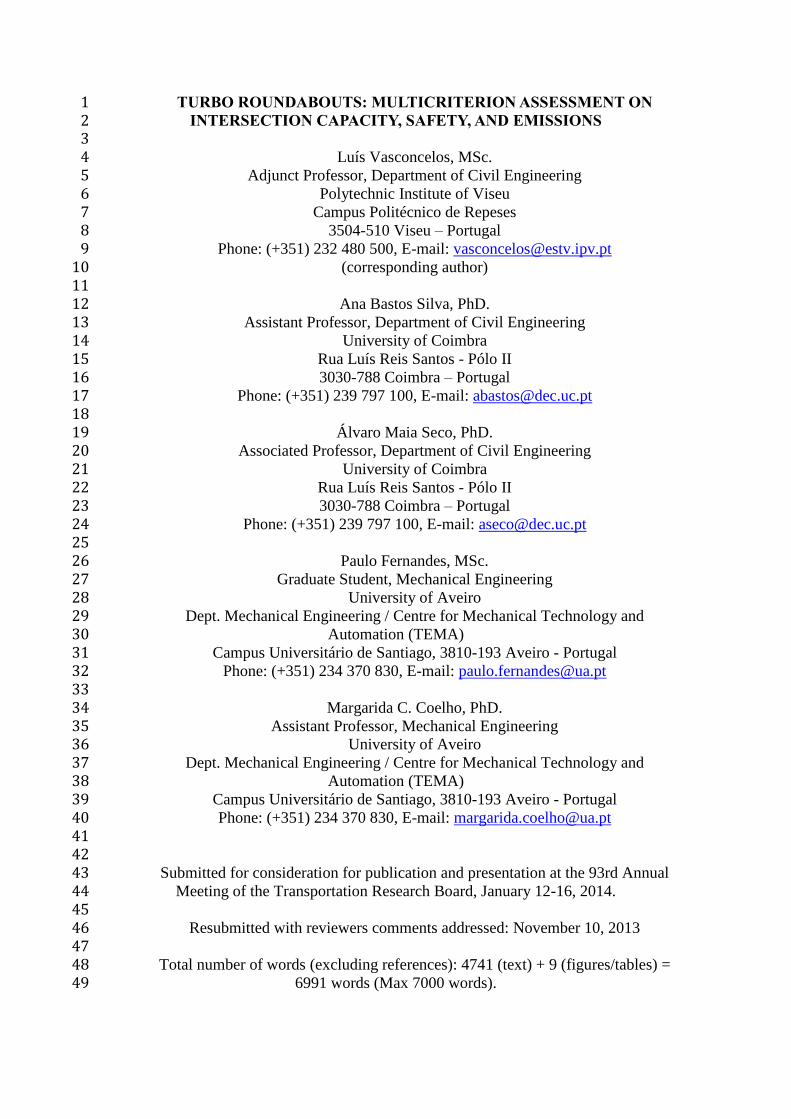
Regarding safety, despite the lack of quantitative crash data, researchers are more 48 consensual to the benefits of turbo-roundabouts. From a set of before-and-after studies 49 in Holland, Fortuijn (1) concluded that “the measured effect of turbo roundabouts on 50 safety is comparable with that of single-lane roundabouts”. A study from Mauro and 51 Cattany (9), based on conflict analysis techniques, shows a 40-50% reduction in the 52 accident rate relatively to two-lane roundabouts. The comparison of the number of 53 conflict points – 8 in a single lane roundabout, 24 in a two-lane roundabout and 14 in a 54 turbo-roundabout (see Figure 1) also suggests improved safety when compared with the 55 two-lane layout. 56
57
58
FIGURE 1 Types of conflicts at single-lane, two-lane and turbo-roundabouts. 59
60
8 conflicts:
4 diverging
4 merging
24 conflicts:
8 diverging
8 merging
8 crossing
14 conflicts:
4 diverging
6 merging
4 crossing
2
The safety performance of a roundabout can be related to some measure of its 61 operating speeds (10; 11). In addition to the reduction of conflict points (relatively to 62 the two-lane roundabout), turbo-roundabouts also lead to lower entry and circulating 63 speeds. Whereas a driver can ignore lane markings on a two-lane roundabout and 64 choose an almost direct path, keeping their approach speed, on a turbo-roundabout 65 raised splitters force drivers to stay in the correct lane and thus follow paths with 66 smaller radii at slower speeds. 67
The effect of turbo-roundabouts on pollutant emissions is also unknown. Research 68 in this field has been focused on emission impacts of single-lane and multi-lane 69 roundabouts (12-14). One concern about emissions in turbo-roundabouts is to what 70 extent vehicle’s speed and acceleration/deceleration patterns will vary, since drivers are 71 forced to follow a specific path according to their intended destination. These speed 72 variation occurrences could have a significant impact and reduce potential emissions 73 benefits of that solution. 74
From the above points it becomes clear that there are few studies on this subject, 75 most of them lack solid field data and follow different methodologies that in some cases 76 lead to contradictory conclusions. In the absence of crash statistics and emissions data a 77 deeper analysis is needed. Recent developments in the fields of microscopic simulation 78 related to safety and emission analysis suggest that these tools, in addition to the classic 79 evaluation of traffic operation and management strategies, can be successfully used to 80 evaluate road safety levels, capacity and emissions of existing and new infrastructures. 81
Therefore, the motivation for this research is to use the most appropriate 82 microscopic modeling methodologies to understand the capacity, safety and emissions 83 emitted from turbo-roundabouts, comparing them with conventional single-lane and 84 double-lane roundabouts. The hypothesis is that different patterns of circulating traffic, 85 capacity flows and lane selection will have a different effect on emissions and conflict 86 points and thus in their relative performance. In summary, the objectives of this research 87 are: a) to evaluate capacity and delays, b) to assess conflict locations and occurrence 88 rates, c) to quantify emission impacts of turbo-roundabout operations and d) to explore 89 the differences between turbo-roundabouts, conventional single-lane and two-lane 90 roundabouts. 91
METHODOLOGY 92
Basic methodological approach 93
This multi-criteria assessment is based on the use of microsimulation to describe 94 the functioning of alternative, single-lane, two-lane and turbo-roundabouts under a 95 number of demand scenarios, chosen to represent a wide range of possible real life 96 situations. An existing single-lane roundabout is taken as a reference problem. 97
The Aimsun software package (15) was the application selected to develop the 98 microsimulation models. It provides default simulation outputs that allow the 99 conventional assessment of the different layouts in terms of capacity and delays. 100 Aimsun also allows exporting full disaggregated trajectory files that can be used by 101 external applications to assess environmental and safety impacts, as described on the 102 following points. 103
Capacity and delays 104
Travel times and delays are considered major performance measures for 105 transportation systems (16). Each layout affects travel times at two levels: by imposing 106
3
different negotiation speeds in free-flow conditions and, mostly, by offering different 107 geometric and operational capacity levels. Two measures of performance were initially 108 considered: the average travel time for the whole simulation period and travel time 109 reliability. Some preliminary tests indicated that the variability of travel times is almost 110 independent of the layout so only the average travel time, between origin and 111 destination centroids, was considered to measure the operational performance of each 112 alternative. 113
Safety 114
The core of this new safety assessment approach is a software developed by the 115 Federal Highway Administration (Surrogate Safety Assessment Model - SSAM) (17) 116 that automates conflict analysis by processing vehicle trajectories files produced during 117 the simulation (vehicle's position, speed and acceleration profiles). This approach has all 118 the generic advantages of simulation (possibility of accessing the safety of new facilities 119 before the occurrence of accidents, controlled testing environment, etc.) but has also 120 some limitations: common microscopic simulation models are developed for traffic-121 flow analyses and lack some features that are essential for safety analyses (e.g. 122 overtaking with opposing flow, lateral movement, U-turns at intersections). Some 123 authors proposed specific procedures to calibrate simulation models for safety 124 assessment (18; 19) but this is still an ongoing research field. The relationship between 125 simulated conflicts and accidents is also not well established. Al-Ghandour et al. (20) 126 found a statically significant relationship between SSAM predicted conflicts and 127 crashes (predicted by analytic regression methods), but recognize the need for additional 128 studies involving the comparison of SSAM outputs with real crash data. 129
SSAM operates by processing data describing the trajectories of vehicles driving 130 through a traffic facility and identifying conflicts. For each vehicle-to-vehicle 131 interaction SSAM calculates surrogate measures of safety and determines whether or 132 not that interaction satisfies the criteria to be deemed a conflict. In the present analysis 133 the research team used Time-to-Collision (TTC) as a threshold to define if a given 134 vehicle interaction is a conflict and the Relative Speed (DeltaS) as a proxy for the 135 accident severity. Their definition is (21): 136
• TTC is the minimum time-to-collision value observed during the interaction of 137 two vehicles on collision route. If at any time step the TTC drops below a given 138 threshold (1.5 s in this work, as suggested for urban areas (22)), the interaction is tagged 139 as a conflict; 140
• DeltaS is the difference in vehicle speeds as observed at the instant of the 141 minimum TTC. More precisely, this value is mathematically defined as the norm of the 142 velocity vectors of the two vehicles, thus accounting for the differences both in the 143 vehicles absolute speeds and headings. Further details about alternative surrogate 144 measures can be found elsewhere (23; 24). 145
Emissions 146
To estimate vehicle emissions, the “Vehicle Specific Power” (VSP) methodology 147 (25; 26) was used. This microscopic emissions model was chosen since it allows 148 estimating instantaneous emissions based on a second-by-second vehicle’s dynamics 149 (speed, acceleration and slope), thus taking as input the same trajectory files given by 150 Aimsun (also required by the SSAM module). The VSP values are categorized in 14 151 modes of engine regime and an emission factor for each mode is used to estimate CO2, 152 CO, NOX and HC emissions from Light Duty Gasoline Vehicles (LPGV<1.4L), Light 153

4
Duty Diesel Vehicles (LDDV<1.9 L) and Light Commercial Vehicles (LCV<2.5L). 154 Because of its direct physical interpretation and a strong statistical correlation with 155 vehicle emissions, VSP has proven to be very useful in estimating micro-scale 156 emissions for both gasoline (25; 26) and diesel vehicles (27). Some previous studies 157 have documented the effective use of VSP in analyzing emission impacts of single and 158 multi-lane roundabouts in urban corridors (12-14). 159
Equation 1 (25) provides the VSP calculation for both light duty and commercial 160 vehicles: 161
162
3. 1.1. 9.81.sin arctan 0.132 0.000302.VSP v a grade v (Equation 1) 163
Where: 164 VSP = Vehicle Specific Power (kW/ton); 165 v = Instantaneous speed (m/s); 166 a = Instantaneous acceleration or deceleration (m/s2); 167 grade = terrain gradient (decimal fraction). 168 169 Total emissions for passenger cars were calculated considering 45% of LDGV, 170
34% of LDDV and 21% of LCV (28). Due to the flat terrain the effect of road grade is 171 negligible. CO2, CO, NOX and HC total emissions by roundabout type were derived 172 based on time spent in each VSP mode multiplied by its respective emission factor (25-173 27). 174
MODEL DEVELOPMENT 175
Site Selection 176
In Portugal, the first turbo-roundabout is expected to be constructed in Coimbra, to 177 replace an existing single-lane roundabout (D = 57 m, circulating lane width = 7.8 m). 178 This roundabout is one of the main entries to the city and it gets occasionally congested 179 during the peak periods. Most legs have one lane, both in the entry and in the exit. The 180 east entry has a slip lane towards the north directions. The west leg serves essentially to 181 access a local park and hence it has a very low traffic). The speeds on the approach legs 182 are relatively low (≈55 km/h). 183
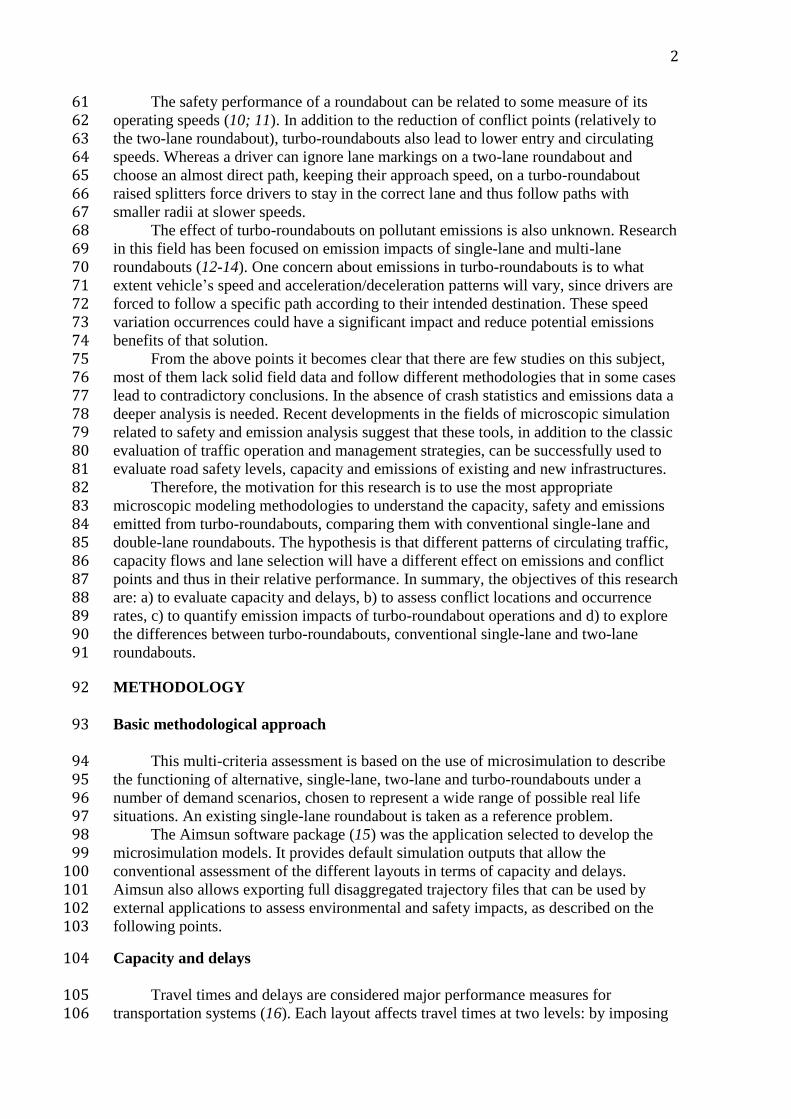
It was decided to follow a two-stage implementation: in the first, the existing 184 roundabout will be widened and transformed into a conventional two-lane roundabout; 185 in the second, following some months to allow driver adaptation, the splitter islands and 186 the inner circle will be reshaped to the final turbo-roundabout layout (Figure 2). 187
5
FIGURE 2 Choupal Rbt. in Coimbra – existing layout (left), proposed two-lane (center) and turbo 188 (right) layouts (north direction upwards). 189
190 The two-lane layout was designed according to the Portuguese design guidelines 191
(29). Due to some space restrictions the east and west exits are single lane; in the north 192 and south exits there are two lanes during a limited length that may be extended in the 193 future. The design of the turbo-roundabout was based on the Dutch guidelines (30; 31) 194
The simulation area is centered on the intersection and extends roughly 150 m on 195 each direction. This allows simulating the upstream queues while minimizing the 196 influence of nearby intersections in the simulation outputs. 197
Traffic demand 198
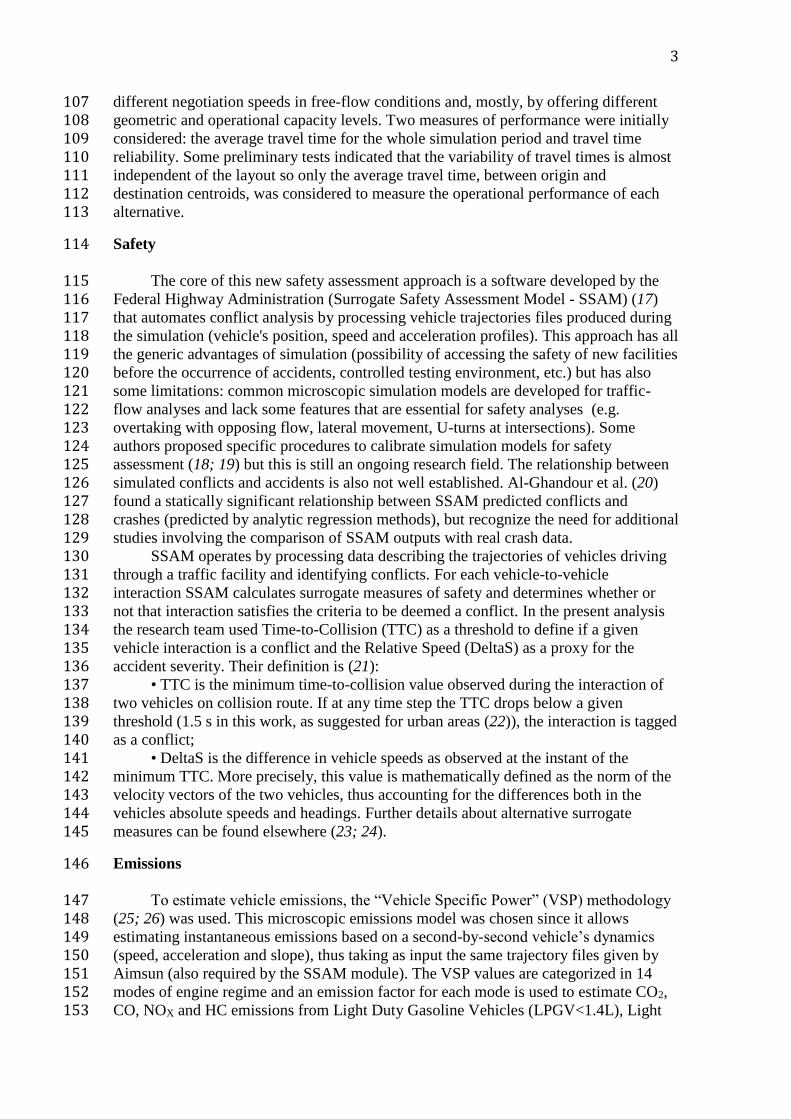
A typical week day, 24 h period, was chosen as the modeling period in order to 199 cover a wide range of traffic conditions and to ensure that, regardless of the scenario 200 tested, no vehicles would be retained in the centroids at the end of the simulation period. 201 Traffic flows and speeds at the north and south legs (separately for each direction), were 202 recorded continuously with pneumatic tubes and microwave detectors (Figure 3) and 203 associated with directional splits observed from video recordings to produce 1-hour 204 origin-destination (OD) matrices for the whole 24 h period, totaling 23816 vehicles/day. 205 The origin-destination matrix, in proportional terms, is reasonably constant during the 206 day, with negligible U-turns. For each entry, the left, trough and right directional splits 207 are: South – 4%, 61%, 35%; East – 38%, 2%, 60%, North – 43%, 56%, 1%, West - 208 30%, 50%, 20%. 209 210
6
211
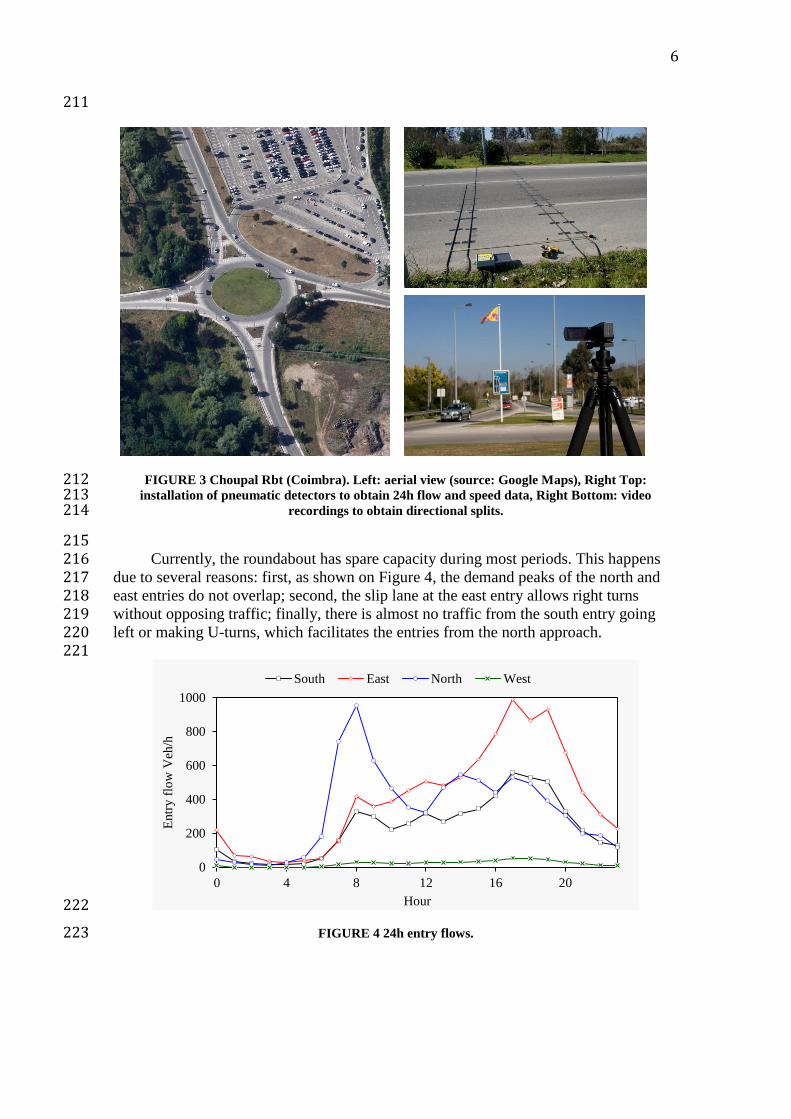
FIGURE 3 Choupal Rbt (Coimbra). Left: aerial view (source: Google Maps), Right Top: 212 installation of pneumatic detectors to obtain 24h flow and speed data, Right Bottom: video 213
recordings to obtain directional splits. 214
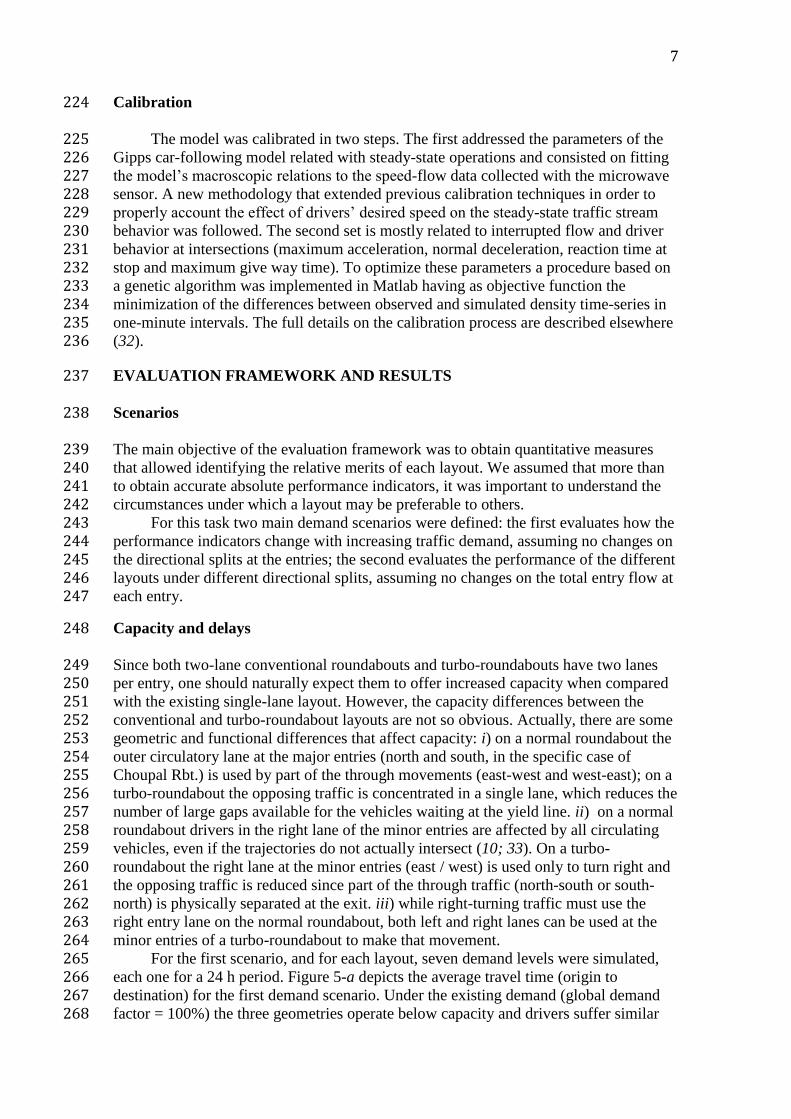
215 Currently, the roundabout has spare capacity during most periods. This happens 216
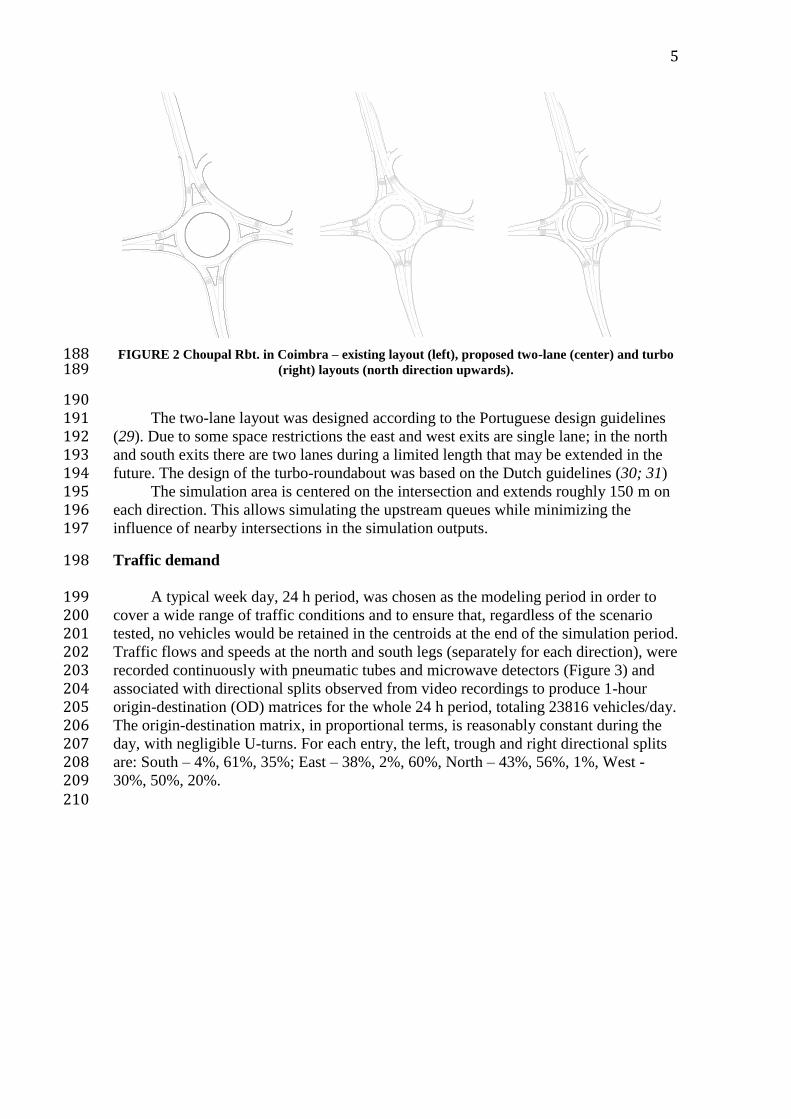
due to several reasons: first, as shown on Figure 4, the demand peaks of the north and 217 east entries do not overlap; second, the slip lane at the east entry allows right turns 218 without opposing traffic; finally, there is almost no traffic from the south entry going 219 left or making U-turns, which facilitates the entries from the north approach. 220
221
222
FIGURE 4 24h entry flows. 223
0
200
400
600
800
1000
0 4 8 12 16 20
Entr
y f
low
Veh
/h
Hour
South East North West
7
Calibration 224
The model was calibrated in two steps. The first addressed the parameters of the 225 Gipps car-following model related with steady-state operations and consisted on fitting 226 the model’s macroscopic relations to the speed-flow data collected with the microwave 227 sensor. A new methodology that extended previous calibration techniques in order to 228 properly account the effect of drivers’ desired speed on the steady-state traffic stream 229 behavior was followed. The second set is mostly related to interrupted flow and driver 230 behavior at intersections (maximum acceleration, normal deceleration, reaction time at 231 stop and maximum give way time). To optimize these parameters a procedure based on 232 a genetic algorithm was implemented in Matlab having as objective function the 233 minimization of the differences between observed and simulated density time-series in 234 one-minute intervals. The full details on the calibration process are described elsewhere 235 (32). 236
EVALUATION FRAMEWORK AND RESULTS 237
Scenarios 238
The main objective of the evaluation framework was to obtain quantitative measures 239 that allowed identifying the relative merits of each layout. We assumed that more than 240 to obtain accurate absolute performance indicators, it was important to understand the 241 circumstances under which a layout may be preferable to others. 242
For this task two main demand scenarios were defined: the first evaluates how the 243 performance indicators change with increasing traffic demand, assuming no changes on 244 the directional splits at the entries; the second evaluates the performance of the different 245 layouts under different directional splits, assuming no changes on the total entry flow at 246 each entry. 247
Capacity and delays 248
Since both two-lane conventional roundabouts and turbo-roundabouts have two lanes 249 per entry, one should naturally expect them to offer increased capacity when compared 250 with the existing single-lane layout. However, the capacity differences between the 251 conventional and turbo-roundabout layouts are not so obvious. Actually, there are some 252 geometric and functional differences that affect capacity: i) on a normal roundabout the 253 outer circulatory lane at the major entries (north and south, in the specific case of 254 Choupal Rbt.) is used by part of the through movements (east-west and west-east); on a 255 turbo-roundabout the opposing traffic is concentrated in a single lane, which reduces the 256 number of large gaps available for the vehicles waiting at the yield line. ii) on a normal 257 roundabout drivers in the right lane of the minor entries are affected by all circulating 258 vehicles, even if the trajectories do not actually intersect (10; 33). On a turbo-259 roundabout the right lane at the minor entries (east / west) is used only to turn right and 260 the opposing traffic is reduced since part of the through traffic (north-south or south-261 north) is physically separated at the exit. iii) while right-turning traffic must use the 262 right entry lane on the normal roundabout, both left and right lanes can be used at the 263 minor entries of a turbo-roundabout to make that movement. 264
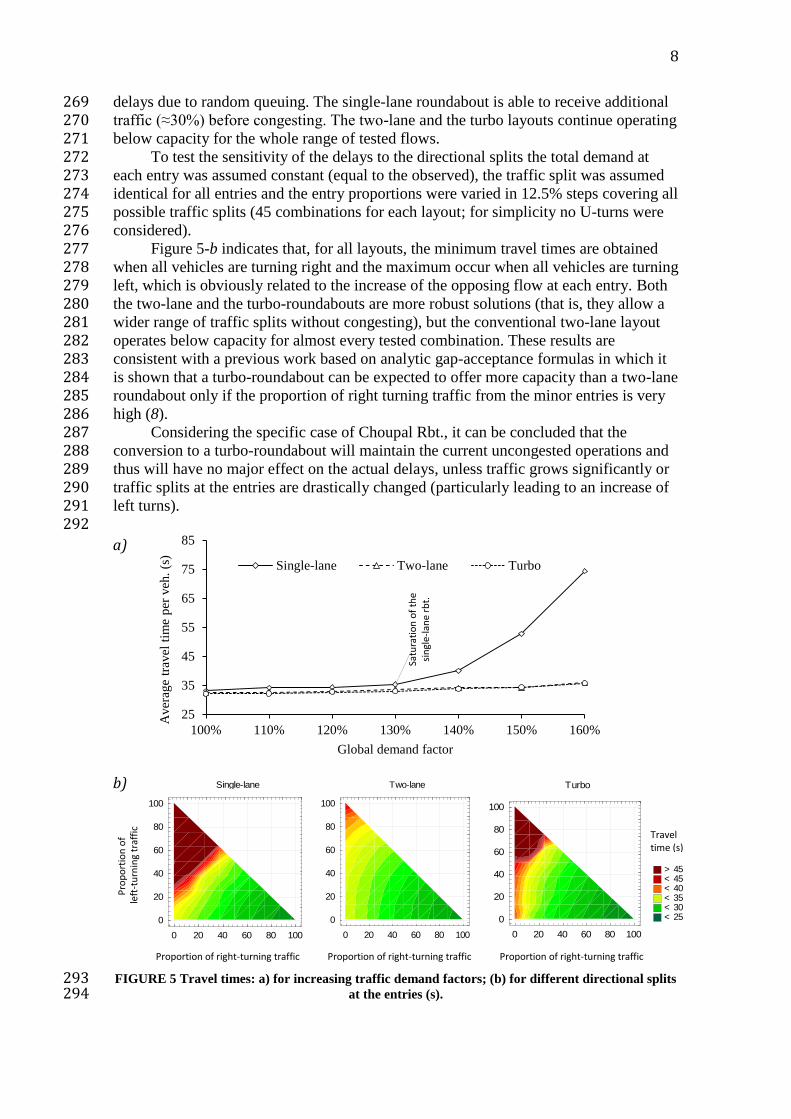
For the first scenario, and for each layout, seven demand levels were simulated, 265 each one for a 24 h period. Figure 5-a depicts the average travel time (origin to 266 destination) for the first demand scenario. Under the existing demand (global demand 267 factor = 100%) the three geometries operate below capacity and drivers suffer similar 268
8
delays due to random queuing. The single-lane roundabout is able to receive additional 269 traffic (≈30%) before congesting. The two-lane and the turbo layouts continue operating 270 below capacity for the whole range of tested flows. 271
To test the sensitivity of the delays to the directional splits the total demand at 272 each entry was assumed constant (equal to the observed), the traffic split was assumed 273 identical for all entries and the entry proportions were varied in 12.5% steps covering all 274 possible traffic splits (45 combinations for each layout; for simplicity no U-turns were 275 considered). 276
Figure 5-b indicates that, for all layouts, the minimum travel times are obtained 277 when all vehicles are turning right and the maximum occur when all vehicles are turning 278 left, which is obviously related to the increase of the opposing flow at each entry. Both 279 the two-lane and the turbo-roundabouts are more robust solutions (that is, they allow a 280 wider range of traffic splits without congesting), but the conventional two-lane layout 281 operates below capacity for almost every tested combination. These results are 282 consistent with a previous work based on analytic gap-acceptance formulas in which it 283 is shown that a turbo-roundabout can be expected to offer more capacity than a two-lane 284 roundabout only if the proportion of right turning traffic from the minor entries is very 285 high (8). 286
Considering the specific case of Choupal Rbt., it can be concluded that the 287 conversion to a turbo-roundabout will maintain the current uncongested operations and 288 thus will have no major effect on the actual delays, unless traffic grows significantly or 289 traffic splits at the entries are drastically changed (particularly leading to an increase of 290 left turns). 291
292
Travel time (s)
Proportion of right-turning traffic Proportion of right-turning traffic Proportion of right-turning traffic
FIGURE 5 Travel times: a) for increasing traffic demand factors; (b) for different directional splits 293 at the entries (s). 294
Satu
rati
on
of
the
sin
gle-
lan
e rb
t.
25
35
45
55
65
75
85
100% 110% 120% 130% 140% 150% 160%
Aver
age
trav
el t
ime
per
veh
. (s
)
Global demand factor
Single-lane Two-lane Turbo
Single-lane
> 45 < 45 < 40 < 35 < 30 < 25
0 20 40 60 80 100
Prop. right-turning traffic
0
20
40
60
80
100
Pro
p.
left
-turn
ing t
raff
ic
Two-lane
> 45 < 45 < 40 < 35 < 30 < 25
0 20 40 60 80 100
Prop. right-turning traffic
0
20
40
60
80
100
Pro
p.
left
-turn
ing t
raff
ic
Turbo
> 45 < 45 < 40 < 35 < 30 < 25
0 20 40 60 80 100
Prop. right-turning traffic
0
20
40
60
80
100
Pro
p.
left
-turn
ing t
raff
ic
Turbo
> 45 < 45 < 40 < 35 < 30 < 25
0 20 40 60 80 100
Prop. right-turning traffic
0
20
40
60
80
100
Pro
p.
left
-turn
ing t
raff
ic
a)
b)
Pro
po
rtio
n o
f le
ft-t
urn
ing
traf
fic
9
Safety 295
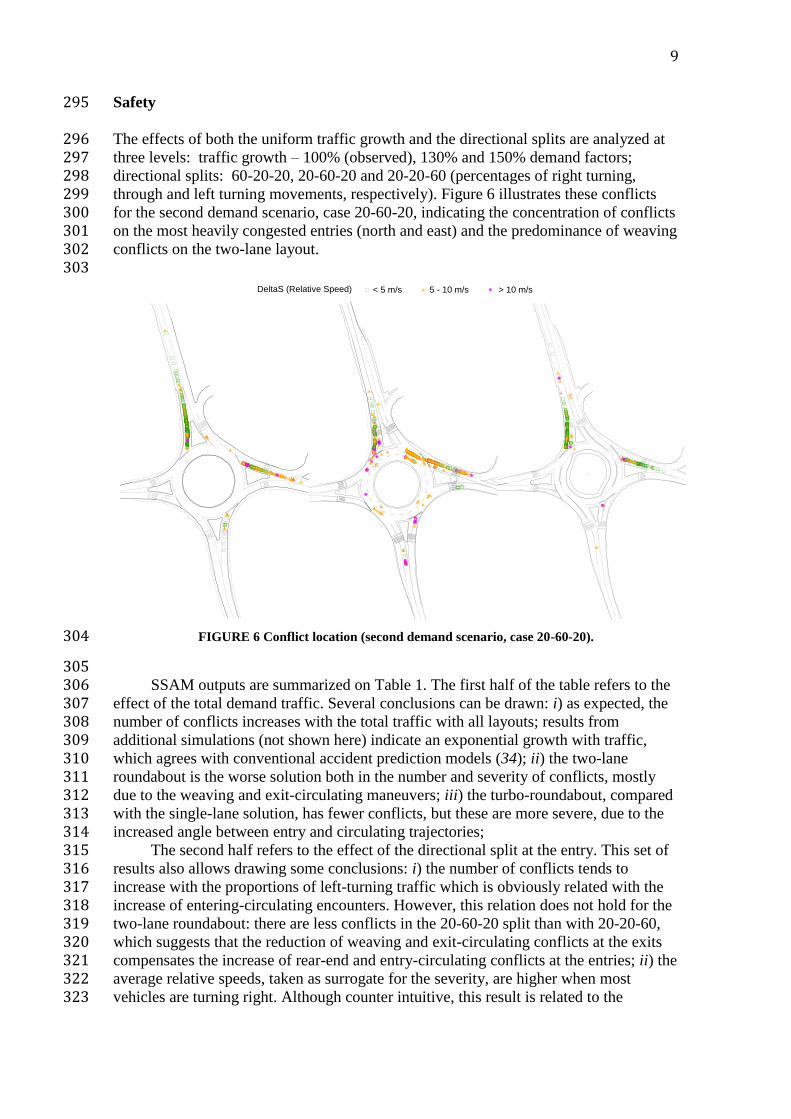
The effects of both the uniform traffic growth and the directional splits are analyzed at 296 three levels: traffic growth – 100% (observed), 130% and 150% demand factors; 297 directional splits: 60-20-20, 20-60-20 and 20-20-60 (percentages of right turning, 298 through and left turning movements, respectively). Figure 6 illustrates these conflicts 299 for the second demand scenario, case 20-60-20, indicating the concentration of conflicts 300 on the most heavily congested entries (north and east) and the predominance of weaving 301 conflicts on the two-lane layout. 302
303
FIGURE 6 Conflict location (second demand scenario, case 20-60-20). 304
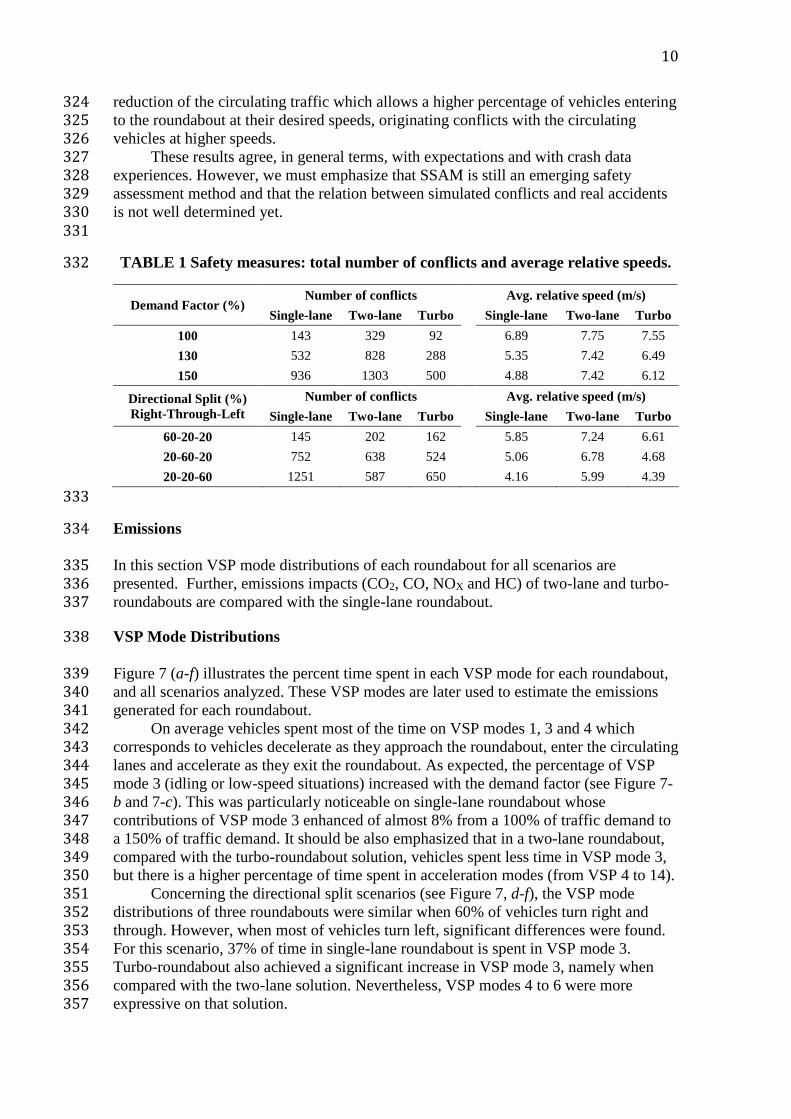
305 SSAM outputs are summarized on Table 1. The first half of the table refers to the 306
effect of the total demand traffic. Several conclusions can be drawn: i) as expected, the 307 number of conflicts increases with the total traffic with all layouts; results from 308 additional simulations (not shown here) indicate an exponential growth with traffic, 309 which agrees with conventional accident prediction models (34); ii) the two-lane 310 roundabout is the worse solution both in the number and severity of conflicts, mostly 311 due to the weaving and exit-circulating maneuvers; iii) the turbo-roundabout, compared 312 with the single-lane solution, has fewer conflicts, but these are more severe, due to the 313 increased angle between entry and circulating trajectories; 314
The second half refers to the effect of the directional split at the entry. This set of 315 results also allows drawing some conclusions: i) the number of conflicts tends to 316 increase with the proportions of left-turning traffic which is obviously related with the 317 increase of entering-circulating encounters. However, this relation does not hold for the 318 two-lane roundabout: there are less conflicts in the 20-60-20 split than with 20-20-60, 319 which suggests that the reduction of weaving and exit-circulating conflicts at the exits 320 compensates the increase of rear-end and entry-circulating conflicts at the entries; ii) the 321 average relative speeds, taken as surrogate for the severity, are higher when most 322 vehicles are turning right. Although counter intuitive, this result is related to the 323
DeltaS (Relative Speed) < 5 m/s 5 - 10 m/s > 10 m/s
10
reduction of the circulating traffic which allows a higher percentage of vehicles entering 324 to the roundabout at their desired speeds, originating conflicts with the circulating 325 vehicles at higher speeds. 326
These results agree, in general terms, with expectations and with crash data 327 experiences. However, we must emphasize that SSAM is still an emerging safety 328 assessment method and that the relation between simulated conflicts and real accidents 329 is not well determined yet. 330
331
TABLE 1 Safety measures: total number of conflicts and average relative speeds. 332
Demand Factor (%) Number of conflicts Avg. relative speed (m/s)
Single-lane Two-lane Turbo Single-lane Two-lane Turbo
100 143 329 92 6.89 7.75 7.55
130 532 828 288 5.35 7.42 6.49
150 936 1303 500 4.88 7.42 6.12
Directional Split (%)
Right-Through-Left
Number of conflicts Avg. relative speed (m/s)
Single-lane Two-lane Turbo Single-lane Two-lane Turbo
60-20-20 145 202 162 5.85 7.24 6.61
20-60-20 752 638 524 5.06 6.78 4.68
20-20-60 1251 587 650 4.16 5.99 4.39
333
Emissions 334
In this section VSP mode distributions of each roundabout for all scenarios are 335 presented. Further, emissions impacts (CO2, CO, NOX and HC) of two-lane and turbo-336 roundabouts are compared with the single-lane roundabout. 337
VSP Mode Distributions 338
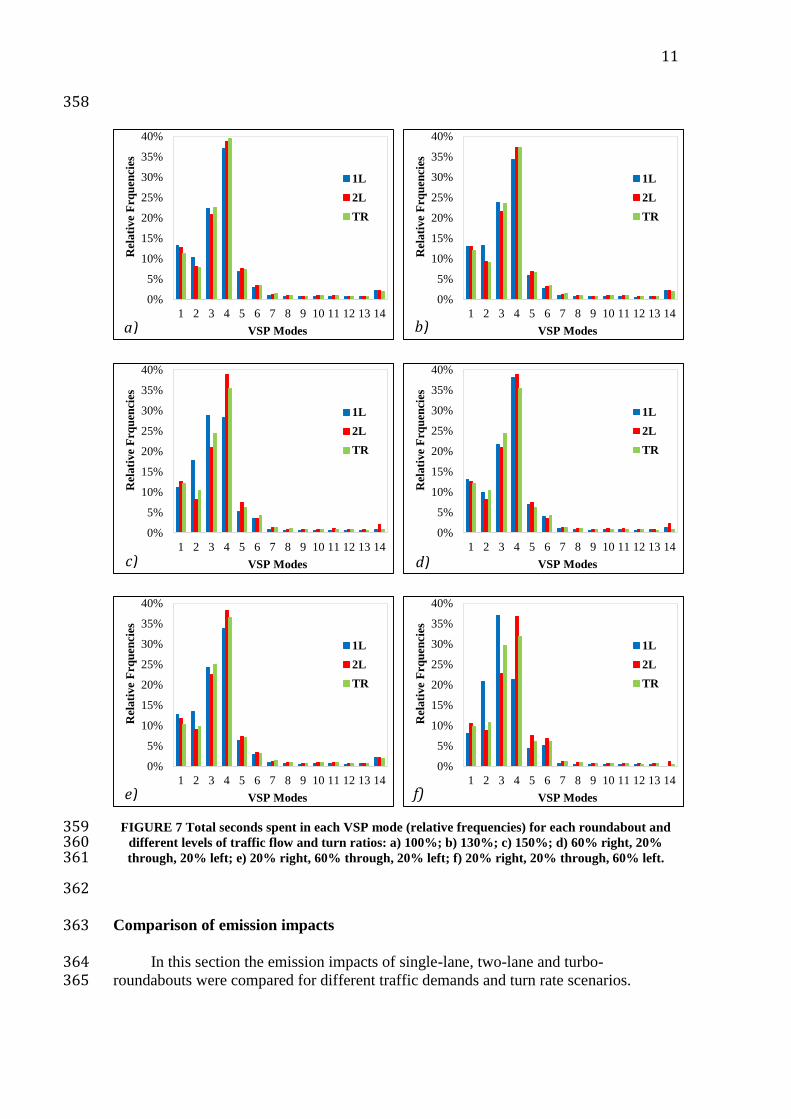
Figure 7 (a-f) illustrates the percent time spent in each VSP mode for each roundabout, 339 and all scenarios analyzed. These VSP modes are later used to estimate the emissions 340 generated for each roundabout. 341
On average vehicles spent most of the time on VSP modes 1, 3 and 4 which 342 corresponds to vehicles decelerate as they approach the roundabout, enter the circulating 343 lanes and accelerate as they exit the roundabout. As expected, the percentage of VSP 344 mode 3 (idling or low-speed situations) increased with the demand factor (see Figure 7-345 b and 7-c). This was particularly noticeable on single-lane roundabout whose 346 contributions of VSP mode 3 enhanced of almost 8% from a 100% of traffic demand to 347 a 150% of traffic demand. It should be also emphasized that in a two-lane roundabout, 348 compared with the turbo-roundabout solution, vehicles spent less time in VSP mode 3, 349 but there is a higher percentage of time spent in acceleration modes (from VSP 4 to 14). 350
Concerning the directional split scenarios (see Figure 7, d-f), the VSP mode 351 distributions of three roundabouts were similar when 60% of vehicles turn right and 352 through. However, when most of vehicles turn left, significant differences were found. 353 For this scenario, 37% of time in single-lane roundabout is spent in VSP mode 3. 354 Turbo-roundabout also achieved a significant increase in VSP mode 3, namely when 355 compared with the two-lane solution. Nevertheless, VSP modes 4 to 6 were more 356 expressive on that solution. 357
11
358
FIGURE 7 Total seconds spent in each VSP mode (relative frequencies) for each roundabout and 359 different levels of traffic flow and turn ratios: a) 100%; b) 130%; c) 150%; d) 60% right, 20% 360 through, 20% left; e) 20% right, 60% through, 20% left; f) 20% right, 20% through, 60% left. 361
362
Comparison of emission impacts 363
In this section the emission impacts of single-lane, two-lane and turbo-364 roundabouts were compared for different traffic demands and turn rate scenarios. 365
0%
5%
10%
15%
20%
25%
30%
35%
40%
1 2 3 4 5 6 7 8 9 10 11 12 13 14
Rel
ati
ve
Frq
uen
cies
VSP Modes
1L
2L
TR
0%
5%
10%
15%
20%
25%
30%
35%
40%
1 2 3 4 5 6 7 8 9 10 11 12 13 14
Rel
ati
ve
Frq
uen
cies
VSP Modes
1L
2L
TR
0%
5%
10%
15%
20%
25%
30%
35%
40%
1 2 3 4 5 6 7 8 9 10 11 12 13 14
Rel
ati
ve
Frq
uen
cies
VSP Modes
1L
2L
TR
0%
5%
10%
15%
20%
25%
30%
35%
40%
1 2 3 4 5 6 7 8 9 10 11 12 13 14
Rel
ati
ve
Frq
uen
cies
VSP Modes
1L
2L
TR
0%
5%
10%
15%
20%
25%
30%
35%
40%
1 2 3 4 5 6 7 8 9 10 11 12 13 14
Rel
ati
ve
Frq
uen
cies
VSP Modes
1L
2L
TR
0%
5%
10%
15%
20%
25%
30%
35%
40%
1 2 3 4 5 6 7 8 9 10 11 12 13 14
Rel
ati
ve
Frq
uen
cies
VSP Modes
1L
2L
TR
a)
f)
e)
d)
c)
b)
12
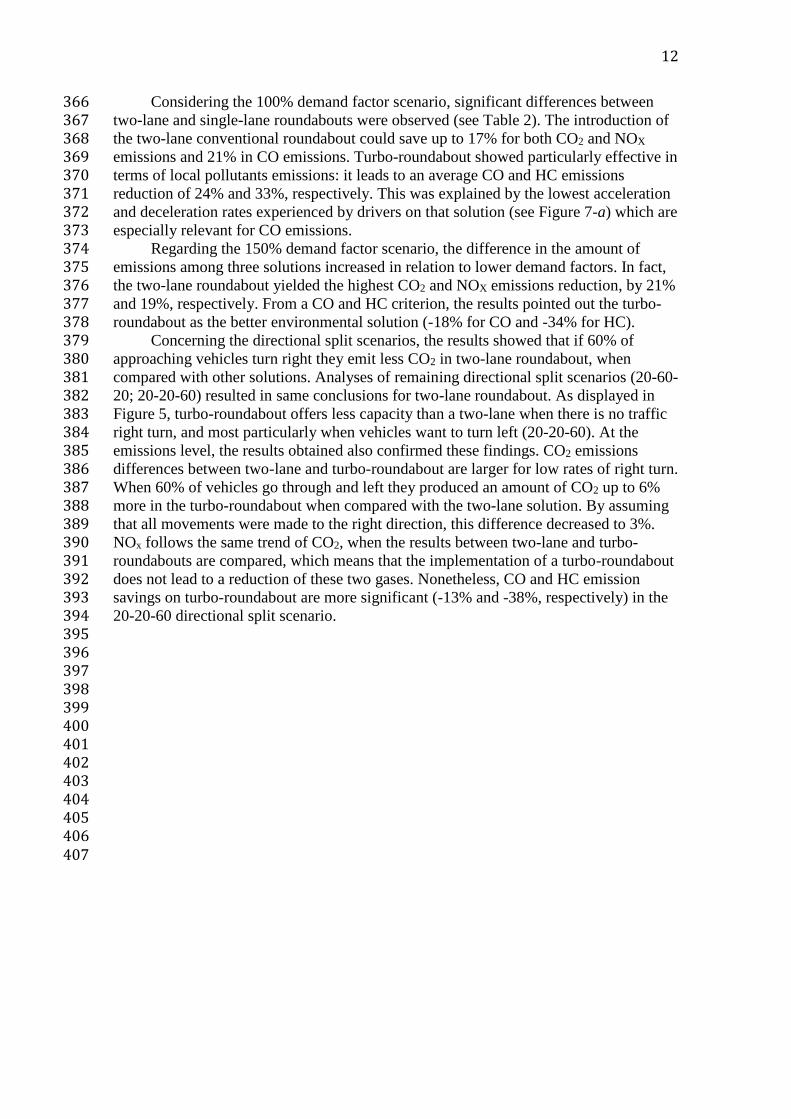
Considering the 100% demand factor scenario, significant differences between 366 two-lane and single-lane roundabouts were observed (see Table 2). The introduction of 367 the two-lane conventional roundabout could save up to 17% for both CO2 and NOX 368 emissions and 21% in CO emissions. Turbo-roundabout showed particularly effective in 369 terms of local pollutants emissions: it leads to an average CO and HC emissions 370 reduction of 24% and 33%, respectively. This was explained by the lowest acceleration 371 and deceleration rates experienced by drivers on that solution (see Figure 7-a) which are 372 especially relevant for CO emissions. 373
Regarding the 150% demand factor scenario, the difference in the amount of 374 emissions among three solutions increased in relation to lower demand factors. In fact, 375 the two-lane roundabout yielded the highest CO2 and NOX emissions reduction, by 21% 376 and 19%, respectively. From a CO and HC criterion, the results pointed out the turbo-377 roundabout as the better environmental solution (-18% for CO and -34% for HC). 378
Concerning the directional split scenarios, the results showed that if 60% of 379 approaching vehicles turn right they emit less CO2 in two-lane roundabout, when 380 compared with other solutions. Analyses of remaining directional split scenarios (20-60-381 20; 20-20-60) resulted in same conclusions for two-lane roundabout. As displayed in 382 Figure 5, turbo-roundabout offers less capacity than a two-lane when there is no traffic 383 right turn, and most particularly when vehicles want to turn left (20-20-60). At the 384 emissions level, the results obtained also confirmed these findings. CO2 emissions 385 differences between two-lane and turbo-roundabout are larger for low rates of right turn. 386 When 60% of vehicles go through and left they produced an amount of CO2 up to 6% 387 more in the turbo-roundabout when compared with the two-lane solution. By assuming 388 that all movements were made to the right direction, this difference decreased to 3%. 389 NOx follows the same trend of CO2, when the results between two-lane and turbo-390 roundabouts are compared, which means that the implementation of a turbo-roundabout 391 does not lead to a reduction of these two gases. Nonetheless, CO and HC emission 392 savings on turbo-roundabout are more significant (-13% and -38%, respectively) in the 393 20-20-60 directional split scenario. 394
395 396 397 398 399 400 401 402 403 404 405 406
407
13
TABLE 2 Variation of emissions per roundabout type in relation to the single-lane roundabout for 408 all scenarios during a 24 h period. 409
Demand Factor (%) Roundabout
Type
Emissions (kg)
CO2 CO NOX HC
100
Single-lane 3001.21 20.44 9.29 0.58
Two-lane -17% -21% -17% -20%
Turbo -15% -24% -16% -33%
130
Single-lane 3886.40 25.73 11.92 0.75
Two-lane -15% -15% -14% -17%
Turbo -14% -19% -14% -31%
150
Single-lane 4800.46 29.86 14.49 0.93
Two-lane -21% -15% -18% -22%
Turbo -19% -18% -17% -34%
Directional Split (%)
Right-Through-Left
Roundabout
Type
Emissions (kg) CO2 CO NOX HC
60-20-20
Single-lane 2576.73 13.06 7.41 0.45
Two-lane -11% -13% -10% -13%
Turbo -8% -11% -7% -26%
20-60-20
Single-lane 2899.02 18.81 8.81 0.56
Two-lane -14% -15% -13% -17%
Turbo -8% -14% -8% -27%
20-20-60
Single-lane 3751.45 18.05 10.71 0.69
Two-lane -29% -7% -23% -29%
Turbo -23% -13% -20% -38%
410
CONCLUSIONS 411
This research explored the effect of turbo-roundabouts on capacity, conflict locations 412 and emissions generated from vehicles. A microscopic simulation approach was 413 followed to identify the consequences of converting an existing single-lane roundabout 414 to a two-lane roundabout and after to a turbo-roundabout. 415
Results indicate no relevant differences on travel times when operating below 416 capacity levels and a fast increase afterwards. The single-lane roundabout is the layout 417 that offers the least capacity. Both the two-lane and turbo-roundabouts have two entry 418 lanes per approach, thus offering additional capacity. Drivers on a conventional two-419 lane roundabout have more flexibility to select the entry lane, allowing a wider range of 420 traffic splits before congestion occurs. Turbo-roundabouts offer more capacity than a 421 two-lane roundabout only under very specific and rare demand scenarios, namely when 422 the proportion of right-turns at the minor entries right turns is abnormally high (above 423 60%). 424
The SSAM methodology was followed to estimate the safety of the three 425 alternatives. The two-lane roundabout is the worse solution both in the number and 426 severity of conflicts, mostly due to the weaving and exit-circulating maneuvers. The 427 turbo-roundabout, compared with the single-lane solution, has fewer conflicts, but these 428 are more severe, due to the increased angle between entry and circulating trajectories. 429
Total emissions of vehicles moving through the roundabout were further 430 compared. By using VSP methodology taking into account speed trajectories from 431 Aimsun model, this paper estimated the second-by-second emission generated from the 432 vehicle during different acceleration-deceleration cycles. The results show that turbo-433 roundabouts produced more CO2 and NOX emissions, when compared with two-lane 434 roundabouts, thus there is no advantage on the implementation of turbo-roundabouts if 435 the major concern in a certain region is related, for instance, with NOx pollution levels. 436
14
If the priority is the reduction of CO2 emissions, a two-lane roundabout is a better 437 choice, but for other local pollutants (CO and HC) there is an advantage of a turbo-438 roundabouts. 439
Overall it becomes clear that when, namely and most commonly, due to capacity 440 considerations, it is necessary to implement a two-lane roundabout in alternative to a 441 single-lane one, a turbo-roundabout will probably be the best option unless a maximum 442 output capacity is needed. 443
ACKNOWLEDGMENTS 444
445 This work has been carried out in the framework of projects EMSURE - Energy and 446 Mobility for Sustainable Regions (CENTRO-07-0224-FEDER-002004) and AROUND 447 (FCT project PTDC/SEN-TRA/122114/2010,). TEMA team also acknowledges to FCT 448 Project PTDC/SEN-TRA/113499/2009, Strategic Project PEst-C/EME/UI0481/2011 449 and FLAD – Luso American Foundation. P. Fernandes acknowledges the support of 450 FCT for the Scholarship SFRH/BD/87402/2012. 451
452
REFERENCES 453
[1] Fortuijn, L. Turbo Roundabouts - Design Principles and Safety Performance. Transportation 454 Research Record: Journal of the Transportation Research Board, Vol. 2096, No. 1, 2009, pp. 16-24. 455 [2] Brilon, W. Studies on Roundabouts in Germany: Lessons Learned. Presented at 3rd International 456 Conference on Roundabouts, Carmel, Indiana, 2011. 457 [3] Tollazzi, T., M. Rencelj, and S. Turnsek. Slovenian Experiences with Alternative Types of 458 Roundabouts - “Turbo” and “Flower” Roundabouts. Presented at 8th International Conference on 459 Environmental Engineering, Vilnius, LITHUANIA, 2011. 460 [4] Trueblood, M. Retrofitting closely spaced intersections using the Peanut Turbo Roundabout concept. 461 Presented at 3rd International Conference on Roundabouts, Carmel, Indiana, 2011. 462 [5] Yperman, I., and L. H. Immers. Capacity of a turbo-roundabout determined by micro-simulation. 463 Presented at 10th World Congress on ITS, Madrid, Spain, 2003. 464 [6] Engelsman, J. C., and M. Uken. Turbo roundabouts as an alternative to two lane roundabouts. 465 Presented at 26th Annual Southern African Transport Conference, South Africa, 2007. 466 [7] Mauro, R., and F. Branco. Comparative Analysis of Compact Multilane Roundabouts and Turbo-467 Roundabouts. Journal of Transportation Engineering, Vol. 136, No. 4, 2010, pp. 316-322. 468 [8] Vasconcelos, A. L. P., A. Bastos Silva, and Á. J. M. Seco. Capacity of normal and turbo-roundabouts 469 – comparative analysis. Proceedings of the Institution of Civil Engineers – Transport, 2013. 470 [9] Mauro, R., and M. Cattani. Potential Accident Rate of Turbo-Roundabouts. Presented at 4th 471 International Symposium on Highway Geometric Design, Valencia, Spain, 2010. 472 [10] Rodegerdts, L., J. Bansen., C. Tiesler, E. J. Knudsen, and M. Myers. Roundabouts: An Informational 473 Guide, Second Edition - NCHRP Report 672.In, Transportation Research Board, National Research 474 Council, Washington, DC, USA, 2010. 475 [11] Chen, Y., B. Persaud, E. Sacchi, and M. Bassani. Investigation of models for relating roundabout 476 safety to predicted speed. Accident Analysis & Prevention, Vol. 50, No. 0, 2013, pp. 196-203. 477 [12] Salamati, K., M. C. Coelho, P. J. Fernandes, N. M. Rouphail, H. C. Frey, and J. Bandeira. Emission 478 Estimation at Multilane Roundabouts: Effect of Movement and Approach Lane.In Transportation 479 Research Board 92nd Annual Meeting, 2013. 480 [13] Anya, A. R., N. M. Rouphail, H. C. Frey, and B. Liu. Method and Case Study for Quantifying Local 481 Emissions Impacts of a 3 Transportation Improvement Project Involving Road Re-Alignment and 4 482 Conversion to a Multi-Lane Roundabout. Presented at 92nd Transportation Research Board Annual 483 Meeting, Washington, D.C., 2013. 484

15
[14] Coelho, M. C., T. L. Farias, and N. M. Rouphail. Effect of roundabout operations on pollutant 485 emissions. Transportation Research Part D: Transport and Environment, Vol. 11, No. 5, 2006, pp. 333-486 343. 487 [15] Barceló, J., and J. Casas. Dynamic network simulation with AIMSUN.In Simulation Approaches in 488 Transportation Analysis, Springer, 2005. pp. 57-98. 489 [16] Tian, Z., T. Urbanik, R. Engelbrecht, and K. Balke. Variations in Capacity and Delay Estimates from 490 Microscopic Traffic Simulation Models. Transportation Research Record: Journal of the Transportation 491 Research Board, Vol. 1802, No. -1, 2002, pp. 23-31. 492 [17] Pu, L., and R. Joshi. Surrogate Safety Assessment Model (SSAM) - software user manual.In, U.S. 493 Department of Transportation - Federal Highway Administration, 2008. 494 [18] Cunto, F., and F. F. Saccomanno. Calibration and validation of simulated vehicle safety performance 495 at signalized intersections. Accident Analysis & Prevention, Vol. 40, No. 3, 2008, pp. 1171-1179. 496 [19] Duong, D., F. F. Saccomanno, and B. R. Hellinga. Calibration of microscopic traffic model for 497 simulating safety performance. Presented at 89th Annual TRB Conference, Washington, DC, 2010. 498 [20] Al-Ghandour, M., B. Schroeder, B. Williams, and W. Rasdorf. Conflict Models for Single-Lane 499 Roundabout Slip Lanes from Microsimulation. Transportation Research Record: Journal of the 500 Transportation Research Board, Vol. 2236, No. -1, 2011, pp. 92-101. 501 [21] Gettman, D., L. Pu, T. Sayed, and S. G. Shelby. Surrogate safety assessment model and validation: 502 final report.In, FHWA, 2008. 503 [22] Vogel, K. A comparison of headway and time to collision as safety indicators. Accident Analysis & 504 Prevention, Vol. 35, No. 3, 2003, pp. 427-433. 505 [23] Gettman, D., and L. Head. Surrogate Safety Measures from Traffic Simulation Models. 506 Transportation Research Record: Journal of the Transportation Research Board, Vol. 1840, No. -1, 507 2003, pp. 104-115. 508 [24] Laureshyn, A., Å. Svensson, and C. Hydén. Evaluation of traffic safety, based on micro-level 509 behavioural data: Theoretical framework and first implementation. Accident Analysis & Prevention, Vol. 510 42, No. 6, 2010, pp. 1637-1646. 511 [25] US EPA. Methodology for developing modal emission rates for EPA’s multi-scale motor vehicle & 512 equipment emission system. Prepared by North Carolina State University for US EPA, Ann Arbor, MI, 513 August, EPA420, 2002. 514 [26] Frey, H. C., K. Zhang, and N. M. Rouphail. Fuel Use and Emissions Comparisons for Alternative 515 Routes, Time of Day, Road Grade, and Vehicles Based on In-Use Measurements. Environmental Science 516 & Technology, Vol. 42, No. 7, 2008, pp. 2483-2489. 517 [27] Coelho, M. C., H. C. Frey, N. M. Rouphail, H. Zhai, and L. Pelkmans. Assessing methods for 518 comparing emissions from gasoline and diesel light-duty vehicles based on microscale measurements. 519 Transportation Research Part D: Transport and Environment, Vol. 14, No. 2, 2009, pp. 91-99. 520 [28] ACAP. Automobile Industry Statistics 2010 Edition. ACAP – Automobile Association of Portugal, 521 2012. 522 [29] Bastos Silva, A., and Á. J. M. Seco. Dimensionamento de Rotundas - Documento Síntese.In 523 Disposições Normativas, INIR - Instituto de Infraestruturas Rodoviárias, 2012. 524 [30] Royal Haskoning DHV. Roundabouts - Application and Design.In, Ministry of Transport, Public 525 Works and Water management, 2009. 526 [31] CROW. Turborotondes, publicatie 257. Ede, april, 2008. 527 [32] Vasconcelos, A. L. P., Á. J. M. Seco, and A. Bastos Silva. Hybrid calibration of microscopic 528 simulation models.In Advances in Intelligent Systems and Computing, Springer, 2013. 529 [33] Hagring, O., N. M. Rouphail, and H. A. Sørensen. Comparison of Capacity Models for Two-Lane 530 Roundabouts. Transportation Research Record 1852, 2003, pp. 114-123. 531 [34] Sacchi, E., M. Bassani, and B. Persaud. Comparison of Safety Performance Models for Urban 532 Roundabouts in Italy and Other Countries. Transportation Research Record: Journal of the 533 Transportation Research Board, Vol. 2265, No. -1, 2011, pp. 253-259. 534
535