turbotick web trader manual v 1.3 updated 2/27/ · pdf filefibonacci retracement 8. fibonacci...
TRANSCRIPT

Page 1 of 17
TurboTick Web Trader Manual v 1.3 updated 2/27/2014

Page 2 of 17
Contents WATCHLIST .................................................................................................................................................................3
CHARTS .......................................................................................................................................................................4
TOP LISTS ....................................................................................................................................................................7
ORDER ENTRY .............................................................................................................................................................8
OPTION CHAIN ......................................................................................................................................................... 10
OPEN ORDERS / CLOSED POSITIONS / OPEN POSITIONS ........................................................................................ 11
ACCOUNT SUMMARY / BUYING POWER ................................................................................................................. 12
SYMBOL SEARCH...................................................................................................................................................... 13
NEWS ....................................................................................................................................................................... 14
PROPERTIES / SETTINGS .......................................................................................................................................... 15
LINKING WINDOWS ................................................................................................................................................. 16
NESTING WINDOWS ................................................................................................................................................ 17

Page 3 of 17
WATCHLIST
The watchlist window provides a real-time, tick-for-tick streaming view of user defined symbols. Users can set a
list of up to 20 symbols to watch. Column order can be rearranged and each of the rows can be sorted by
clicking on the column header. For example, clicking in the symbol column will sort all symbols alphabetically.
Symbols can be entered from the top text box, and symbols deleted just by clicking on the symbol and pressing
the delete key on the key board. The Settings for the window can be launched by clicking the Prop button in the
upper right hand corner.
Available columns are:
1. Symbol
2. Tick
3. % Change
4. $ Change
5. Last
6. Last Volume
7. Volume
8. Open
9. High
10. Bid
11. Bid Volume
12. Ask
13. Ask Volume
14. Low Close
15. Year High
16. Year Low
17. Country
18. Currency
Page 4 of 17
19. Exchange
20. Symbol Description
21. Time
CHARTS
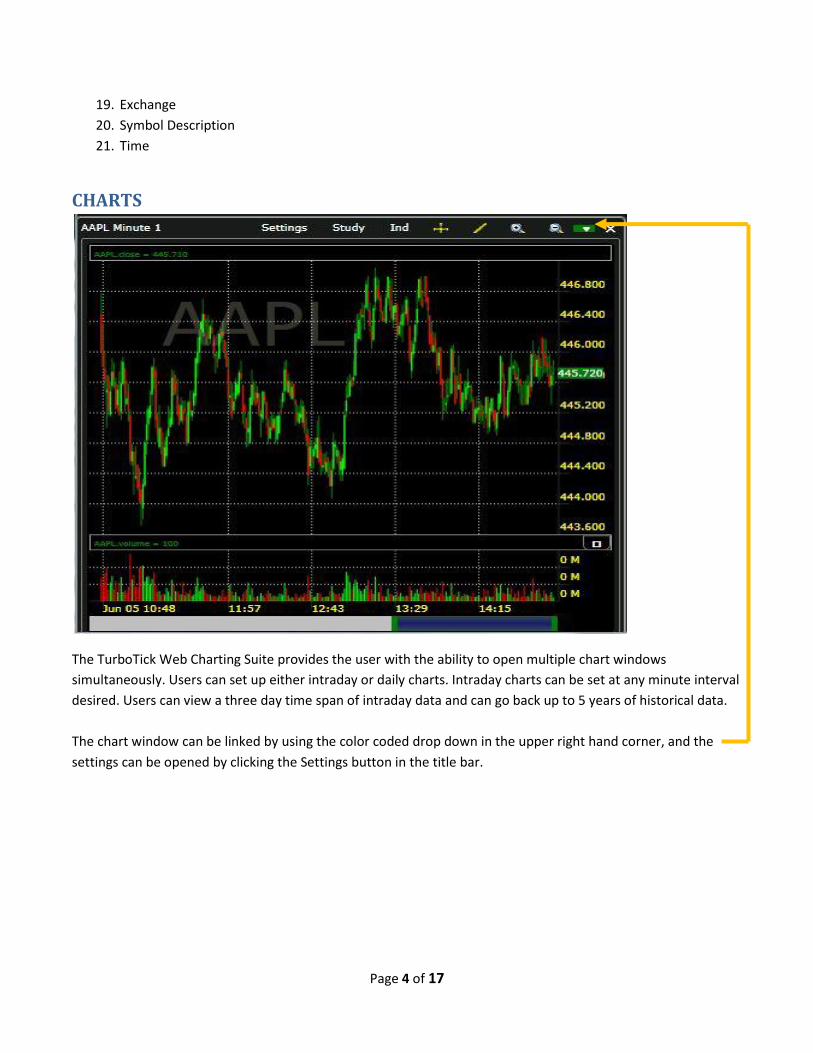
The TurboTick Web Charting Suite provides the user with the ability to open multiple chart windows
simultaneously. Users can set up either intraday or daily charts. Intraday charts can be set at any minute interval
desired. Users can view a three day time span of intraday data and can go back up to 5 years of historical data.
The chart window can be linked by using the color coded drop down in the upper right hand corner, and the
settings can be opened by clicking the Settings button in the title bar.

Page 5 of 17
The chart can be zoomed in or out by clicking the + or – magnifying glass on the chart toolbar. Zooming and scaling can also be done by dragging the bottom green slider at the bottom of the chart to the right or left.
Multiple line studies can be drawn onto the charts. Line types include:
1. Standard drawing line
2. Vertical line
3. Ellipse
4. Error Channel
5. Fibonacci Arcs
6. Fibonacci fan
7. Fibonacci retracement
8. Fibonacci time zone
9. Gann fan
10. Quadrant line
11. Raff regression
12. Rectangle
13. Speed lines
14. Tirone levels
15. Trend line
Drawing objects can be removed by doing the following:
1. Select the line or object by left clicking
2. Hold the mouse pointer over it until the object is highlighted
3. Left click on the object and a submenu will pop up with an edit and delete option
Page 6 of 17
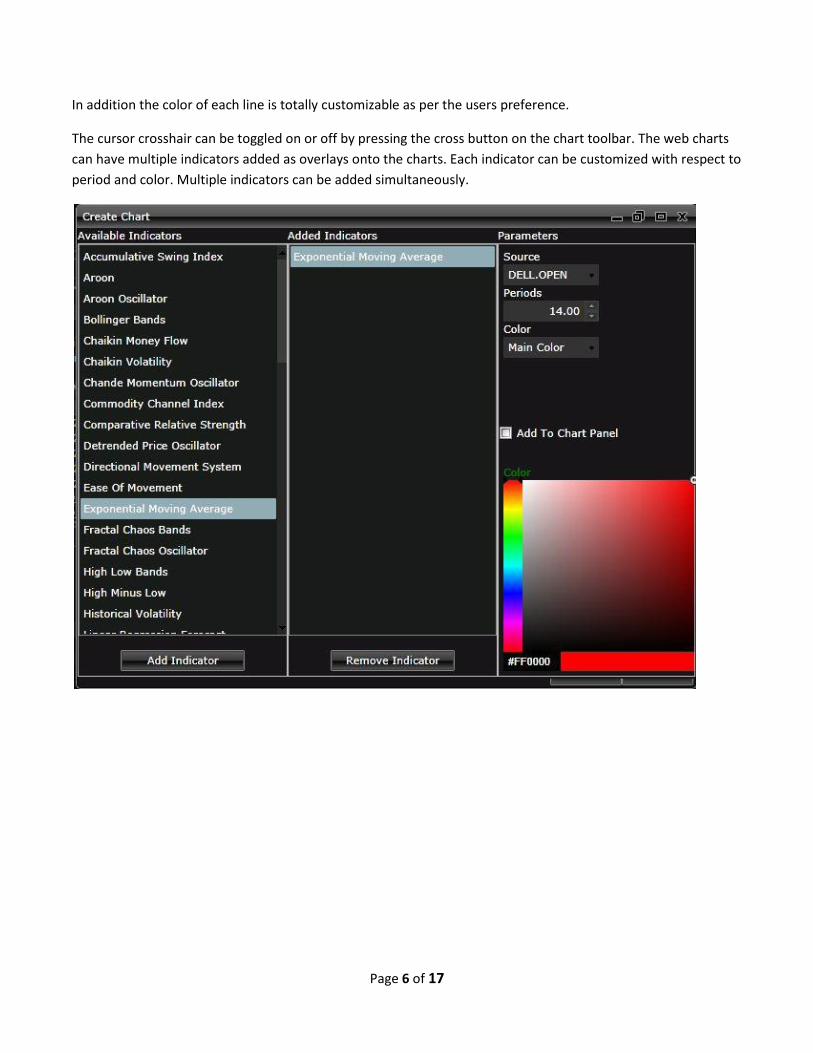
In addition the color of each line is totally customizable as per the users preference.
The cursor crosshair can be toggled on or off by pressing the cross button on the chart toolbar. The web charts
can have multiple indicators added as overlays onto the charts. Each indicator can be customized with respect to
period and color. Multiple indicators can be added simultaneously.

Page 7 of 17
TOP LISTS
The TurboTick web platform includes the Top List window, which shows the top 50 symbols in each category for each exchange. The exchanges currently covered are:
1. NYSE 2. AMEX 3. NASDAQ 4. OTCBB 5. Pink Sheets
The list filters for each exchange are:
1. Most Active 2. Percent Change Up 3. Percent Change Down 4. Net Change Up 5. Net Change Down
The Top List window can be added to a link group by using the link group drop down in the upper right hand
corner, and the properties for the window can be opened by clicking Prop. in the window’s title bar.
To change and select a different top list select the drop down arrow in the title field.
Page 8 of 17
ORDER ENTRY
Equities
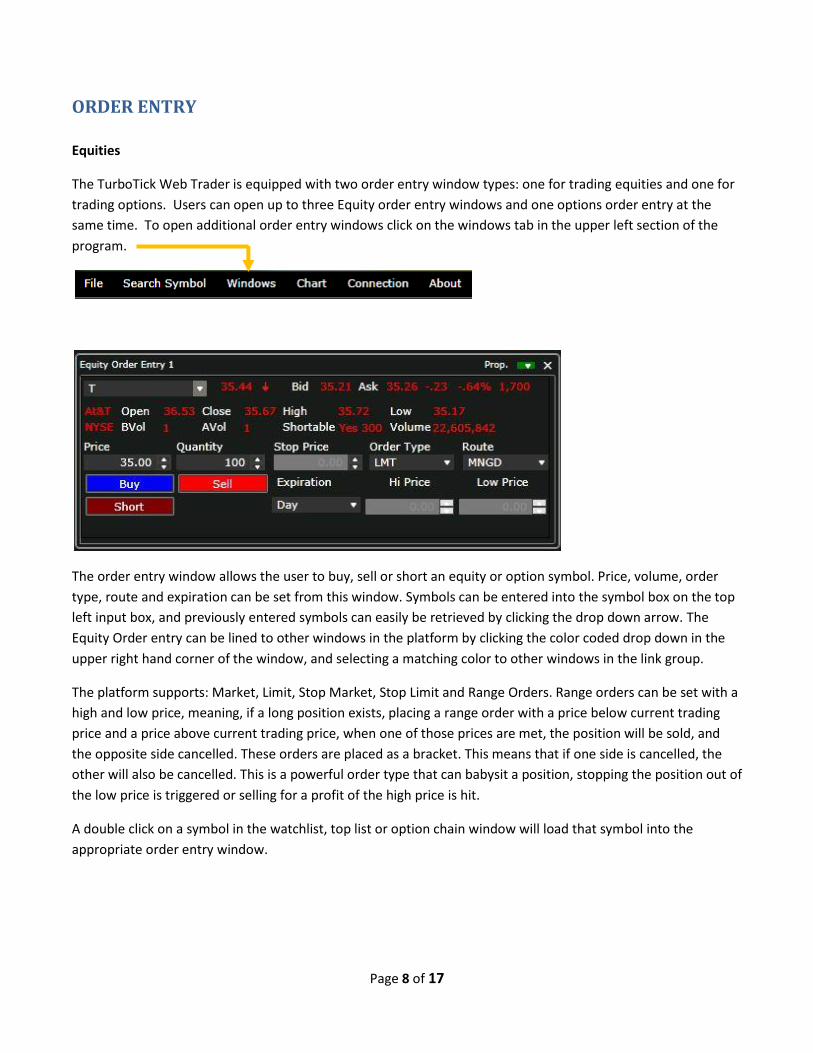
The TurboTick Web Trader is equipped with two order entry window types: one for trading equities and one for
trading options. Users can open up to three Equity order entry windows and one options order entry at the
same time. To open additional order entry windows click on the windows tab in the upper left section of the
program.
The order entry window allows the user to buy, sell or short an equity or option symbol. Price, volume, order
type, route and expiration can be set from this window. Symbols can be entered into the symbol box on the top
left input box, and previously entered symbols can easily be retrieved by clicking the drop down arrow. The
Equity Order entry can be lined to other windows in the platform by clicking the color coded drop down in the
upper right hand corner of the window, and selecting a matching color to other windows in the link group.
The platform supports: Market, Limit, Stop Market, Stop Limit and Range Orders. Range orders can be set with a
high and low price, meaning, if a long position exists, placing a range order with a price below current trading
price and a price above current trading price, when one of those prices are met, the position will be sold, and
the opposite side cancelled. These orders are placed as a bracket. This means that if one side is cancelled, the
other will also be cancelled. This is a powerful order type that can babysit a position, stopping the position out of
the low price is triggered or selling for a profit of the high price is hit.
A double click on a symbol in the watchlist, top list or option chain window will load that symbol into the
appropriate order entry window.

Page 9 of 17
Options
The options order entry is linked to the options chain by default. Once a symbol is double clicked on, that
contract will automatically populate into the options order entry. Option positions are entered by using either
the Buy to Open or Sell to Open buttons, and positions are closed using the corresponding Sell to Close or Buy to
Close.

Page 10 of 17
OPTION CHAIN
The option chain window shows all available months and strike prices for both calls and puts. Strike prices are
displayed in groups of ten at a time. Available months and strikes within those months can be toggled just by
clicking the corresponding tab at the top portion of the window. Once the underlying symbol is entered into the
symbol box at the top of the window, the tab is defaulted to the current month’s at the money strikes, based on
the current price of the underlying security.
The option chain window is linked by default with the options order entry, but can also be linked to other
windows using the color coded link drop down in the upper right hand corner of the window. Once the chain is
linked to other windows, and symbol changes will change the underlying symbol in the option chain, thus
displaying the current at the money contracts.
Properties for the option chain window can be launched by clicking Prop in the upper right hand corner.

Page 11 of 17
OPEN ORDERS / CLOSED POSITIONS / OPEN POSITIONS
The Open Orders window shows all of the users’ open and partially filled orders. Open orders can be cancelled
by clicking the cancel button of the corresponding order. Once an open order is partially or fully executed, the
order will disappear from the Open Orders tab and then appear in either the Open or Closed Positions tabs of
the window. Cancel all equity orders can be done by clicking the Cancel all CS orders and all open option orders
can be cancelled by clicking the Cancel all OPT orders.
The Open Positions window will show all open positions that the account is holding as well as display a real-time
profit or loss for each position based on the entry price.
The Closed Position window reflects all closed positions and the realized profit or loss for each closed position.
The tabs of this window can be broken out into separate windows by simply dragging and dropping the tab away
from the window. Conversely, windows can be added as tabs back into the window by dragging the window on
top of the window and the letting go of the mouse in the yellow center box that appears.
Page 12 of 17
ACCOUNT SUMMARY / BUYING POWER
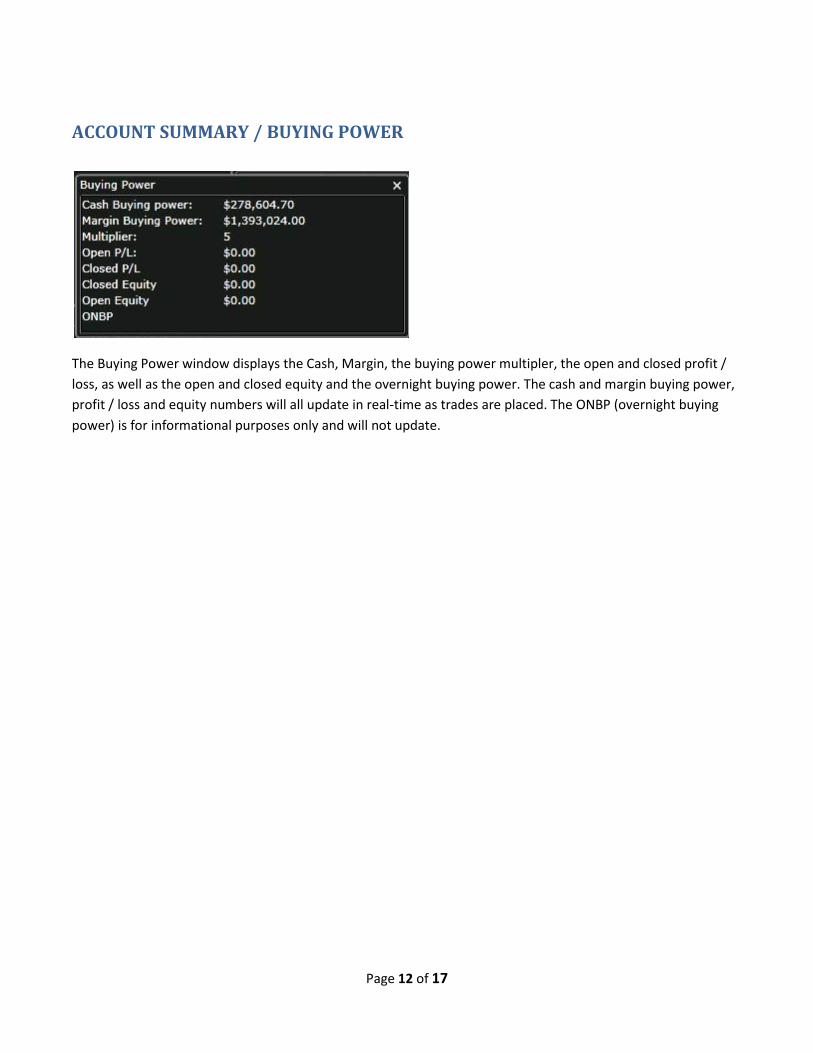
The Buying Power window displays the Cash, Margin, the buying power multipler, the open and closed profit /
loss, as well as the open and closed equity and the overnight buying power. The cash and margin buying power,
profit / loss and equity numbers will all update in real-time as trades are placed. The ONBP (overnight buying
power) is for informational purposes only and will not update.
Page 13 of 17
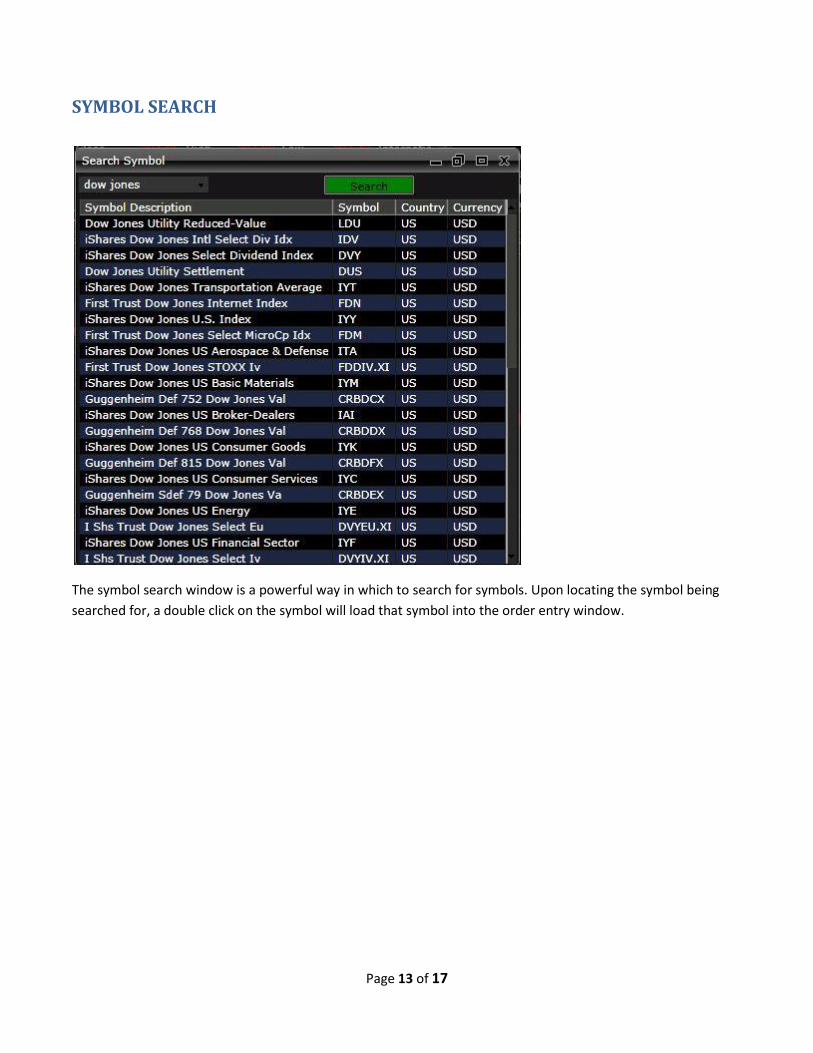
SYMBOL SEARCH
The symbol search window is a powerful way in which to search for symbols. Upon locating the symbol being
searched for, a double click on the symbol will load that symbol into the order entry window.

Page 14 of 17
NEWS
The news window streams news stories in real-time. If a filter is applied by symbol or keyword such as earnings,
only those stories will appear in the window. Double clicking on any headline will bring up the entire text of the
article in a new browser tab or window.

Page 15 of 17
PROPERTIES / SETTINGS
From the File menu of the main program toolbar, the Properties menu item can be located. This window is the
setting controller for each individual window, as well as for global settings for the entire program. Common
settings include such thing as price colors, background colors, time format, text alignment and number formats.
From this window, users can elect to enable Show Order Confirmation Message when placing an order by
checking that box. All of the colors of the platform can be set here, as well as the number of decimal places
displayed on pricing and order entry.
The Grid Columns tab provides for the ability to customize which columns are displayed in the Open Positions,
Closed Positions, Order History, Open Orders, News, Watchlist, Top List, and Options Chain.
Properties and settings can also be opened directly from any individual window by clicking on Prop in the upper
right hand corner of the window.

Page 16 of 17
LINKING WINDOWS
Windows can be linked to each other on the platform so that when a symbol is changed in one window, the
windows that it is linked to will also update with the newly changed symbol. The linking functionality is done
using the color coded drop down on the title bar of each window. Users can create up to four different linked
groups. All windows that are set with the same color are linked to the same link group.
In this image, the user has an order entry in the red linked group with the chart about to be added to the red B
link group.

Page 17 of 17
NESTING WINDOWS
One of the “coolest” features on the TurboTick Web Trader is the ability to nest windows within each other. This
is a particularly useful function to group the account management or portfolio windows together. These
windows include:
1. Open Orders
2. Open Positions
3. Closed Positions
4. Order History
5. Account Summary
However, any and all windows throughout the platform can be nested. It is also useful when dealing with
smaller monitors or monitors with low resolution, where screen real estate becomes very important. In order to
setup a nested window scenario, the first step is to right click in the top title bar of each window and click on
Dockable.
Once two windows are made dockable, click and hold the left mouse button and drag one window over the
other until you see a yellow box with 4 arrows. Once that is displayed, hover the mouse over the center square,
and the windows will now be nested, providing the ability to toggle the windows just by clicking in the newly
created tabs along the bottom of the new merged window.
To remove a window from the nested group, just left click and hold on the tab itself and drag the window out of
the group.