turkey - pan american health organization · statistics in a standard format. ... data presented in...
TRANSCRIPT

Nutrition Country Profile - TURKEY March 2001, FAO, Rome
FOOD AND AGRICULTURE ORGANIZATION
OF THE UNITED NATIONS
FAO - NUTRITION COUNTRY PROFILES
TURKEYTURKEY

Nutrition Country Profiles – TURKEY 20 March 2001 1
Note for the reader
The objective of the Nutrition Country Profiles (NCP) is toprovide concise analytical summaries describing the food andnutrition situation in individual countries with background statistics onfood-related factors. The profiles present consistent and comparablestatistics in a standard format. This pre-defined format combines aset of graphics, tables and maps each supported by a shortexplanatory text. Information regarding the agricultural production,demography and socio-economic level of the country are alsopresented.
In general, data presented in the NCP are derived from nationalsources as well as from international databases (FAO, WHO...).
Technical notes giving detailed information on the definition anduse of the indicators provided in the profile can be obtained fromESNA upon request. An information note describing the objectives ofthe NCP is also available.
Useful suggestions or observations to improve the quality of thisproduct are welcome.
The data used to prepare the maps are available in Excel uponrequest at:
E-mail: [email protected]
Nutrition Country Profile of Turkeyprepared by Food and Nutrition Division, FAO in the collaboration of Prof. Dr.Gülden Pekcan ( Hacettepe University,Department of Nutrition and Dietetics) andRosanne Marchesich (ESNA-FAO).
The designations employed and the presentation of material in this publication do not imply the expression of any opinion whatsoever on the part ofthe Food and Agriculture Organization of the United Nations concerning the legal status of any country, territory, city or area or of its authorities, orconcerning the delimitation of its frontiers .
FAO, 2001
Nutrition Country Profiles – TURKEY 20 March 2001 2
Table of contents
SUMMARY ------------------------------------------------------------------------------------------------ 3
TABLE 1: GENERAL STATISTICS OF TURKEY ----------------------------------------------- 4
I. OVERVIEW --------------------------------------------------------------------------------------------- 5
1. Geography.......................................................................................................... 52. Population .......................................................................................................... 53. Level of development: poverty, education and health ........................................ 54. Agricultural production, land use and food security ............................................ 65. Economy ............................................................................................................ 6
II. THE FOOD AND NUTRITION SITUATION --------------------------------------------------- 8
1. Trends in energy requirements and energy supplies.......................................... 82. Trends in food supplies ...................................................................................... 93. Food consumption............................................................................................ 134. Anthropometric data ......................................................................................... 155. Micronutrient deficiencies................................................................................. 20
REFERENCES ----------------------------------------------------------------------------------------- 23
MAPS are presented after the <REFERENCES>
General map of Turkey
Map 1:Prevalence of stunting among children under five years by regions
Map 2: Prevalence of underweight among children under five years by regions
Map 3: Prevalence of wasting among children under five years by regions
Graphs, tables and maps can be visualised by clicking on the words in bold andunderline, only in the “Full profile” pdf file.

Nutrition Country Profiles – TURKEY 20 March 2001 3
SUMMARY
Following the War of Independence, the Turkish Republic was founded in 1923 andTurkey proceeded to found its political and legal systems on modern, secular europeanmodels in line with the principles of first president Mustafa Kemal Atatürk. The politicalsystem of Turkey is parliamentary democracy. In Turkey, the demographic structure isrelatively young. The annual average population growth rate was 1.7% for the 1995-2000period.
Turkey has been implementing some routine and special programmes on maternal,child health and family planning for a long time. Although significant declining trend in infantand under-five mortality rates between regions, urban and rural areas, and the educationallevel of the mother were observed, the mortality rates are still high. The infant mortality andunder-five mortality rates are 42.7 and 52 per thousand live births, respectively (Table 1).Breastfeeding in Turkey is widespread. Almost all Turkish children (95%) are breastfed forsome period of time. The median duration of breastfeeding is 12 months, but supplementaryfoods and liquids are introduced at an early age. Diarrhoea is a prevalent disease of childrenunder age of five in Turkey with a prevalence of 30%. By age five 16% of children arestunted, 8.3% as underweight and 1.9% wasted. This situation indicates that there was alittle change in the nutritional status of children within the five year period (Table 4a, Maps 1,Map 2 & Map 3).
Obesity is a problem among child-bearing age of women. According to Body MassIndex calculations 52.2 % of women are overweight (BMI >25 kg/m2), of which 18.8% areobese (BMI >30 kg/m2). Chronic undernutrition among adult women is not a problem. Only2.6 % of women had Body Mass Index below 18.5 kg/m2(Table 4c). Micronutrientdeficiences are important problems of under-five years old children, preschool children andchild-bearing age women.
According to FAO Food Balance Sheets, Turkish people appeared to be wellnourished. But maldistribution of food, and quality are not properly demonstrated. Over thepast years, a number of nutrition surveys have been conducted on regional levels coveringsocio-economic, age and gender groups. There is a great need for a nation-wide survey inorder to put out the changes in social, economic and nutritional status, showing the trendsand that the findings could be used in food and nutrition policies. Although such survey isplanned, and there is a man-power for it, due to financial restrictions, it could not be done. Wheat is a staple food for the Turkish people. The major percentage of energy comesfrom bread (44%) and bread with other cereals (58%)(Figure 3). Yogurt is the mostfrequently used milk product. Fresh fruits and vegetables are available throughout the year,and widely consumed. Oil and fat consumption show regional variations, as olive oil is mostlyconsumed in western and southern parts (Figure 1). The average diet is adequate to meetrecommended daily intake of energy and most of the nutrients while animal protein, calcium,vitamin A (Table 5) and riboflavin are lower than the recommended daily allowances. Usuallythree meals are eaten in the country. The results of regional surveys indicate that there aredifferences among families, sub-groups and seasons in terms of energy and nutrient intakes.The most important parameter influencing food consumption pattern is income level and lackof knowledge. The problem is not the availability of food but its maldistribution.
Turkey has the opportunity to provide its population to lead healthier and longerlives.The attainment of this aim depends on the implementation of rational policies andmanagement of resources. Eight Five Year Plan and Supplementary Documents (2001-2005) are prepared to fill this demand.

Last updated: 04-10-00 Indicator (§) Year Unit Indicator (§) Year Unit
A. Land in use for agriculture G. Average Food Supply1. Agricultural land 1995 ha per person 0,6452. Arable and permanent crop land 1995 ha per person 0,443 1. Dietary Energy Supply (DES) 1996-98 Kcal/caput/day 3500
B. Livestock1. Cattle 1996-98 thousands 116172. Sheep & goats 1996-98 thousands 411563. Pigs 1996-98 thousands 54. Chickens 1996-98 millions 150
C. Population1. Total population 1998 thousands 644792. 0-5 years 1998 % of total pop. 12,23. 6-17 years 1998 % of total pop. 23,44. 18-59 years 1998 % of total pop. 56,15. >= 60 years 1998 % of total pop. 8,46. Rural population 1998 % of total pop. 27,17. Annual population growth rate, Total 1995-2000 % of total pop. 1,78. Annual population growth rate, Rural 1995-2000 % of rural pop. -2,79. Projected total population in 2030 2030 thousands 91295
10. Agricultural population 1995 % of total pop. 33,911. Population density 1995 pop. per sq Km 79,1
D. Level of Development1. GNP per capita, Atlas Method 1997 current US$ 3.1302. Human Development Index rating (new) 1997 min[0] - max[1] 0,728
3. Incidence of poverty, Total ... % of population4. Incidence of poverty, Rural or Urban ... % of population % Energy from:5. Life expectancy at birth (both sexes) 1998 years 69,1 2. Protein 1996-98 % of total energy 11.56. Under-five mortality rate 1998 per 1,000 live births 42 3. Fat 1996-98 % of total energy 24.2
E. Food Trade 4. Proteins 1996-98 g/caput/day 981. Food Imports (US $) 1996-98 % of total imports 4,0 5. Vegetable products 1996-98 % of total proteins 73,62. Food Exports (US $) 1996-98 % of total exports 15,0 6. Animal products 1996-98 % of total proteins 26,43. Cereal Food Aid (100 MT) 1996-98 % of cereals imports 0,0
H. Food InadequacyF. Indices of Food Production 1. Total population "undernourished" 1995-97 m illions 1,01. Food Production Index 1996-98 1989-91=100 111,6 2. % population "undernourished" 1995-97 % of total pop. 2,02. Food Production Index Per Capita 1996-98 1989-91=100 98,8
TABLE 1: GENERAL STATISTICS OF TURKEY
... no data available § see References for data sources used See Technical Notes for definitions used.
Percentage of DES by major food groups
47%
4%9%
6%
8%
14%
7%
1%3%
Cereals (excl. beer)Starchy rootsSweetenersPulses, nuts, oilcropsFruits & VegetablesVegetable oilsAnimal FatsMeat & offalsFish & seafoodMilk & EggsOther
Note: Value not indicated if below 1%

Nutrition Country Profiles – TURKEY 20 March 2001 5
TURKEYI. OVERVIEW
1. GeographyTurkey is located in the northern half of the hemisphere, in an area where the Asian,
European and African continents come very close to each other, and surrounded from west toeast by Greece, Bulgaria, Georgia, Armenia, Azerbaijan (Nakhichevan), Iran, Iraq and Syria(General map). Turkey has been separated into seven large geographical regions by takinginto consideration the factors such as climate, natural plant distribution and types ofagriculture: the Mediterranean, Aegean, Black Sea, Marmara, Central Anatolia, EasternAnatolia and Southeastern Anatolia Regions. The actual surface area of Turkey inclusive ofits lakes and rivers, is 814,578 square kilometers, and has land area in both Europe (3%) andAsia (97%). The coastlines of the country are surrounded by the Black Sea, Aegean Sea, TheMarmara Sea and the Mediterranean. The climate is characterized by variations oftemperature and rainfall, depending on topography. Dry and hot summers, cold and rainywinters are the typical climatic conditions of Turkey.
2. PopulationThe population of Turkey is 62.3 million according to 1997 census, of which 72.9%
of the population live in urban settlements (Table 1) (Table 2) (FAOSTAT, 1999).Population density is 79.1 inhabitants per square kilometer. The annual average populationgrowth rate was 1.7% for the 1995-2000 period. The projected population is estimated to be91.3 million by the year 2030. The demographic structure of Turkey is relatively young. Thecrude birth rate is estimated at 23.4, crude death rate 6.5 per thousand, total fertility rate 2.61children per woman at the same period. There are clear variations in fertility levels by regionand education (TDHS, 1998). There is a shortage of information on mortality in Turkey,particularly adult mortality. The infant mortality rate is 42.7 per 1000 live births. The under-five mortality rate at 52 per thousand live births (TDHS,1998).
Official language of Turkey is Turkish. Turkish alphabet is Latin alphabet which wasaccepted in 1928.
3. Level of development: poverty, education and healthIn 1997, Gross National Product (GNP) was estimated at 3130 US dollars and the
Human Development Index (HDI) was 0.728 (Table 1)(World Bank, 1999; UNDP, 1997).The State Planning Organisation (SPO) has estimated that 3500 calories per day are requiredto achieve an adequate nutritional level. For practical purposes, an individual who cannotpurchase 70% of that amount (i.e., 2450 kcal.) is said to be poor. It is estimated that anincome of 27.5 USD per capita per month is needed to escape poverty. Applying SPO povertyline to the 1987 data, 14.2% of Turkish population is classified as poor. Figures for thepercentage of households below poverty line according to five regions is given in the SPOreport (SPO, 1996). The figures given in terms of five regions are adopted for all regions byusing the GNP per capita income figures for the year 1997 of each region. In the 8th Five-YearDevelopment Plan 8% of the population is indicated below the poverty line (SPO, 2000).

Nutrition Country Profiles – TURKEY 20 March 2001 6
In 1997, duration of compulsory basic education is extended to eight years which wasformerly five years. The rate for primary school attendance today is around 85.7% (SPO,2000). Despite these achievements, considerable regional and urban-rural differences inliteracy and educational attainment continue to exist in the country in addition to the genderdifferences.
Turkey, facing two kinds of problems, undernutrition and micronutrient deficiences onone side and diet related chronic diseases on the other side. However, the prevalence of thesenutritional problems varies from one region to another. In general, malnutrition is moreprevalent in rural areas, while obesity and cardiovascular diseases are more prevalent inurban areas.The most important factors responsible for malnutrition in preschool were; tooearly introduction of supplementary, illiteracy of mothers, birth rank of children, birthspacing, number of children in the family, family size, mother’s welfare and hygienicconditions. Obesity and sedantary lifestyle are the main causes of chronic diseases.
One of the major child health indicators is immunisation coverage. Among childrenage 12-23 months, the coverage rates for BCG and the first dose of DPT are 87 and 86percent, respectively. Diarrhoea is a prevalent disease of children under age five with aprevalence of 30%. AIDS is widely known. Overall 84% of women and 93% of husbandshave heard about AIDS. However, although they known AIDS, knowledge of ways to avoid itappears to be poor among a substantial minority of groups (TDHS, 1998).
4. Agricultural production, land use and food securityTurkey is a major agricultural producer with 27 million hectares of cultivated land,
20.7 million hectares of forests and 12 million hectares of pastures. Agriculture land is highlyfragmented due to inheritance. Turkey is expected to stay self-sufficient in food for theprudent future, provided that food production grows at 3-4%. Although 27.1% of the Turkishpopulation live in the rural areas, agriculture is the greatest employment sector. According tothe 1999 data, agricultural sector accounts for 14% of Gross Domestic Product (GDP), 45%of employment and 11% of exportation. The share of plant products in the total agriculturalproduction is 72.4%, that of livestock products is 21.6%, for fisheries it is 3.9% and 2.46% forforestry. Although the Gross National Product (GNP) per person in the agricultural sector isincreasing by years, it is still below the national standards. In 1999, although the nationalGNP was 3200 US dollars, it was 1350 US dollars in the agricultural sector. Turkey is aproducer of grain, cotton, tobacco, grapes, olive oil, sugar beets, pulses, hazelnuts, and tea,small and big ruminants and poultry. The share of wheat in grains is 67% (MARA, 2000).
According to the agricultural census, the owners run 90% of the farms, and 96% ofthem are farms that produce crops, while 4% are only animal breeding farms. The majority offarms that produce grains are small and geographically fragmented, family owned farms(MARA,2000).
Average per caput food consumption in Turkey is high as regards the vegetal products.However, a degree of insecurity exists among households in some areas, due principally totheir inability to acquire the food which is available. The vulnerable groups in Turkey asregards food security are the villagers without land, farmers with a small land, forestvillagers, the families who live in squatters in the cities, homeless people in the cities,working children and women farmers who are responsible for looking after a family (MARA,2000).
5. EconomyTurkey’s macro economical, commercial and agricultural policies have developed
within the rapid changes in economical, demographic and social structure. The growth of
Nutrition Country Profiles – TURKEY 20 March 2001 7
Turkish economy has initiated from a very small point and showed significant changes withinyears. In response to continuing high inflation and rapid devaluation of the Turkish Lira, thegovernment launched a stabilisation program in 1994, supported by the IMF. The core wasfiscal retrenchment aimed at reducing inflation, improving the external balance, and restoringstability in foreign exchange markets. A Stand by Agreement is also signed betweenGovernment of Turkey and the IMF in 1999, an intention letter is delivered indicating thegoals and general strategy for overcoming inflation. The government has a wide range ofprogrammes listed in The Five-Year Development Plan supporting agricultural production. Arapid increase in agricultural production is also planned through irrigation under the SouthernAnatolian Project (MARA, 1996; MARA, 2000).

Nutrition Country Profiles – TURKEY 20 March 2001 8
II. THE FOOD AND NUTRITION SITUATION
1. Trends in energy requirements and energy suppliesBetween 1965 and 1995 the population of Turkey has doubled and it is projected as
91,295 thousand by 2030. According to FAOSTAT data, between 1965 to 1997, average dailyper caput Dietary Energy Supplies (DES) increased from 2962 kcal to 3500 kcal (Table 2). Inthe same period, average daily per caput energy requirements slightly increased from 2200kcal to 2258 kcal, showing that there is not much change in energy requirement and DES ismet. In general, chronic energy deficiency is not a main problem for the adult population inTurkey. In TDHS-1998, out of total 2191 women only 2.6% had Body Mass Index (BMI)below 18.5 kg/m2, identifying cases of chronic undernutrition (TDHS, 1998).
Between 1965 and 1995 the urban population more than doubled and is projected to be87.3% by 2030 (Table 2). Nationwide economic and social conditions show that preventionof migration is not so easy. On the other hand, higher population levels of the rural areas arethreatening the natural sources. Higher rates of migration create severe social, cultural, andeconomic problems, but with long term strategies, rural population balances should finally beachieved.
Table 2: Total population, urbanisation, energy requirements and dietary energysupplies (DES) per person and per day in 1965, 1997 and 2030
Year 1965 1997 2030
Total population (thousands) 31151 62332 91295
Percentage urban (%) 34.1 70.5 87.3
Per caput energy requirements (kcal/day) 2200 2258 2249
Per caput DES (kcal/day) * 2962 3500 __* Three-year average calculated for 1964-66 and 1996-98 (Source: FAOSTAT)
Between 1965 to 1997, the share of protein, fat and carbohydrate in DES has slightlychanged by – 0.9%, 3.2% and –2.2%, respectively (Figure 1). Although within these yearsthis difference does not seem worth mentioning, the differences among families, individuals,seasons and residence should be put forward with food consumption surveys and actionsshould be taken.

Nutrition Country Profiles – TURKEY 20 March 2001 9
Figure 1: Share of protein, fat and carbohydrate in Dietary Energy Supply Trends from 1964-66 to 1996-98
64.365.466.666.966.167.466.5
12.4 12.3 12.0 12.1 12.1 11.7 11.521.0 20.2 22.0 21.0 21.3 22.8 24.2
0
500
1000
1500
2000
2500
3000
3500
4000
1964-66 1969-71 1974-76 1979-81 1984-86 1989-91 1996-98
DES
Kca
l/cap
ut/d
ay
Carbohydrates Protein Fat Source: FAOSTATTurkey
2. Trends in food supplies
Quantity: The amounts of cereals and coarse grains consumed per caput is 262.5 kgand 34.6 kg respectively (FAOSTAT, 1999). Supplies per caput of starchy roots, cereals,fruits and vegetables, vegetable oils and sweeteners have increased more markedly within theyears. Milk and milk products and eggs have undergone decrease in 1979-81 and theconsumption of meat and meat products are low. As for the fisheries, aquaculture productionincreased due to the importance given to the subsector in the last 10 years. While fishproduction in fish farms was 6% of the total fish production in 1996, it increased to 10% in1998 with a total production of 56 700 tons. In 1998, 59% of the production was realised fromthe in-land waters, while 41% was derived from the seas. Dairy products including theamount of milk sold in the streets is 20-25 L and the consumption of red meat is 14 kg perperson, that of white meat is 10 kg per person. Particularly, due to low consumption of dairyproducts, meat and eggs; iron, calcium, riboflavin and zinc deficiencies are identified in thecountry. For this purpose, various support policies for livestock production are planned to bedeveloped (MARA, 2000).

Nutrition Country Profiles – TURKEY 20 March 2001 10
Energy:In the diet pattern of Turkish population, cereals play an important role. The share of
cereals in the DES from 1964-1966 to 1996-1998 is 52.9 and 47.9, respectively. Within thelast years trends in the share of starchy roots, sweeteners, pulses and vegetable oils in DEShas been increased. The proportion of DES contributed by the vegetable oil has beenincreasing continuously and become a substitute of animal fats (Figure 3).An increase in totalfat intake is also observed for the years 1985, 1990 1997 as 17.6, 20.8 and 22.4 kg/caput/year,respectively (FAOSTAT, 1999).
Figure 2: Supplies of major food groups (in Kg/caput/year)Trends from 1964-66 to 1996-98
0
25
50
75
100
125
150
175
200
1964-66 1969-71 1974-76 1979-81 1984-86 1989-91 1996-98
Kg/c
aput
/yea
r
Cereals (excl. beer)Starchy rootsSweetenersPulses, nuts, oilcropsFruits & VegetablesVegetable oilsAnimal FatsMeat & offalsFish & seafoodMilk & EggsOther
Turkey Source: FAOSTAT

Nutrition Country Profiles – TURKEY 20 March 2001 11
Figure 3: Share of major food groups in Dietary Energy SupplyTrends from 1964-66 to 1996-98
0
500
1000
1500
2000
2500
3000
3500
4000
1964-66 1969-71 1974-76 1979-81 1984-86 1989-91 1996-98
Kcal
/cap
ut/d
ay
Cereals (excl. beer)Starchy rootsSweetenersPulses, nuts, oilcropsFruits & VegetablesVegetable oilsAnimal FatsMeat & offalsFish & seafoodMilk & EggsOther
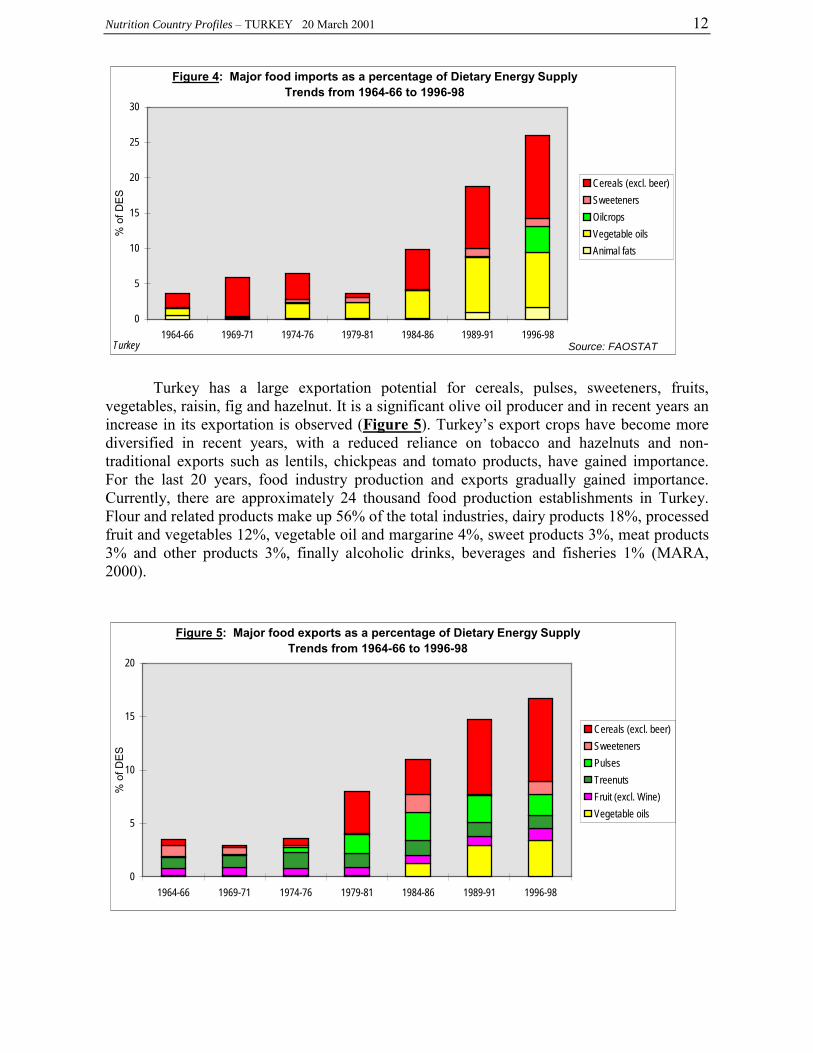
Major food imports and exports:Currently, Turkey is a net exporter of many products in agriculture, but becoming an
importer of some others. The increase in the population’s needs has raised total food imports.Demand cannot be met for such products as, sunflower, soybean, maize. Imports of vegetableoils, maize and rice increased since 1974-76 (Figure 4).
Nutrition Country Profiles – TURKEY 20 March 2001 12
Figure 4: Major food imports as a percentage of Dietary Energy SupplyTrends from 1964-66 to 1996-98
0
5
10
15
20
25
30
1964-66 1969-71 1974-76 1979-81 1984-86 1989-91 1996-98
% o
f DES
Cereals (excl. beer)SweetenersOilcrops Vegetable oils Animal fats
Turkey Source: FAOSTAT
Turkey has a large exportation potential for cereals, pulses, sweeteners, fruits,vegetables, raisin, fig and hazelnut. It is a significant olive oil producer and in recent years anincrease in its exportation is observed (Figure 5). Turkey’s export crops have become morediversified in recent years, with a reduced reliance on tobacco and hazelnuts and non-traditional exports such as lentils, chickpeas and tomato products, have gained importance.For the last 20 years, food industry production and exports gradually gained importance.Currently, there are approximately 24 thousand food production establishments in Turkey.Flour and related products make up 56% of the total industries, dairy products 18%, processedfruit and vegetables 12%, vegetable oil and margarine 4%, sweet products 3%, meat products3% and other products 3%, finally alcoholic drinks, beverages and fisheries 1% (MARA,2000).
Figure 5: Major food exports as a percentage of Dietary Energy SupplyTrends from 1964-66 to 1996-98
0
5
10
15
20
1964-66 1969-71 1974-76 1979-81 1984-86 1989-91 1996-98
% o
f DES
Cereals (excl. beer)SweetenersPulses Treenuts Fruit (excl. Wine)Vegetable oils

Nutrition Country Profiles – TURKEY 20 March 2001 13
3. Food consumptionTurkey with respect to its climate and land nature is suitable for the production of
various products. Wheat is a staple food for the Turkish people. The major percentage ofenergy comes from bread (44%) and bread with other cereals (58%). Wheat is mainlyconsumed as bread, macaroni and bulgur (parboiled pounded wheat). Maize is widely used inthe Black Sea region. Although rice is widely consumed in Turkey, the production does notmeet domestic demand, and the supply deficiency is covered by importation. Lentils,chickpeas and dry beans are the most widely consumed pulses. Meat, as lamb and beef is themain ingredient of the Turkish cuisine, but recently it has been changed, because of the highprices of meat. Yoghurt is the most frequently used milk product. Fresh vegetables and fruitsare abundantly available throughout the year, and widely consumed. The main oil seeds aresunflower, cotton and soybean. Sunflower oil has the major share on production of vegetableoil. Oil and fat consumption show regional variations as olive oil is mostly used in westernand southern parts (Aegean and Mediterranean Region) of Turkey. However margarine hasbecome a substitute of butter (Pekcan and Karaağaoğlu, 2000). Between 1991-1996, annualaverage consumption per capita is 262.5 kg of cereals and 34.6 kg of coarse grains. Theconsumption of livestock products are low, that of dairy products 20-25 L and consumption ofred meat is 14 kg per person, that of white meat is 10 kg per person (MARA,2000). Usuallythree meals are eaten in the country.
According to FAO Food Balance Sheets, Turkish people appeared to be wellnourished (FAOSTAT, 1999). The total protein consumption per capita was high, butmaldistribution and the poor quality of the food consumed in Turkey was not properlydemonstrated in food balance sheets. The food consumption patterns according to rural andurban areas in Turkey for the period 1974-1997 is presented in Table 3.
Over the past years, a number of nutrition surveys have been conducted on regionaland national levels , covering various socio-economic, age and gender groups. In 1974, anation-wide nutrition survey was held in order to provide data upon which a nutrition policymay be formulated. In 1984, a survey was held during winter and summer months in threeregions in order to put out the changes in social, economic and nutritional status, so that thefindings could be used in food and nutrition policy and planning (Köksal, 1974; Tönük et al,1984). Since than no national survey could be done due to financial restrictions. In 1997, Asurvey was conducted at 7 provinces selected by Ministry of Health (HUNDD/MOH, 1997).The results of three surveys are given in Table 3. The findings indicate that the average dietwas adequate to meet recommended daily intake of energy and most of the nutrients, whileanimal protein, calcium, vitamin A and riboflavin are lower than the recommended dailyallowances (RDA). No significant changes were observed in average per capita foodconsumption within the past 25 years. It is worth mentioning that although total fat intake didnot change a lot during this period, vegetable oil intake showed an increase at the expense ofanimal fat. Contribution of protein, fat and carbohydrate to energy are about 12%, 25% and63%, respectively. However, there are differences among families, sub-groups and seasons interms of energy and nutrient intakes. The most important parameter influencing foodconsumption pattern is income level and lack of knowledge. Low income families consumemore bread, while high income families consume more meat and meat products, fresh fruitsand vegetables. This indicates that the problem is not the unavailability of foods, but itsmaldistribution among socio-economic, gender and age groups (Pekcan and Karaağaoğlu,2000).
Breastfeeding is almost universal in Turkey. The average period of breast-feeding forall children is 13.7 months, the median duration is 12 months and 95% of all children arebreastfed for some period of time. TDHS-1998 indicates that for all children initiation to

Nutrition Country Profiles – TURKEY 20 March 2001 14
breastfeeding is rather late. Only one-half (51.8%) of ever-breastfed children were startedbreastfeeding as early as within one hour of birth. A comparison of the 1998 findings withthose of the 1993 survey indicates that both percentages of children starting breastfeedingwithin one hour and one day of life have increased since 1998. While only one-fifth ofchildren were put to breast within one hour in 1993, according to the findings of the TDHS-1998, more than half of the children has been put to the breast within one hour. Theproportion of children who were put to breast within one day has also increased from 76% in1193 to 85% in 1998. Increases in the early initiation of breastfeeding occurred in all regionsand all education groups. Even among children in the first month of life, only 14.2% wereexclusively breastfed, a figure lower than found in the TDHS-1993 (19%). The rate ofexclusive breastfeeding for the period of 0-3 months is 9.4%, while it is 1.3% for the period of4-6 months. The rate of non-breastfeeding is 7.3% for the period of 0-3 months and 22.6%during 4-6 months. Only 10.2% of breastfeeding children, age 0-3 months received no othersupplements. One in every five infants (19.6%) in this age group received infant formula. Thepercentage who were given infant formula peaks at 32.1% for infants age 4-6 months and thendecrease to 21.2% for those age 7-9 months. More than one-third (36.9%) of breastfeedingchildren age 0-3 months are fed by bottle with a nipple. Early introduction of supplementaryfood and using a bottle with a nipple increases the risk of gastrointestinal infections forchildren, which is one of the leading causes of infant mortality in Turkey (TDHS, 1998;TDHS, 1993).

Nutrition Country Profiles – TURKEY 20 March 2001 15
Table 3: Food consumption surveys
Notes:... no data available* Original data on food consumption were expressed in g/caput/day and havebeen converted to kg/caput/year
4. Anthropometric dataAdequate and balanced nutrition during childhood and the adolescent period has a
positive impact on linear growth, whereas poor nutrition and experience of a severe illnesses,particularly in early childhood, can affect growth negatively.
In presenting the anthropometric results, the nutritional status of children is comparedwith an international reference population defined by U.S. National Centre for HealthStatistics (NCHS) and U.S. Centre for Disease Control (CDC) and the World HealthOrganisation (WHO). Standard indices are used to describe the nutritional status of thechildren as height-for-age, weight-for-height, and weight-for-age (WHO, 1995; 1983). Theheight-for-age index (stunting) is an indicator of linear growth retardation among children.Stunting reflects the outcome of a failure to receive adequate nutrition over a long period oftime, and is also affected by recurrent and chronic illness. The weight-for-age index (wasting)measures body mass in relation to body length or height. Wasting shows acute weight loss,which may be due to diarrhoea, or of seasonal variations in food supply. The weight-for-age(underweight) takes into account both acute and chronic undernutrition and often used forgrowth monitoring.
The anthropometric findings from the TDHS-1998 provided data on the magnitude ofmalnutrition in a sample of 2677 preschool children from five geographical regions and on itscausal and conditioning factors (TDHS, 1998). According to the survey 16% of children are
Source/ Location Sam ple Average food intakeYearof survey
N um berhouseholds
Sex AgeYears
M ajor Food G roups (kg/caput/year)
C erea ls R oots/Tubers Pulses
Fruits/Vege-tab les
O ils/Fats M eat F ish M ilk
prod.Sweet-eners O ther
HÜN DD,M O H, 7 provinces 1075 M /F A ll 150.4 ... 6.2 192.4 11.3 28.1 1.1 56.2 9.9 ...
1997
M AR A,M O H, N ational 2400 M /F A ll 165.4 ... 13.1 149.3 16.8 15.3 2.6 38.3 15.3 4.4HÜN DD,1987 U rban 1754 154.4 ... 13.9 155.1 16.1 19.7 2.6 38.3 15.0 3.31984 R ural 646 175.6 ... 12.4 143.4 17.2 11.0 2.6 38.3 15.7 3.3
W inter 157.3 ... 17.5 176.3 15.7 17.9 3.7 32.5 17.5 2.9Sum m er 161.3 ... 9.5 188.7 16.8 19.7 1.8 24.5 14.2 4.4
Köksa l,1977 N ational 3533 M /F A ll 179.9 11.7 3.6 186.3 13.8 19.0 1.2 40.7 13.2 ...
1974 U rban 2392 156.6 12.3 4.7 197.9 15.4 24.8 1.8 36.1 14.2 ...R ural 1141 196.8 10.8 2.2 165.2 12.0 11.7 1.1 41.6 12.0 ...
Nutrient Intake (person/day)
Energy(kcals)
%Protein
%Fat
Protein(g)
%Anim al
products
Fat(g)
%Anim al
products
HÜN DD,M O H,1997 7 provinces 1075 M /F A ll 2083 12.6 26.4 66.0 41.1 61.0 ...M AR A,M O H, N ational 2400 M /F A ll 2281 11.9 24.2 68.0 30.6 62.0 ... HÜN DD,1984
1987
Köksa l,1977 N ational 3533 M /F All 2291 11.9 23.7 68.0 26.4 62.4 ...
1974Share of m ajor food groups in total energy intake (% )
C erea ls R oots/Tubers Pulses
Fruits/Vege-tab les
O ils/Fats M eat F ish M ilk
prod.Sweet-eners O ther
Köksa l,1977 N ational 3533 M /F All 58.0 1.1 1.5 9.6 13.6 5.4 0.2 5.5 6.0 ...
1974

Nutrition Country Profiles – TURKEY 20 March 2001 16
classified as stunted (height-for-age) (Map1), 8.3% as underweight (weight-for-age) (Map 2)and 1.9% as wasted (weight-for-height) (Map 3). Children are classified as malnourishedwith measurements below minus two or minus three standard deviations from the median ofthe reference population. The proportion classified as stunted exhibits a steady increasestarting in the first year of life and reaches a plateau during second and third years of life, byage five the prevalence reaches to 23.7%. These patterns reflect inadequate feeding practicesand the presence of recurrent and chronic illness.
A comparison of the 1998 findings with the results of the TDHS-1993 indicates thatthere was a little change in the nutritional status of children during the five-year period(Table 4a & Table 4a cont). Child’s age, birth order, birth interval, living in urban or ruralresidence, regional differences, mothers’ educational level are among the most importantfactors affecting protein-energy malnutrition.Among mothers who were not educated, had aprimary education level or a secondery education level the percentage of underweightchildren decreased from 31%, 11.8% and 4.0%, respectively.
Mean (SD), median height and BMI values for 10-18 years of adolescents are given inTable 4b.
The survey results show that obesity is a problem among mothers. According to BodyMass Index (BMI) calculations, 52.2% of adult women are overweight ( BMI > 25 kg/m2), ofwhich 18.8% are obese (BMI >30 kg/m2) (Table 4c).

Nutrition Country Profiles – TURKEY 20 March2001 17
Table 4a: Anthropometric data on children
Notes:... no data availableEach index is expressed in terms of the number of standard deviations (SD) units from the median of theNCHS/CDC/WHO international reference population. * Includes children who are below -3 SD.
Source/ Location SampleYear
of surveySize
NumberSex Age
Years
Underweight Stunting Wasting Overweight% Weight/Age % Height/Age % Weight/Height % Weight/Height
< -3SD < -2SD* < -3SD < -2SD < -3SD < -2SD > +2SD
TDHS, 1999 National 2677 M/F 0-4.99 1.4 8.3 6.1 16.0 0.4 1.9 ...1998 Central 643 " " 1.3 5.4 4.3 11.6 0.1 1.3 ..
East 652 " " 3.0 17.1 12.9 30.0 0.9 2.9 ...North 211 " " 0.6 4.8 2.9 12.8 0.0 1.6 ...South 407 " " 1.7 8.9 4.3 13.5 0.3 2.2 ...West 763 " " 0.2 3.8 3.6 9.9 0.2 1.5 ...
285 " 0-0.49 0.5 1.7 0.4 2.0 0.2 2.1 ...298 " 0.5-0.99 0.9 7.0 1.0 4.6 0.9 3.7 ...547 " 1 2.6 10.5 4.9 16.7 0.6 2.9 ...481 " 2 1.7 8.2 7.1 17.4 0.3 1.4 ...496 " 3 1.8 9.7 10.8 20.1 0.3 1.4 ...570 " 4 0.5 9.0 7.8 23.7 0.0 0.7 ...
URBAN 1696 " 0-4.99 0.9 6.2 4.7 12.6 0.3 1.7 ...RURAL 981 " " 2.3 11.9 8.4 22.0 0.4 2.3 ...
1415 M " 1.7 8.4 5.8 16.0 0.6 2.1 ...1261 F " 1.0 8.1 6.4 16.0 0.1 1.7 ...
MOH, 1996 National 2871 M/F 0-4.99 3.4 10.3 ... ... ... ... ...1995 Central 590 " " 2.1 7.7 .. .. .. .. ..
East 708 " " 6.8 18.6 ... ... ... ... ...North 243 " " 1.5 7.5 ... ... ... ... ...South 453 " " 3.6 9.8 ... ... ... ... ...West 877 " " 1.9 6.4 ... ... ... ... ...
625 " 0.-0.99 2.3 5.7 ... ... ... ... ...583 " 1 4.8 12.9 ... ... ... ... ...525 " 2 5.3 15.0 ... ... ... ... ...602 " 3 2.5 10.3 ... ... ... ... ...536 " 4 2.2 8.3 ... ... ... ... ...
URBAN 654 " 0-4.99 1.6 7.0 ... ... ... ... ...RURAL 218 " " 5.8 14.7 ... ... ... ... ...
439 M " 4.7 11.5 ... ... ... ... ...432 F " 2.0 9.2 ... ... ... ... ...
Percentage of malnutrition

Nutrition Country Profiles – TURKEY 20 March 2001 18
Table 4a cont: Anthropometric data on children
Notes:... no data available Each index is expressed in terms of the number of standard deviations (SD) units from the median of the
NCHS/CDC/WHO international reference population. * Includes children who are below -3 SD.
Source/ Location SampleYear
fSize
N bSex Age
Y
Underweight Stunting Wasting Overweight% Weight/Age % Height/Age % Weight/Height % Weight/Height
< -3SD < -2SD* < -3SD < -2SD < -3SD < -2SD > +2SDTDHS, 1994 National 3152 M/F 0-4.99 1.9 10.4 6.3 20.5 0.4 2.9 2.9
1993 Central 708 " " 1.3 7.3 5.1 19.2 0.3 1.7 4.1East 798 " " 5.3 22.1 14.0 37.7 0.9 5.9 1.3North 306 " " 0.4 7.2 6.2 14.1 0.2 1.4 3.8South 488 " " 0.6 7.4 3.9 15.8 0.2 1.4 3.0West 852 " " 0.4 4.8 1.6 10.3 0.3 2.6 2.9
330 " 0-0.49 0.0 1.0 0.5 3.7 0.0 2.1 7.1349 " 0.5-0.99 2.8 10.3 0.9 9.2 0.6 2.9 2.3638 " 1 1.4 11.6 3.0 19.4 0.1 5.0 4.1570 " 2 3.6 12.7 8.6 22.3 0.4 2.8 1.6644 " 3 1.2 10.5 9.6 26.0 0.7 2.0 2.0622 " 4 2.0 12.0 10.5 29.3 0.6 2.4 1.7
URBAN 1897 " 0-4.99 1.3 8.5 3.9 16.1 0.4 2.9 2.9RURAL 1255 " " 2.8 13.2 10.0 27.1 0.5 3.0 2.7
1623 M " 1.7 10.3 5.9 21.1 0.4 3.3 3.0166 " 0-0.49 0.0 0.7 0.4 5.0 0.0 3.4 6.9180 " 0.5-0.99 2.9 10.7 1.0 9.4 1.2 4.5 2.0347 " 1 1.7 13.0 3.0 20.1 0.0 5.0 5.2289 " 2 4.1 12.0 9.0 21.9 0.3 3.6 1.2324 " 3 0.9 9.4 8.4 27.5 0.6 1.6 2.8332 " 4 0.8 11.5 9.6 29.7 0.6 2.4 1.11530 F 0-4.99 2.0 10.5 6.7 19.8 0.4 2.5 2.7164 " 0-0.49 0.0 1.2 0.6 2.4 0.0 0.7 7.4169 " 0.5-0.99 2.7 9.8 0.7 8.9 0.0 1.3 2.5291 " 1 1.1 10.0 2.9 18.7 0.3 5.0 2.8289 " 2 3.0 13.3 8.1 22.7 0.4 2.1 1.9321 " 3 1.5 11.6 10.8 24.5 0.7 2.3 1.3300 " 4 3.3 12.5 11.6 28.8 0.6 2.4 2.2
Percentage of malnutrition

Nutrition Country Profiles – TURKEY 20 March 2001 19
Table 4b: Anthropometric data on adolescents
Notes: ... data not available
Source/ Location Sample Anthropometric status
Yearof survey
SizeNumber
Sex AgeYears
Height (cm)Body Mass Index
(kg/m2)mean SD median mean SD median
Rakıcıoğlu et al Ankara 422 M 419122000 M 10 139.3 5.8 140.0 16.8 2.2 16.6
M 11 144.2 6.9 144.0 17.2 2.1 16.9M 12 149.0 7.5 148.0 17.5 2.6 17.3M 13 152.0 9.3 152.0 18.0 2.6 17.3M 14 159.7 9.9 159.0 18.3 2.5 17.9M 15 166.4 8.6 167.0 19.0 1.9 19.0M 16 171.5 7.2 171.0 19.8 2.8 20.4M 17 172.4 7.4 175.0 19.9 2.0 19.7M 18 173.7 7.1 173.0 21.1 2.8 21.8
187 F 41547F 10 137.4 6.3 136.5 16.1 2.0 15.9F 11 146.2 7.2 144.5 17.3 2.8 17.2F 12 151.5 7.9 150.5 17.6 2.4 16.9F 13 155.7 7.7 157.0 17.8 2.4 17.6F 14 158.8 7.2 158.0 19.7 2.6 19.9F 15 158.4 6.1 158.0 19.1 2.8 18.7F 16 161.3 6.7 160.0 19.8 3.6 20.1F 17 155.3 4.3 157.0 19.4 4.0 18.8
HÜNDD, 15 provinces 7144 M/F 35769MOH,1995 502 M 10 130.9 8.7 ... 16.0 2.1 ...
440 M 11 136.5 9.5 ... 16.2 2.4 ...352 M 12 141.8 7.9 ... 16.9 2.4 ...556 F 10 132.6 9.3 ... 15.7 2.6 ...511 F 11 138.9 8.5 ... 15.8 2.5 ...394 F 12 143.4 8.8 ... 17.7 2.6 ...
Nutrition Country Profiles – TURKEY 20 March 2001 20
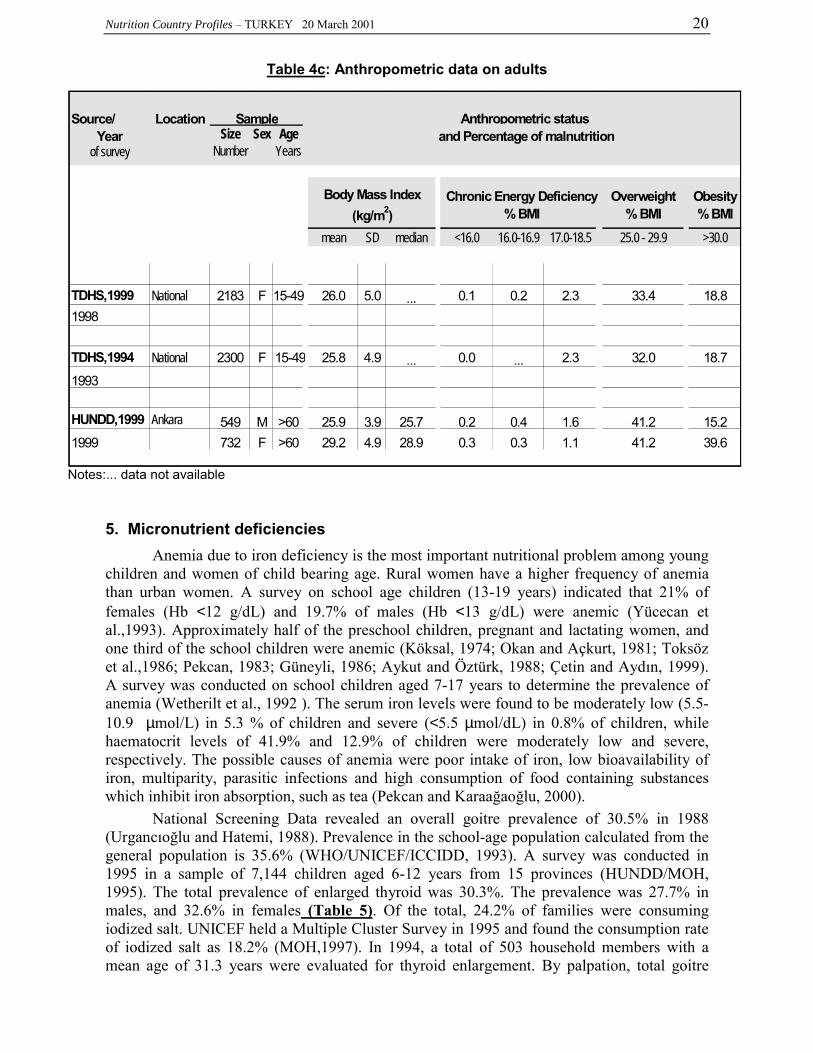
Table 4c: Anthropometric data on adults
Notes:... data not available
5. Micronutrient deficienciesAnemia due to iron deficiency is the most important nutritional problem among young
children and women of child bearing age. Rural women have a higher frequency of anemiathan urban women. A survey on school age children (13-19 years) indicated that 21% offemales (Hb <12 g/dL) and 19.7% of males (Hb <13 g/dL) were anemic (Yücecan etal.,1993). Approximately half of the preschool children, pregnant and lactating women, andone third of the school children were anemic (Köksal, 1974; Okan and Açkurt, 1981; Toksözet al.,1986; Pekcan, 1983; Güneyli, 1986; Aykut and Öztürk, 1988; Çetin and Aydın, 1999).A survey was conducted on school children aged 7-17 years to determine the prevalence ofanemia (Wetherilt et al., 1992 ). The serum iron levels were found to be moderately low (5.5-10.9 µmol/L) in 5.3 % of children and severe (<5.5 µmol/dL) in 0.8% of children, whilehaematocrit levels of 41.9% and 12.9% of children were moderately low and severe,respectively. The possible causes of anemia were poor intake of iron, low bioavailability ofiron, multiparity, parasitic infections and high consumption of food containing substanceswhich inhibit iron absorption, such as tea (Pekcan and Karaağaoğlu, 2000).
National Screening Data revealed an overall goitre prevalence of 30.5% in 1988(Urgancıoğlu and Hatemi, 1988). Prevalence in the school-age population calculated from thegeneral population is 35.6% (WHO/UNICEF/ICCIDD, 1993). A survey was conducted in1995 in a sample of 7,144 children aged 6-12 years from 15 provinces (HUNDD/MOH,1995). The total prevalence of enlarged thyroid was 30.3%. The prevalence was 27.7% inmales, and 32.6% in females (Table 5). Of the total, 24.2% of families were consumingiodized salt. UNICEF held a Multiple Cluster Survey in 1995 and found the consumption rateof iodized salt as 18.2% (MOH,1997). In 1994, a total of 503 household members with amean age of 31.3 years were evaluated for thyroid enlargement. By palpation, total goitre
Source/ Location SampleYear
of surveySize
NumberSex Age
Years
Body Mass Index(kg/m2)
Chronic Energy Deficiency% BMI
Overweight% BMI
Obesity% BMI
mean SD median <16.0 16.0-16.9 17.0-18.5 25.0 - 29.9 >30.0
TDHS,1999 National 2183 F 15-49 26.0 5.0 ... 0.1 0.2 2.3 33.4 18.81998
TDHS,1994 National 2300 F 15-49 25.8 4.9 ... 0.0 ... 2.3 32.0 18.7
1993
HUNDD,1999 Ankara 549 M >60 25.9 3.9 25.7 0.2 0.4 1.6 41.2 15.21999 732 F >60 29.2 4.9 28.9 0.3 0.3 1.1 41.2 39.6
and Percentage of malnutritionAnthropometric status

Nutrition Country Profiles – TURKEY 20 March 2001 21
prevalence was 31.2%. Mean urinary iodine excretion was 7.7 µg/dL in subjects with goitreand 11.7 µg/dL in subjects without goitre (Kirkizoğlu and Pekcan, 1998). Programme forvoluntary iodization of salt was started with a legislation in 1968. Programme for iodinedeficiencies has been launched in 1994. Inter-sectoral collaboration and educationprogrammes have been organized towards the promotion of iodized salt and iodisation of allsalts produced in food sector. In June 1998, iodisation of all the consumed salt becamecompulsory with legislation. The incidence of congenital hypothyroidism is found as 1:2736(Yordam et al. 1995).
Regional surveys indicated that 7.9-20.0% of children had rickets, associated withlimited exposure to sunlight and inadequate intake of calcium (Köksal, 1974; Öcal et al.,1983).
As for vitamin A deficiency, the findings of a survey on 7-17 years old children inthree geographic regions of Turkey revealed that blood vitamin A level in 9.3% of childrenwas marginally low (0.35-0.69µmol/L) and in 2.3% was severe (<0.35µmol/L), with B2 7.0%of children fell into moderate (1.52-1.44 EGR activity) and 82.9% into high risk (> 1.52 EGRactivity) groups, with B6 22.7% fell into moderate (1.8-1.7 EGOT activity) and 60.7% intohigh risk (>1.8 EGOT activity) groups (Wetherilt, 1992) (Table 5).
In a longitudinal study blood samples were analyzed for ferritin, iron, zinc, calcium,alkaline phosphatase, total protein, albumin, vitamins B2, B6, B12, A, E, beta-carotene andfolate in pre- and post-natal women. The subjects were randomly selected during 13-17th
weeks of gestation and followed up between 28-32nd weeks of gestation and 13-17th weeks ofpostpartum. High percentages of subjects were at risk for deficiencies of vitamin B12 (48.8%)and folate (59.7%) in early pregnancy; ferritin (52.3%), zinc (72.3%), vitamin B2 (38.8%),vitamin B12 (80.9%) and folate (76.4%) during late pregnancy; and ferritin (39.0%), vitaminsB2 (43.1%), B6 (36.4%), B12 (60.0%) and folate (73.3%) at the postpartum stage. Bone losswas indicated in 55% and 80% of the subjects in late pregnancy and post-partum respectively.Nutrition education programmes and enrichment of the bread was recommended (Açkurt et al,1995). In an another study the prevalence of neural tube defects was found 30.1 per 10thousand. It seems it is an important problem among 15-49 years old women (Tunçbilek etal,1999).

Nutrition Country Profiles – TURKEY 20 March 2001 22
Table 5: Surveys on micronutrient deficiencies
Notes: ... data not available
Source/ Deficiency Location Sample PercentageYear
of surveySize
NumberSex Age
Years
IodineHÜ.NDD/MOH,1995 15 provinces 6906 M/F 35769 30.3
1995 557/539 M/F 6 19.6/22.1514/540 M/F 7 22.0/22.4532/560 M/F 8 27.1/26.4491/515 M/F 9 28.1/31.5476/547 M/F 10 30.1/42.4422/491 M/F 11 30.1/42.4339/383 M/F 12 42.2/48.6
3331/3575 M/F 35769 27.7/32.6
Vitamin ALow/Severe
Wetherilt, 1992 3 regions 980 M/F 41455 2.3/9.31985-1986 Marmara M/F 2.2/12.6
Centre M/F 1.6/5.5East M/F 3.2/9.6
Iron
Çetin,Aydı n,1999 İstanbul 910 M/F 0.5-19 44.01996 478 M/F 0.5-6.0 58.0
Wetherilt, 1992 3 regions 980 M/F 41455 20.9 (Hb)
1985-86 12.9 (High risk, Hct)
41.9 (Medium risk,Hct)
Pekcan,1984 Ankara 355 M/F 35773 35.81983

Nutrition Country Profiles – TURKEY 20 March 2001 23
REFERENCES
Açkurt F, Wetherilt H, Löker M, Hacıbekiroğlu M. 1995. Biochemical assessment ofnutritional status in pre-and post-natal Turkish women and outcome of pregnancy.European Journal of Clinical Nutrition, 49(8):613-622.
Aykut M, Öztürk Y.1988. The prevalence of anaemia among 15-49 age groups of women inprovince of Kayseri Gesi Health Centre Area. Journal of Turkish Hygiene andExperimental Biology, 45: 23-31. (In Turkish).
Çetin E, Aydın A. 1999. The prevalence and morphological distribution of anaemia inhealthy children and adolescents living in İstanbul: the effects of age, gender andnutritional status of children and parental education and economical status on theprevalence of anaemia. Archives of Turkish Paediatrics. 34: 29-34. (In Turkish)
FAOSTAT. 1999. FAO Web page. Statistics database . FAO, Rome
FAO/WFS (World Food Summit). 1996. Mapping Undernutrition - an ongoing process-.Poster for the World Food Summit 13-17 November 1996. FAO, Rome.
Güneyli U.1986. The nutritional status of primary school children living in different socio-economic levels in Ankara. Journal of Nutrition and Dietetics.15: 31-45. (InTurkish).
HUNDD (Hacettepe University Department of Nutrition and Dietetics). 1999. Assessmentof household nutritional status. Unpublished project. Ankara (In Turkish).
HUNDD/MoH. (Hacettepe University Department of Nutrition and Dietetics, Ministryof Health). 1997. Food Consumption Survey in 7 Provinces. Project Report, Ankara(In Turkish).
HUNDD/MoH. (Hacettepe University, Department of Nutrition and Dietetics, Ministryof Health). Mother and Child Health and Family Planning Directorate.1995. NutritionEducation and Surveillance Project in 15 provinces, Ankara (In Turkish).
Kirkizoglu E, Pekcan G. 2001. Prevalence of Iodine Deficiency Disorders and UrinaryIodine Excretion, J Nutr and Diet. 27: (In Turkish).
Köksal O. 1977. A Report of 1974- National Nutrition in Turkey. Hacettepe University,Aydın Matbaası, Turkey.
MARA, Republic of Turkey Ministry of Agriculture and Rural Affairs. 2000. Strategies forNational Agricultural Development. Horizon 2010. Ankara.
MARA, Republic of Turkey Ministry of Agriculture and Rural Affairs 1996.Turkey Reporton Food Situation. 13-17 November 1996, Rome.
MOH. (Ministry of Health Directorate of External Relations). 1997. Country HealthReport, MoH, Health Project General Coordination Unit, Ankara.

Nutrition Country Profiles – TURKEY 20 March 2001 24
MoH. (Ministry of Health). 1997. Health Statistics-1996. Research Planning andCoordination Council. Publ. No 595, Ankara.
MOH (Ministry of Health). 1996. Multiple indicators cluster survey in Turkey 1995.Ankara: National Bureau of Statistics, 1996.
Okan B, Açkurt F.1981. The Prevalence of Anaemia and Malnutrition of Children Aged 0-4Years Old in Rural Area Kocaeli-Gebze. Publ.of the Scientific and Technical ResearchCouncil of Turkey (In Turkish).
Öcal G, Bevki A, Abal G, Turhanoğlu İ, Usta N.1983. Rickets an important problem ofvitamin D deficiency in infants. J Child Health and Disease, 26:39-44. (In Turkish).
Pekcan G., Karaağaoğlu N. 2000. State of Nutrition in Turkey. Nutrition and Health, 14:41-54.
Pekcan G.1983. A survey on the nutritional and health status of school children between theages of 10-12 years. Journal of Nutrition and Dietetics 12:43-56 (In Turkish).
Rakıcıoğlu N, Karabudak E, Kazanç M, Yücecan S. 2000. Nutritional status of dietaryhabits in 10-18 years old adolescents. III. International Congress of Nutrition andDietetics. 12-15 April 2000. Ankara. (In Turkish).
SIS.( State Institute of Statistics). 1996. Turkey in Statistics 1995, Ankara (In Turkish).
SPO. (State Planning Organisation). 2000. 8th Five Year Development Plan andSupplementary Documents (2001-2005). Ankara (In Turkish)..
Tabatabai H. 1996. Statistics on poverty and income distribution. An ILO Compendium ofdata. International Labour Office, Geneva.
Toksöz P, Özkaynak V, İlçin E, Çelik MY. 1986. A study on socio-cultural situation,health and nutritional habits, interactions in rural area. Journal of Nutrition and Dietetics.
15: 93-111. (In Turkish).
Tönük B, Gültürk H, Güneyli U, Arıkan R, Kayım H, Bozkurt Ö. 1984. 1984-FoodConsumption and Nutrition. Ministry of Agriculture/UNICEF (1987), Ankara. (InTurkish).
Tunçbilek E, Boduroğlu K, Alikaşifoğlu M. 1999. Neural tube defects in Turkey:Prevalence, distribution and risk factors. The Turkish Journal of Pediatrics. 41: 299-305.
TDHS. (Turkey Demographic and Health Survey). 1994. Turkish demographic and healthsurvey 1993. Hacettepe University, Institute of Population studies. Ankara, Turkey.
TDHS. (Turkey Demographic and Health Survey). 1999. Turkish demographic and healthsurvey 1998. Hacettepe University, Institute of Population Studies. Ankara, Turkey.
UN. 1998. World Population Prospects Database 1950-2050. The 1998. Revision. UnitedNations Population Division. New York.
Nutrition Country Profiles – TURKEY 20 March 2001 25
UN. 1996. World Urbanisation Prospects. 1996 Revision. United Nations PopulationDivision. New York.
UNDP. (United Nations Development Programme). 1999. Human Development Report.Oxford University Press. New York.
UNICEF. 2000. The State of the World’s Children 2000. United Nations Children’s Fund.Oxford University Press. New York.
Urgancıoğlu İ, Hatemi H.1988. Endemic Goitre in Turkey. Cerrahpaşa Faculty of Medicine,Pub 14, İstanbul. (In Turkish).
Wetherilt H, Açkurt F, Brubacher G , Okan B, , Aktaş S, Türdü S. 1992. Blood vitaminand mineral levels in 7-17 years old Turkish Children. International Journal forVitamin and Nutrition Research, 62:21-29.
WHO. 1995. Physical Status: The Use and Interpretation of Anthropometry. TechnicalReport Series 854. WHO, Geneva.
WHO. 1983. Measuring Change in Nutritional Status. WHO.Geneva
WHO/UNICEF/ICCIDD.1993. Global Prevalence of Iodine Deficiency Disorders. MDISWorking Paper:1.
World Bank. 1999. The World Development Indicators 1999 CD-ROM. Win*STARSSystem Version 4.0. World Bank, Washington, D.C.
Yordam N, Çalıkoğlu AS, Hatun Ş, Kandemir N, Oğuz H, Teziç T, Özalp İ. 1995.Screening for congenital hypothyroidism in Turkey. European Journal of Pediatrics.154:8:614-616.
Yücecan S, Pekcan G, Ciğerim N, Kayakırılmaz K, Açık S, Nursal B, Karabudak E,Kaşkaya S. 1993. A report on nutritional and health status of adolescents living inAnkara. Hacettepe University Department of Nutrition and Dietetics, Project Report,Ankara.

Nutrition Country Profiles – TURKEY 20 March 2001 26
References of data presented in Table 1, unless otherwise stated:
Source: Indicator:
FAOSTAT. 1999 A.1-2, B, C.10-11, E.1-3, F, G
UN. 1998 rev. C.1-9, D.5
World Bank. 1999. D.1
UNDP. 1997. D.2
Tabatabai H. 1996. D.3-4
UNICEF. 2000. D.6
FAO/WFS. 1996. H

Nutrition Country Profiles – TURKEY 20 March 2001 27
NCP of TURKEYMAPS
General map of Turkey
Map 1:Prevalence of stunting among children under five years by regions
Map 2: Prevalence of underweight among children under five years by regions
Map 3: Prevalence of wasting among children under five years by regions
.

General Map of Turkey
Scale 1: 13 000 000 (approx.)Geographic Projection (Lat/Long)
#
# #
#
#
Izmir
Adana
Ankara
Erzurum
Istanbul
RoadsRiversRegions
# Main cities
N
EW
S
TurkeyFAO-GIS/ESNA, August 2001
Source: TDHS, 1998

East
North
Center
West
South
Map 1: Prevalence of stunting among children under five years by region for 1998Source: TDHS, 1998
Scale 1: 13 000 000 (approx.)Geographic Projection (Lat/Long)
N
EW
S
TurkeyFAO-GIS/ESNA, August 2001
% Height/Age < -2 SD
11.612.813.530.0
9.9
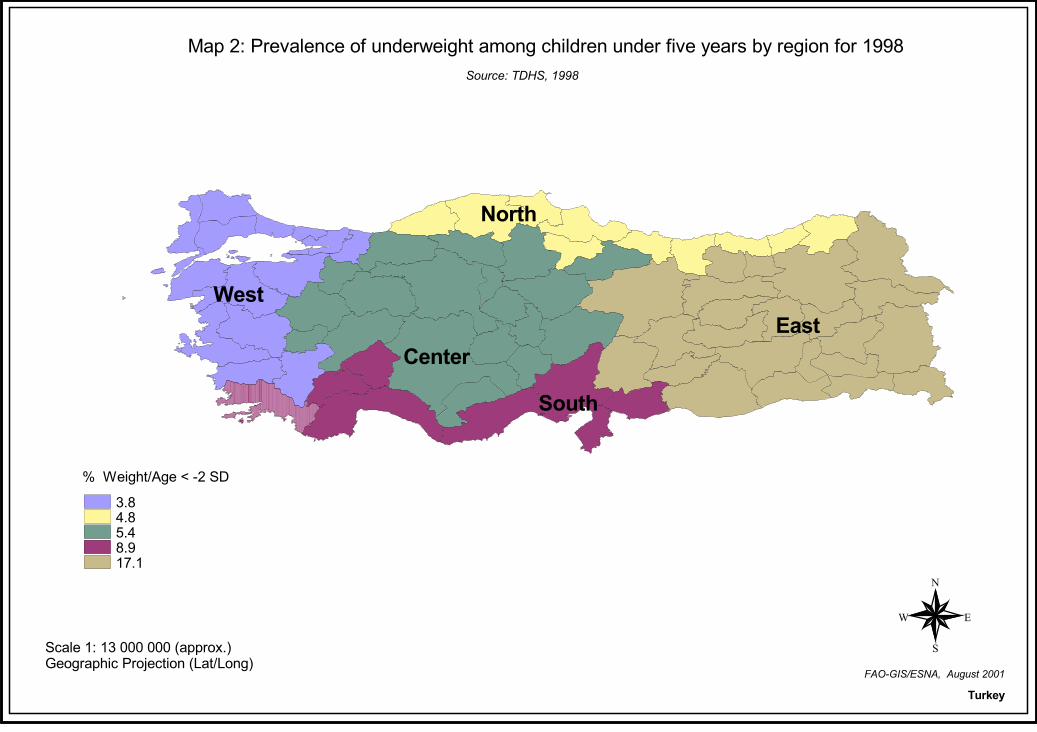
Map 2: Prevalence of underweight among children under five years by region for 1998
Scale 1: 13 000 000 (approx.)Geographic Projection (Lat/Long)
East
North
Center
West
South
N
EW
S
TurkeyFAO-GIS/ESNA, August 2001
% Weight/Age < -2 SD3.84.85.48.917.1
Source: TDHS, 1998

Map 3: Prevalence of wasting among children under five years by region for 1998
Scale 1: 13 000 000 (approx.)Geographic Projection (Lat/Long)
East
North
Center
West
South
% Weight/Height < -2 SD1.31.51.62.22.9
N
EW
S
TurkeyFAO-GIS/ESNA, August 2001
Source: TDHS, 1998