turkey: who and unicef estimates of immunization coverage ... · turkey: who and unicef estimates...
TRANSCRIPT

Turkey: WHO and UNICEF estimates of immunization coverage: 2015 revision
July 6, 2016; page 1 WHO and UNICEF estimates of national immunization coverage - next revision available July 15, 2017 data as of July 5, 2016

Turkey - BCG
2004 2005 2006 2007 2008 2009 2010 2011 2012 2013 2014 2015Estimate 85 88 88 94 96 96 97 96 96 96 95 95
Estimate GoC •• ••• ••• ••• ••• ••• •• •• •• •• •• •Official 79 88 NA 94 96 96 97 96 96 96 95 NA
Administrative 79 88 88 94 96 96 97 96 96 96 95 NASurvey NA NA NA 96 NA NA NA NA NA NA NA NA
The WHO and UNICEF estimates of national immunization coverage (wuenic) are based on data and informationthat are of varying, and, in some instances, unknown quality. Beginning with the 2011 revision we describethe grade of confidence (GoC) we have in these estimates. As there is no underlying probability model uponwhich the estimates are based, we are unable to present classical measures of uncertainty, e.g., confidenceintervals. Moreover, we have chosen not to make subjective estimates of plausibility/certainty ranges aroundthe coverage. The GoC reflects the degree of empirical support upon which the estimates are based. It isnot a judgment of the quality of data reported by national authorities.
••• Estimate is supported by reported data [R+], coverage recalculated with an independentdenominator from the World Population Prospects: 2015 revision from the UN Popula-tion Division (D+), and at least one supporting survey within 2 years [S+]. While wellsupported, the estimate still carries a risk of being wrong.
•• Estimate is supported by at least one data source; [R+], [S+], or [D+]; and no data source,[R-], [D-], or [S-], challenges the estimate.
• There are no directly supporting data; or data from at least one source; [R-], [D-], [S-];challenge the estimate.
In all cases these estimates should be used with caution and should be assessed in lightof the objective for which they are being used.
Description:
2004: Reported data calibrated to 2003 and 2005 levels. GoC=S+ D+2005: From 2005 onward survey results support reported data. GoC=R+ S+ D+2006: Estimate based on reported administrative data. GoC=R+ S+ D+2007: Estimate based on coverage reported by national government supported by
survey. Survey evidence of 96 percent based on 1 survey(s). GoC=R+ S+D+
2008: Estimate based on coverage reported by national government. GoC=R+ S+D+
2009: Estimate based on coverage reported by national government. GoC=R+ S+D+
2010: Estimate based on coverage reported by national government. GoC=R+D+
2011: Estimate based on coverage reported by national government. GoC=R+D+
2012: Estimate based on coverage reported by national government. GoC=R+D+
2013: Estimate based on coverage reported by national government. GoC=R+D+
2014: Estimate based on coverage reported by national government. GoC=R+D+
2015: Estimate based on extrapolation from data reported by national govern-ment. No nationally representative household survey within the last 5years. WHO and UNICEF recommend a high-quality survey to confirmreported levels of coverage. GoC=No accepted empirical data
July 6, 2016; page 2 WHO and UNICEF estimates of national immunization coverage - next revision available July 15, 2017 data as of July 5, 2016
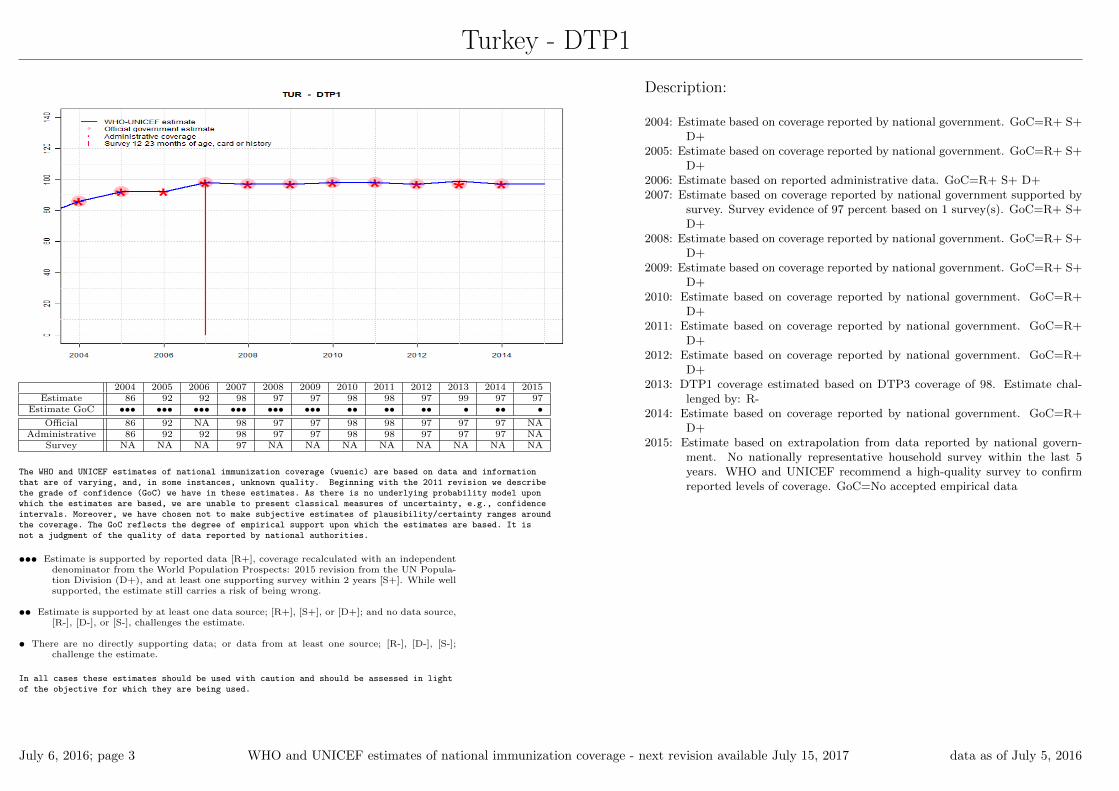
Turkey - DTP1
2004 2005 2006 2007 2008 2009 2010 2011 2012 2013 2014 2015Estimate 86 92 92 98 97 97 98 98 97 99 97 97
Estimate GoC ••• ••• ••• ••• ••• ••• •• •• •• • •• •Official 86 92 NA 98 97 97 98 98 97 97 97 NA
Administrative 86 92 92 98 97 97 98 98 97 97 97 NASurvey NA NA NA 97 NA NA NA NA NA NA NA NA
The WHO and UNICEF estimates of national immunization coverage (wuenic) are based on data and informationthat are of varying, and, in some instances, unknown quality. Beginning with the 2011 revision we describethe grade of confidence (GoC) we have in these estimates. As there is no underlying probability model uponwhich the estimates are based, we are unable to present classical measures of uncertainty, e.g., confidenceintervals. Moreover, we have chosen not to make subjective estimates of plausibility/certainty ranges aroundthe coverage. The GoC reflects the degree of empirical support upon which the estimates are based. It isnot a judgment of the quality of data reported by national authorities.
••• Estimate is supported by reported data [R+], coverage recalculated with an independentdenominator from the World Population Prospects: 2015 revision from the UN Popula-tion Division (D+), and at least one supporting survey within 2 years [S+]. While wellsupported, the estimate still carries a risk of being wrong.
•• Estimate is supported by at least one data source; [R+], [S+], or [D+]; and no data source,[R-], [D-], or [S-], challenges the estimate.
• There are no directly supporting data; or data from at least one source; [R-], [D-], [S-];challenge the estimate.
In all cases these estimates should be used with caution and should be assessed in lightof the objective for which they are being used.
Description:
2004: Estimate based on coverage reported by national government. GoC=R+ S+D+
2005: Estimate based on coverage reported by national government. GoC=R+ S+D+
2006: Estimate based on reported administrative data. GoC=R+ S+ D+2007: Estimate based on coverage reported by national government supported by
survey. Survey evidence of 97 percent based on 1 survey(s). GoC=R+ S+D+
2008: Estimate based on coverage reported by national government. GoC=R+ S+D+
2009: Estimate based on coverage reported by national government. GoC=R+ S+D+
2010: Estimate based on coverage reported by national government. GoC=R+D+
2011: Estimate based on coverage reported by national government. GoC=R+D+
2012: Estimate based on coverage reported by national government. GoC=R+D+
2013: DTP1 coverage estimated based on DTP3 coverage of 98. Estimate chal-lenged by: R-
2014: Estimate based on coverage reported by national government. GoC=R+D+
2015: Estimate based on extrapolation from data reported by national govern-ment. No nationally representative household survey within the last 5years. WHO and UNICEF recommend a high-quality survey to confirmreported levels of coverage. GoC=No accepted empirical data
July 6, 2016; page 3 WHO and UNICEF estimates of national immunization coverage - next revision available July 15, 2017 data as of July 5, 2016

Turkey - DTP3
2004 2005 2006 2007 2008 2009 2010 2011 2012 2013 2014 2015Estimate 85 90 90 96 96 96 97 97 97 98 96 96
Estimate GoC ••• ••• ••• ••• • ••• •• •• •• •• •• •Official 85 90 NA 96 96 96 97 97 97 98 96 NA
Administrative 85 90 90 96 96 96 97 97 97 98 96 NASurvey NA NA NA 89 NA NA NA NA NA NA NA NA
The WHO and UNICEF estimates of national immunization coverage (wuenic) are based on data and informationthat are of varying, and, in some instances, unknown quality. Beginning with the 2011 revision we describethe grade of confidence (GoC) we have in these estimates. As there is no underlying probability model uponwhich the estimates are based, we are unable to present classical measures of uncertainty, e.g., confidenceintervals. Moreover, we have chosen not to make subjective estimates of plausibility/certainty ranges aroundthe coverage. The GoC reflects the degree of empirical support upon which the estimates are based. It isnot a judgment of the quality of data reported by national authorities.
••• Estimate is supported by reported data [R+], coverage recalculated with an independentdenominator from the World Population Prospects: 2015 revision from the UN Popula-tion Division (D+), and at least one supporting survey within 2 years [S+]. While wellsupported, the estimate still carries a risk of being wrong.
•• Estimate is supported by at least one data source; [R+], [S+], or [D+]; and no data source,[R-], [D-], or [S-], challenges the estimate.
• There are no directly supporting data; or data from at least one source; [R-], [D-], [S-];challenge the estimate.
In all cases these estimates should be used with caution and should be assessed in lightof the objective for which they are being used.
Description:
2004: Estimate based on coverage reported by national government. GoC=R+ S+D+
2005: Estimate based on coverage reported by national government. GoC=R+ S+D+
2006: Estimate based on reported administrative data. GoC=R+ S+ D+2007: Estimate based on coverage reported by national government supported by
survey. Survey evidence of 96 percent based on 1 survey(s). Turkey De-mographic and Health Survey 2008 card or history results of 89 percentmodifed for recall bias to 96 percent based on 1st dose card or historycoverage of 97 percent, 1st dose card only coverage of 72 percent and 3ddose card only coverage of 71 percent. GoC=R+ S+ D+
2008: Estimate based on coverage reported by national government. Estimatechallenged by: D-
2009: Estimate based on coverage reported by national government. GoC=R+ S+D+
2010: Estimate based on coverage reported by national government. GoC=R+D+
2011: Estimate based on coverage reported by national government. GoC=R+D+
2012: Estimate based on coverage reported by national government. GoC=R+D+
2013: Estimate based on coverage reported by national government. GoC=R+D+
2014: Estimate based on coverage reported by national government. GoC=R+D+
2015: Estimate based on extrapolation from data reported by national govern-ment. No nationally representative household survey within the last 5years. WHO and UNICEF recommend a high-quality survey to confirmreported levels of coverage. GoC=No accepted empirical data
July 6, 2016; page 4 WHO and UNICEF estimates of national immunization coverage - next revision available July 15, 2017 data as of July 5, 2016

Turkey - Pol3
2004 2005 2006 2007 2008 2009 2010 2011 2012 2013 2014 2015Estimate 85 90 90 96 96 96 97 97 97 98 96 96
Estimate GoC ••• ••• ••• ••• • ••• •• •• •• •• •• •Official 85 90 NA 96 96 96 97 97 97 98 NA NA
Administrative 85 90 90 96 96 96 97 97 97 98 96 NASurvey NA NA NA 89 NA NA NA NA NA NA NA NA
The WHO and UNICEF estimates of national immunization coverage (wuenic) are based on data and informationthat are of varying, and, in some instances, unknown quality. Beginning with the 2011 revision we describethe grade of confidence (GoC) we have in these estimates. As there is no underlying probability model uponwhich the estimates are based, we are unable to present classical measures of uncertainty, e.g., confidenceintervals. Moreover, we have chosen not to make subjective estimates of plausibility/certainty ranges aroundthe coverage. The GoC reflects the degree of empirical support upon which the estimates are based. It isnot a judgment of the quality of data reported by national authorities.
••• Estimate is supported by reported data [R+], coverage recalculated with an independentdenominator from the World Population Prospects: 2015 revision from the UN Popula-tion Division (D+), and at least one supporting survey within 2 years [S+]. While wellsupported, the estimate still carries a risk of being wrong.
•• Estimate is supported by at least one data source; [R+], [S+], or [D+]; and no data source,[R-], [D-], or [S-], challenges the estimate.
• There are no directly supporting data; or data from at least one source; [R-], [D-], [S-];challenge the estimate.
In all cases these estimates should be used with caution and should be assessed in lightof the objective for which they are being used.
Description:
2004: Estimate based on coverage reported by national government. GoC=R+ S+D+
2005: Estimate based on coverage reported by national government. GoC=R+ S+D+
2006: Estimate based on reported administrative data. GoC=R+ S+ D+2007: Estimate based on coverage reported by national government supported by
survey. Survey evidence of 94 percent based on 1 survey(s). Turkey De-mographic and Health Survey 2008 card or history results of 89 percentmodifed for recall bias to 94 percent based on 1st dose card or historycoverage of 97 percent, 1st dose card only coverage of 72 percent and 3ddose card only coverage of 70 percent. GoC=R+ S+ D+
2008: Estimate based on coverage reported by national government. Estimatechallenged by: D-
2009: Estimate based on coverage reported by national government. GoC=R+ S+D+
2010: Estimate based on coverage reported by national government. GoC=R+D+
2011: Estimate based on coverage reported by national government. GoC=R+D+
2012: Estimate based on coverage reported by national government. GoC=R+D+
2013: Estimate based on coverage reported by national government. GoC=R+D+
2014: Estimate based on reported administrative data. GoC=R+ D+2015: Estimate based on extrapolation from data reported by national govern-
ment. No nationally representative household survey within the last 5years. WHO and UNICEF recommend a high-quality survey to confirmreported levels of coverage. GoC=No accepted empirical data
July 6, 2016; page 5 WHO and UNICEF estimates of national immunization coverage - next revision available July 15, 2017 data as of July 5, 2016

Turkey - IPV1
2004 2005 2006 2007 2008 2009 2010 2011 2012 2013 2014 2015Estimate NA NA NA NA NA NA NA NA NA NA NA 97
Estimate GoC NA NA NA NA NA NA NA NA NA NA NA •Official NA NA NA NA NA NA NA NA NA NA NA NA
Administrative NA NA NA NA NA NA NA NA NA NA NA NASurvey NA NA NA NA NA NA NA NA NA NA NA NA
The WHO and UNICEF estimates of national immunization coverage (wuenic) are based on data and informationthat are of varying, and, in some instances, unknown quality. Beginning with the 2011 revision we describethe grade of confidence (GoC) we have in these estimates. As there is no underlying probability model uponwhich the estimates are based, we are unable to present classical measures of uncertainty, e.g., confidenceintervals. Moreover, we have chosen not to make subjective estimates of plausibility/certainty ranges aroundthe coverage. The GoC reflects the degree of empirical support upon which the estimates are based. It isnot a judgment of the quality of data reported by national authorities.
••• Estimate is supported by reported data [R+], coverage recalculated with an independentdenominator from the World Population Prospects: 2015 revision from the UN Popula-tion Division (D+), and at least one supporting survey within 2 years [S+]. While wellsupported, the estimate still carries a risk of being wrong.
•• Estimate is supported by at least one data source; [R+], [S+], or [D+]; and no data source,[R-], [D-], or [S-], challenges the estimate.
• There are no directly supporting data; or data from at least one source; [R-], [D-], [S-];challenge the estimate.
In all cases these estimates should be used with caution and should be assessed in lightof the objective for which they are being used.
Description:
2015: IPV vaccine was introduced in sequential schedule as a combination of DTP-Hib-IPV vaccine in 2008.Estimate based on DTP1 coverage. No nation-ally representative household survey within the last 5 years. WHO andUNICEF recommend a high-quality survey to confirm reported levels ofcoverage. GoC=No accepted empirical data
July 6, 2016; page 6 WHO and UNICEF estimates of national immunization coverage - next revision available July 15, 2017 data as of July 5, 2016

Turkey - MCV1
2004 2005 2006 2007 2008 2009 2010 2011 2012 2013 2014 2015Estimate 81 91 98 96 97 97 97 98 96 98 94 94
Estimate GoC ••• ••• • ••• ••• ••• •• •• •• •• •• •Official 81 91 NA 96 97 97 97 98 96 98 94 NA
Administrative 81 91 98 96 97 97 97 98 96 98 94 NASurvey NA NA NA 89 NA NA NA NA NA NA NA NA
The WHO and UNICEF estimates of national immunization coverage (wuenic) are based on data and informationthat are of varying, and, in some instances, unknown quality. Beginning with the 2011 revision we describethe grade of confidence (GoC) we have in these estimates. As there is no underlying probability model uponwhich the estimates are based, we are unable to present classical measures of uncertainty, e.g., confidenceintervals. Moreover, we have chosen not to make subjective estimates of plausibility/certainty ranges aroundthe coverage. The GoC reflects the degree of empirical support upon which the estimates are based. It isnot a judgment of the quality of data reported by national authorities.
••• Estimate is supported by reported data [R+], coverage recalculated with an independentdenominator from the World Population Prospects: 2015 revision from the UN Popula-tion Division (D+), and at least one supporting survey within 2 years [S+]. While wellsupported, the estimate still carries a risk of being wrong.
•• Estimate is supported by at least one data source; [R+], [S+], or [D+]; and no data source,[R-], [D-], or [S-], challenges the estimate.
• There are no directly supporting data; or data from at least one source; [R-], [D-], [S-];challenge the estimate.
In all cases these estimates should be used with caution and should be assessed in lightof the objective for which they are being used.
Description:
2004: Estimate based on coverage reported by national government. GoC=R+ S+D+
2005: Estimate based on coverage reported by national government. GoC=R+ S+D+
2006: Estimate based on reported administrative data. Estimate challenged by:D-
2007: In 2006 the recommended age for measles immunization was changed to12 months of age. The survey results for children 12-23 months of ageunder-represented coverage GoC=R+ S+ D+
2008: Estimate based on coverage reported by national government. GoC=R+ S+D+
2009: Estimate based on coverage reported by national government. GoC=R+ S+D+
2010: Estimate based on coverage reported by national government. GoC=R+D+
2011: Estimate based on coverage reported by national government. GoC=R+D+
2012: Estimate based on coverage reported by national government. GoC=R+D+
2013: Estimate based on coverage reported by national government. GoC=R+D+
2014: Estimate based on coverage reported by national government. GoC=R+D+
2015: Estimate based on extrapolation from data reported by national govern-ment. No nationally representative household survey within the last 5years. WHO and UNICEF recommend a high-quality survey to confirmreported levels of coverage. GoC=No accepted empirical data
July 6, 2016; page 7 WHO and UNICEF estimates of national immunization coverage - next revision available July 15, 2017 data as of July 5, 2016

Turkey - MCV2
2004 2005 2006 2007 2008 2009 2010 2011 2012 2013 2014 2015Estimate 97 98 84 94 92 88 91 86 85 98 88 88
Estimate GoC •• •• •• •• •• •• •• •• •• • •• •Official 97 98 NA 94 92 88 NA 86 NA 98 88 NA
Administrative 97 98 84 94 93 88 91 86 85 90 88 NASurvey NA NA NA NA NA NA NA NA NA NA NA NA
The WHO and UNICEF estimates of national immunization coverage (wuenic) are based on data and informationthat are of varying, and, in some instances, unknown quality. Beginning with the 2011 revision we describethe grade of confidence (GoC) we have in these estimates. As there is no underlying probability model uponwhich the estimates are based, we are unable to present classical measures of uncertainty, e.g., confidenceintervals. Moreover, we have chosen not to make subjective estimates of plausibility/certainty ranges aroundthe coverage. The GoC reflects the degree of empirical support upon which the estimates are based. It isnot a judgment of the quality of data reported by national authorities.
••• Estimate is supported by reported data [R+], coverage recalculated with an independentdenominator from the World Population Prospects: 2015 revision from the UN Popula-tion Division (D+), and at least one supporting survey within 2 years [S+]. While wellsupported, the estimate still carries a risk of being wrong.
•• Estimate is supported by at least one data source; [R+], [S+], or [D+]; and no data source,[R-], [D-], or [S-], challenges the estimate.
• There are no directly supporting data; or data from at least one source; [R-], [D-], [S-];challenge the estimate.
In all cases these estimates should be used with caution and should be assessed in lightof the objective for which they are being used.
Description:
Coverage estimates for the second dose of measles containing vaccine are for chil-dren by the nationally recommended age.
2004: Estimate based on coverage reported by national government. GoC=R+D+
2005: Estimate based on coverage reported by national government. GoC=R+D+
2006: Estimate based on reported administrative estimate. GoC=R+ D+2007: Estimate based on coverage reported by national government. GoC=R+
D+2008: Estimate based on coverage reported by national government. GoC=R+
D+2009: Estimate based on coverage reported by national government. GoC=R+
D+2010: Estimate based on reported administrative estimate. GoC=R+ D+2011: Estimate based on coverage reported by national government. GoC=R+
D+2012: Estimate based on reported administrative estimate. GoC=R+ D+2013: Estimate based on coverage reported by national government. Estimate
challenged by: D-2014: Estimate based on coverage reported by national government. GoC=R+
D+2015: Estimate based on extrapolation from data reported by national govern-
ment. No nationally representative household survey within the last 5years. WHO and UNICEF recommend a high-quality survey to confirmreported levels of coverage. GoC=No accepted empirical data
July 6, 2016; page 8 WHO and UNICEF estimates of national immunization coverage - next revision available July 15, 2017 data as of July 5, 2016

Turkey - RCV1
2004 2005 2006 2007 2008 2009 2010 2011 2012 2013 2014 2015Estimate NA NA 98 96 97 97 97 98 96 98 94 94
Estimate GoC NA NA • ••• ••• ••• •• •• •• •• •• •Official NA NA NA NA NA NA NA NA NA NA NA NA
Administrative NA NA NA NA NA NA NA NA NA NA NA NASurvey NA NA NA NA NA NA NA NA NA NA NA NA
The WHO and UNICEF estimates of national immunization coverage (wuenic) are based on data and informationthat are of varying, and, in some instances, unknown quality. Beginning with the 2011 revision we describethe grade of confidence (GoC) we have in these estimates. As there is no underlying probability model uponwhich the estimates are based, we are unable to present classical measures of uncertainty, e.g., confidenceintervals. Moreover, we have chosen not to make subjective estimates of plausibility/certainty ranges aroundthe coverage. The GoC reflects the degree of empirical support upon which the estimates are based. It isnot a judgment of the quality of data reported by national authorities.
••• Estimate is supported by reported data [R+], coverage recalculated with an independentdenominator from the World Population Prospects: 2015 revision from the UN Popula-tion Division (D+), and at least one supporting survey within 2 years [S+]. While wellsupported, the estimate still carries a risk of being wrong.
•• Estimate is supported by at least one data source; [R+], [S+], or [D+]; and no data source,[R-], [D-], or [S-], challenges the estimate.
• There are no directly supporting data; or data from at least one source; [R-], [D-], [S-];challenge the estimate.
In all cases these estimates should be used with caution and should be assessed in lightof the objective for which they are being used.
Description:
For this revision, coverage estimates for the first dose of rubella containing vaccineare based on WHO and UNICEF estimates of coverage of measles contain-ing vaccine. Nationally reported coverage of rubella containing vaccine isnot taken into consideration nor are they represented in the accompanyinggraph and data table.
2006: Estimate based on estimated MCV1. Estimate challenged by: D-2007: Estimate based on estimated MCV1. GoC=R+ S+ D+2008: Estimate based on estimated MCV1. GoC=R+ S+ D+2009: Estimate based on estimated MCV1. GoC=R+ S+ D+2010: Estimate based on estimated MCV1. GoC=R+ D+2011: Estimate based on estimated MCV1. GoC=R+ D+2012: Estimate based on estimated MCV1. GoC=R+ D+2013: Estimate based on estimated MCV1. GoC=R+ D+2014: Estimate based on estimated MCV1. GoC=R+ D+2015: Estimate based on estimated MCV1. No nationally representative house-
hold survey within the last 5 years. WHO and UNICEF recommend ahigh-quality survey to confirm reported levels of coverage. GoC=No ac-cepted empirical data
July 6, 2016; page 9 WHO and UNICEF estimates of national immunization coverage - next revision available July 15, 2017 data as of July 5, 2016

Turkey - HepBB
2004 2005 2006 2007 2008 2009 2010 2011 2012 2013 2014 2015Estimate 88 94 95 96 96 96 97 97 97 99 99 99
Estimate GoC •• •• • •• •• • • •• •• •• • •Official 88 94 NA 96 96 NA NA 97 97 NA NA NA
Administrative 88 94 63 96 96 NA NA 97 97 99 NA NASurvey NA NA NA NA NA NA NA NA NA NA NA NA
The WHO and UNICEF estimates of national immunization coverage (wuenic) are based on data and informationthat are of varying, and, in some instances, unknown quality. Beginning with the 2011 revision we describethe grade of confidence (GoC) we have in these estimates. As there is no underlying probability model uponwhich the estimates are based, we are unable to present classical measures of uncertainty, e.g., confidenceintervals. Moreover, we have chosen not to make subjective estimates of plausibility/certainty ranges aroundthe coverage. The GoC reflects the degree of empirical support upon which the estimates are based. It isnot a judgment of the quality of data reported by national authorities.
••• Estimate is supported by reported data [R+], coverage recalculated with an independentdenominator from the World Population Prospects: 2015 revision from the UN Popula-tion Division (D+), and at least one supporting survey within 2 years [S+]. While wellsupported, the estimate still carries a risk of being wrong.
•• Estimate is supported by at least one data source; [R+], [S+], or [D+]; and no data source,[R-], [D-], or [S-], challenges the estimate.
• There are no directly supporting data; or data from at least one source; [R-], [D-], [S-];challenge the estimate.
In all cases these estimates should be used with caution and should be assessed in lightof the objective for which they are being used.
Description:
2004: Estimate based on coverage reported by national government. GoC=R+D+
2005: Estimate based on coverage reported by national government. GoC=R+D+
2006: Estimate based on interpolation between reported values. Reported dataexcluded. Decline in reported coverage from 94 percent to 63 percent withincrease to 96 percent. Estimate challenged by: D-
2007: Estimate based on coverage reported by national government. GoC=R+D+
2008: Estimate based on coverage reported by national government. GoC=R+D+
2009: Estimate based on interpolation between reported values. GoC=No acceptedempirical data
2010: Estimate based on interpolation between reported values. GoC=No acceptedempirical data
2011: Estimate based on coverage reported by national government. GoC=R+D+
2012: Estimate based on coverage reported by national government. GoC=R+D+
2013: Estimate based on reported administrative estimate. GoC=R+ D+2014: Estimate based on extrapolation from data reported by national government.
GoC=No accepted empirical data2015: Estimate based on extrapolation from data reported by national govern-
ment. No nationally representative household survey within the last 5years. WHO and UNICEF recommend a high-quality survey to confirmreported levels of coverage. GoC=No accepted empirical data
July 6, 2016; page 10 WHO and UNICEF estimates of national immunization coverage - next revision available July 15, 2017 data as of July 5, 2016

Turkey - HepB3
2004 2005 2006 2007 2008 2009 2010 2011 2012 2013 2014 2015Estimate 77 85 82 96 92 94 96 96 97 97 96 96
Estimate GoC •• ••• •• ••• ••• ••• •• •• •• •• •• •Official 77 85 NA 96 92 94 96 96 97 97 96 NA
Administrative 77 85 82 96 92 94 96 96 97 97 95 NASurvey NA NA NA 86 NA NA NA NA NA NA NA NA
The WHO and UNICEF estimates of national immunization coverage (wuenic) are based on data and informationthat are of varying, and, in some instances, unknown quality. Beginning with the 2011 revision we describethe grade of confidence (GoC) we have in these estimates. As there is no underlying probability model uponwhich the estimates are based, we are unable to present classical measures of uncertainty, e.g., confidenceintervals. Moreover, we have chosen not to make subjective estimates of plausibility/certainty ranges aroundthe coverage. The GoC reflects the degree of empirical support upon which the estimates are based. It isnot a judgment of the quality of data reported by national authorities.
••• Estimate is supported by reported data [R+], coverage recalculated with an independentdenominator from the World Population Prospects: 2015 revision from the UN Popula-tion Division (D+), and at least one supporting survey within 2 years [S+]. While wellsupported, the estimate still carries a risk of being wrong.
•• Estimate is supported by at least one data source; [R+], [S+], or [D+]; and no data source,[R-], [D-], or [S-], challenges the estimate.
• There are no directly supporting data; or data from at least one source; [R-], [D-], [S-];challenge the estimate.
In all cases these estimates should be used with caution and should be assessed in lightof the objective for which they are being used.
Description:
2004: Estimate based on reported data. GoC=R+ D+2005: Estimate based on reported data. GoC=R+ S+ D+2006: Estimate based on reported data. GoC=R+ D+2007: Estimate based on coverage reported by national government supported by
survey. Survey evidence of 93 percent based on 1 survey(s). Turkey De-mographic and Health Survey 2008 card or history results of 86 percentmodifed for recall bias to 93 percent based on 1st dose card or historycoverage of 96 percent, 1st dose card only coverage of 72 percent and 3ddose card only coverage of 70 percent. GoC=R+ S+ D+
2008: Estimate based on coverage reported by national government. GoC=R+ S+D+
2009: Estimate based on coverage reported by national government. GoC=R+ S+D+
2010: Estimate based on coverage reported by national government. GoC=R+D+
2011: Estimate based on coverage reported by national government. GoC=R+D+
2012: Estimate based on coverage reported by national government. GoC=R+D+
2013: Estimate based on coverage reported by national government. GoC=R+D+
2014: Estimate based on coverage reported by national government. GoC=R+D+
2015: Estimate based on extrapolation from data reported by national govern-ment. No nationally representative household survey within the last 5years. WHO and UNICEF recommend a high-quality survey to confirmreported levels of coverage. GoC=No accepted empirical data
July 6, 2016; page 11 WHO and UNICEF estimates of national immunization coverage - next revision available July 15, 2017 data as of July 5, 2016

Turkey - Hib3
2004 2005 2006 2007 2008 2009 2010 2011 2012 2013 2014 2015Estimate NA NA NA 76 96 96 97 97 97 98 96 96
Estimate GoC NA NA NA •• • •• •• •• •• •• •• •Official NA NA NA NA 96 96 97 97 97 98 96 NA
Administrative NA NA NA NA 96 96 97 97 97 98 96 NASurvey NA NA NA NA NA NA NA NA NA NA NA NA
The WHO and UNICEF estimates of national immunization coverage (wuenic) are based on data and informationthat are of varying, and, in some instances, unknown quality. Beginning with the 2011 revision we describethe grade of confidence (GoC) we have in these estimates. As there is no underlying probability model uponwhich the estimates are based, we are unable to present classical measures of uncertainty, e.g., confidenceintervals. Moreover, we have chosen not to make subjective estimates of plausibility/certainty ranges aroundthe coverage. The GoC reflects the degree of empirical support upon which the estimates are based. It isnot a judgment of the quality of data reported by national authorities.
••• Estimate is supported by reported data [R+], coverage recalculated with an independentdenominator from the World Population Prospects: 2015 revision from the UN Popula-tion Division (D+), and at least one supporting survey within 2 years [S+]. While wellsupported, the estimate still carries a risk of being wrong.
•• Estimate is supported by at least one data source; [R+], [S+], or [D+]; and no data source,[R-], [D-], or [S-], challenges the estimate.
• There are no directly supporting data; or data from at least one source; [R-], [D-], [S-];challenge the estimate.
In all cases these estimates should be used with caution and should be assessed in lightof the objective for which they are being used.
Description:
2007: Hib vaccine introduced in 2006. 91 percent coverage achieved during thelast 10 months of 2007. Hib vaccine introduced in 2006. Reporting startedin 2007. GoC=D+
2008: Hib vaccine introduced in 2006 and full coverage achieved in 2008. Estimatechallenged by: D-
2009: Estimate based on coverage reported by national government. GoC=R+D+
2010: Estimate based on coverage reported by national government. GoC=R+D+
2011: Estimate based on coverage reported by national government. GoC=R+D+
2012: Estimate based on coverage reported by national government. GoC=R+D+
2013: Estimate based on coverage reported by national government. GoC=R+D+
2014: Estimate based on coverage reported by national government. GoC=R+D+
2015: Estimate based on extrapolation from data reported by national govern-ment. No nationally representative household survey within the last 5years. WHO and UNICEF recommend a high-quality survey to confirmreported levels of coverage. GoC=No accepted empirical data
July 6, 2016; page 12 WHO and UNICEF estimates of national immunization coverage - next revision available July 15, 2017 data as of July 5, 2016

Turkey - RotaC
2004 2005 2006 2007 2008 2009 2010 2011 2012 2013 2014 2015Estimate NA NA NA NA NA NA NA NA NA NA NA NA
Estimate GoC NA NA NA NA NA NA NA NA NA NA NA NA
Official NA NA NA NA NA NA NA NA NA NA NA NAAdministrative NA NA NA NA NA NA NA NA NA NA NA NA
Survey NA NA NA NA NA NA NA NA NA NA NA NA
The WHO and UNICEF estimates of national immunization coverage (wuenic) are based on data and informationthat are of varying, and, in some instances, unknown quality. Beginning with the 2011 revision we describethe grade of confidence (GoC) we have in these estimates. As there is no underlying probability model uponwhich the estimates are based, we are unable to present classical measures of uncertainty, e.g., confidenceintervals. Moreover, we have chosen not to make subjective estimates of plausibility/certainty ranges aroundthe coverage. The GoC reflects the degree of empirical support upon which the estimates are based. It isnot a judgment of the quality of data reported by national authorities.
••• Estimate is supported by reported data [R+], coverage recalculated with an independentdenominator from the World Population Prospects: 2015 revision from the UN Popula-tion Division (D+), and at least one supporting survey within 2 years [S+]. While wellsupported, the estimate still carries a risk of being wrong.
•• Estimate is supported by at least one data source; [R+], [S+], or [D+]; and no data source,[R-], [D-], or [S-], challenges the estimate.
• There are no directly supporting data; or data from at least one source; [R-], [D-], [S-];challenge the estimate.
In all cases these estimates should be used with caution and should be assessed in lightof the objective for which they are being used.
July 6, 2016; page 13 WHO and UNICEF estimates of national immunization coverage - next revision available July 15, 2017 data as of July 5, 2016

Turkey - PcV3
2004 2005 2006 2007 2008 2009 2010 2011 2012 2013 2014 2015Estimate NA NA NA NA NA 97 93 96 97 97 96 96
Estimate GoC NA NA NA NA NA •• •• •• •• •• •• •Official NA NA NA NA NA NA 93 96 97 97 96 NA
Administrative NA NA NA NA NA 97 95 96 97 97 96 NASurvey NA NA NA NA NA NA NA NA NA NA NA NA
The WHO and UNICEF estimates of national immunization coverage (wuenic) are based on data and informationthat are of varying, and, in some instances, unknown quality. Beginning with the 2011 revision we describethe grade of confidence (GoC) we have in these estimates. As there is no underlying probability model uponwhich the estimates are based, we are unable to present classical measures of uncertainty, e.g., confidenceintervals. Moreover, we have chosen not to make subjective estimates of plausibility/certainty ranges aroundthe coverage. The GoC reflects the degree of empirical support upon which the estimates are based. It isnot a judgment of the quality of data reported by national authorities.
••• Estimate is supported by reported data [R+], coverage recalculated with an independentdenominator from the World Population Prospects: 2015 revision from the UN Popula-tion Division (D+), and at least one supporting survey within 2 years [S+]. While wellsupported, the estimate still carries a risk of being wrong.
•• Estimate is supported by at least one data source; [R+], [S+], or [D+]; and no data source,[R-], [D-], or [S-], challenges the estimate.
• There are no directly supporting data; or data from at least one source; [R-], [D-], [S-];challenge the estimate.
In all cases these estimates should be used with caution and should be assessed in lightof the objective for which they are being used.
Description:
2009: Estimate based on reported administrative estimate. Pneumococcal con-jugate vaccine was introduced in 2008 and reporting began in 2009.GoC=R+ D+
2010: Estimate based on coverage reported by national government. GoC=R+D+
2011: Estimate based on coverage reported by national government. GoC=R+D+
2012: Estimate based on coverage reported by national government. GoC=R+D+
2013: Estimate based on coverage reported by national government. GoC=R+D+
2014: Estimate based on coverage reported by national government. GoC=R+D+
2015: Estimate based on extrapolation from data reported by national govern-ment. No nationally representative household survey within the last 5years. WHO and UNICEF recommend a high-quality survey to confirmreported levels of coverage. GoC=No accepted empirical data
July 6, 2016; page 14 WHO and UNICEF estimates of national immunization coverage - next revision available July 15, 2017 data as of July 5, 2016

Turkey - survey details
2007 Turkey Demographic and Health Survey 2008
Vaccine Confirmation method Coverage Age cohort Sample Cards seenBCG C or H <15 months 96 15-26 m 711 73BCG Card 71 15-26 m 711 73BCG Card or History 96 15-26 m 711 73BCG History 25 15-26 m 711 73DTP1 C or H <15 months 96 15-26 m 711 73DTP1 Card 72 15-26 m 711 73DTP1 Card or History 97 15-26 m 711 73DTP1 History 25 15-26 m 711 73DTP3 C or H <15 months 85 15-26 m 711 73DTP3 Card 71 15-26 m 711 73DTP3 Card or History 89 15-26 m 711 73DTP3 History 18 15-26 m 711 73HepB1 C or H <15 months 96 15-26 m 711 73HepB1 Card 72 15-26 m 711 73HepB1 Card or History 96 15-26 m 711 73HepB1 History 24 15-26 m 711 73HepB3 C or H <15 months 84 15-26 m 711 73HepB3 Card 70 15-26 m 711 73HepB3 Card or History 86 15-26 m 711 73HepB3 History 16 15-26 m 711 73MCV1 C or H <15 months 86 15-26 m 711 73MCV1 Card 66 15-26 m 711 73MCV1 Card or History 89 15-26 m 711 73MCV1 History 23 15-26 m 711 73Pol1 C or H <15 months 96 15-26 m 711 73Pol1 Card 72 15-26 m 711 73Pol1 Card or History 97 15-26 m 711 73Pol1 History 25 15-26 m 711 73Pol3 C or H <15 months 85 15-26 m 711 73Pol3 Card 70 15-26 m 711 73Pol3 Card or History 89 15-26 m 711 73Pol3 History 19 15-26 m 711 73
2003 Turkey Demographic and Health Survey 2003
Vaccine Confirmation method Coverage Age cohort Sample Cards seenBCG C or H <12 months 86 12-23 m 749 54BCG Card 52 12-23 m 749 54BCG Card or history 88 12-23 m 749 54BCG History 36 12-23 m 749 54DTP1 C or H <12 months 87 12-23 m 749 54DTP1 Card 52 12-23 m 749 54DTP1 Card or history 88 12-23 m 749 54DTP1 History 37 12-23 m 749 54DTP3 C or H <12 months 62 12-23 m 749 54DTP3 Card 48 12-23 m 749 54DTP3 Card or history 64 12-23 m 749 54DTP3 History 16 12-23 m 749 54MCV1 C or H <12 months 71 12-23 m 749 54MCV1 Card 49 12-23 m 749 54MCV1 Card or history 79 12-23 m 749 54MCV1 History 30 12-23 m 749 54Pol1 C or H <12 months 92 12-23 m 749 54Pol1 Card 52 12-23 m 749 54Pol1 Card or history 95 12-23 m 749 54Pol1 History 42 12-23 m 749 54Pol3 C or H <12 months 66 12-23 m 749 54Pol3 Card 48 12-23 m 749 54Pol3 Card or history 69 12-23 m 749 54Pol3 History 21 12-23 m 749 54
1997 Turkish Demographic and Health Survey 1998, 1999
Vaccine Confirmation method Coverage Age cohort Sample Cards seenBCG C or H <12 months 87 12-23 m 689 38BCG Card 36 12-23 m 266 38BCG Card or History 88 12-23 m 689 38BCG History 52 12-23 m 424 38DTP1 C or H <12 months 86 12-23 m 689 38DTP1 Card 38 12-23 m 266 38DTP1 Card or History 87 12-23 m 689 38DTP1 History 49 12-23 m 424 38DTP3 C or H <12 months 56 12-23 m 689 38DTP3 Card 34 12-23 m 266 38
July 6, 2016; page 15 WHO and UNICEF estimates of national immunization coverage - next revision available July 15, 2017 data as of July 5, 2016

Turkey - survey details
DTP3 Card or History 59 12-23 m 689 38DTP3 History 24 12-23 m 424 38MCV1 C or H <12 months 71 12-23 m 689 38MCV1 Card 33 12-23 m 266 38MCV1 Card or History 78 12-23 m 689 38MCV1 History 45 12-23 m 424 38Pol1 C or H <12 months 92 12-23 m 689 38Pol1 Card 38 12-23 m 266 38
Pol1 Card or History 94 12-23 m 689 38Pol1 History 56 12-23 m 424 38Pol3 C or H <12 months 61 12-23 m 689 38Pol3 Card 36 12-23 m 266 38Pol3 Card or History 64 12-23 m 689 38Pol3 History 29 12-23 m 424 38
Further information and estimates for previous years are available at:
http://www.data.unicef.org/child-health/immunization
http://www.who.int/immunization/monitoring_surveillance/routine/coverage/en/index4.html
July 6, 2016; page 16 WHO and UNICEF estimates of national immunization coverage - next revision available July 15, 2017 data as of July 5, 2016

___________________________________________
1 This model is described in: Griffiths U., Wolfson L., Quddus A., Younus M., Hafiz R.. Incremental cost-effectiveness of supplementary immunization activities to prevent
neo-natal tetanus in Pakistan. Bulletin of the World Health Organization 2004; 82:643-651.
WHO and UNICEF estimates of national immunization coverage Data as of July 5, 2016
Turkey WHO/UNICEF Estimates of Protection at Birth (PAB) against tetanus
In countries where tetanus is recommended for girls and women coverage is usually reported as
"TT2+", i.e. the proportion of (pregnant) women who have received their second or superior TT
dose in a given year. TT2 + coverage, however, can under-represent the actual proportion of births
that are protected against tetanus as it does not include women who have previously received
protective doses, women who received one dose without documentation of previous doses, and
women who received doses in TT (or Td) supplemental immunization activities (SIA). In addition,
girls who have received DTP in their childhood and are entering childbearing age, may be
protected with TT booster doses.
WHO and UNICEF have developed a model that takes into account the above scenarios, and
calculates the proportion of births in a given year that can be considered as having been protected
against tetanus - "Protection at Birth".
In this model, annual cohorts of women are followed from infancy through their life. A proportion
receives DTP in infancy (estimated based on the WHO-UNICEF estimates of DTP3 coverage). In
addition some of these women also receive TT through routine services when they are pregnant
and may also receive TT during SIAs. The model also adjusts reported data, taking into account
coverage patterns in other years, and/or results available through surveys. The duration of
protection is then calculated, based on WHO estimates of the duration of protection by doses ever
received. The proportion of births that are protected against tetanus as a result of maternal
immunization reflects the tetanus immunization received by the mother throughout her life rather
than simply the TT immunizations received during the current pregnancy.
The model was used in the mid to late 2000. Currently, the coverage series developed by the
model is used as the baseline, and efforts are made to obtain data from all sources that include the
JRF and reported trend over the years, routine PAB reporting and its trend over the years, data
from surveys (DHS, MICS, EPI), whether countries have been validated for the attainment of
maternal and neonatal tetanus elimination and what the TT coverage figures are from the survey
etc and all the information is used to arrive at an estimate of the protection-at-birth from TT
vaccination.
Year PAB coverage
estimate (%)
2004 77
2005 62
2006 68
2007 70
2008 71
2009 71
2010 90
2011 90
2012 90
2013 90
2014 90
2015 90