turning insight into action - xerox · • employee engagement • turnover rate value ... • role...
TRANSCRIPT

Turning Insight into Action A RightOpt® Webinar
Controlling Costs and Advancing Well-being
Strategies Through a Private Exchange

Our Presenters
Dan Graovac, MHSA Principal,
Health Practice
Bruce Sherman, MD, FCCP, FACOEM
Medical Director,
Population Health Management

3
Presentation Outline
• Workforce health as a business investment in human capital
• Relationship of workforce well-being to healthcare cost containment
• Importance and value of integrated services and data to foster
workforce health and well-being
• The private exchange as a means to achieve cost containment and
health management objectives

4
What’s the Value of a Healthy Workforce?
Triple Aim Goals
• Improved quality
• Better health outcomes
• Lower healthcare costs
Lies in alignment of health management strategy with company
business strategy
• Increased worker productivity
• Enhanced worker performance
• Increased company profitability
Targeted offerings generate optimal value

5
Traditional View of Employee Value
Value Work Output Cost
Responsible Department Operations Human Resources
Components • Business productivity
• Supply chain management
Wages, health benefits, WC
costs, recruitment, vacation…
Representative Metric
• Labor hours per unit
• Waste as % of total output
• Revenue per employee
• PEPY healthcare costs
• Employee engagement
• Turnover rate
Value Work
Output Cost

6
Evolution of Health as a Business Imperative
Organizational Tactics Measurement Approach
Informal offerings Not monitored
Program-based offerings
(health impacts medical costs)
Program-specific metrics
(ROI)
Integrated health and productivity
programs
(health impacts productivity)
Health & productivity metrics
integration
(total cost/value)
Organizational policies and
practices influencing health
(health impacts revenue)
Comprehensive integration and
reporting
(business/shareholder value)
Health as Employee
Responsibility
Health as Business
Imperative
(Culture of Health)

7
Higher Well-being is Associated with Improved Workplace Performance
Well-being is More Than
Physical Health
Well-being and Job Performance
(Manager Ratings)
Source: Healthways, 2011.
50.00
55.00
60.00
65.00
70.00
75.00
80.00
Unacceptable
Fair
Successful
Outstanding
Exceptional
Supervisor Performance Ratings
Ind
ivid
ual W
ell
-bein
g S
co
re

8
Workforce Well-being has Business Implications Beyond Physical Health
Working
Population
Thriving in
Physical
Only
Thriving
in All 5
Elements
Compared to Adults
Thriving in just
Physical, Those
Thriving in all 5
Elements:
Average
Unhealthy
Days per
Month
0.81 0.48 Have 41% less
absenteeism
Involved in
Accident
Resulting in
WC Claim
1.4% 0.5%
Are 65% less
likely to be
involved in a
workplace
accident
If Job Market
Improves,
Intent to
Look for New
Job
39.2% 7.3%
Are 81% less
likely to move
when the job
market improves
Employees thriving in multiple
well-being elements have lower
health-related costs one year later
Source: Gallup, 2014.
$0
$1,000
$2,000
$3,000
$4,000
$5,000
$6,000
None One Two Three Four Five
Annual healthcare costs and well-being status
$4,966
$4,264 $3,956
$3,578 $3,421 $3,177
Number of Elements Thriving at Baseline

9
An Opportunity Exists for Organizations to Actively Promote Well-being
Organizational well-being lies in influencing your employees to do what is in their best
interest.
12% of employees
strongly agree that
they have substantially
higher overall well-
being because of their
employer.
A vast majority of
employees see
their job as a
detriment to their
overall well-being.

10
Employee Engagement Affects Key Business Outcomes
Work units in the top quartile in employee engagement outperform bottom-
quartile units in a broad range of measures.
-70%
-60%
-50%
-40%
-30%
-20%
-10%
0%
10%
20%
30%
Turnover
-37%
-25%
-65%
-28%
-48%
-41% -41%
10%
21% 22%
Absenteeism
High-
Turnover
Orgs.
Low-
Turnover
Orgs. Shrinkage
Safety
Incidents
Patient
Safety
Incidents
Quality
(Defects)
Customer Productivity Profitability
Source: http://businessjournal.gallup.com/content/163130/employee-engagement-drives-growth.aspx
Business metrics of companies with high vs. low employee engagement

11
Workforce Health as a Business Imperative
Better Market Premium Reduced Turnover Rates
Companies with health as a business imperative achieve significantly
better financial outcomes and lower employee turnover.
Companies that do NOT effectively link health
to business imperatives
Companies that effectively treat health as a
business imperative
11.70%
-15.85%
14.80%
21%
Source: Towers Watson 2009/2010 Staying@Work Report.

12
Health Drives Performance
Source: Fabius, Thayer, Konicki, et al. The link between workforce health and safety and the health of the bottom line. JOEM. Sept., 2013.

13
Stock Price Trend of Companies with a Culture of Health
Source: Fabius, Thayer, Konicki, et al. The link between workforce health and safety and the health of the bottom line. JOEM. 2013.
0
5,000
10,000
15,000
20,000
25,000
1999 2000 2001 2002 2003 2004 2005 2006 2007 2008 2009 2010 2011 2012
Portfolio Worth (6/30) S&P 500
Portfolio excluding outliers versus S&P 500.
$ 19,404.12
$ 9,923.14

14
A Conceptual Framework for Workforce Health and Well-being
Source: Sherman B, Lynch W. Connecting the dots: Examining the link between workforce health and business performance. Am J Manag Care, 2014; 20(2):115-120.
Individual
Well-being
Organizational
Performance
Individual
Performance
Inputs Consequences
Well-being Status
• Physical
• Emotional
• Financial
• Social
• Personality Attributes
Workplace Practices
• Performance Measures
• Performance Incentives
• Leave Management
• Benefits Design
• Organizational Structure
Work Factors
• Work Relationships
• Role in Organization
• Career Development
• Work-life Interactions
Workplace
Culture
• Well-being Status
• Health Care Costs
• Absence
• Presenteeism
• Engagement
• Skill Level
• Work Output
• Work Quality and Safety
• Customer Satisfaction
• Workforce Engagement
• Workforce Output & Quality
• Customer Retention
• Innovation
• Revenue
• Profitability

15
Factors that Stress People Most Intensely
Source: The Consumer Health Mindset Survey. Aon/NBGH/the futures co., 2013.
0%
5%
10%
15%
20%
25%
30%
35%
40%
45%
50%F
ina
ncia
l S
itua
tio
n
Wo
rk C
ha
ng
es
Wo
rk S
che
dule
Wo
rk R
ela
tion
sh
ips
Influ
ence
/Co
ntr
ol O
ver
How
I D
o M
y W
ork
Pers
on
al R
ela
tio
nsh
ips
Health
Co
nd
itio
n o
f F
am
ilyM
em
ber(
s)
Pers
on
al/F
am
ilyC
om
mitm
en
ts
Pers
on
al H
ea
lth
Con
ditio
n
Fam
ily C
ha
ng
es
Fin
an
cia
l S
itu
atio
n
Pe
rson
al R
ela
tio
nsh
ips
Pe
rson
al H
ea
lth
Con
ditio
n
46%
37% 34%
32% 32% 29%
27% 27% 25% 22%
What does this mean for prioritization of physical health concerns?

16
Integrated Services Across the Health Continuum Yield the Greatest Impact
Chronic Conditions
Acute Illness
Health Risks
Well-being and Consumerism
Centers of Excellence
Condition Management Programs
High Performance Networks
High Performance Networks
Navigation Support
Biometrics/Health Assessment
Lifestyle Coaching
Smoking Cessation
Well-being Programs & Resources
Consumerism Tools & Resources
Catastrophic
Care
17
Key Points:
• Workforce health can be viewed as a business investment in human
capital
• Effective attention to workforce well-being can have substantial
business impact
• Employee engagement is essential for meaningful healthcare cost
containment
• Well-being and consumerism are foundational elements for effective
use of healthcare services

18

Castlight Health:
Locate a Doctor/Hospital based on Cost and Quality. Empowers members to make
more informed decisions using cost and quality information to select a doctor.
Our mission is to help members become better stewards of their health. Not just at time
of enrollment, but 365 days a year.
Use Benefits Effectively
19

Improve Health through Integration
20

Data Integration to Drive Clinical and Business Outcomes Capital Management
Truven
Data
Warehouse
and
Analytics
Eligibility
Medical
Pharmacy
Care Management
Health Risk Assessment
Biometric Testing
User Experience
Program Participation
Financial Management
Vendor Performance &
Quality Management
Benefit Planning &
Design
Regulatory Compliance
Program Evaluation
Health, Productivity, &
Performance Mgmt.
21
22
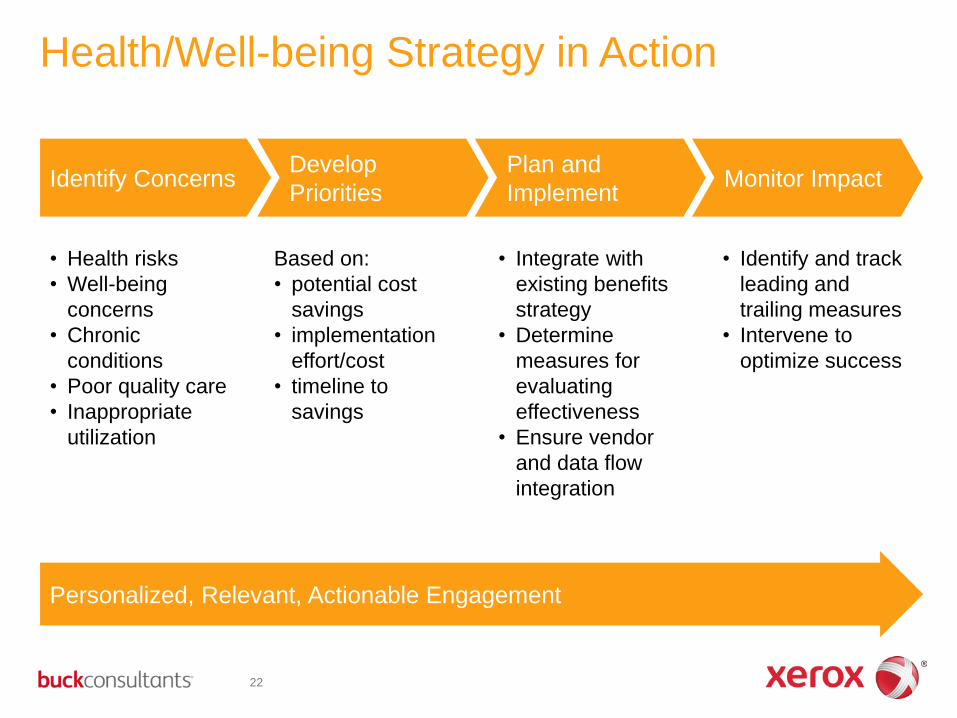
Health/Well-being Strategy in Action
• Health risks
• Well-being
concerns
• Chronic
conditions
• Poor quality care
• Inappropriate
utilization
Personalized, Relevant, Actionable Engagement
Identify Concerns Develop
Priorities
Plan and
Implement Monitor Impact
Based on:
• potential cost
savings
• implementation
effort/cost
• timeline to
savings
• Integrate with
existing benefits
strategy
• Determine
measures for
evaluating
effectiveness
• Ensure vendor
and data flow
integration
• Identify and track
leading and
trailing measures
• Intervene to
optimize success

Our Results
23
Sustained Engagement
Initial launch, 2014 OE:
• 100% at 4.1 return visits
Through Q1 2015:
• 100% at 12.5 return visits
Activated Consumers
• My Action List
• Know My Numbers
• My Benefit Resources
• My Spending Accounts
• Health News and
Videos
Significant Savings
Average year-over-year paid
claims decreased 3.74% on a
per employee basis, with an
aggregate improvement of
nearly 1% in benefit design.
High Member Satisfaction
“This is amazing! It’s the first
time since I was hired that I
easily navigated the site and
found what I was looking for.
Love it!”
Improved Provider Access
Network provider gain is
typically more than 3 times
higher than network provider
loss

24
Summary:
• Health benefits offerings can be viewed as a business investment in
workforce human capital
• A private exchange can support organizational efforts to achieve
business goals
• Integrated services and data sharing/analytics are critical to improving
effectiveness with measurable outcomes

Contact Us
Dan Graovac, MHSA Principal,
Health Practice
Bruce Sherman, MD, FCCP, FACOEM
Medical Director,
Population Health Management

©2015 Xerox Corporation and Buck Consultants, LLC. All rights reserved. Xerox® and Xerox and Design® are trademarks of Xerox Corporation in the United States and/or other countries.
Buck Consultants® is a trademark of Buck Consultants, LLC in the United States and/or other countries. BR 13852