turning potential into reality - berlin energy … · turning potential into reality ... global pv...
TRANSCRIPT

© Fraunhofer ISE
TURNING POTENTIAL INTO REALITY –
THE LANDSCAPE OF SUCCESSFUL ENERGY
TRANSFORMATION APPROACHES
Eicke R. Weber
Fraunhofer Institute for
Solar Energy Systems ISE
and
University of Freiburg, Germany
Energy Transition Dialogue
Berlin, March 26, 2015
www.ise.fraunhofer.de

© Fraunhofer ISE
2
Cornerstones for the Transformation of our Energy System to efficient use of finally 100% renewable energy –
Energy System 2.0, part of the Third Industrial Revolution (J. Rifkin)
Energy efficiency: buildings, production, transport
Massive increase in renewable energies: photovoltaics, solar and geo
thermal, wind, hydro, biomass...
Fast development of the electric grid: transmission and distribution grid,
bidirectional
Small and large scale energy storage systems: electricity, hydrogen,
methane, methanol, biogas, solar heat, hydro.....
Sustainable mobility as integral part of the energy system: electric
mobility with batteries and hydrogen/fuel cells

© Fraunhofer ISE
3
Electricity Generation from Renewable Energy Sources Development in Germany 1990 – 2012/2013
Year 2013
Total* 25.4%
152.6 TWh
PV 4.7%
30 TWh
35.9 GW
Bio 8.0%
48 TWh
Wind 8.9%
53 TWh
34.7 GW
Hydro 3.5%
21 TWh
* Gross electricity
demand

© Fraunhofer ISE
4
Price Learning Curve of Solar Energy (c-Si Photovoltaics)
- Driven by Innovation & Market Introduction!
Preis über kumulierter Kapazität in GW Learning Rate:
Each time the cumulative c-Si PV
production doubled, the price
went down by 20 %
- by a factor of 10 in 25 years!
Solar Electricity Today:
8-10 ct/kWh in Germany,
half in sun-rich countries!
Source: Navigant Consulting; EUPD PV module prices (since 2006), Graph: ISE 2014

© Fraunhofer ISE
5
PV Electricity Cost (LCOE) till 2050
in different regions
Source: ISE PV cost study 2014
PV will generate lowest-cost electricity @ 2-4ct/kWh!

© Fraunhofer ISE
6
PV Market Growth (IEA 2014)
Source: IEA 2014
Rapid introduction of PV globally is fueled by availability of cost-competitive,
distributed energy
Till 2050 more than 4.000 GWp PV will be installed
We are just at
the beginning
of the global
growth curve!

© Fraunhofer ISE
7
Crystalline Silicon Technology Portfolio
c-Si PV is not a commodity, but a high-tech product!
material quality
diffusion length
base conductivity
device quality
passivation of surfaces
low series resistance
light confinement
cell structures
PERC: Passivated Emitter
and Rear Cell
MWT: Metal Wrap Through
IBC-BJ: Interdigitated Back
Contact – Back Junction
HJT: Hetero Junction Technology
Adapted from Preu et al., EU-PVSEC 2009
material
quality module
efficiency
Industry
Standard
IBC-BJ
HJT
PERC
MWT- PERC
20%
19%
18%
17%
16%
15% 14%
21%
device quality
BC- HJT

© Fraunhofer ISE
8
Global PV Production Capacity and Installations
Source: Lux Research Inc., Grafik: PSE AG
Global PV production overcapacity will quickly disappear in the coming years!
Production Capacity
Installations
Excess Capacity
Mo
du
le C
ap
ac
ity (
GW
)
Excess
Ca
pa
cit
y (
GW
)
© Fraunhofer ISE
9
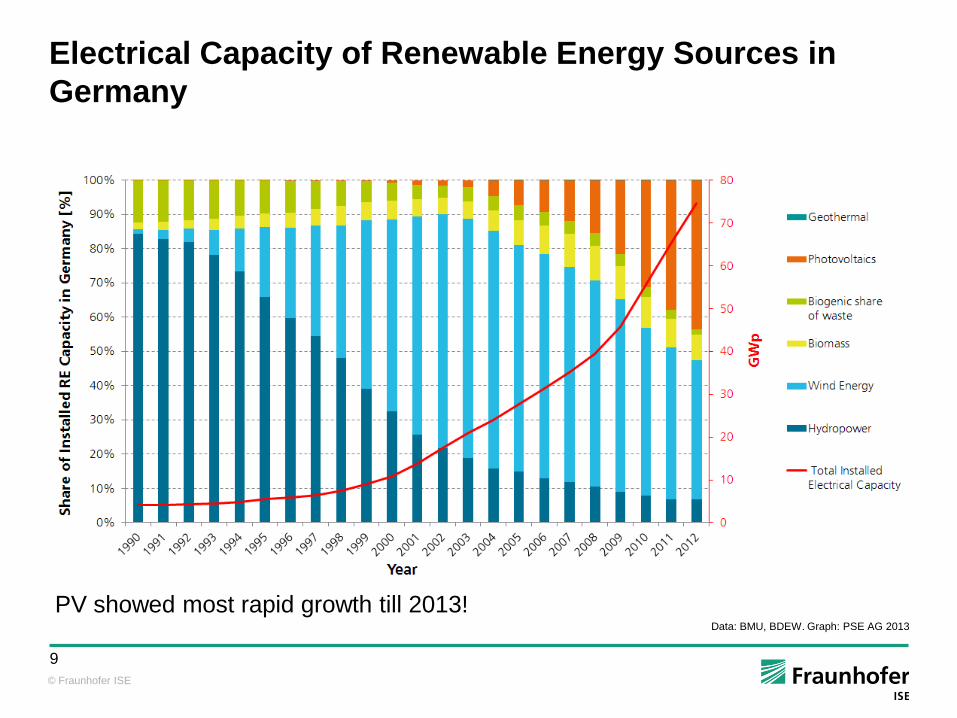
Electrical Capacity of Renewable Energy Sources in
Germany
Data: BMU, BDEW. Graph: PSE AG 2013
PV showed most rapid growth till 2013!

© Fraunhofer ISE
10
PV Systems Yearly Installed in Germany
Distribution of system size
Data: up to 2008: extrapolation from utilities data; since 2009: Bundesnetzagentur. Graph: PSE AG 2013

© Fraunhofer ISE
11
Investment for Small Rooftop PV Systems in relation to market development and subsidy schemes in Germany
Data: BSW-Solar, BNA. Graph: PSE AG 2013

© Fraunhofer ISE
12
Next Generation of Hybrid PV Mini-grids
Simple integration of
different energy
sources (PV, wind,
hydro, etc.)
Least cost option
Increasing quality of
energy services
Support of local
infrastructure and
economic
development
Alternative solution to
the national electricity
network
© Fraunhofer ISE
13
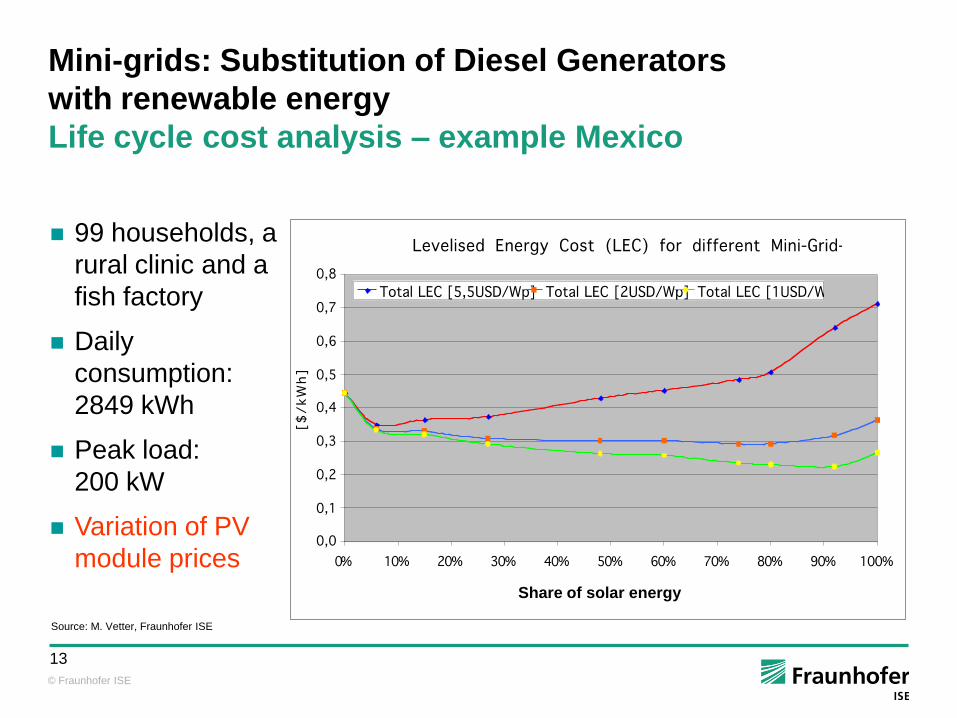
99 households, a
rural clinic and a
fish factory
Daily
consumption:
2849 kWh
Peak load:
200 kW
Variation of PV
module prices
Mini-grids: Substitution of Diesel Generators
with renewable energy
Life cycle cost analysis – example Mexico
Source: M. Vetter, Fraunhofer ISE
Share of solar energy
© Fraunhofer ISE
14
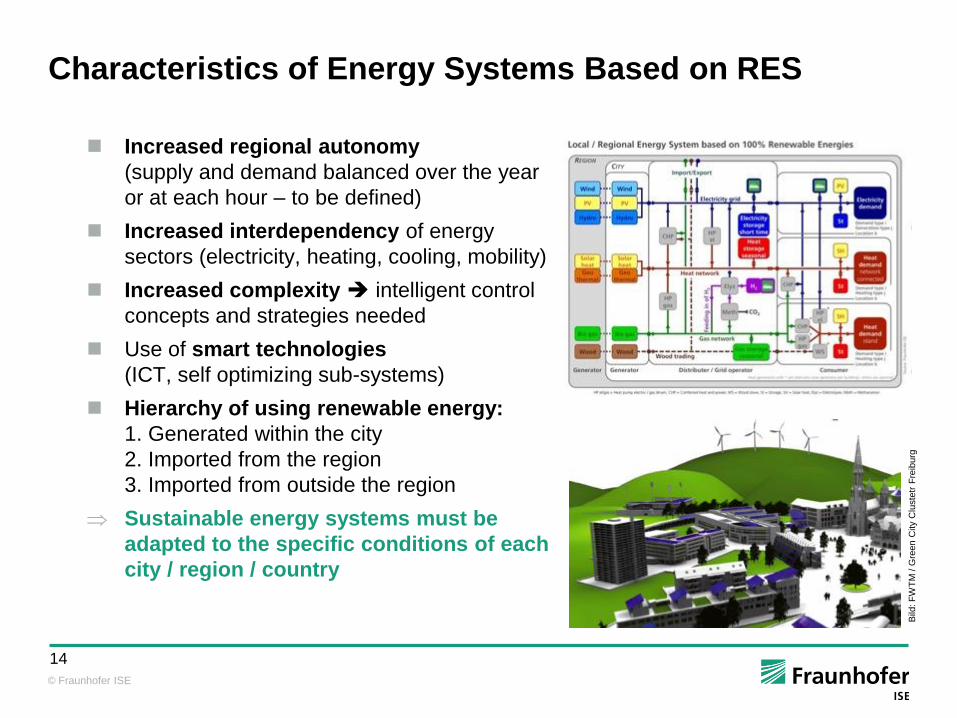
Characteristics of Energy Systems Based on RES
Increased regional autonomy
(supply and demand balanced over the year
or at each hour – to be defined)
Increased interdependency of energy
sectors (electricity, heating, cooling, mobility)
Increased complexity intelligent control
concepts and strategies needed
Use of smart technologies
(ICT, self optimizing sub-systems)
Hierarchy of using renewable energy:
1. Generated within the city
2. Imported from the region
3. Imported from outside the region
Sustainable energy systems must be
adapted to the specific conditions of each
city / region / country
Bild
: F
WT
M / G
reen C
ity
Clu
ste
tr F
reib
urg

© Fraunhofer ISE
15
© Fraunhofer ISE
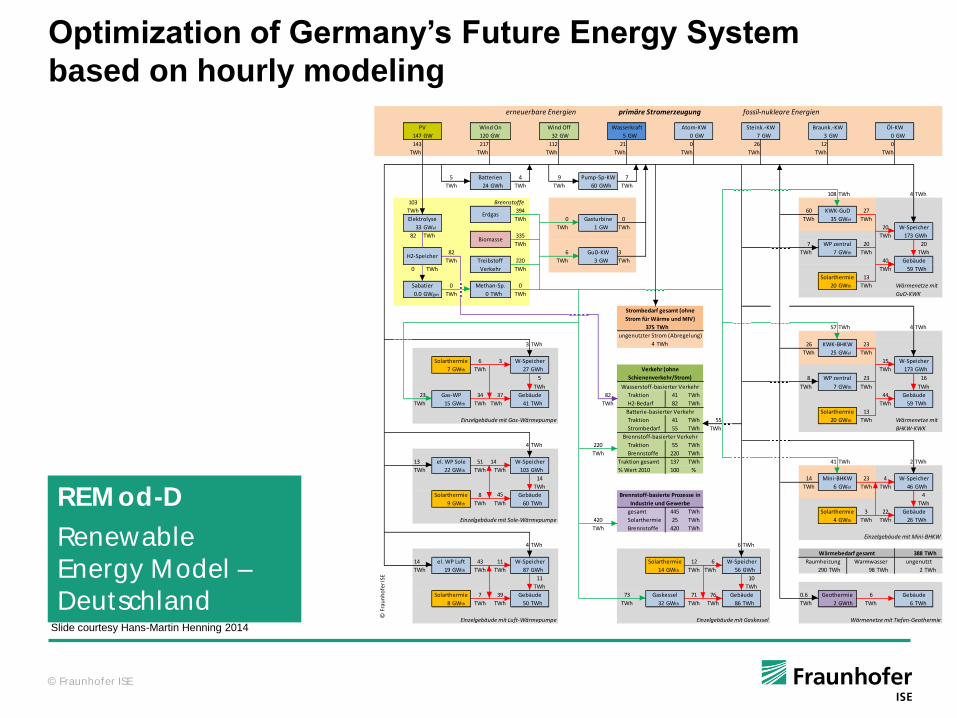
Optimization of Germany’s future energy system based
on hourly modeling
REM od-D
Renewable
Energy Model –
Deutschland
Electricity generat ion,
storage and end-use
Fuels (including
biomass and synthet ic
fuels f rom RE)
Mobility
(bat tery-
elect ric,
hydrogen,
conv. fuel mix)
Processes in
industry and
tert iary sector
Heat
(buildings,
incl. storage
and heat ing
networks)
Comprehensive
analysis of the
overall system
Slide courtesy Hans-Martin Henning 2014
Optimization of Germany’s Future Energy System
based on hourly modeling
© Fraunhofer ISE
16
© Fraunhofer ISE
TWh
Traktion
H2-Bedarf
45
11
TWh
TWh
39
TWh
14
TWh
Einzelgebäude mit Sole-Wärmepumpe
Solarthermie
11
Solarthermie 8 Gebäude
9
TWh
el. WP Luft 43
TWh
TWh
44
4
Einzelgebäude mit Gas-Wärmepumpe
13
TWh
14 4
W-Speicher
GWth TWh 60 TWh
82
TWh
220
TWh
420
22 GWth TWh 103 GWh
51 W-Speicher14el. WP Sole
Biomasse
TWh
0
TWh
15
KWK-BHKW
Solarthermie 13
TWh
Strombedarf gesamt (ohne
Strom für Wärme und MIV)
375
TWh
TWh
3
GWgas 0
220
0
TWh
0Sabatier Methan-Sp.
H2-Speicher
7 GWth TWh
TWh 41
3
GWth
Gas-WP
W-Speicher
25
20
40
TWh
388 TWh
20 GWth TWh Wärmenetze mit
GuD-KWK
7 GWth TWh
W-Speicher
TWh Wärmenetze mit
BHKW-KWK
Wärmebedarf gesamt
TWh
26
TWh
TWh
217
TWh
82
16
TWh
GWel
TWh 23
4
TWh
9 Pump-Sp-KW 7
TWh
TWh
6
TWh
Gasturbine
W-Speicher
Steink.-KW Braunk.-KW Öl-KW
3 GW 0 GW5 GW 0 GW 7 GW
Atom-KWPV Wind On Wind Off Wasserkraft
112
TWh
103
TWh
147
Batterien
24 GWh
GW 120 GW 32 GW
143
TWh
5
TWh 60 GWh TWh
TWh
Einzelgebäude mit Luft-Wärmepumpe
GWth
Gebäude
8
TWh
7
TWh 50
14
4 TWh
TWh
19 GWth TWh GWh
Einzelgebäude mit Gaskessel
TWh
Gaskessel 71 Gebäude
32 GWth
0
4
Gebäude
59
0.0
TWh
3734
Solarthermie 6 W-Speicher
Gebäude
15
27 GWh
23
TWh
TWh
TWh 173 GWh
3
TWh
ungenutzter Strom (Abregelung)
TWh
0
TWh
26
TWh
12
TWh
TWh
5
TWh
TWh
241 TWh
Gebäude
4
87
TWh 6 TWh
Gebäude
59
7 GWth TWh
3
TWh
WP zentral 20
KWK-GuD 27
35 GWel TWh
20
60
TWh
7
GW
Einzelgebäude mit Mini-BHKW
6 46
WP zentral 23
4
8
TWh
TWh
Verkehr (ohne
Schienenverkehr/Strom)
Brennstoff-basierter Verkehr
Batterie-basierter Verkehr
Wasserstoff-basierter Verkehr
137
TWh
TWh
TWh
TWh
TWh
TWh
TWhTraktion gesamt
Brennstoffe
Traktion
erneuerbare Energien primäre Stromerzeugung fossil-nukleare Energien
14 GWth TWh 56 GWh
86 TWh
Geothermie 6 Gebäude
2 GWth
10
TWh
TWh108 TWh
57 TWh
0
TWh
3
TWh
TWh 173
Wärmenetze mit Tiefen-Geothermie
TWh
Brennstoffe
TWhErdgas
394
TWh
4
TWh
22
TWh
Elektrolyse
82
33 GWel
4
21
TWh
0
TWh
TWh 26
1 GW
GuD-KW
ungenutztWarmwasserRaumheizung
290 TWh 98 TWh 2
Solarthermie
GWh
Mini-BHKW 23
GWh
TWh
Solarthermie 13
20 GWth
GWel TWh
TWh
0.6
GWth TWh
TWh
W-Speicher
TWh
TWh
76
6
41
82
Strombedarf
Traktion
Solarthermie 12 6
TWh
73
TWh
25 TWh
Brennstoffe
55
220
100% Wert 2010
335
TWh
TWh
Treibstoff
Verkehr
55
TWh
420 TWh
Brennstoff-basierte Prozesse in
Industrie und Gewerbe
gesamt 445 TWh
Solarthermie
%
41
55
© F
rau
nh
ofe
r ISE
Optimization of Germany’s future energy system based
on hourly modeling
REM od-D
Renewable
Energy Model –
Deutschland Slide courtesy Hans-Martin Henning 2014
Optimization of Germany’s Future Energy System
based on hourly modeling

© Fraunhofer ISE
17
© Fraunhofer ISE
TWh
Traktion
H2-Bedarf
45
11
TWh
TWh
39
TWh
14
TWh
Einzelgebäude mit Sole-Wärmepumpe
Solarthermie
11
Solarthermie 8 Gebäude
9
TWh
el. WP Luft 43
TWh
TWh
44
4
Einzelgebäude mit Gas-Wärmepumpe
13
TWh
14 4
W-Speicher
GWth TWh 60 TWh
82
TWh
220
TWh
420
22 GWth TWh 103 GWh
51 W-Speicher14el. WP Sole
Biomasse
TWh
0
TWh
15
KWK-BHKW
Solarthermie 13
TWh
Strombedarf gesamt (ohne
Strom für Wärme und MIV)
375
TWh
TWh
3
GWgas 0
220
0
TWh
0Sabatier Methan-Sp.
H2-Speicher
7 GWth TWh
TWh 41
3
GWth
Gas-WP
W-Speicher
25
20
40
TWh
388 TWh
20 GWth TWh Wärmenetze mit
GuD-KWK
7 GWth TWh
W-Speicher
TWh Wärmenetze mit
BHKW-KWK
Wärmebedarf gesamt
TWh
26
TWh
TWh
217
TWh
82
16
TWh
GWel
TWh 23
4
TWh
9 Pump-Sp-KW 7
TWh
TWh
6
TWh
Gasturbine
W-Speicher
Steink.-KW Braunk.-KW Öl-KW
3 GW 0 GW5 GW 0 GW 7 GW
Atom-KWPV Wind On Wind Off Wasserkraft
112
TWh
103
TWh
147
Batterien
24 GWh
GW 120 GW 32 GW
143
TWh
5
TWh 60 GWh TWh
TWh
Einzelgebäude mit Luft-Wärmepumpe
GWth
Gebäude
8
TWh
7
TWh 50
14
4 TWh
TWh
19 GWth TWh GWh
Einzelgebäude mit Gaskessel
TWh
Gaskessel 71 Gebäude
32 GWth
0
4
Gebäude
59
0.0
TWh
3734
Solarthermie 6 W-Speicher
Gebäude
15
27 GWh
23
TWh
TWh
TWh 173 GWh
3
TWh
ungenutzter Strom (Abregelung)
TWh
0
TWh
26
TWh
12
TWh
TWh
5
TWh
TWh
241 TWh
Gebäude
4
87
TWh 6 TWh
Gebäude
59
7 GWth TWh
3
TWh
WP zentral 20
KWK-GuD 27
35 GWel TWh
20
60
TWh
7
GW
Einzelgebäude mit Mini-BHKW
6 46
WP zentral 23
4
8
TWh
TWh
Verkehr (ohne
Schienenverkehr/Strom)
Brennstoff-basierter Verkehr
Batterie-basierter Verkehr
Wasserstoff-basierter Verkehr
137
TWh
TWh
TWh
TWh
TWh
TWh
TWhTraktion gesamt
Brennstoffe
Traktion
erneuerbare Energien primäre Stromerzeugung fossil-nukleare Energien
14 GWth TWh 56 GWh
86 TWh
Geothermie 6 Gebäude
2 GWth
10
TWh
TWh108 TWh
57 TWh
0
TWh
3
TWh
TWh 173
Wärmenetze mit Tiefen-Geothermie
TWh
Brennstoffe
TWhErdgas
394
TWh
4
TWh
22
TWh
Elektrolyse
82
33 GWel
4
21
TWh
0
TWh
TWh 26
1 GW
GuD-KW
ungenutztWarmwasserRaumheizung
290 TWh 98 TWh 2
Solarthermie
GWh
Mini-BHKW 23
GWh
TWh
Solarthermie 13
20 GWth
GWel TWh
TWh
0.6
GWth TWh
TWh
W-Speicher
TWh
TWh
76
6
41
82
Strombedarf
Traktion
Solarthermie 12 6
TWh
73
TWh
25 TWh
Brennstoffe
55
220
100% Wert 2010
335
TWh
TWh
Treibstoff
Verkehr
55
TWh
420 TWh
Brennstoff-basierte Prozesse in
Industrie und Gewerbe
gesamt 445 TWh
Solarthermie
%
41
55
© F
rau
nh
ofe
r ISE
Electricity
generation
Photovoltaics
147 GWel
Medium and large size CHP
(connected to dist rict heat ing)
60 GWel
Onshore
Wind
120 GWel
Offshore Wind
32 GWel
Slide courtesy Hans-Martin Henning 2014

© Fraunhofer ISE
18
Slide courtesy Hans-Martin Henning 2014
Investments in Energy System 2.0 vs. Saved Fuel Costs
Example Germany

© Fraunhofer ISE
19
Summarizing the German Experience
Germany defined a target energy system for 2050
and developed milestones for 2020/2030/2040
In most aspects the development is successful:
Renewable energies in the electricity sector
performed better than expected (25.4% in 2013)
due to the feed-in tariff (EEG), now the market
development is reduced by reduced tariffs
The grid expansion is on the way, however, due
to extensive participation processes with
stakeholder and citizens, the planning phase is
rather long
Electric vehicles goal is 1 Mio until 2020, there
are doubts to achieve this goal (13500 end of
2013)
However, there are strong discussions ongoing:
Increased electricity prices (partly by renewables)
Greenhouse gas emissions are increasing due to
increased coal firing (emission trading is not
working)
Efficiency is behind schedule

© Fraunhofer ISE
20
The example of the global photovoltaics market demonstrated how innovations
and market introduction work together to bring down the costs of this
technology, a key pillar of our future energy system
Similar developments are expected for many more technologies needed for the
energy transformation: energy storage, efficiency technologies, sustainable
mobility, smart grid……..
Government policy has first to actively support market introduction, later it is
sufficient to set rules for further growth of centralized and decentralized power
supply systems, driven by the economics of renewable energy
Germany has set the example, California is on a similar course, may be further
along, others are watching, more and more are following….
Nations who recognize the opportunities clearly will harvest great benefits!
Turning Potential into Reality – the landscape of successful energy transformation approaches

© Fraunhofer ISE
21
Thank you for your Attention!
Fraunhofer Institute for Solar Energy Systems ISE
Eicke R. Weber with many ISE coworkers
www.ise.fraunhofer.de