turnout in canadian provincial elections … · turnout in canadian provincial elections , ......
TRANSCRIPT

Slack in the System: Turnout in Canadian Provincial Elections, 1965-2009∗
Jared J. Wesley, University of Manitoba
Paper for Presentation at The Annual Meeting of the Canadian Political Science Association
Concordia University, Montreal June 3, 2010
Please do not cite without permission.
Abstract
As turnout continues its decline in most Western democracies, the term “popular vote” has become an increasingly outmoded measure of party performance and election results. By measuring party support among the voting public, such statistics ignore the role of non-voters in an election’s outcome. In staying home, an increasing number of citizens are helping to create “slack” in the system – a growing reserve of non-activated voters with the potential to affect the outcomes of present and future elections. This is seen quite clearly in the context of Canadian provincial elections, where non-voters now comprise the largest, and fastest-growing segment of most electorates. To gauge the impact of turnout on party performance, this research note introduces a new term – “the electoral vote”. By multiplying parties’ shares of the popular vote by the rate of voter turnout, thus incorporating the proportion of non-voters in each election, observers gain a better perspective of the composition of today’s provincial electorates. With this data as a baseline, analysts are better positioned to investigate the relationship between voter turnout and party performance in Canada and beyond.
∗ An earlier version of this paper was presented at the Annual Meeting of the Prairie Political Science Association (PPSA) (Mount Royal University, Calgary, October, 2009). Funding for this study was provided by the University of Manitoba Research Grants Program. Much thanks are owed to three research assistants – Kaila Mahoney, Maria Nyarku, and Angela Trunzo – without whose diligence this data would not have been compiled. Errors in analysis and interpretation remain those of the author.

Slack in the System Wesley
1
Introduction
In 2007, Premier Danny Williams of Newfoundland and Labrador led his
Progressive Conservative (PC) party to one of the most dominating performances in
Canadian history. When the ballots were counted on October 9, the PCs had collected
69.6 percent of the popular vote – the highest figure recorded in any provincial or
federal election in the past century. In the process, the Conservatives had reduced the
opposition to just 4 seats in a House of 48. Months later, on the opposite side of the
country, the results of the most recent Alberta election returned the eleventh
consecutive majority government for that province’s Progressive Conservatives. As in
Newfoundland, the PCs had achieved a resounding victory. Under new leader, Ed
Stelmach, the Conservatives increased their dominance of the 83-seat legislature,
adding 10 members to an already large caucus of 62. Equally impressive, the party won
52.7 percent of the popular vote, making their government a “true” or “earned”
majority (in contrast to the “manufactured” variety) (see Russell, 2008: 5-11).1
A second, common storyline accompanied the results of these two elections,
however. In Newfoundland and Labrador, fewer than two in three eligible voters turned
out to vote. While average by recent Canadian standards, at a rate of 61.3 percent, this
marked the province’s lowest level of voter participation in forty-five years (and the
second-lowest since it entered Confederation). Turnout dropped even lower in Alberta.
There, two in five eligible voters cast a ballot, setting a dubious new record for the
lowest rate in Canadian history (40.6 percent).
Thus, by examining each electorate in its entirety, observers gain a different
perspective on these two elections. Taking turnout into consideration, the
Newfoundland and Labrador Conservatives received the support of 42.6 percent of
eligible voters – still an admirable figure, but one considerably lower than their popular
vote share suggested. Further west, just over 1 in 5 eligible voters (21.4 percent) cast a
ballot in favor of Stelmach’s Tories. This odd combination – of high levels of party
performance, on one hand, and low voter turnout figures, on the other – casts

Slack in the System Wesley
2
considerable doubt on the utility of “popular vote” totals as an appraisal of election
outcomes.
Newfoundland and Labrador and Alberta are not alone. Declining voter turnout
has characterized most democratic systems over the past several decades. While the
sources of this trend have received much attention from scholars, discussions
surrounding the consequences of the decline on election results have been somewhat
less prevalent (see, e.g., Blais, 2006; Clarke et al., 2009a: ch. 8; Pammett and LeDuc,
2004). In particular, most in the political science community have avoided the question
of how lower rates of voter participation impact our perceptions of election outcomes
(but see: Lutz and Marsh, 2007; Martinez and Gill, 2006). By continuing to isolate
popular vote totals from turnout, observers misinterpret the effect of near-record
numbers of non-voters on the shape of global party systems.
To remedy this, this research note has four objectives. First, it presents a
comprehensive dataset on voter turnout in Canadian provincial elections, from 1965 to
2009. While elections at the federal level have received considerable attention,
surprisingly few comparative studies have been published on voter turnout at the sub-
national level in Canada (and elsewhere) (Studlar, 2001). Partly as a consequence, the
present study marks the first time in recent decades that this data has been reported in
a single document. Second, by combining this data with election returns from each
province, the analysis presents a new perspective on election outcomes. This discussion
is framed by revisiting the notion of “slack” – a term first introduced by Robert Dahl
(1961) to describe the (acceptable) level of non-participation in a given polity. Building
on this foundation, the analysis introduces a new concept – the “electoral vote” – as a
means of comparing the contours of each provincial electorate. By including non-
voters, the analysis offers a novel look at election results in each of the ten provinces,
over time. Third, discussion section addresses the normative implications of these
findings, before presenting a series of approaches toward the future study of provincial
turnout. And fourth, the paper concludes that, by examining electoral vote figures in
Slack in the System Wesley
3
lieu of popular vote totals, observers gain a more accurate perception of the results of
recent elections in Canada and beyond.
“Slack” in the System
Well before the marked decline in voter turnout throughout the Western world
in the late-twentieth century, scholars have long debated the value of political
participation in modern democracy. On one side, “populists” have decried the decline
in voter turnout as an affront to the very foundations of democratic societies (e.g.,
Barber, 1984; Gidengil et al., 2004: ch. 5; Lijphart, 1997; Pateman, 1970; Saul, 1995: ch.
3). One adherent summarized this view in the opening paragraph of a Royal
Commission study of Voter Turnout in Canada:
The act of voting in an election is perhaps the single most important form of political participation in modern democracies. It remains the most direct means available to citizens of signaling their interests and preferences to government and of controlling those who seek to govern them. The extent to which citizens exercise this most fundamental right can be seen as an indicator of the health of democracy. A low level of voter turnout can be taken as indicative of political alienation among a good proportion of the populace; as a consequence, elected leaders may not be seen as fully legitimate. A lack of confidence when manifested through low voter turnout may also affect the legitimacy of basic political institutions. Conversely, high voter turnout can be construed as evidence of both a high level of commitment to the political order and existence of a citizenry interested in the welfare of their nation (Bakvis, 1991: xvii).
On the other side, followers of the “elitist” school have downplayed the negative
implications of non-participation. Portraying the populist view as idealistic or mistaken,
members of this second group have highlighted the importance of maintaining a
“healthy” proportion of non-voters in each electorate (e.g., Almond and Verba, 1963:
16-30, 478-479; Mueller, 1999). Among them, Robert Dahl (1961: 305) explains this in
terms of the amount of “slack” in any given society:
Most of the time… most citizens use their resources for purposes other than gaining influence over government decisions. There is a great gap between their actual influence and their potential influence. Their
Slack in the System Wesley
4
political resources are, so to speak, slack in the system. In some circumstances these resources might be converted from non-political to political purposes; if so, the gap between the actual influence of the average citizen and his potential influence would narrow. However, Dahl (1961: 305) concludes, “in most societies, politics is a sideshow in
the great circus of life.” In this context, lower rates of voter turnout may be a symptom,
not of the poor health of a democracy, but the tacit approval by non-voters of the status
quo. Indeed, according to some adherents of this view, a purely participatory society
holds the potential for electoral volatility (and political instability), as well as sub-
optimal decision-making (Almond and Verba, 1963: 187; Lipset, 1981: 164). As long as
the rate of participation is evenly distributed among all segments of society – such that
no group is especially alienated from the voting process – and as long as the most
informed citizens are engaged – such that the ill-informed do not spoil important
deliberations – elitists assert that elections are serving their democratic function
(Rosema, 2007).
The following analysis does not choose sides in this debate. It is neither the
intent nor the product of this research note to address the issue of whether low rates of
voter turnout call into question the “legitimacy” of democratically elected governments
in the Canadian provinces. Indeed, the following analysis places a series of bold
question marks on the composition of Canada’s non-voting population. Without
ecological or micro-level analysis, for instance, one cannot establish whether those who
stayed home during the 2008 Alberta election were tacit in their support of the
governing Conservatives, alienated in their abandonment of the opposition, or simply
apathetic toward the entire electoral process.2
Nor does this study aim to explain the sources of low voter turnout in Canada.
Questions as to why slack exists in each province, and to such varying degrees, beg for
the type of comparative analysis outlined in the discussion section of this note. To
answer such questions would require a book-length treatment that is well beyond the
scope of the present analysis, however. While providing a useful series of dependent
variables for future investigation, again, such inquiries are left for future study.
Slack in the System Wesley
5
Instead, the objective of this article is far more modest. The following sections
reveal that, empirically, there is a lot of “slack” in most provincial electorates. Both
populists and elitists would agree with this conclusion. The analysis leaves open –
indeed, raises – important questions surrounding the attitudes and preferences of non-
voters, the causes of low turnout, and the normative implications attached to those
conclusions.
The “Electoral Vote”
Measuring the amount of slack in a given system requires examining election
results from the viewpoint of the entire electorate, not simply those citizens who cast
ballots. The latter approach yields figures based on the popular vote – a statistic that
has become increasingly outmoded, considering that non-voters now constitute the
fastest-growing segment of many electorates. The former vantage point employs an
alternative concept: the “electoral vote”.
The total electoral vote for a given election contains two key components: voters
and non-voters. In the Canadian provinces, the first element is usefully obtained by
examining the performances of individual parties.3 Each party’s share of the electoral
vote is calculated by multiplying its share of the popular vote by the rate of voter
turnout in a given election. For example, assume a party obtained 50 percent of the
popular vote in an election in which voter turnout was 60 percent. This party’s share of
the electoral vote would be 30 percent (50 x .60), reflecting the fact that it had the
expressed electoral support of 3 in 10 eligible voters. The terms “expressed” and
“eligible” are key to this definition, as actual support for this party may be higher or
lower than its share of the popular vote would indicate, depending upon its popularity
among non-voters.
The second component of the electoral vote represents the proportion of non-
voters in a given election. With additional investigation, it may be possible to further
sub-divide this population into a variety of different groups, like permanent versus
temporary non-voters (see Laponce, 1967). Without the aid of comprehensive survey

Slack in the System Wesley
6
data, however, the following discussion treats non-voters as a single bloc. Thus, for
most elections, the combined shares of the electoral vote obtained by all parties, plus
the total proportion of non-voters in the election, sums close to 100 percent.4
Findings
Using this conceptualization, the following sections sketch the contours of each
provincial electorate, west to east, since 1965. By way of introduction, Table 1.0 depicts
the minimum, maximum, and mean turnout rates for each province. The ensuing
discussion suggests links between the performance of major parties and the proportion
of non-voters in each province, carefully avoiding issues of causality. When observing a
coincidence between, say, the sudden downturn in a New Democratic Party’s support
and a decline in voter turnout, it is tempting to conclude that NDP supporters stayed
home on Election Day. While plausible, such a verdict falls victim to the ecological
fallacy: one cannot draw conclusions about individual voters based on aggregate-level
data. Instead, focusing on non-voting in the collective sense, the following analysis
describes the expansion and contraction of “slack” in the various provincial electorates
over time. From a macroscopic perspective, the findings suggest where at least some of
the existing non-voting population may have originated, and offer some indication of
which parties stand to gain most by ‘picking up the slack.’ It cannot be stressed strongly
enough, however: these findings do not purport to make predictions at the individual
(micro) level. Further survey or ecological analysis is needed to draw such conclusions.
Western Canada
Figure 1.0 displays voter turnout rates for the Western Canadian provinces of
British Columbia (BC), Alberta, Saskatchewan, and Manitoba.5 As illustrated, turnout has
fallen considerably, if unsteadily, in three of the four jurisdictions over time. The decline
began earliest in Alberta, where, despite brief recoveries in the 1980s, participation
rates have fallen from a high of 72.0 percent in 1971 to a low of 40.6 in 2008. A similar
story exists in Manitoba, where, since 1973, voter turnout has declined by nearly 25
Slack in the System Wesley
7
percentage points (notwithstanding minor increases in 1988 and 2007). Turnout began
its decline a decade later in BC, with comparable results. There, the rate of voter
participation has fallen with increasing velocity from 77.7 percent in 1983 to 51.0
percent in 2009. Saskatchewan is the one Western Canadian exception to this trend.
Turnout in that province remained the highest in the region, fluctuating very little,
through the 1980s. Following a precipitous decline in 1991, when turnout fell from 83.2
to 64.6 percent, the rate of voter participation in Saskatchewan has recovered steadily
and considerably, reaching 76.0 percent in 2007. This prolonged increase in voter
turnout makes Saskatchewan’s pattern a rarity in recent Canadian elections, and an
anomaly in the West.
BRITISH COLUMBIA
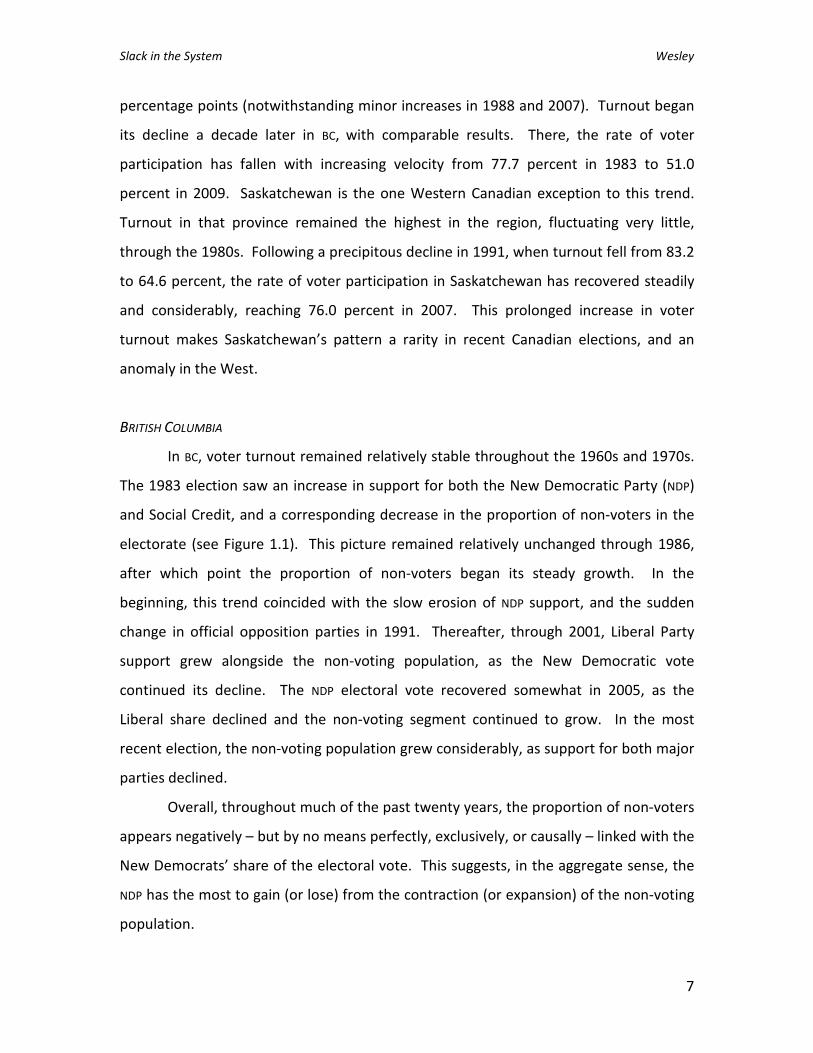
In BC, voter turnout remained relatively stable throughout the 1960s and 1970s.
The 1983 election saw an increase in support for both the New Democratic Party (NDP)
and Social Credit, and a corresponding decrease in the proportion of non-voters in the
electorate (see Figure 1.1). This picture remained relatively unchanged through 1986,
after which point the proportion of non-voters began its steady growth. In the
beginning, this trend coincided with the slow erosion of NDP support, and the sudden
change in official opposition parties in 1991. Thereafter, through 2001, Liberal Party
support grew alongside the non-voting population, as the New Democratic vote
continued its decline. The NDP electoral vote recovered somewhat in 2005, as the
Liberal share declined and the non-voting segment continued to grow. In the most
recent election, the non-voting population grew considerably, as support for both major
parties declined.
Overall, throughout much of the past twenty years, the proportion of non-voters
appears negatively – but by no means perfectly, exclusively, or causally – linked with the
New Democrats’ share of the electoral vote. This suggests, in the aggregate sense, the
NDP has the most to gain (or lose) from the contraction (or expansion) of the non-voting
population.
Slack in the System Wesley
8
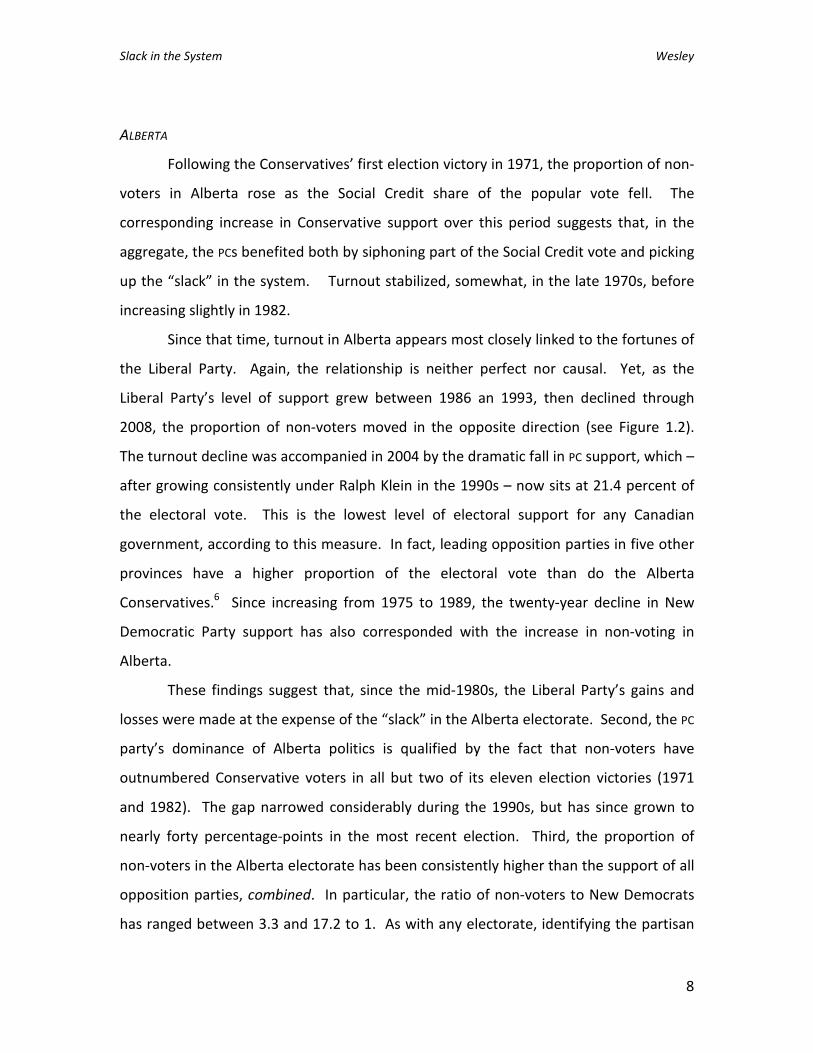
ALBERTA
Following the Conservatives’ first election victory in 1971, the proportion of non-
voters in Alberta rose as the Social Credit share of the popular vote fell. The
corresponding increase in Conservative support over this period suggests that, in the
aggregate, the PCs benefited both by siphoning part of the Social Credit vote and picking
up the “slack” in the system. Turnout stabilized, somewhat, in the late 1970s, before
increasing slightly in 1982.
Since that time, turnout in Alberta appears most closely linked to the fortunes of
the Liberal Party. Again, the relationship is neither perfect nor causal. Yet, as the
Liberal Party’s level of support grew between 1986 an 1993, then declined through
2008, the proportion of non-voters moved in the opposite direction (see Figure 1.2).
The turnout decline was accompanied in 2004 by the dramatic fall in PC support, which –
after growing consistently under Ralph Klein in the 1990s – now sits at 21.4 percent of
the electoral vote. This is the lowest level of electoral support for any Canadian
government, according to this measure. In fact, leading opposition parties in five other
provinces have a higher proportion of the electoral vote than do the Alberta
Conservatives.6 Since increasing from 1975 to 1989, the twenty-year decline in New
Democratic Party support has also corresponded with the increase in non-voting in
Alberta.
These findings suggest that, since the mid-1980s, the Liberal Party’s gains and
losses were made at the expense of the “slack” in the Alberta electorate. Second, the PC
party’s dominance of Alberta politics is qualified by the fact that non-voters have
outnumbered Conservative voters in all but two of its eleven election victories (1971
and 1982). The gap narrowed considerably during the 1990s, but has since grown to
nearly forty percentage-points in the most recent election. Third, the proportion of
non-voters in the Alberta electorate has been consistently higher than the support of all
opposition parties, combined. In particular, the ratio of non-voters to New Democrats
has ranged between 3.3 and 17.2 to 1. As with any electorate, identifying the partisan

Slack in the System Wesley
9
leanings of Alberta non-voters is beyond the scope of this study. Suffice it to say that,
while non-voters hold the largest share of the popular vote in Alberta, by any measure,
the Conservatives continue to outperform both major opposition parties by a large
margin.
SASKATCHEWAN
Despite several transformations of its party system, and in the face of substantial
fluctuations in the electoral vote shares of each major party, turnout remained
remarkably stable in Saskatchewan through the early-1990s. Non-voting increased
somewhat in the 1970s, as the Conservatives displaced the Liberals as the province’s
right-wing alternative (see Figure 1.3). Turnout then recovered in the 1980s, as the
party system polarized between the NDP and PCs.
The level of non-voting increased dramatically between 1991 and 1995,
however. Once more, this change corresponded with a transition in the Saskatchewan
party system. The Conservatives’ share of the electoral vote continued its precipitous
decline and the Liberals rose to second-place status, setting the stage for the birth of a
new right-wing party later that decade. Turnout increased marginally in 1999, as many
Conservatives and Liberals joined forces under the Saskatchewan (Sask) Party banner
(Wishlow, 2001). The NDP’s share of the electoral vote declined steadily throughout this
decade, before rising again in 2003. All told, the past three elections have featured
polarized campaigns between the New Democrats and the Sask Party, and a steadily
declining proportion of non-voters.
This brief history reveals that greater amounts of “slack” in the Saskatchewan
party system tend to coincide with partisan instability on the right side of the province’s
political spectrum. Polarization of the party system into two highly-competitive forces –
the Liberals and New Democrats in 1971, the Conservatives and NDP in the 1980s, and
the Sask Party and the New Democrats in the first decade of the twenty-first century –
has corresponded with higher levels of turnout.
Slack in the System Wesley
10
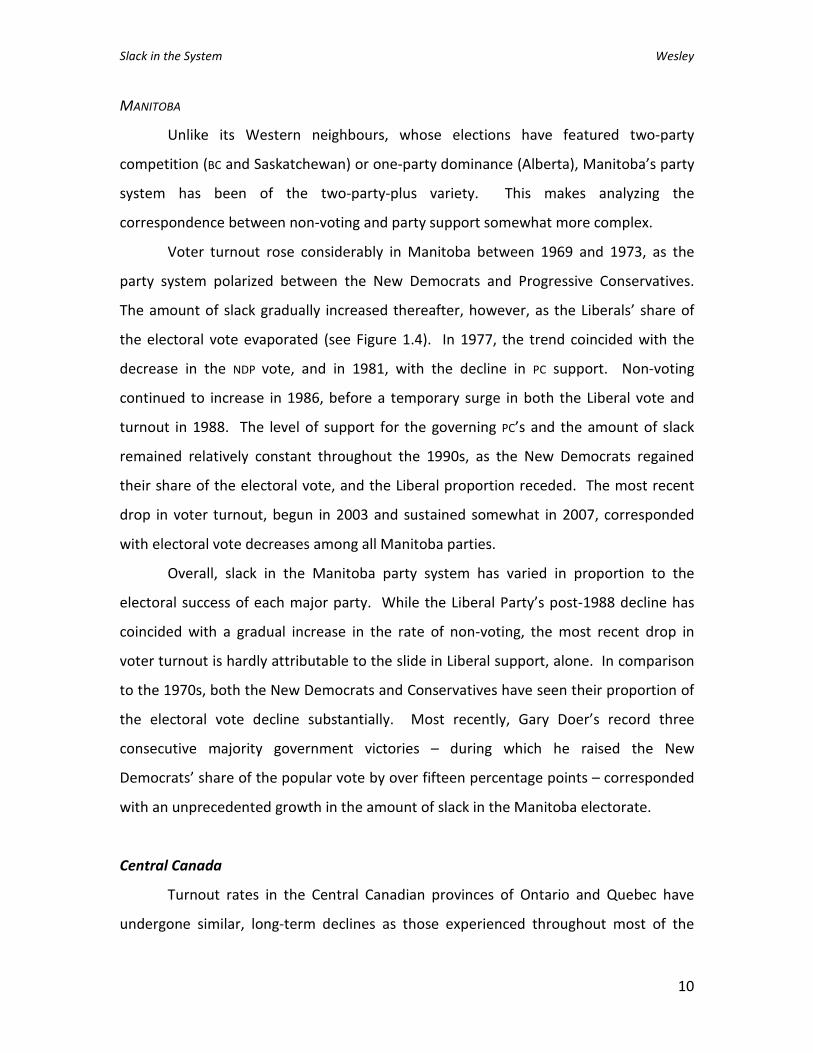
MANITOBA
Unlike its Western neighbours, whose elections have featured two-party
competition (BC and Saskatchewan) or one-party dominance (Alberta), Manitoba’s party
system has been of the two-party-plus variety. This makes analyzing the
correspondence between non-voting and party support somewhat more complex.
Voter turnout rose considerably in Manitoba between 1969 and 1973, as the
party system polarized between the New Democrats and Progressive Conservatives.
The amount of slack gradually increased thereafter, however, as the Liberals’ share of
the electoral vote evaporated (see Figure 1.4). In 1977, the trend coincided with the
decrease in the NDP vote, and in 1981, with the decline in PC support. Non-voting
continued to increase in 1986, before a temporary surge in both the Liberal vote and
turnout in 1988. The level of support for the governing PC’s and the amount of slack
remained relatively constant throughout the 1990s, as the New Democrats regained
their share of the electoral vote, and the Liberal proportion receded. The most recent
drop in voter turnout, begun in 2003 and sustained somewhat in 2007, corresponded
with electoral vote decreases among all Manitoba parties.
Overall, slack in the Manitoba party system has varied in proportion to the
electoral success of each major party. While the Liberal Party’s post-1988 decline has
coincided with a gradual increase in the rate of non-voting, the most recent drop in
voter turnout is hardly attributable to the slide in Liberal support, alone. In comparison
to the 1970s, both the New Democrats and Conservatives have seen their proportion of
the electoral vote decline substantially. Most recently, Gary Doer’s record three
consecutive majority government victories – during which he raised the New
Democrats’ share of the popular vote by over fifteen percentage points – corresponded
with an unprecedented growth in the amount of slack in the Manitoba electorate.
Central Canada
Turnout rates in the Central Canadian provinces of Ontario and Quebec have
undergone similar, long-term declines as those experienced throughout most of the

Slack in the System Wesley
11
West (see Figure 2.0). From a high point of 73.5 percent in 1971 to a new low of 54.1
percent in 2007, voter participation in Ontario has undergone two, separate downward
trends, interrupted by a brief upturn during the 1980s. Turnout in Ontario has been
consistently lower than in Quebec, with the latter experiencing a similar ‘rolling’ pattern
of decline. Participation in Quebec provincial elections peaked at 85.3 percent in 1976,
and surged again in 1994 (81.6 percent). Notwithstanding these two elections, however,
Quebec voters continue to participate at lower rates as time passes.
ONTARIO
As in Manitoba, changes to voter turnout rates appear linked to the fortunes of
several parties, at various points in Ontario’s history. As the proportion of non-voters
increased steadily in the 1970s, all three parties lost some ground in terms of their net
share of the electoral vote (see Figure 2.1). For the New Democrats, this decline
occurred throughout the entire decade; for the Conservatives, between 1971 and 1975;
for the Liberals, between 1975 and 1981. The 1980s were a separate decade. As
electoral support for the Liberals (1981 to 1987) and NDP (1981 to 1990) rose, so, too,
did voter turnout. Meanwhile, the PC vote declined steadily. With the return of the
Conservatives to power in 1995 came a return to the long-term trend of declining voter
turnout. The dramatic drop in NDP support corresponded with growth in both the
Liberal vote and non-voting population. Since 1999, NDP support has stabilized, and the
PCs’ share of the electoral vote has declined. All the while, the proportion of non-voters
in the Ontario electorate has grown, complemented in 2007 by a drop in Liberal
support.
In terms of the relationship between turnout and party performance, Ontario
resembles Manitoba in many respects. At different times, the performance of different
parties has appeared tied to changes in voter turnout in both provinces. There is one
noticeable difference between the two jurisdictions, however. Whereas major parties
in Manitoba have gained relatively large shares of the electoral vote, nearing if not
exceeding the proportion of non-voters in most contests, in Ontario, non-voters have

Slack in the System Wesley
12
made up the largest segment of the provincial electorate in all but one election (1971).
This difference is attributable to the lower level of voter turnout in Ontario, and the
more even division of the popular vote within its three-party system.
QUEBEC
The picture is somewhat clearer in Quebec. As illustrated in Figure 2.2, one of
the most obvious trends concerns the inverse relationship between support for the
sovereigntist Parti Quebecois (PQ) and the amount of slack provincial electorate. Surges
in support for the PQ in the mid-1970s and early-1990s coincided with noticeable
increases in voter turnout. Conversely, as Parti Quebecois support waned in the mid-
1980s and began its latest descent in the late-1990s, the level of non-voting has
increased substantially. Since the turn of the twenty-first century, the gap between
non-voters and PQ voters has grown. In the longer term, the Liberal Party’s share of
Quebec’s electoral vote has been in continuous decline since the mid-1980s. From 1994
to 2007, this trend corresponded with a growth in the amount of slack in the system.
Over the same period, growth in support for the right-wing Action democratique du
Quebec (ADQ) was positively correlated with the increase in slack. In the most recent
election, as voter turnout plummeted to an all-time low, electoral vote shares for the
Liberals and PQ held firm, while ADQ fortunes fell.
These findings suggest that, historically, the Parti Quebecois has had the most to
gain by picking up the slack in the provincial electorate, and the most to lose when voter
turnout has declined. If the 2008 drop in ADQ fortunes is linked, whatsoever, with the
dramatic increase in non-voting, this analysis also points to a second pattern.
Throughout the 1970s and early-1980s, erratic support for the Union Nationale (UN) – a
small c-conservative party – coincided with inconsistent rates of voter turnout. When
the UN folded following the 1981 election, there was a corresponding increase in the
amount of slack in the system.7 Turnout levels were restored in 1994, alongside with a
boost in support for the PQ and the arrival of the right-wing, autonomist ADQ. The
precipitous decline in the latter’s share of the electoral vote in 2008 coincided, once

Slack in the System Wesley
13
again, with an increase in the proportion of non-voters. These observations suggests
that, in part, slack in Quebec appears connected not only to the sovereigntist vote (in
the form of the PQ), but to the conservative vote (in the form of the UN and ADQ).
Atlantic Canada
As a region, throughout much of the past four decades, the Atlantic provinces
have featured some of the highest rates of voter turnout in Canada. This said, most
provinces have experienced the same long-term pattern of ‘rolling’ decline as their
Central and Western neighbours (see Figure 3.0). Since its high-point in 1982 (82.1
percent), and notwithstanding a marginal increase in 1999, voter turnout in New
Brunswick has fallen steadily over the past three decades. Likewise, Nova Scotia’s
electoral history has featured two periods of decline: from 1978 to 1984 (when turnout
fell over 10 percentage-points to 67.5 percent) and again from 1988 to 2009 (when it
dropped almost 18 percentage points to 58.0 percent). Turnout in Newfoundland and
Labrador has fluctuated more than in any other Canadian province. After reaching a
Canadian record in 1971 (87.9 percent), voter participation declined to the low-70
percent range throughout much of the next decade. It then climbed to a height of 83.6
percent in 1993, before descending, unsteadily, to a depth of 61.3 percent in 2007. As
in BC, Alberta, Ontario, and Quebec, the most recent elections in each of these three
Atlantic provinces have resulted in the lowest rates of voter turnout in the history of
their jurisdictions. The sole exception to this Eastern Canadian trend exists in Prince
Edward Island (PEI), where turnout has remained well above the Canadian average.
Indeed, even at its lowest point (78.2 percent in 1982), turnout in PEI was still higher
than in the peak years of Nova Scotia, Ontario, Alberta, and BC. This makes PEI one of
the few jurisdictions to avoid the secular decline in voter turnout experienced
throughout much of the Western world.

Slack in the System Wesley
14
NEW BRUNSWICK
The history of the electoral vote in New Brunswick is somewhat counterintuitive.
Contrary to many assumptions surrounding the relationship between competitiveness
and voter turnout (e.g., Abramson et al., 2007), the level of non-voting in New
Brunswick actually increased during the 1970s and 2000s – decades in which the
Liberals and PCs were locked in a dead heat in terms of the popular (and electoral) vote
(see Figure 3.1). A gradual increase in the popularity of the NDP coincided with a boost
in voter turnout later in the 1970s; after plateauing in the 1980s, both figures retreated
once again in the 1990s. Throughout both of these decades, support for the Liberals
and Conservatives fluctuated, without any discernible relationship to the increasing
amount of slack in the system. Indeed, turnout was actually higher during the Liberals’
landslide victory in 1987 (in which the party won every seat in the New Brunswick
legislature), than it was throughout the 1970s. (Of note, however, the proportion of
nonvoters actually increased between 1982 and 1987.)
Since 2003, with of the collapse of the PC vote and further decline in voter
turnout, the New Brunswick electorate has been divided evenly between three principal
segments: Liberals, Conservatives, and non-voters. That year, for the first time in the
province’s history, a larger proportion of the New Brunswick electorate failed to cast a
ballot than voted for any one, single party. (It was a feat repeated in 2006).
NOVA SCOTIA
With the exception of a dramatic drop in voter turnout following the 1984
provincial campaign, elections in Nova Scotia have featured a relatively close, positive
link between support for the NDP, on one hand, and levels of non-voting, on the other
(see Figure 3.2). Both figures have risen gradually, but noticeably, over the past four
decades. Indeed, following two consecutive Conservative minority governments, this
trend culminated in 2009 with the New Democrats attaining control of a majority
government for the first time in Nova Scotia history. At the same time, notwithstanding
brief moments of success for the Liberals in 1974, 1988, and 1993, and the
Slack in the System Wesley
15
Conservatives in 1978 and 1999, the electoral vote of each old-line party has been in
long-term decline. This was particularly evident between 1978 and 1984, as turnout fell
at roughly the same rate as the Liberal and Tory fortunes. The Liberals’ recovery in 1988
briefly stemmed the tide, but the increase in non-voting has continued apace in the
subsequent six elections. Taken together, these macro-level trends suggest that, while
the New Democrats may have picked up some of this slack in their rise to power, their
improved performance has not stemmed the decline in voter turnout.
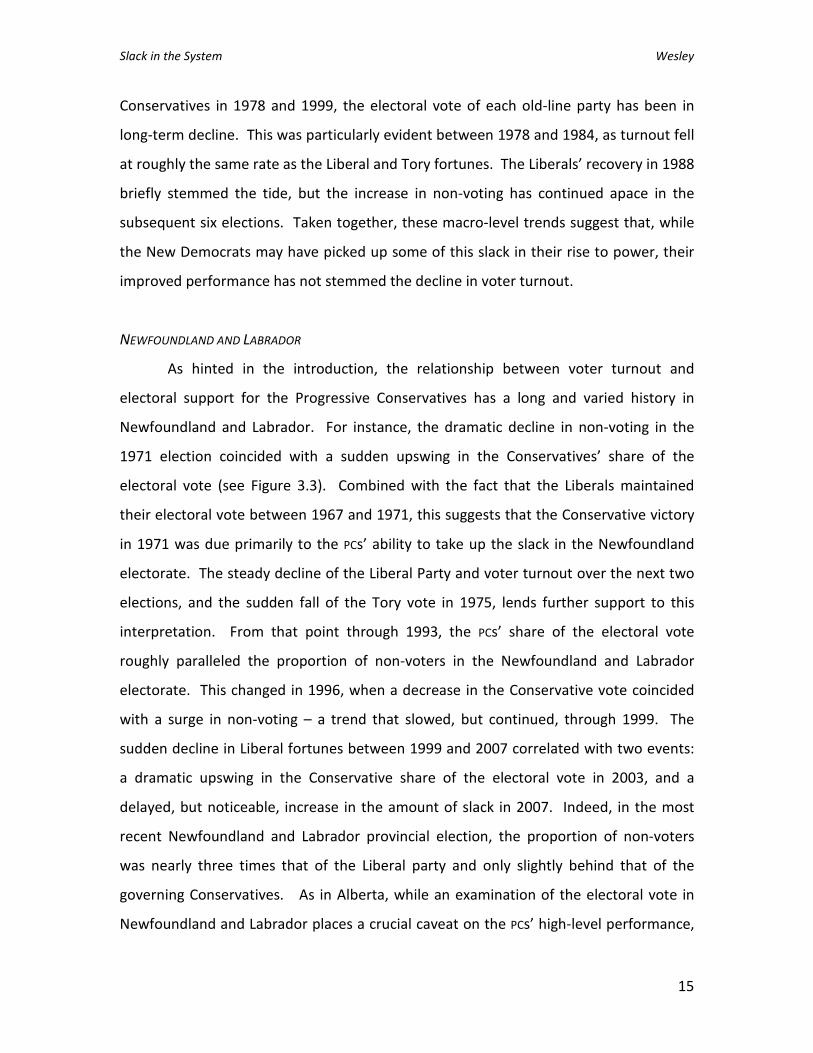
NEWFOUNDLAND AND LABRADOR
As hinted in the introduction, the relationship between voter turnout and
electoral support for the Progressive Conservatives has a long and varied history in
Newfoundland and Labrador. For instance, the dramatic decline in non-voting in the
1971 election coincided with a sudden upswing in the Conservatives’ share of the
electoral vote (see Figure 3.3). Combined with the fact that the Liberals maintained
their electoral vote between 1967 and 1971, this suggests that the Conservative victory
in 1971 was due primarily to the PCs’ ability to take up the slack in the Newfoundland
electorate. The steady decline of the Liberal Party and voter turnout over the next two
elections, and the sudden fall of the Tory vote in 1975, lends further support to this
interpretation. From that point through 1993, the PCs’ share of the electoral vote
roughly paralleled the proportion of non-voters in the Newfoundland and Labrador
electorate. This changed in 1996, when a decrease in the Conservative vote coincided
with a surge in non-voting – a trend that slowed, but continued, through 1999. The
sudden decline in Liberal fortunes between 1999 and 2007 correlated with two events:
a dramatic upswing in the Conservative share of the electoral vote in 2003, and a
delayed, but noticeable, increase in the amount of slack in 2007. Indeed, in the most
recent Newfoundland and Labrador provincial election, the proportion of non-voters
was nearly three times that of the Liberal party and only slightly behind that of the
governing Conservatives. As in Alberta, while an examination of the electoral vote in
Newfoundland and Labrador places a crucial caveat on the PCs’ high-level performance,

Slack in the System Wesley
16
the Conservatives continue to draw far more electoral support than any of their
competitors.
PRINCE EDWARD ISLAND
Compared with other provinces, the level of non-voting in Prince Edward Island
elections has remained relatively stable over the past forty years (see Figure 3.4). With
the exception of the 1982 to 1986 period, during which non-voting fell from an all-time
high of 21.8 percent to a record low 12.4 percent, turnout in PEI provincial elections has
settled in the mid-80 percent range. Tracking the relationship between slack and party
performance is challenging, given the consistency of the former and the relative
volatility of the latter.
From 1970 to 1982, for example, the Liberal Party’s share of the electoral vote
fell from a peak of 51.0 percent to 35.8 percent. Over the same timeframe,
Conservative support rose a net 5.7 percentage points. The level of non-voting
increased marginally and unsteadily over this period. From 1970 to 1974, non-voting
moved in the opposite direction of declining Liberal and Conservative party support. In
the subsequent election, non-voting fell as the PCs increased their share of the popular
vote. In the three elections from 1978 to 1982, non-voting increased again, as the
Liberals’ share of the electoral vote declined. As the Liberals regained their support in
1986, non-voting fell once more, just as it had during the Tories’ rise in popularity in
1978.
A similarly vexing pattern existed between 1989 and 2000. Over the course of
these four elections, support for the Liberals and Conservatives moved in opposite
directions as the two parties traded places in office. The Liberals’ share of the electoral
vote fell from 49.0 to 28.6 percent, while PC support climbed the same 20 percentage-
points. This dramatic shift in party fortunes corresponded with minor changes in voter
turnout. The level of non-voting dipped from 19.3 percent in 1993 to 14.5 percent in
1996, just as the Conservatives replaced the Liberals in government (and NDP support

Slack in the System Wesley
17
climbed slightly). Since that time, the two major parties have once again traded turns in
office, yet non-voting has crept up only slightly, reaching 16.2 percent in 2007.
These findings reveal few discernible, long-term relationships between turnout
and party fortunes in PEI. At times, minor variation in the amount of slack appeared
correlated with changes to either Conservative or Liberal support; at others, it appeared
tied to the performance of both parties, or to neither. If any pattern exists, it appears
that turnout rates increase, slightly, in close elections. (The rate of non-voting
decreased in 1978, 1986, and 1996 – three elections in which competitiveness
increased.) Further empirical testing is required to confirm this hypothesis.
Discussion
In addition to traditional statistics like popular vote shares and voter turnout
rates, the foregoing analysis has provided a series of new data for the study of party
systems and elections in the Canadian provinces. Examining the “electoral vote” allows
analysts to examine the electorate in its entirety, and offers a novel perspective on the
election outcomes.
Elitists may see little reason for concern in the findings presented above. After
all, recent research at the federal level indicates that there is very little distinguishing
the political views of voters and non-voters (Rubenson et al., 2007), and a preliminary
analysis of the 2008 Alberta provincial election produced similar results (Sayers and
Stewart, 2008). While their historical and geographic scope remains limited,
collectively, these studies offer little reason to believe that the outcomes of provincial
elections would have differed drastically, had more citizens turned out to vote.
Moreover, from the elitist standpoint, provided non-voting is evenly distributed
across the entire population, long-term increases in the amount of slack in most
provincial party systems may be an indication of the health of Canadian democracy. The
fact that non-voters now make up the largest segment of nearly every provincial
electorate (except Saskatchewan, Newfoundland and Labrador, and PEI) may suggest to
them that most voters feel satisfied – pleased with the status quo; content that their
Slack in the System Wesley
18
vote will not make much of a difference, given that a change in government is unlikely
to result in a change to their everyday lives; or comfortable allowing someone else to
make the necessary decision on Election Day (see: Hibbing and Theiss-Morse, 2002;
Mueller, 1999: chs. 6-8). Moreover, many elitists may view the non-voting population
as so-called “couch” supporters of the governing party (who see little reason to turnout,
given that their party of choice will win the election, regardless of their vote); “closet”
supporters of the opposition (who see only futility in casting a ballot for a losing party);
or “political drop-outs” (who are so ill-informed that their participation in the election
could only serve to distort the outcome).8
By contrast, populists are likely to be concerned with the findings of this study.
Examining the mean levels of support for governing parties in the various provinces,
critics may point to the fact that parliamentary majorities are being built on the
expressed support of much smaller proportions of these electorates. This is illustrated
in Figure 4.1, which depicts the extent to which governing parties’ shares of seats in
various provincial legislatures (1PSC) dwarf their shares of the popular vote (1PVC) and
electoral vote (1PEC). Among all provinces, the average governing party has controlled
an average of 66.5 percent of seats in the legislature, on the strength of just under half
(48.0 percent) of the popular vote. This disparity is cause for concern among those
favouring more proportional forms of representation. Yet the distortion of provincial
election results is even greater considering the actual proportion of the electorate
casting ballots for the governing party. On this count, parties forming government
following provincial elections have earned the expressed support of 34.4 percent of
eligible voters. This means that the typical provincial government has enjoyed a two-
thirds majority in the legislature based on the support of just over one-third of the
entire electorate.
This may lead some populists to consider the amount of legislative “payoff”
typical governing parties receive, based on their proportion of popular and electoral
support. Figure 4.2 depicts the ratio of seat-share won by the governing party to its
shares of the popular and electoral vote. There, we see that support-to-seat inflation is
Slack in the System Wesley
19
by far the greatest in Alberta. On average, for every percent of support among
participating voters, governing parties receive 1.5 percent of seats in the Alberta
Legislature. In large part, this is the product of the province’s first-past-the-post
electoral system, political geography, and divisions within the opposition. This
compares with an average popular vote payoff of 1.4 in the rest of Canada, to a low of
1.3 in Manitoba. For every percent of support among eligible voters, however,
governing parties in Alberta receive over 2.7 percent of seats. Governing parties in
British Columbia (2.0) and Ontario (2.2) also received at least a two-to-one return in
terms of their share of the electoral vote. This return was lowest in Prince Edward
Island (1.7), where a strong two-party system and high level of turnout have served to
limit the electoral vote payoff.
Other populists may point to several surveys at the federal level that challenge
the assumption that non-voters in Canadian elections are drawn proportionately from
all segments of the population. Studies consistently report an under-representation of
youth, Aboriginals, recent immigrants, members of visible minority communities, people
with lower levels of education, and lower-income individuals among Canadian voters
(see: Blais et al., 2002: ch. 3; Gidengil et al., 2004: 108-116; Nevitte et al., 2000: ch. 5;
Pammett, 1991). This “participatory distortion” suggests that only certain types of
people are involved in the electoral process (Verba et al., 1995: 468). This may
establishe a situation in which active citizens are over-represented in terms of their
influence on public policy, yet unrepresentative of the general population with respect
to some politically relevant characteristic(s). These qualities may include not only policy
preferences and partisan orientations, but demographics and socio-economic status, as
well. Because they are more likely to vote (or otherwise engage in politics), public
officials are more likely to hear, respond to, and behave proactively in the interests of
the most active citizens and groups. By the same token, parties have fewer incentives
to engage with those people and communities who are least likely to participate. These
distortions may create a vicious cycle, in that marginalized groups may feel even less
inclined to vote, thus further distancing themselves from the electoral process.

Slack in the System Wesley
20
In addition, some populists may argue that, rather than being ‘partisans-in-
waiting’, non-voters are actually non- or anti-partisans. Rather than conforming to
“Duverger’s law” and switching their allegiance to other parties, these non-voters may
be exercising Hirschman’s “exit” option by staying home on Election Day (Duverger,
1967 [1951]; Hirschman, 1970). From this perspective, the choice to abstain is not a
ballot foregone, but a vote for “none of the above” (Clarke et al., 2009b).
Without further research at the provincial level, it is impossible to decide
between these two normative evaluations of the data presented in this article. Federal-
level survey data appears to support both causes, and applying these findings to the
provincial level requires the tenuous assumption that the same (sorts of) people vote
(and do not vote) in both types of elections (Scarrow, 1960; Studlar, 2001). As Gidengil
et al. (2004: 120) concluded in their brief examination of voting in the Canadian
provinces, despite considerable research at the national level, “the puzzle remains why
the decline in turnout has taken longer to show up – and has shown up less consistently
– in provincial elections than in federal elections.” Put simply, more research is needed
to settle the debate between populists and elitists.
In this vein, three approaches commend themselves to the future study of
turnout and party performance in the Canadian provinces: macroscopic comparison,
ecological analysis, and micro-level study. The first technique involves using aggregate-
level data to compare electoral vote figures across time and/or space. In their seminal
study of voter turnout in 91 countries over 23 years, Blais and Dobrzynska (1998)
provide an excellent model for this type of research (see also: Blais et al., 2003; Geys,
2006; Kim et al., 1975; Powell, 1986). In particular, analysts could examine the effect of
“competitiveness” on turnout in provincial elections, either by comparing provinces to
each other, or examining trends within specific jurisdictions over time (for models, see:
Abramson et al., 2007; LeDuc and Pammett, 2006). This would reveal whether closer
elections, or more competitive party systems, lead to higher rates of turnout.
Fortunately for students of provincial politics, Alan Siaroff (2006) has compiled an
impressive database containing just such information, including seven separate

Slack in the System Wesley
21
measures of electoral competition. Combined with the data provided in this article, and
employing typical institutional and socio-economic control variables, the resulting
analysis would prove an effective test of the relationship between electoral
competitiveness and voter turnout, at the macro-level.
A second approach would involve examining turnout from the constituency-level
perspective. By dividing each province into its electoral districts, this type of
“ecological” analysis would study the environmental (or contextual) factors related to
voter participation (Eagles, 1991). For instance, it may be that turnout is lower in so-
called “safe seat” constituencies than in more competitive ones, regardless of the party
controlling the district (see: Blais and Lago, 2009). Conversely, one may find that Liberal
constituencies have a higher proportion of non-voters than those held by NDP members,
regardless of the level of competitiveness of the riding. Compiling constituency-by-
constituency results for Canadian provincial elections is an enormously time-consuming
task. Where such data is available, it is not always in electronic format, forcing
researchers to perform manual transcription. Fortunately, a Canadian Elections
Database is presently under construction, under the guidance of Anthony Sayers and the
Institute for Advanced Policy Research at the University of Calgary. Once completed,
this database will be of tremendous use to the academic community.
Third, analysts could take a micro-level approach toward studying turnout and
party performance. Through interviews, focus groups, or surveys, scholars could study
the attitudes and partisan preferences of the voting and non-voting populations. This
could lead to the conclusion that non-voters in some provinces are predominantly
Liberal, for instance, whereas those in other jurisdictions are mostly Conservative,
independent, or entirely anti-partisan. In conjunction with these studies, researchers
may opt to simulate election results as if the entire electorate had participated, gaining
a sense of whether turnout affects election outcomes (e.g., Martinez and Gill, 2006).
Election studies, let alone surveys specifically-designed to study non-voting, are
regrettably rare in the Canadian provinces.9 Of those that do exist, most are very recent
(precluding any historical analysis of previous elections), and many have been

Slack in the System Wesley
22
conducted by election authorities (whose objectives often did not involve asking
respondents about their partisan leanings).10 An analysis of the 2000 Canadian federal
election, conducted by Rubenson et al. (2007), serves as an excellent model for future
research of the survey variety, although analysts remain challenged in terms of engaging
non-voters as participants in such studies. Ideally, a coordinated analysis –of a pan-
Canadian nature, spanning a series of election cycles, and involving a combination of
methodologies – would be of greatest use in the area of provincial politics.
Pursued in tandem, these three approaches would yield much-needed insight
into the relationship between party performance and turnout in the Canadian
provinces. Johnston et al.’s study of “Turnout and the Party System in Canada, 1988-
2004” (2007) and Franklin’s groundbreaking analysis of Voter Turnout and the Dynamics
of Electoral Competition in Established Democracies Since 1945 (2004) serve as useful
prototypes for this type of multi-method research. Yet, the value of such comparative,
provincial studies extends well beyond this country’s borders. The Canadian provinces
offer an ideal set of laboratories for comparative analysis in general, and the
investigation of voter turnout, in particular. Throughout most of their common history,
politics in these ten communities have been based on common Westminster
parliamentary traditions. Broadly speaking, most provinces share similar demographic
profiles, economic foundations, and electoral institutions. Indeed, what subtle
differences exist between the ten provinces are very conducive to most-similar-system
comparisons. By sketching the contours of each provincial electorate since 1965, the
foregoing article offers a tentative, but necessary, first step in developing this research
programme.
Conclusion
Examining the “electoral vote” offers observers a new perspective on election
results in the Canadian provinces. With turnout continuing to decline in most
jurisdictions, an examination of popular vote totals overlooks the existence of an ever-
growing proportion of these electorates. In all but three provinces (Saskatchewan,
Slack in the System Wesley
23
Newfoundland and Labrador, and Prince Edward Island), non-voters now constitute the
largest segment of the eligible voting population. This means that, on the most recent
Election Day in each of the remaining seven provinces, more people stayed home than
cast ballots for the eventual victor. Researchers ignore such a large proportion of the
population at their own peril.
It also means that there is a substantial amount of “slack” in most provincial
electorates. In some cases, the growth in non-voting appears attributable to a drop in
one party’s popularity. The fortunes of the NDP in British Columbia, the Liberals in
Alberta, right-wing parties in Saskatchewan, and the Parti Quebecois in Quebec appear
closely tied to the level of voter turnout in those provinces. In other places, the slack
seems to have been drawn from across the party system, as in Manitoba, Ontario, New
Brunswick, Nova Scotia, and PEI. On occasion, some parties seem to have captured the
support of the non-voting population, improving their own share of the electoral vote
by ‘taking up the slack’ in the system. This appeared to be the case in 1971, when
Conservative Parties in Alberta and Newfoundland and Labrador first rose to power.
These types analyses are only possible when the entire electorate is brought
under investigation. As non-voters become a larger component of most political
systems, analysts must reconsider the way they view election results. This means
moving beyond measures like “popular vote” – which examine the behavior of a
shrinking voting population – toward new concepts like the “electoral vote”. Such was
the purpose of this research note – not to solve definitively those mysteries surrounding
voter turnout in the Canadian provinces, but to demonstrate the types of questions
raised by a holistic examination of each provincial electorate. Armed with these data
and questions, students of provincial politics, and elections more broadly, are better
positioned to engage in the study of turnout and elections in Western democracies.
Slack in the System Wesley
24
Notes
1 “True” majorities are relatively rare in recent Canadian elections, a fact that makes the
Tories’ accomplishments in Newfoundland and Alberta especially remarkable. Since
1965, in only 1 of 14 federal elections has a single party garnered over 50 percent of the
popular vote (1988). The same feat has been accomplished a total of 38 times in 120
provincial elections, over the same period. (This number decreases significantly when
Newfoundland and Labrador [8 of 13] and Prince Edward Island [12 of 13] are excluded.) 2 Sayers and Stewart (2008) take an important first step toward answering these
questions in their “Preliminary Analysis” of non-voters in Alberta. See also: Johnston et
al. (2006). 3 For simplicity, this paper discusses polity-level results based on party performance.
Electoral vote is calculable at the constituency- or poll-level, as well, and can be
determined by examining individual candidates’ returns. 4 Those voters supporting independents and casting spoiled ballots make up the
remainder of the electorate. 5 Notes on the source data are included in the Appendix.
6 At the time of writing, the New Democrats in British Columbia and Saskatchewan, the
Conservatives in Manitoba and Prince Edward Island, and the Liberals in Newfoundland
and Labrador all have higher proportions of the electoral vote than do the governing
Alberta PCs. 7 There was also an increase in support for independent candidates and minor parties,
including the Equality Party (which won four seats in the 1989 election). 8 The term “drop-out” is borrowed from Milner (2007). 9 For a surveys of voters and nonvoters at the federal level in Canada, see Environics
Research Group (2006), Elections Canada (2005) , and Pammet and LeDuc (2003). 10 To study the two most recent provincial elections in their respective jurisdictions,
Elections Manitoba (see: Prairie Research Associates, 2004; 2008), Elections BC (BC
Stats, 2005, 2009), and Elections Alberta (Leger Marketing, 2008) have commissioned

Slack in the System Wesley
25
several voter/non-voter surveys. None of these studies examined the relationship
between turnout and partisanship or vote choice.

Turnout, “Slack”, and the “Electoral Vote” in Canadian Provincial Elections
27
Appendix
Source data for this article were compiled directly from provincial election
authorities (e.g., Elections British Columbia and Elections Manitoba). Wherever
possible, turnout figures were recorded as stated in official reports of the various Chief
Electoral Officers. This was not possible for Newfoundland and Labrador, where official
turnout statistics were never reported. There, following the convention applied by
election authorities in other provinces, turnout was calculated by the author as the
number of total votes cast divided by the total number of registered voters (see also:
Blais and Dobrzynska, 1998: 241; Geys, 2006: 638-639).
The year 1965 was selected as a starting point for this study, based on the
following considerations. Several provinces did not have fully-functioning, independent
election authorities prior to this date; as a result, few maintained reliable records of
election results in the early twentieth century. Indeed, no voter turnout statistics are
available for New Brunswick or Prince Edward Island prior to this date; in neither
province did authorities maintain a list of eligible voters for use as a denominator in
calculating turnout. Moreover, election officials in provinces like Saskatchewan are
reticent to endorse statistics compiled in the first half of the twentieth century.
The tables and figures below offer as much reliable information on the various
Canadian jurisdictions as could be compiled from available sources. Only “relevant”
parties have been included in this analysis (Sartori, 1976: 123). Abbreviations are as
follows: Liberal Party (LIB), Liberal-Progressive Party (LibProg), New Democratic Party
(NDP), Progressive Conservative Party (PC), Saskatchewan Party (SP), and Social Credit
(SC). Much thanks is owed to Alan Siaroff (2006) for the use of his election results data.
Meticulous research assistance was provided by Maria Nyarku and Kaila Mahoney. Any
errors in transcription belong to the author.
Turnout, “Slack”, and the “Electoral Vote” in Canadian Provincial Elections
39
Bibliography
Abramson, Paul R., Abraham Diskin and Dan S. Felsenthal. 2007. "Nonvoting and the Decisiveness of Electoral Outcomes." Political Research Quarterly. 60: 500-15.
Almond, Gabriel and Sidney Verba. 1963. The Civic Culture: Political Attitudes and Democracy in Five Nations. Princeton: Princeton University Press.
Bakvis, Herman, ed. 1991. Voter Turnout in Canada. Toronto: Dundurn Press. Barber, Benjamin R. 1984. Strong Democracy: Participatory Politics for a New Age.
Berkeley: University of California Press. BC Stats. 2005. Elections BC Non-Voters Survey Final Report. BC Stats.
http://www.elections.bc.ca/docs/rpt/2005%20Non-Voters%20Survey%20-%20Final%20Report.pdf (September 7, 2009).
BC Stats. 2009. 2009 Elections BC Post-Election Voter/Non-Voter Satisfaction Survey Executive Summary Report. BC Stats. http://www.elections.bc.ca/docs/rpt/2009-Voter-Non-Voter-Satisfaction-Survey-20090826.pdf (September 7, 2009).
Blais, Andre. 2006. "What Affects Voter Turnout?" Annual Review of Political Science. 9: 111-25.
Blais, André and Agnieszka Dobrzynska. 1998. "Turnout in Electoral Democracies." European Journal of Political Research. 33: 239-61.
Blais, André, Elisabeth Gidengil, Richard Nadeau and Neil Nevitte. 2002. Anatomy of a Liberal Victory: Making Sense of the 2000 Canadian Election. Peterborough: Broadview Press.
Blais, Andre and Ignacio Lago. 2009. "A General Measure of District Competitiveness." Electoral Studies. 28: 94-100.
Blais, Andre, Louis Massicotte and Agnieszka Dobrzynska. 2003. Why is Turnout Higher in Some Countries than in Others? Elections Canada. http://www.elections.ca/loi/tur/tuh/TurnoutHigher.pdf
Clarke, Harold D., Allan Kornberg and Thomas J. Scotto. 2009a. Making Political Choices: Canada adn the United States. Toronto: University of Toronto Press.
Clarke, Harold D., Allan Kornberg and Thomas J. Scotto. 2009b. "None of the Above: Voters in the 2008 Federal Election." In The Canadian Federal Election of 2008. Jon Pammett and Christopher Dornan, eds. Toronto: Dundurn Press.
Dahl, Robert. 1961. Who Governs: Democracy and Power in an American City. New Haven: Yale University Press.
Duverger, Maurice. 1967 [1951]. Political Parties: Their Organization and Activity in the Modern State. New York: John Wiley & Sons, Inc.
Eagles, Munroe. 1991. "Voting and Non-Voting in Canadian Federal Elections: An Ecological Analysis." In Voter Turnout in Canada Herman Bakvis, ed. Toronto: Dundurn Press.

Turnout, “Slack”, and the “Electoral Vote” in Canadian Provincial Elections
40
Elections Canada. 2005. Results of the Public Opinion Survey at the 2004 General Election. Elections Canada. http://www.elections.ca/loi/res/gese04/gese04_e.pdf
Environics Research Group. 2006. Public Opinion Survey at the 39th General Election. Environics Research Group. http://www.elections.ca/loi/res/gese06/gese06_e.pdf (July 15, 2009).
Franklin, Mark N. 2004. Voter Turnout and the Dynamics of Electoral Participation in Established Democracies since 1945. Cambridge: Cambridge University Press.
Geys, Benny. 2006. "Explaining Voter Turnout: A Review of Aggregate-Level Research." Electoral Studies. 25: 637-63.
Gidengil, Elisabeth, André Blais, Neil Nevitte and Richard Nadeau. 2004. Citizens. Vancouver: UBC Press.
Hibbing, John R. and Elizabeth Theiss-Morse. 2002. Stealth Democracy. New York: Cambridge University Press.
Hirschman, Albert O. 1970. Exit, Voice, and Loyalty: Responses to Decline in Firms, Organizations, and States. Cambridge: Harvard University Press.
Johnston, Richard, J. Scott Matthews and Amanda BIttner. 2007. "Turnout and the Party System in Canada, 1988-2004." Electoral Studies. 26: 735-45.
Johnston, W.A., Harvey Krahn and Trevor Harrison. 2006. "Democracy, Political Institutions, and Trust: The Limits of Current Electoral Reform Proposals." Canadian Journal of Sociology. 31: 165-82.
Kim, Jae-On, John R. Petrocik and Stephen N. Enokson. 1975. "Voter Turnout Among the American States: Systemic and Individual Components." American Political Science Review. 69: 107-23.
Laponce, J.A. 1967. "Non-Voting and Non-Voters: A Typology." Canadian Journal of Economics and Political Science. 33: 75-87.
LeDuc, Lawrence and Jon Pammett. 2006. "Voter Turnout in 2006: More Than Just the Weather." In The Canadian Federal Election of 2006. Jon Pammett and Christopher Dornan, eds. Toronto: Dundurn Press.
Leger Marketing. 2008. Elections Alberta - Evaluation of Voters and Non-Voters: Research Report. Elections Alberta. http://www.elections.ab.ca/Public%20Website/files/Documents/Elections_Alberta_-_Voters.pdf (June 9, 2008).
Lijphart, Arend. 1997. "Unequal Participation: Democracy's Unresolved Dilemma." American Political Science Review. 91: 1-14.
Lipset, Seymour Martin. 1981. Political Man: The Social Bases of Politics. Baltimore: Johns Hopkins University Press.
Lutz, Georg and Michael Marsh. 2007. "Consequences of Low Turnout." Electoral Studies. 26: 539-47.
Martinez, Michael D. and Jeff Gill. 2006. "Does Turnout Decline Matter? Electoral Turnout and Partisan Choice in the 1997 Canadian Federal Election." 39: 343-62.
Milner, Henry. 2007. "The Problem of Political Drop-outs: Canada in Comparative Perspective." In Canadian Parties in Transition. Alain-G Gagnon and A. Brian Tanguay, eds. 3rd Edition. Scarborough: Nelson.
Turnout, “Slack”, and the “Electoral Vote” in Canadian Provincial Elections
41
Mueller, John. 1999. Capitalism, Democracy and Ralph's Pretty Good Grocery. Princeton: Princeton University Press.
Nevitte, Neil, André Blais, Elisabeth Gidengil and Richard Nadeau. 2000. Unsteady State: The 1997 Canadian Federal Election. Don Mills, ON: Oxford University Press.
Pammett, Jon H. 1991. "Voting Turnout in Canada." In Voter Turnout in Canada Herman Bakvis, ed. Toronto: Dundurn Press.
Pammett, Jon H. and Lawrence LeDuc. 2003. Explaining the Turnout Decline in Federal Elections: A New Survey of Non-voters. Ottawa: Elections Canada.
Pammett, Jon and Lawrence LeDuc. 2004. "Behind the Turnout Decline." In The Canadian Federal Election of 2004. Jon Pammett and Christopher Dornan, eds. Toronto: Dundurn Press.
Pateman, Carole. 1970. Participation and Democratic Theory. Cambridge: Cambridge University Press.
Powell, G. Bingham. 1986. "American Voter Turnout in Comparative Perspective." American Political Science Review. 80: 17-43.
Prairie Research Associates. 2004. Low Voter Turnout: A Survey of Voters and Non-voters. Elections Manitoba. http://www.electionsmanitoba.ca/pdf/MB_Voter_Turnout_Survey.pdf (March 10, 2004).
Prairie Research Associates. 2008. Voter Turnout in the 2007 Provincial General Election: A Survey of Voters and Non-Voters. Elections Manitoba. http://www.electionsmanitoba.ca/galleries/download/Studies/Voter_NonVoterSurvey_2008.pdf (July 17, 2009).
Rosema. 2007. "Low Turnout: Threat to Democracy or Blessing in Disguise? Consequences of Citizens' Varying Tendencies to Vote." Electoral Studies. 26: 612-23.
Rubenson, Daniel, Andre Blais, Patrick Fournier, Elisabeth Gidengil and Neil Nevitte. 2007. "Does Low Turnout Matter? Evidence from the 2000 Canadian Federal Election." Electoral Studies. 26: 589-97.
Russell, Peter H. 2008. Two Cheers for Minority Government: The Evolution of Canadian Parliamentary Democracy. Toronto: Emond Montgomery Publications.
Sartori, Giovanni. 1976. Parties and Party Systems: A Framework for Analysis. Cambridge: Cambridge University Press.
Saul, John Ralston. 1995. The Unconscious Civilization. Concord, ON: House of Anansi Press.
Sayers, Anthony and David Stewart. 2008. "Non Voters in Alberta: A Preliminary Analysis." Paper presented at the Annual Meeting of the Atlantic Provinces Political Science Association, Saint Mary's University, Halifax.
Scarrow, Howard A. 1960. "Federal-Provincial Voting Patterns in Canada." Canadian Journal of Economics and Political Science. 26: 289-98.
Siaroff, Alan. 2006. "Provincial Political Data Since 1900." In Provinces: Canadian Provincial Politics. Christopher Dunn, ed. 2nd Ed. Peterborough: Broadview.
Turnout, “Slack”, and the “Electoral Vote” in Canadian Provincial Elections
42
Studlar, Donley T. 2001. "Canadian Exceptionalism: Explaining Differences over Time in Provincial and Federal Voter Turnout." Canadian Journal of Political Science. 34: 299-319.
Verba, Sidney, Kay Lehman Schlozman and Henry Brady. 1995. Voice and Equality: Civic Voluntarism in American Poliitcs. Cambridge: Harvard University Press.
Wishlow, Kevin. 2001. "Rethinking the Polarization Thesis: The Formation and Growth of the Saskatchewan Party, 1997-2001." In Saskatchewan Politics: Into the Twenty-First Century. Howard Leeson, ed. Regina: Canadian Plains Research Centre.
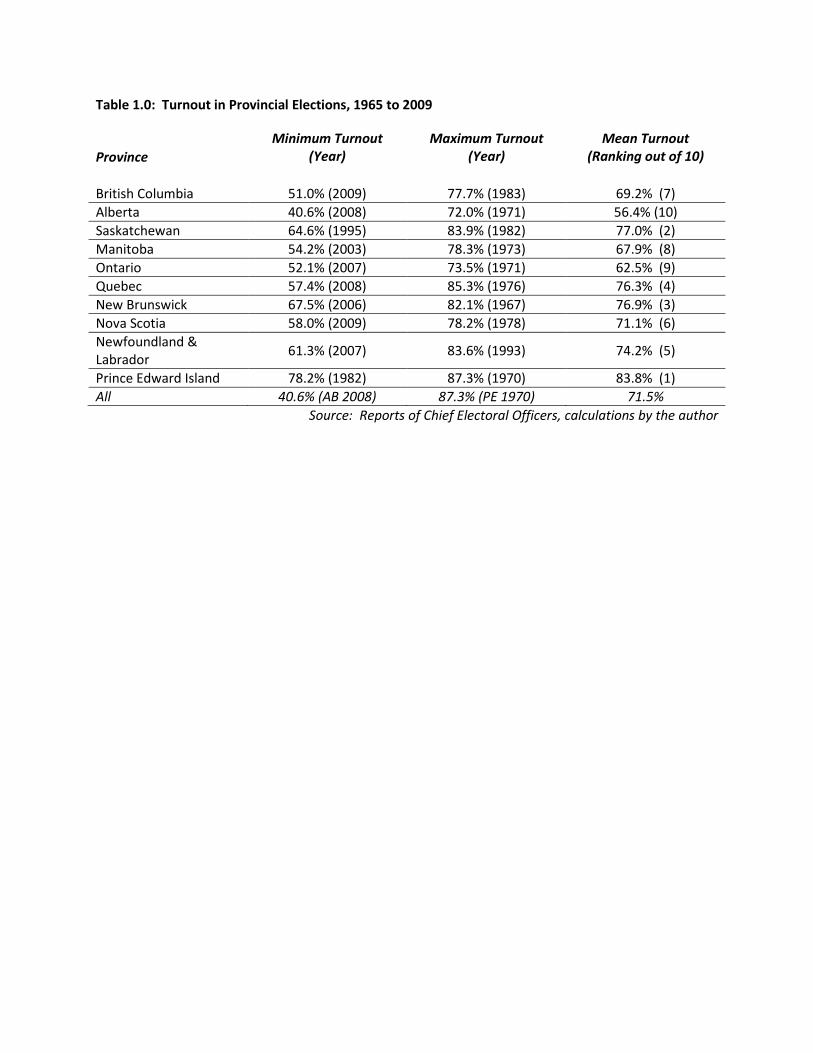
Table 1.0: Turnout in Provincial Elections, 1965 to 2009
Province Minimum Turnout
(Year)
Maximum Turnout (Year)
Mean Turnout (Ranking out of 10)
British Columbia 51.0% (2009) 77.7% (1983) 69.2% (7) Alberta 40.6% (2008) 72.0% (1971) 56.4% (10) Saskatchewan 64.6% (1995) 83.9% (1982) 77.0% (2) Manitoba 54.2% (2003) 78.3% (1973) 67.9% (8) Ontario 52.1% (2007) 73.5% (1971) 62.5% (9) Quebec 57.4% (2008) 85.3% (1976) 76.3% (4) New Brunswick 67.5% (2006) 82.1% (1967) 76.9% (3) Nova Scotia 58.0% (2009) 78.2% (1978) 71.1% (6) Newfoundland & Labrador 61.3% (2007) 83.6% (1993) 74.2% (5)
Prince Edward Island 78.2% (1982) 87.3% (1970) 83.8% (1) All 40.6% (AB 2008) 87.3% (PE 1970) 71.5%
Source: Reports of Chief Electoral Officers, calculations by the author

Figure 1.0: Voter Turnout in Provincial Elections, Western Canada (1965-2009)
0
10
20
30
40
50
60
70
80
90
100
1965
1967
1969
1971
1973
1975
1977
1979
1981
1983
1985
1987
1989
1991
1993
1995
1997
1999
2001
2003
2005
2007
2009
Election Year
Vote
r Tur
nout
(rep
orte
d)
BC
AB
SK
MB

Figure 1.1: Electoral Vote in British Columbia Provincial Elections (1966-2009)
0
10
20
30
40
50
60
70
Election Year
Elec
tora
l Vot
e
NDP 22.9 23.4 27.2 27.3 31.8 34.9 32.9 30.6 28.2 15.3 25.9 21.5
LIB 13.8 13.1 11.2 5.0 0.3 2.1 5.2 25.0 29.9 40.9 28.6 23.4
SC 31.1 32.3 21.4 34.3 33.3 38.7 38.1 18.1 6.6 2.3 0.0 0.0
Non-Voters 31.7 31.1 31.4 30.2 30.9 22.3 22.8 24.9 28.5 29.1 37.6 49.0
1966 1969 1972 1975 1979 1983 1986 1991 1996 2001 2005 2009

Figure 1.2: Electoral Vote in Alberta Provincial Elections (1967-2008)
0
10
20
30
40
50
60
70
Election Year
Elec
tora
l Vot
e
NDP 10.3 8.2 7.7 9.3 12.3 13.8 14.1 6.6 5.1 4.2 4.6 3.5
LIB 7.0 0.7 3.0 3.6 1.2 5.8 15.4 23.9 18.8 14.4 13.1 10.7
PC 16.7 33.4 37.4 33.7 41.1 24.3 23.7 26.8 29.4 32.7 20.9 21.4
SC 28.7 29.6 10.8 11.7 0.5 0.0 0.3 1.4 3.9 0.3 0.5 0.0
Non-Voters 35.7 28.0 40.4 41.3 34.0 52.7 46.4 39.8 42.6 47.1 55.3 59.4
1967 1971 1975 1979 1982 1986 1989 1993 1997 2001 2004 2008

Figure 1.3: Electoral Vote in Saskatchewan Provincial Elections (1967-2007)
0
10
20
30
40
50
60
70
Election Year
Elec
tora
l Vot
e
NDP 34.6 45.8 32.2 38.2 31.5 37.1 42.4 30.5 25.4 31.7 28.3
LIB 35.6 35.6 25.4 11.0 3.8 8.2 19.4 22.4 13.2 10.1 7.1
PC 7.7 1.7 22.2 30.3 45.4 36.6 21.2 11.6 0.3 0.1 0.1
SP 25.9 27.9 38.7
Non-Voters 21.9 16.8 19.7 20.6 16.1 17.9 16.8 35.4 34.5 29.1 24.0
1967 1971 1975 1978 1982 1986 1991 1995 1999 2003 2007

Figure 1.4: Electoral Vote in Manitoba Provincial Elections (1966-2007)
0
10
20
30
40
50
60
70
Election Year
Elec
tora
l Vot
e
NDP 14.9 24.7 33.1 29.2 34.3 28.2 17.5 19.9 22.7 30.3 26.8 27.2
LIB 21.3 15.5 14.9 9.3 4.9 9.4 26.3 19.5 16.4 9.1 7.2 7.0
PC 25.7 23.0 28.7 36.9 31.7 27.6 28.4 29.0 29.7 27.8 19.7 21.5
Non-Voters 35.7 35.6 21.7 24.4 27.6 32.1 26.0 31.0 30.8 31.9 45.8 43.2
1966 1969 1973 1977 1981 1986 1988 1990 1995 1999 2003 2007

Figure 2.0: Voter Turnout in Provincial Elections, Central Canada (1965-2009)
0
10
20
30
40
50
60
70
80
90
100
1965
1967
1969
1971
1973
1975
1977
1979
1981
1983
1985
1987
1989
1991
1993
1995
1997
1999
2001
2003
2005
2007
2009
Election Year
Vote
r Tur
nout
(rep
orte
d)
ON
QC
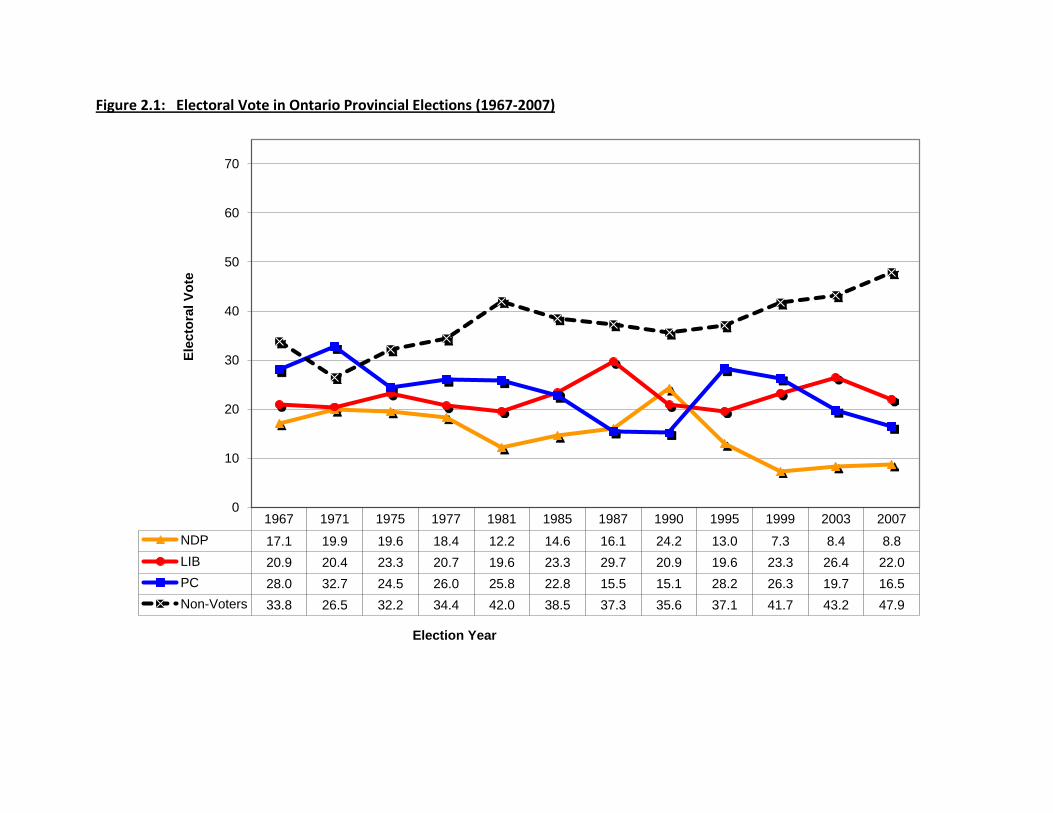
Figure 2.1: Electoral Vote in Ontario Provincial Elections (1967-2007)
1967 1971 1975 1977 1981 1985 1987 1990 1995 1999 2003 2007NDP 17.1 19.9 19.6 18.4 12.2 14.6 16.1 24.2 13.0 7.3 8.4 8.8LIB 20.9 20.4 23.3 20.7 19.6 23.3 29.7 20.9 19.6 23.3 26.4 22.0PC 28.0 32.7 24.5 26.0 25.8 22.8 15.5 15.1 28.2 26.3 19.7 16.5Non-Voters 33.8 26.5 32.2 34.4 42.0 38.5 37.3 35.6 37.1 41.7 43.2 47.9
0
10
20
30
40
50
60
70
Elec
tora
l Vot
e
Election Year

Figure 2.2: Electoral Vote in Quebec Provincial Elections (1966-2008)
1966 1970 1973 1976 1981 1985 1989 1994 1998 2003 2007 2008PQ 19.5 24.3 35.3 40.6 29.3 30.1 36.5 33.6 23.4 20.2 20.2LIB 34.8 38.2 44.0 28.8 38.0 42.4 37.4 36.2 34.1 32.3 23.6 24.2UN 30.0 16.5 3.9 15.5 3.3ADQ 5.3 9.2 12.9 22.0 9.4Non-Voters 26.4 15.8 19.6 14.7 17.5 24.4 25.1 18.4 21.7 29.6 28.8 42.6
0
10
20
30
40
50
60
70
Elec
tora
l Vot
e
Election Year
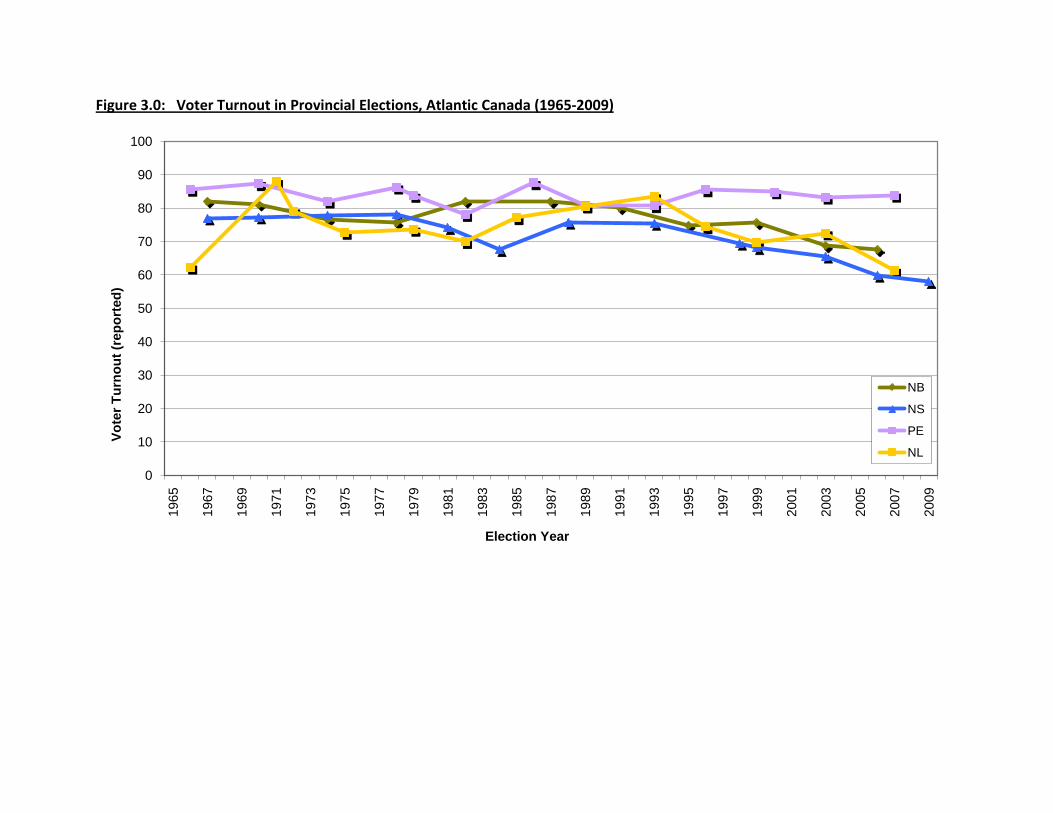
Figure 3.0: Voter Turnout in Provincial Elections, Atlantic Canada (1965-2009)
0
10
20
30
40
50
60
70
80
90
100
1965
1967
1969
1971
1973
1975
1977
1979
1981
1983
1985
1987
1989
1991
1993
1995
1997
1999
2001
2003
2005
2007
2009
Vote
r Tur
nout
(rep
orte
d)
Election Year
NB
NS
PE
NL
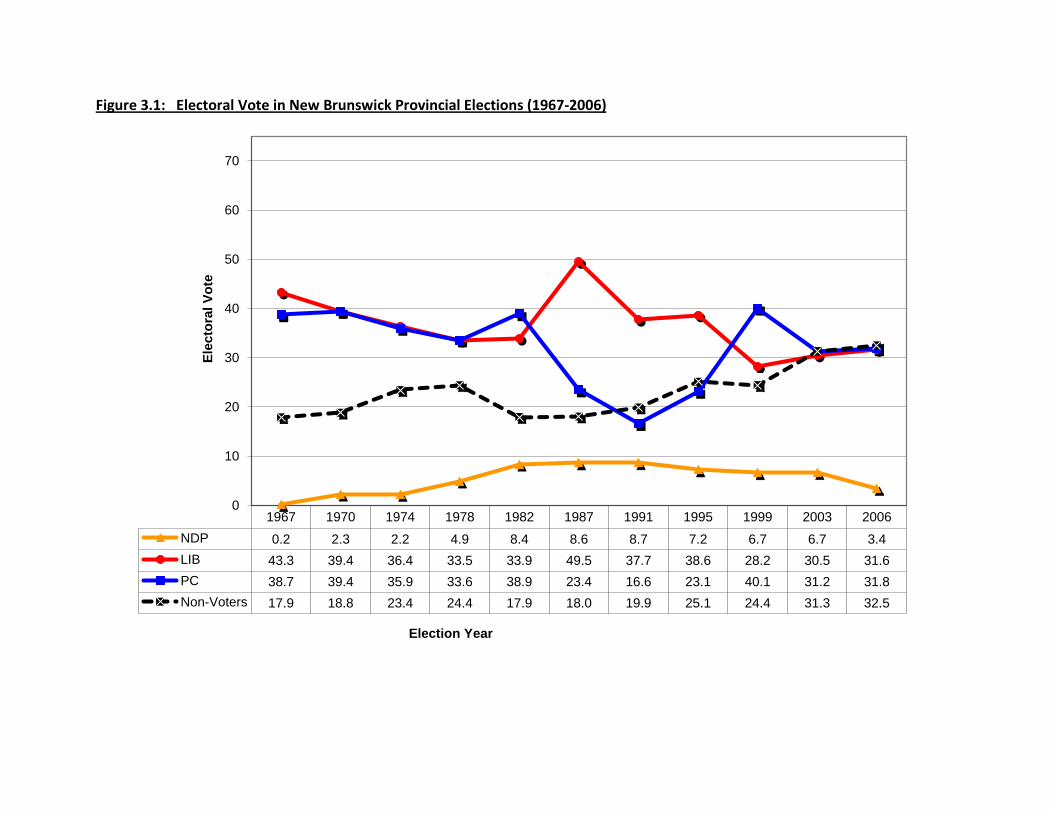
Figure 3.1: Electoral Vote in New Brunswick Provincial Elections (1967-2006)
1967 1970 1974 1978 1982 1987 1991 1995 1999 2003 2006NDP 0.2 2.3 2.2 4.9 8.4 8.6 8.7 7.2 6.7 6.7 3.4LIB 43.3 39.4 36.4 33.5 33.9 49.5 37.7 38.6 28.2 30.5 31.6PC 38.7 39.4 35.9 33.6 38.9 23.4 16.6 23.1 40.1 31.2 31.8Non-Voters 17.9 18.8 23.4 24.4 17.9 18.0 19.9 25.1 24.4 31.3 32.5
0
10
20
30
40
50
60
70
Elec
tora
l Vot
e
Election Year
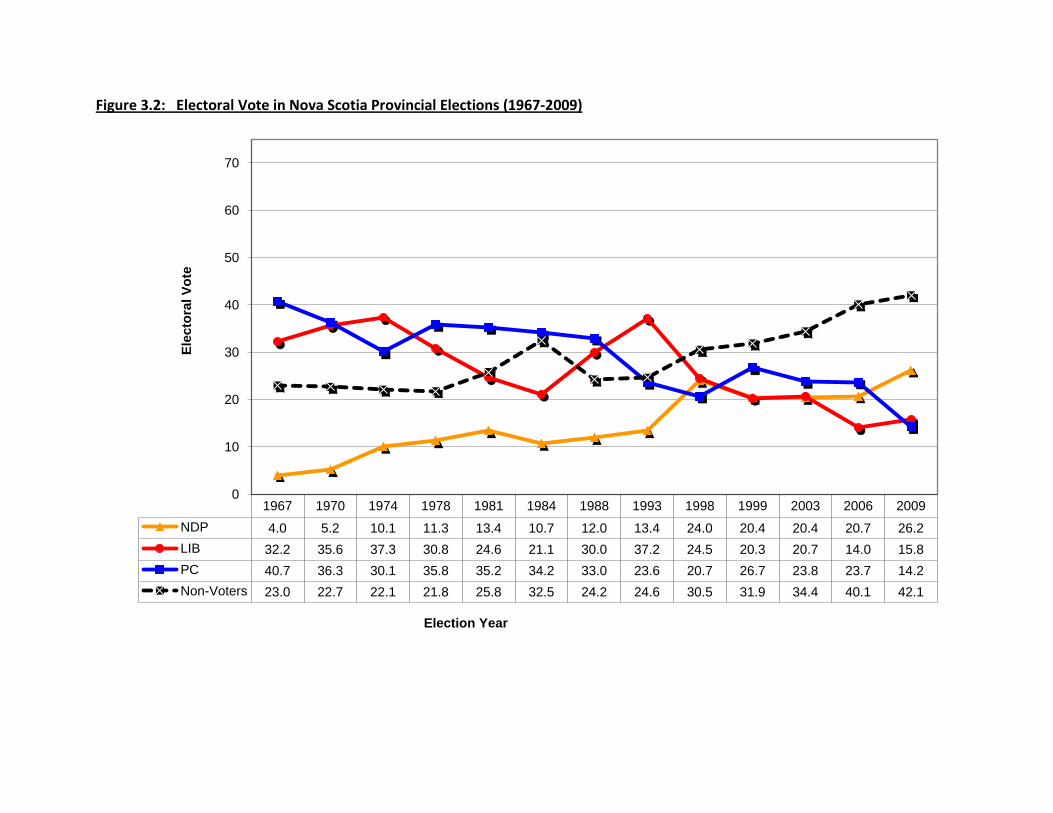
Figure 3.2: Electoral Vote in Nova Scotia Provincial Elections (1967-2009)
1967 1970 1974 1978 1981 1984 1988 1993 1998 1999 2003 2006 2009NDP 4.0 5.2 10.1 11.3 13.4 10.7 12.0 13.4 24.0 20.4 20.4 20.7 26.2LIB 32.2 35.6 37.3 30.8 24.6 21.1 30.0 37.2 24.5 20.3 20.7 14.0 15.8PC 40.7 36.3 30.1 35.8 35.2 34.2 33.0 23.6 20.7 26.7 23.8 23.7 14.2Non-Voters 23.0 22.7 22.1 21.8 25.8 32.5 24.2 24.6 30.5 31.9 34.4 40.1 42.1
0
10
20
30
40
50
60
70
Elec
tora
l Vot
e
Election Year
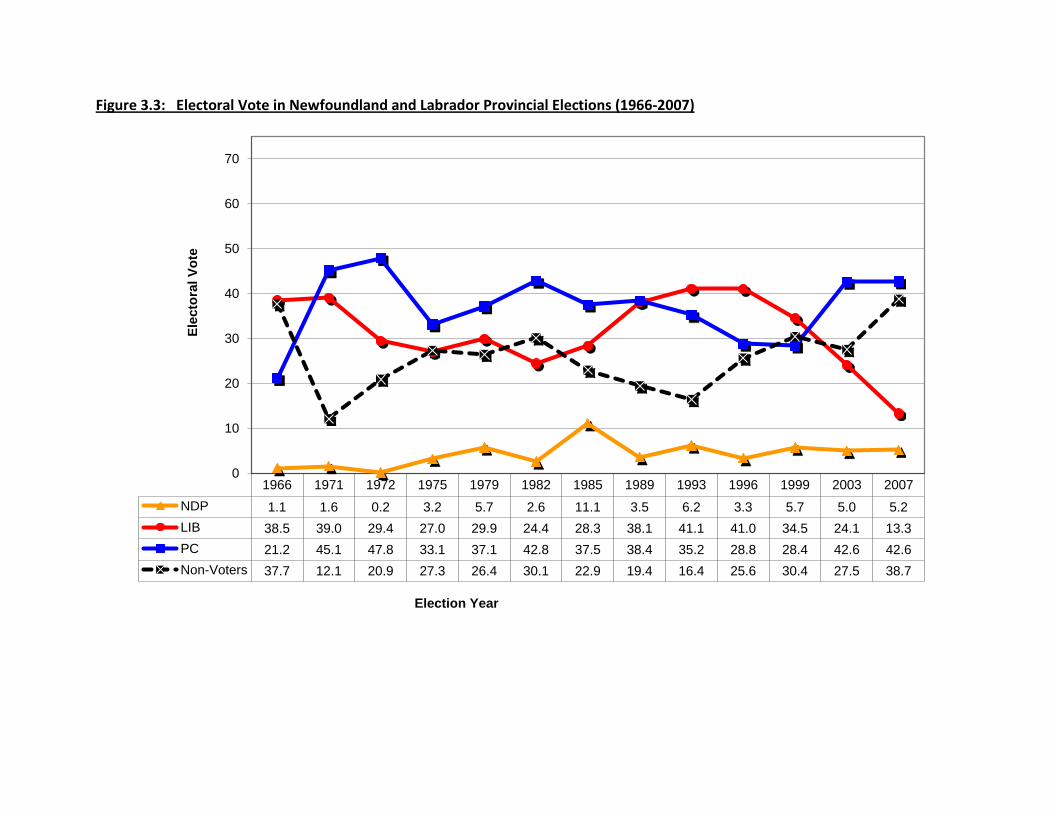
Figure 3.3: Electoral Vote in Newfoundland and Labrador Provincial Elections (1966-2007)
1966 1971 1972 1975 1979 1982 1985 1989 1993 1996 1999 2003 2007NDP 1.1 1.6 0.2 3.2 5.7 2.6 11.1 3.5 6.2 3.3 5.7 5.0 5.2LIB 38.5 39.0 29.4 27.0 29.9 24.4 28.3 38.1 41.1 41.0 34.5 24.1 13.3PC 21.2 45.1 47.8 33.1 37.1 42.8 37.5 38.4 35.2 28.8 28.4 42.6 42.6Non-Voters 37.7 12.1 20.9 27.3 26.4 30.1 22.9 19.4 16.4 25.6 30.4 27.5 38.7
0
10
20
30
40
50
60
70
Elec
tora
l Vot
e
Election Year
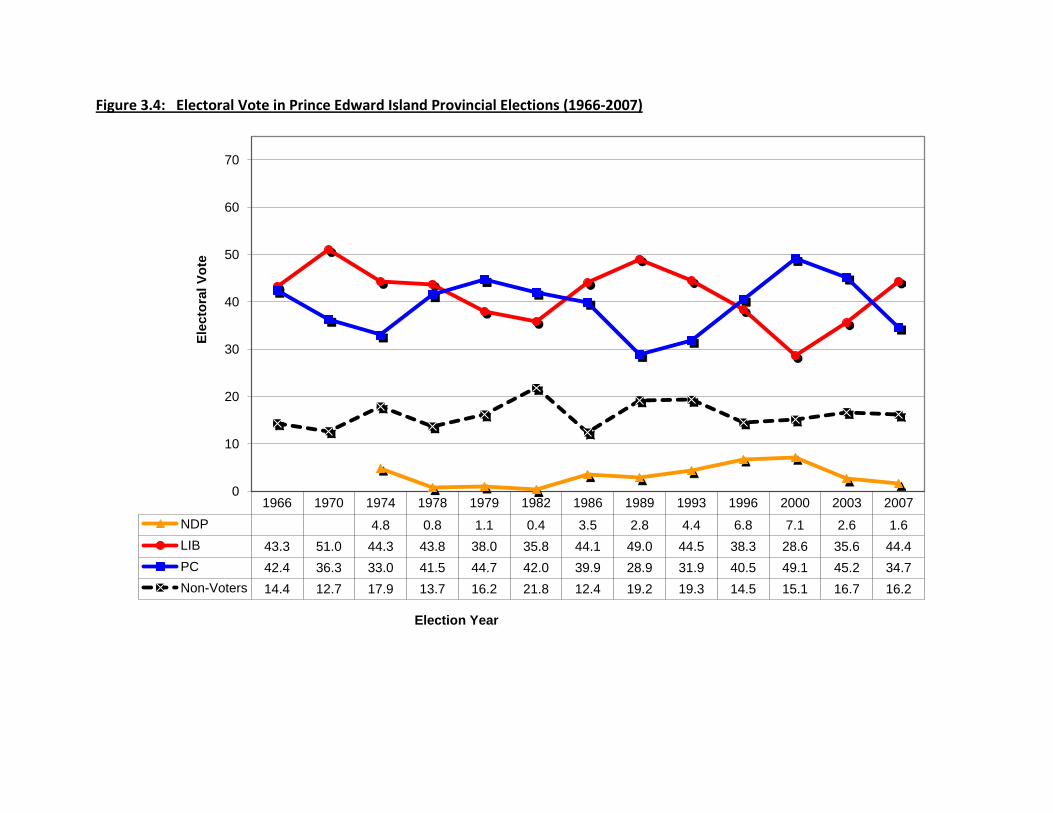
Figure 3.4: Electoral Vote in Prince Edward Island Provincial Elections (1966-2007)
1966 1970 1974 1978 1979 1982 1986 1989 1993 1996 2000 2003 2007NDP 4.8 0.8 1.1 0.4 3.5 2.8 4.4 6.8 7.1 2.6 1.6LIB 43.3 51.0 44.3 43.8 38.0 35.8 44.1 49.0 44.5 38.3 28.6 35.6 44.4PC 42.4 36.3 33.0 41.5 44.7 42.0 39.9 28.9 31.9 40.5 49.1 45.2 34.7Non-Voters 14.4 12.7 17.9 13.7 16.2 21.8 12.4 19.2 19.3 14.5 15.1 16.7 16.2
0
10
20
30
40
50
60
70
Elec
tora
l Vot
e
Election Year

Figure 4.1: Mean Support for Provincial Governing Parties (1965-2009)
Figure 4.2: Mean Disproportionality “Payoffs” (1965-2009)