tutorials point, simply easy learning
TRANSCRIPT
UML
i
About the Tutorial
UML (Unified Modeling Language) is a standard language for specifying, visualizing,
constructing, and documenting the artifacts of software systems. UML was created by the
Object Management Group (OMG) and UML 1.0 specification draft was proposed to the
OMG in January 1997.
It was initially started to capture the behavior of complex software and non-software
system and now it has become an OMG standard. This tutorial gives a complete
understanding on UML.
Audience
This tutorial has been prepared for beginners to help them understand the fundamentals
of UML. After completing this tutorial you will find yourself at a moderate level of expertise
from where you can take yourself to the next levels.
Prerequisites
No specific skill is required as a prerequisite to understand the learning material in this
tutorial. The reader must be enthusiastic to acquire knowledge on UML.
Copyright & Disclaimer
Copyright 2017 by Tutorials Point (I) Pvt. Ltd.
All the content and graphics published in this e-book are the property of Tutorials Point (I)
Pvt. Ltd. The user of this e-book is prohibited to reuse, retain, copy, distribute or republish
any contents or a part of contents of this e-book in any manner without written consent
of the publisher.
We strive to update the contents of our website and tutorials as timely and as precisely as
possible, however, the contents may contain inaccuracies or errors. Tutorials Point (I) Pvt.
Ltd. provides no guarantee regarding the accuracy, timeliness or completeness of our
website or its contents including this tutorial. If you discover any errors on our website or
in this tutorial, please notify us at [email protected]
UML
ii
Table of Contents
About the Tutorial ............................................................................................................................................ i Audience ........................................................................................................................................................... i Prerequisites ..................................................................................................................................................... i Copyright & Disclaimer ..................................................................................................................................... i Table of Contents ............................................................................................................................................ ii
1. UML ─ Overview ....................................................................................................................................... 1 Goals of UML ................................................................................................................................................... 1 A Conceptual Model of UML ........................................................................................................................... 2 Object-Oriented Concepts ............................................................................................................................... 2 OO Analysis and Design ................................................................................................................................... 3 Role of UML in OO Design ............................................................................................................................... 4
2. UML ─ Building Blocks ............................................................................................................................... 5 Things .............................................................................................................................................................. 5 Relationships ................................................................................................................................................... 7 UML Diagrams ................................................................................................................................................. 8
3. UML ─ Architecture ................................................................................................................................... 9
4. UML ─ Modeling Types ........................................................................................................................... 10 Structural Modeling ....................................................................................................................................... 10 Behavioral Modeling ..................................................................................................................................... 10 Architectural Modeling .................................................................................................................................. 10
5. UML ─ Basic Notations ............................................................................................................................ 11 Class Notation ................................................................................................................................................ 11 Object Notation ............................................................................................................................................. 12 Interface Notation ......................................................................................................................................... 13 Collaboration Notation .................................................................................................................................. 13 Use Case Notation ......................................................................................................................................... 14 Actor Notation ............................................................................................................................................... 14 Initial State Notation ..................................................................................................................................... 14 Final State Notation ....................................................................................................................................... 15 Active Class Notation ..................................................................................................................................... 15 Component Notation ..................................................................................................................................... 15 Node Notation ............................................................................................................................................... 16 Interaction Notation ...................................................................................................................................... 17 State Machine Notation ................................................................................................................................ 18 Package Notation .......................................................................................................................................... 18 Note Notation ................................................................................................................................................ 19 Dependency Notation ................................................................................................................................... 19 Association Notation ..................................................................................................................................... 20 Generalization Notation ................................................................................................................................ 20 Extensibility Notation .................................................................................................................................... 21
UML
iii
6. UML ─ Standard Diagrams ...................................................................................................................... 22 Structural Diagrams ....................................................................................................................................... 22 Behavioral Diagrams ...................................................................................................................................... 23
7. UML ─ Class Diagram .............................................................................................................................. 26 Purpose of Class Diagrams ............................................................................................................................ 26 How to Draw a Class Diagram? ...................................................................................................................... 26 Where to Use Class Diagrams? ...................................................................................................................... 28
8. UML ─ Object Diagrams .......................................................................................................................... 29 Purpose of Object Diagrams .......................................................................................................................... 29 How to Draw an Object Diagram? ................................................................................................................. 29 Where to Use Object Diagrams? ................................................................................................................... 31
9. UML ─ Component Diagrams .................................................................................................................. 32 Purpose of Component Diagrams ................................................................................................................. 32 How to Draw a Component Diagram? ........................................................................................................... 32 Where to Use Component Diagrams? ........................................................................................................... 34
10. UML ─ Deployment Diagrams ................................................................................................................. 35 Purpose of Deployment Diagrams ................................................................................................................. 35 How to Draw a Deployment Diagram? .......................................................................................................... 35 Where to Use Deployment Diagrams? .......................................................................................................... 36
11. UML ─ Use Case Diagrams ....................................................................................................................... 38 Purpose of Use Case Diagrams ...................................................................................................................... 38 How to Draw a Use Case Diagram? ............................................................................................................... 39 Where to Use a Use Case Diagram? .............................................................................................................. 40
12. UML ─ Interaction Diagrams ................................................................................................................... 41 Purpose of Interaction Diagrams ................................................................................................................... 41 How to Draw an Interaction Diagram? .......................................................................................................... 41 Where to Use Interaction Diagrams? ............................................................................................................ 43
13. UML ─ Statechart Diagrams .................................................................................................................... 44 Purpose of Statechart Diagrams .................................................................................................................... 44 How to Draw a Statechart Diagram? ............................................................................................................. 44 Where to Use Statechart Diagrams? ............................................................................................................. 45
14. UML ─ Activity Diagrams ......................................................................................................................... 47 Purpose of Activity Diagrams ........................................................................................................................ 47 How to Draw an Activity Diagram? ............................................................................................................... 47 Where to Use Activity Diagrams? .................................................................................................................. 49
UML 2.0 .................................................................................................................................... 50
15. UML 2.0 ─ Overview ................................................................................................................................ 51 New Dimensions in UML 2.0 ......................................................................................................................... 51 Modeling Diagrams in UML 2.0 ..................................................................................................................... 52

UML
1
UML is a standard language for specifying, visualizing, constructing, and documenting the
artifacts of software systems.
UML was created by the Object Management Group (OMG) and UML 1.0 specification draft
was proposed to the OMG in January 1997.
OMG is continuously making efforts to create a truly industry standard.
UML stands for Unified Modeling Language.
UML is different from the other common programming languages such as C++,
Java, COBOL, etc.
UML is a pictorial language used to make software blueprints.
UML can be described as a general purpose visual modeling language to visualize,
specify, construct, and document software system.
Although UML is generally used to model software systems, it is not limited within
this boundary. It is also used to model non-software systems as well. For example,
the process flow in a manufacturing unit, etc.
UML is not a programming language but tools can be used to generate code in various
languages using UML diagrams. UML has a direct relation with object oriented analysis and
design. After some standardization, UML has become an OMG standard.
Goals of UML
A picture is worth a thousand words, this idiom absolutely fits describing UML. Object-
oriented concepts were introduced much earlier than UML. At that point of time, there
were no standard methodologies to organize and consolidate the object-oriented
development. It was then that UML came into picture.
There are a number of goals for developing UML but the most important is to define some
general purpose modeling language, which all modelers can use and it also needs to be
made simple to understand and use.
UML diagrams are not only made for developers but also for business users, common
people, and anybody interested to understand the system. The system can be a software
or non-software system. Thus it must be clear that UML is not a development method
rather it accompanies with processes to make it a successful system.
In conclusion, the goal of UML can be defined as a simple modeling mechanism to model
all possible practical systems in today’s complex environment.
1. UML ─ Overview
UML
2
A Conceptual Model of UML
To understand the conceptual model of UML, first we need to clarify what is a conceptual
model? and why a conceptual model is required?
A conceptual model can be defined as a model which is made of concepts and their
relationships.
A conceptual model is the first step before drawing a UML diagram. It helps to
understand the entities in the real world and how they interact with each other.
As UML describes the real-time systems, it is very important to make a conceptual model
and then proceed gradually. The conceptual model of UML can be mastered by learning
the following three major elements:
UML building blocks
Rules to connect the building blocks
Common mechanisms of UML
Object-Oriented Concepts
UML can be described as the successor of object-oriented (OO) analysis and design.
An object contains both data and methods that control the data. The data represents the
state of the object. A class describes an object and they also form a hierarchy to model
the real-world system. The hierarchy is represented as inheritance and the classes can
also be associated in different ways as per the requirement.
Objects are the real-world entities that exist around us and the basic concepts such as
abstraction, encapsulation, inheritance, and polymorphism all can be represented using
UML.
UML is powerful enough to represent all the concepts that exist in object-oriented analysis
and design. UML diagrams are representation of object-oriented concepts only. Thus,
before learning UML, it becomes important to understand OO concept in detail.
Following are some fundamental concepts of the object-oriented world:
Objects: Objects represent an entity and the basic building block.
Class: Class is the blueprint of an object.
Abstraction: Abstraction represents the behavior of a real world entity.
Encapsulation: Encapsulation is the mechanism of binding the data together and
hiding them from the outside world.
Inheritance: Inheritance is the mechanism of making new classes from existing
ones.
Polymorphism: It defines the mechanism to exist in different forms.
UML
3
OO Analysis and Design
OO can be defined as an investigation and to be more specific, it is the investigation of
objects. Design means collaboration of identified objects.
Thus, it is important to understand the OO analysis and design concepts. The most
important purpose of OO analysis is to identify objects of a system to be designed. This
analysis is also done for an existing system. Now an efficient analysis is only possible when
we are able to start thinking in a way where objects can be identified. After identifying the
objects, their relationships are identified and finally the design is produced.
The purpose of OO analysis and design can described as:
Identifying the objects of a system.
Identifying their relationships.
Making a design, which can be converted to executables using OO languages.
There are three basic steps where the OO concepts are applied and implemented. The
steps can be defined as
OO Analysis --> OO Design --> OO implementation using OO languages
The above three points can be described in detail as:
During OO analysis, the most important purpose is to identify objects and describe
them in a proper way. If these objects are identified efficiently, then the next job
of design is easy. The objects should be identified with responsibilities.
Responsibilities are the functions performed by the object. Each and every object
has some type of responsibilities to be performed. When these responsibilities are
collaborated, the purpose of the system is fulfilled.
The second phase is OO design. During this phase, emphasis is placed on the
requirements and their fulfilment. In this stage, the objects are collaborated
according to their intended association. After the association is complete, the
design is also complete.
The third phase is OO implementation. In this phase, the design is implemented
using OO languages such as Java, C++, etc.
UML
4
Role of UML in OO Design
UML is a modeling language used to model software and non-software systems. Although
UML is used for non-software systems, the emphasis is on modeling OO software
applications. Most of the UML diagrams discussed so far are used to model different
aspects such as static, dynamic, etc. Now whatever be the aspect, the artifacts are nothing
but objects.
If we look into class diagram, object diagram, collaboration diagram, interaction diagrams
all would basically be designed based on the objects.
Hence, the relation between OO design and UML is very important to understand. The OO
design is transformed into UML diagrams according to the requirement. Before
understanding the UML in detail, the OO concept should be learned properly. Once the OO
analysis and design is done, the next step is very easy. The input from OO analysis and
design is the input to UML diagrams.
UML
5
As UML describes the real-time systems, it is very important to make a conceptual model
and then proceed gradually. The conceptual model of UML can be mastered by learning
the following three major elements:
UML building blocks
Rules to connect the building blocks
Common mechanisms of UML
This chapter describes all the UML building blocks. The building blocks of UML can be
defined as:
Things
Relationships
Diagrams
Things
Things are the most important building blocks of UML. Things can be:
Structural
Behavioral
Grouping
Annotational
Structural Things
Structural things define the static part of the model. They represent the physical and
conceptual elements. Following are the brief descriptions of the structural things.
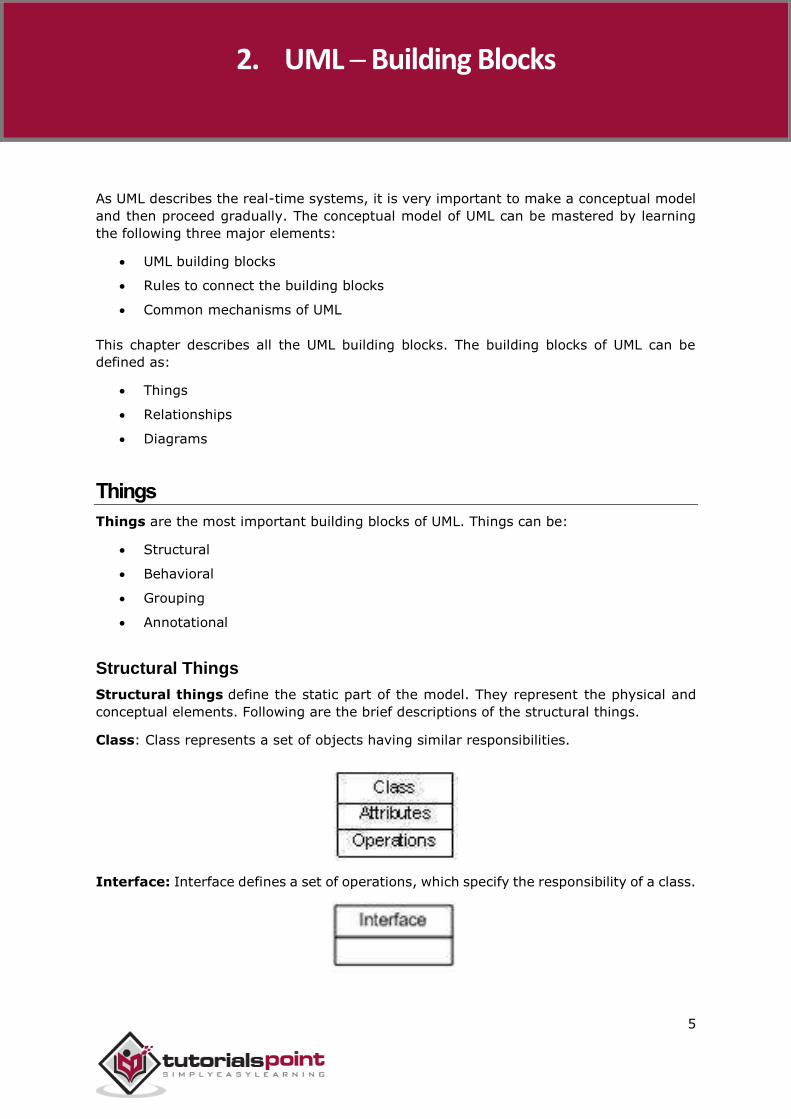
Class: Class represents a set of objects having similar responsibilities.
Interface: Interface defines a set of operations, which specify the responsibility of a class.
2. UML ─ Building Blocks
UML
6
Collaboration: Collaboration defines an interaction between elements.
Use case: Use case represents a set of actions performed by a system for a specific goal.
Component: Component describes the physical part of a system.
Node: A node can be defined as a physical element that exists at run time.
Behavioral Things
A behavioral thing consists of the dynamic parts of UML models. Following are the
behavioral things:
Interaction: Interaction is defined as a behavior that consists of a group of messages
exchanged among elements to accomplish a specific task.
State machine: State machine is useful when the state of an object in its life cycle is
important. It defines the sequence of states an object goes through in response to events.
Events are external factors responsible for state change.
UML
7
Grouping Things
Grouping things can be defined as a mechanism to group elements of a UML model
together. There is only one grouping thing available:
Package: Package is the only one grouping thing available for gathering structural and
behavioral things.
Annotational Things
Annotational things can be defined as a mechanism to capture remarks, descriptions,
and comments of UML model elements. Note: It is the only one Annotational thing
available. A note is used to render comments, constraints, etc. of an UML element.
Relationships
Relationship is another most important building block of UML. It shows how the elements
are associated with each other and this association describes the functionality of an
application.
There are four kinds of relationships available.
Dependency
Dependency is a relationship between two things in which change in one element also
affects the other.
Association
Association is basically a set of links that connects the elements of a UML model. It also
describes how many objects are taking part in that relationship.
UML
8
Generalization
Generalization can be defined as a relationship which connects a specialized element with
a generalized element. It basically describes the inheritance relationship in the world of
objects.
Realization
Realization can be defined as a relationship in which two elements are connected. One
element describes some responsibility, which is not implemented and the other one
implements them. This relationship exists in case of interfaces.
UML Diagrams
UML diagrams are the ultimate output of the entire discussion. All the elements,
relationships are used to make a complete UML diagram and the diagram represents a
system.
The visual effect of the UML diagram is the most important part of the entire process. All
the other elements are used to make it complete.
UML includes the following nine diagrams, the details of which are described in the
subsequent chapters.
Class diagram
Object diagram
Use case diagram
Sequence diagram
Collaboration diagram
Activity diagram
Statechart diagram
Deployment diagram
Component diagram

UML
9
Any real-world system is used by different users. The users can be developers, testers,
business people, analysts, and many more. Hence, before designing a system, the
architecture is made with different perspectives in mind. The most important part is to
visualize the system from the perspective of different viewers. The better we understand
the better we can build the system.
UML plays an important role in defining different perspectives of a system. These
perspectives are:
Design
Implementation
Process
Deployment
The center is the Use Case view which connects all these four. A Use Case represents
the functionality of the system. Hence, other perspectives are connected with use case.
Design of a system consists of classes, interfaces, and collaboration. UML provides class
diagram, object diagram to support this.
Implementation defines the components assembled together to make a complete
physical system. UML component diagram is used to support the implementation
perspective.
Process defines the flow of the system. Hence, the same elements as used in Design are
also used to support this perspective.
Deployment represents the physical nodes of the system that forms the hardware. UML
deployment diagram is used to support this perspective.
3. UML ─ Architecture
UML
10
It is very important to distinguish between the UML model. Different diagrams are used
for different types of UML modeling. There are three important types of UML modeling.
Structural Modeling
Structural modeling captures the static features of a system. They consist of the following:
Classes diagram
Objects diagram
Deployment diagram
Package diagram
Composite structure diagram
Component diagram
Structural model represents the framework for the system and this framework is the place
where all other components exist. Hence, the class diagram, component diagram and
deployment diagrams are part of structural modeling. They all represent the elements and
the mechanism to assemble them.
The structural model never describes the dynamic behavior of the system. Class diagram
is the most widely used structural diagram.
Behavioral Modeling
Behavioral model describes the interaction in the system. It represents the interaction
among the structural diagrams. Behavioral modeling shows the dynamic nature of the
system. They consist of the following:
Activity diagram
Interaction diagram
Use case diagram
All the above show the dynamic sequence of flow in a system.
Architectural Modeling
Architectural model represents the overall framework of the system. It contains both
structural and behavioral elements of the system. Architectural model can be defined as
the blueprint of the entire system. Package diagram comes under architectural modeling.
4. UML ─ Modeling Types
UML
11
UML is popular for its diagrammatic notations. We all know that UML is for visualizing,
specifying, constructing and documenting the components of software and non-software
systems. Hence, visualization is the most important part which needs to be understood
and remembered.
UML notations are the most important elements in modeling. Efficient and appropriate use
of notations is very important for making a complete and meaningful model. The model is
useless, unless its purpose is depicted properly.
Hence, learning notations should be emphasized from the very beginning. Different
notations are available for things and relationships. UML diagrams are made using the
notations of things and relationships. Extensibility is another important feature which
makes UML more powerful and flexible.
The chapter describes basic UML notations in detail. This is just an extension to the UML
building block section discussed in Chapter Two.
Structural Things
Graphical notations used in structural things are most widely used in UML. These are
considered as the nouns of UML models. Following are the list of structural things.
Classes
Object
Interface
Collaboration
Use case
Active classes
Components
Nodes
Class Notation
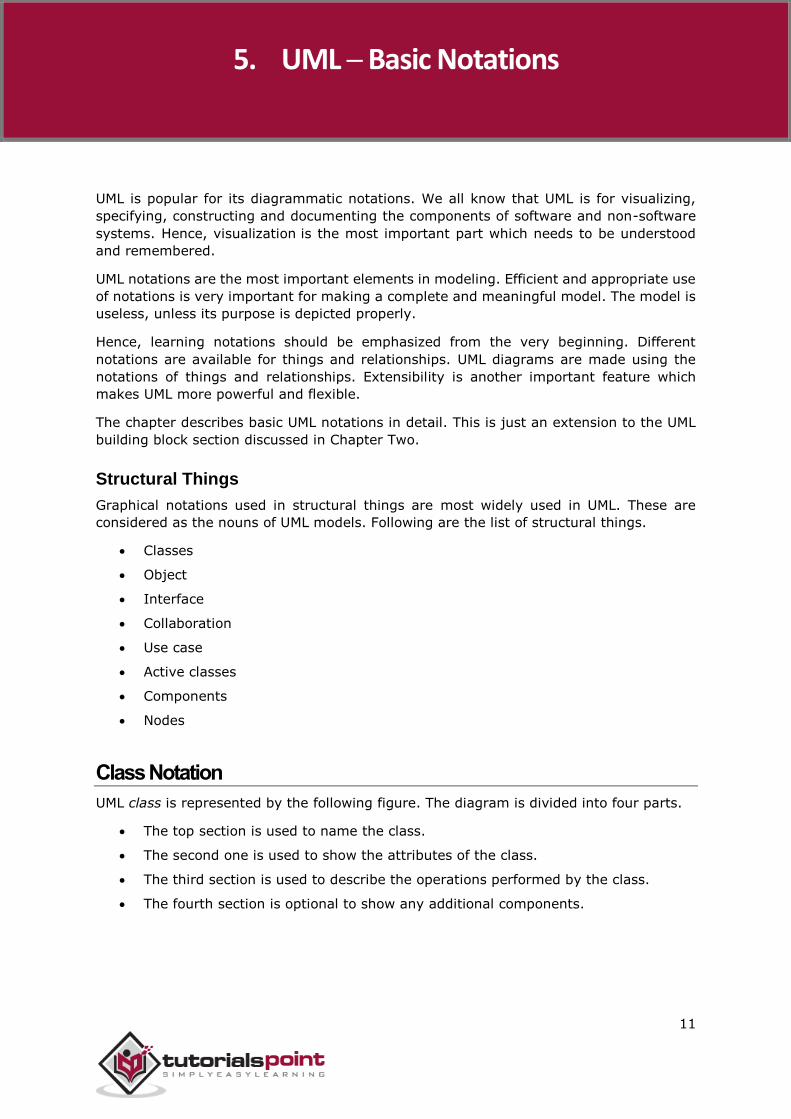
UML class is represented by the following figure. The diagram is divided into four parts.
The top section is used to name the class.
The second one is used to show the attributes of the class.
The third section is used to describe the operations performed by the class.
The fourth section is optional to show any additional components.
5. UML ─ Basic Notations
UML
12
Classes are used to represent objects. Objects can be anything having properties and
responsibility.
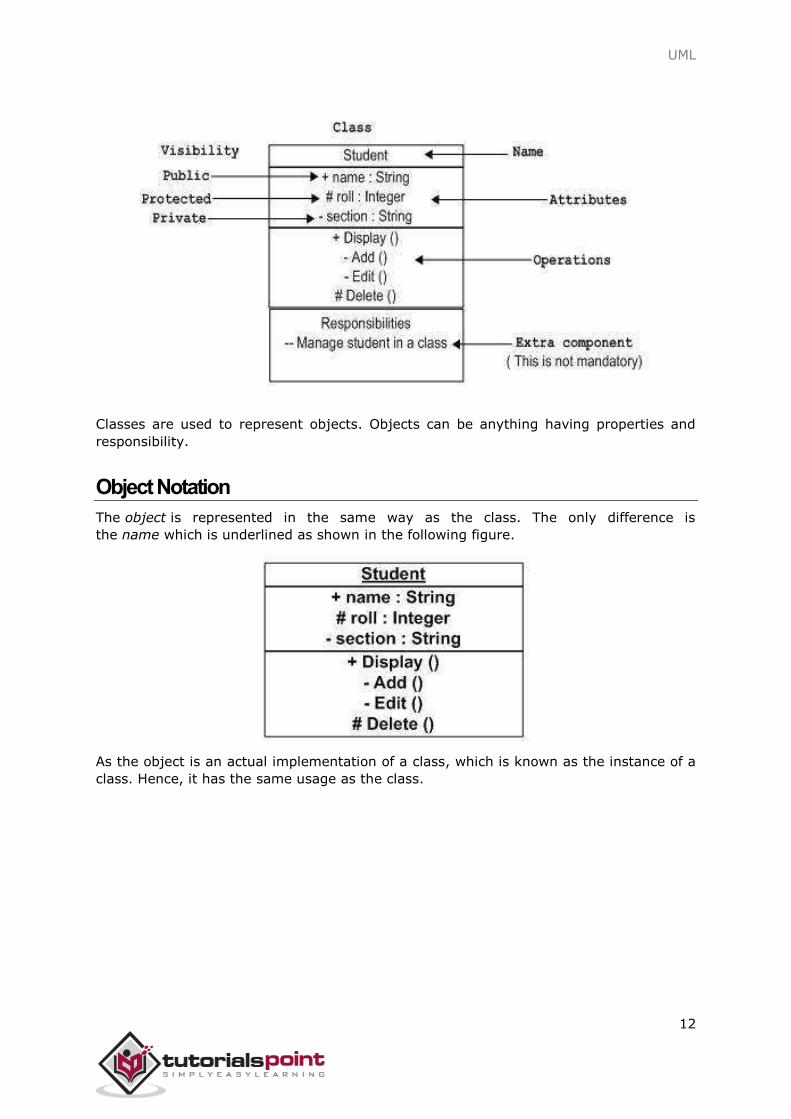
Object Notation
The object is represented in the same way as the class. The only difference is
the name which is underlined as shown in the following figure.
As the object is an actual implementation of a class, which is known as the instance of a
class. Hence, it has the same usage as the class.
UML
13
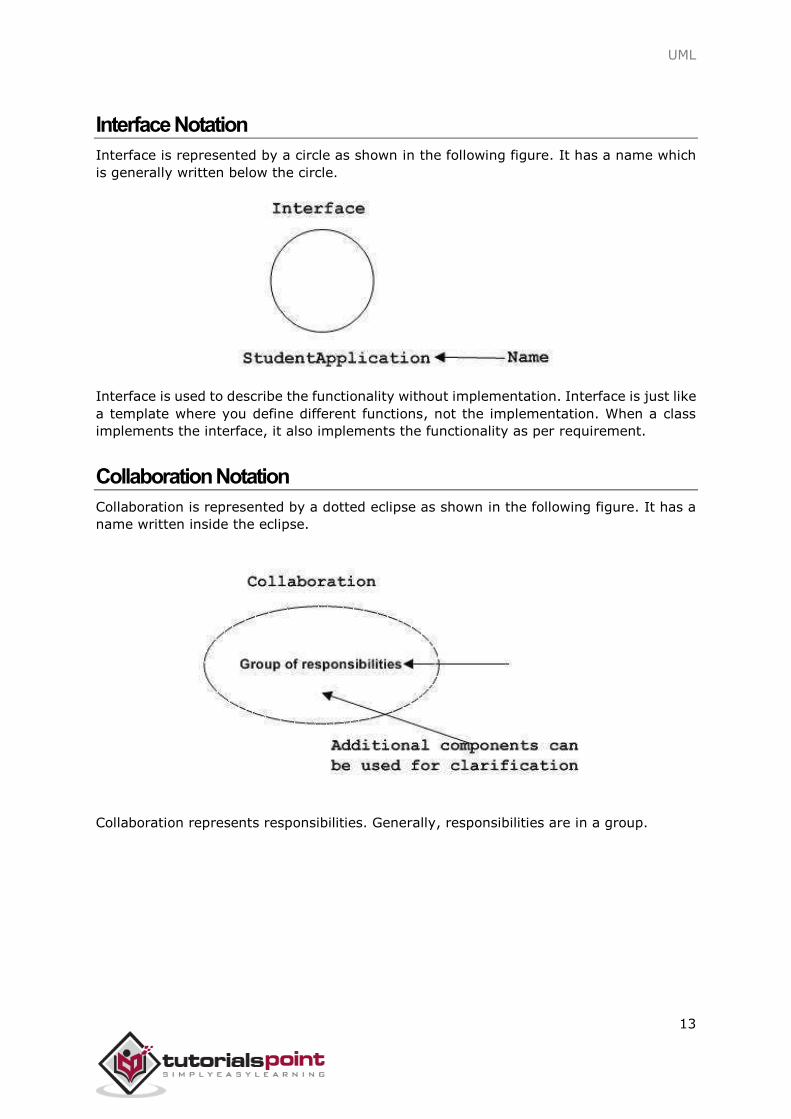
Interface Notation
Interface is represented by a circle as shown in the following figure. It has a name which
is generally written below the circle.
Interface is used to describe the functionality without implementation. Interface is just like
a template where you define different functions, not the implementation. When a class
implements the interface, it also implements the functionality as per requirement.
Collaboration Notation
Collaboration is represented by a dotted eclipse as shown in the following figure. It has a
name written inside the eclipse.
Collaboration represents responsibilities. Generally, responsibilities are in a group.
UML
14
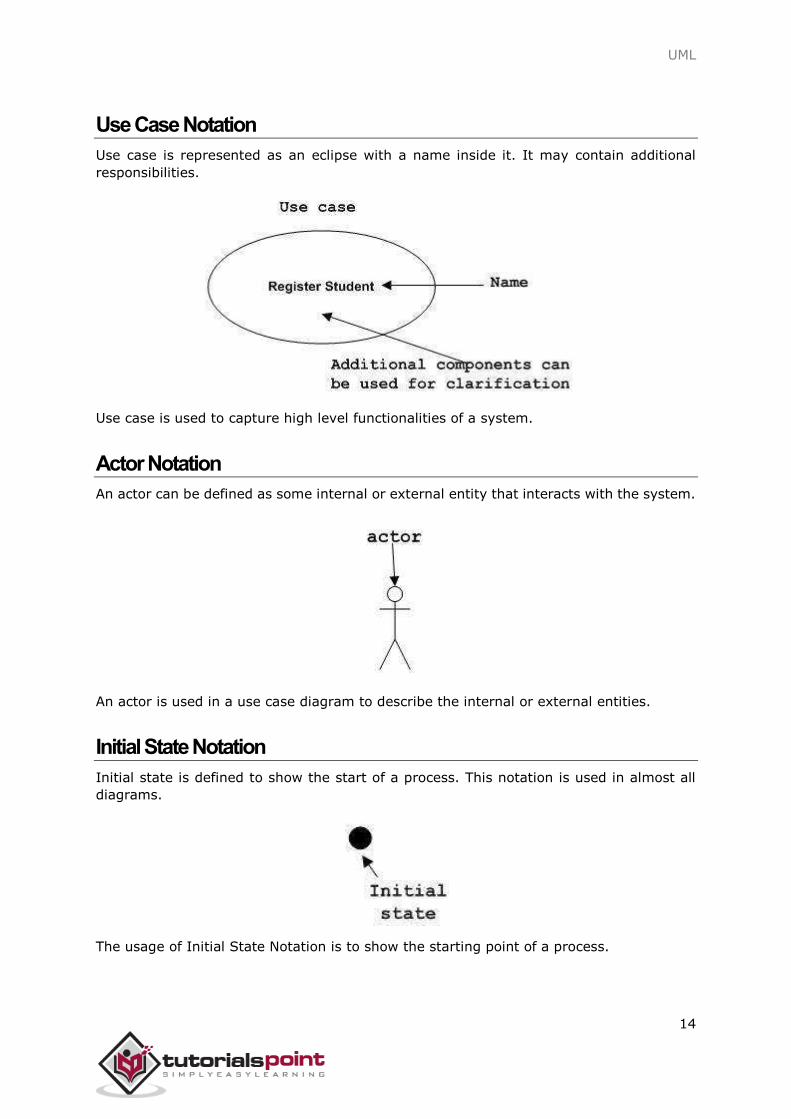
Use Case Notation
Use case is represented as an eclipse with a name inside it. It may contain additional
responsibilities.
Use case is used to capture high level functionalities of a system.
Actor Notation
An actor can be defined as some internal or external entity that interacts with the system.
An actor is used in a use case diagram to describe the internal or external entities.
Initial State Notation
Initial state is defined to show the start of a process. This notation is used in almost all
diagrams.
The usage of Initial State Notation is to show the starting point of a process.
UML
15
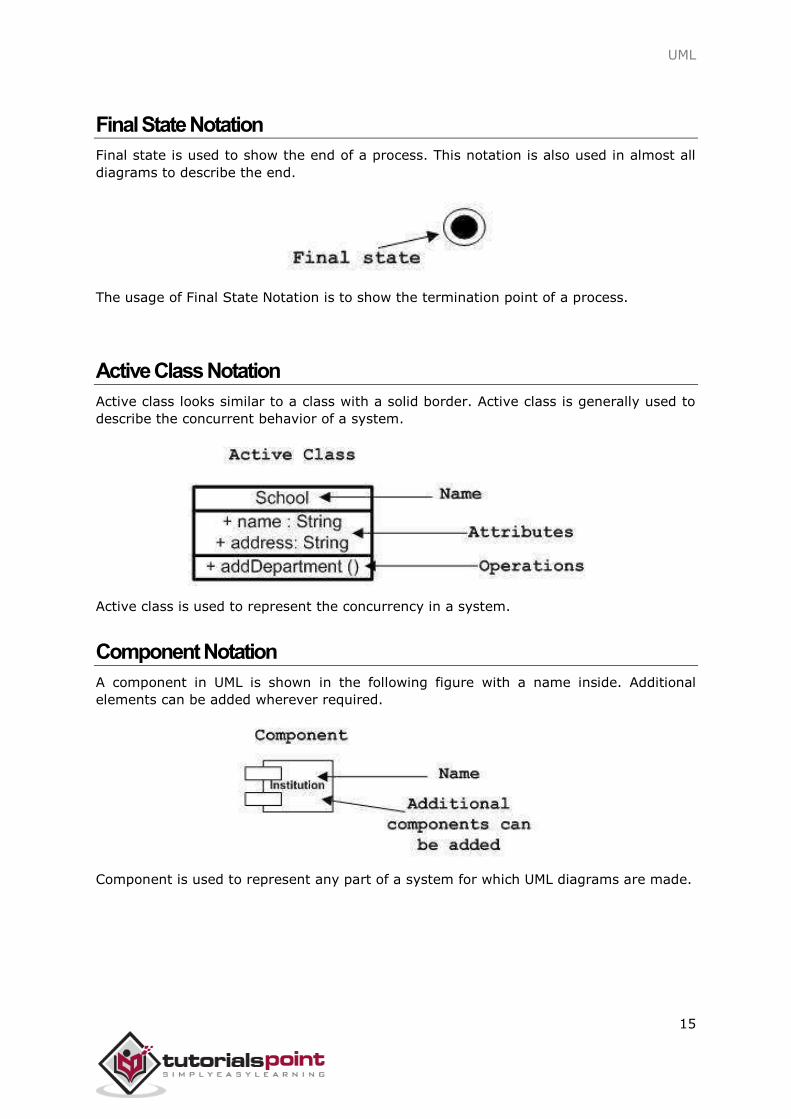
Final State Notation
Final state is used to show the end of a process. This notation is also used in almost all
diagrams to describe the end.
The usage of Final State Notation is to show the termination point of a process.
Active Class Notation
Active class looks similar to a class with a solid border. Active class is generally used to
describe the concurrent behavior of a system.
Active class is used to represent the concurrency in a system.
Component Notation
A component in UML is shown in the following figure with a name inside. Additional
elements can be added wherever required.
Component is used to represent any part of a system for which UML diagrams are made.
UML
16
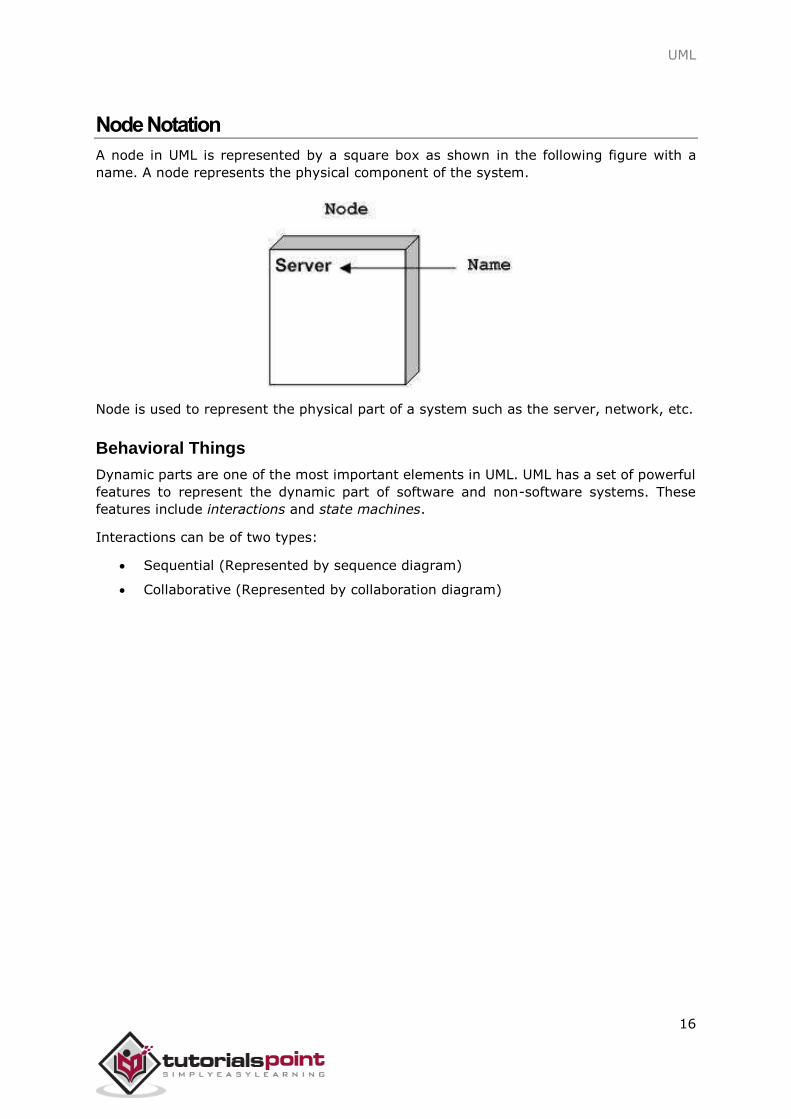
Node Notation
A node in UML is represented by a square box as shown in the following figure with a
name. A node represents the physical component of the system.
Node is used to represent the physical part of a system such as the server, network, etc.
Behavioral Things
Dynamic parts are one of the most important elements in UML. UML has a set of powerful
features to represent the dynamic part of software and non-software systems. These
features include interactions and state machines.
Interactions can be of two types:
Sequential (Represented by sequence diagram)
Collaborative (Represented by collaboration diagram)
UML
17
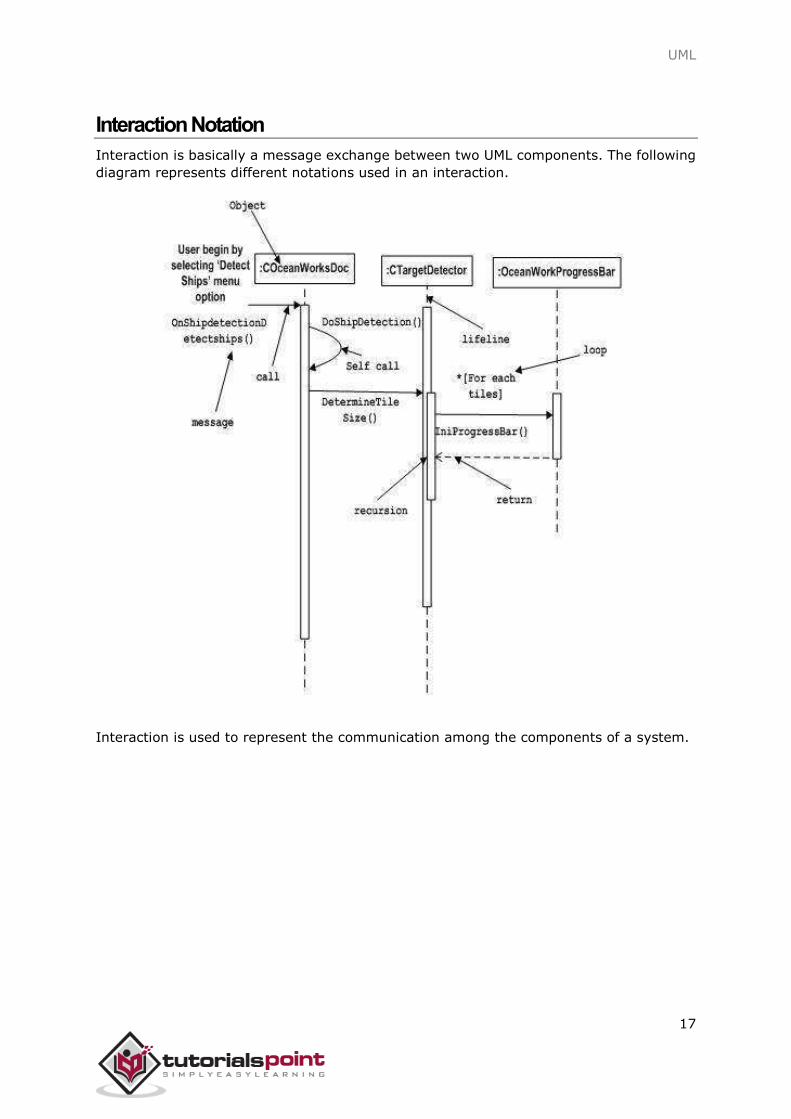
Interaction Notation
Interaction is basically a message exchange between two UML components. The following
diagram represents different notations used in an interaction.
Interaction is used to represent the communication among the components of a system.
UML
18
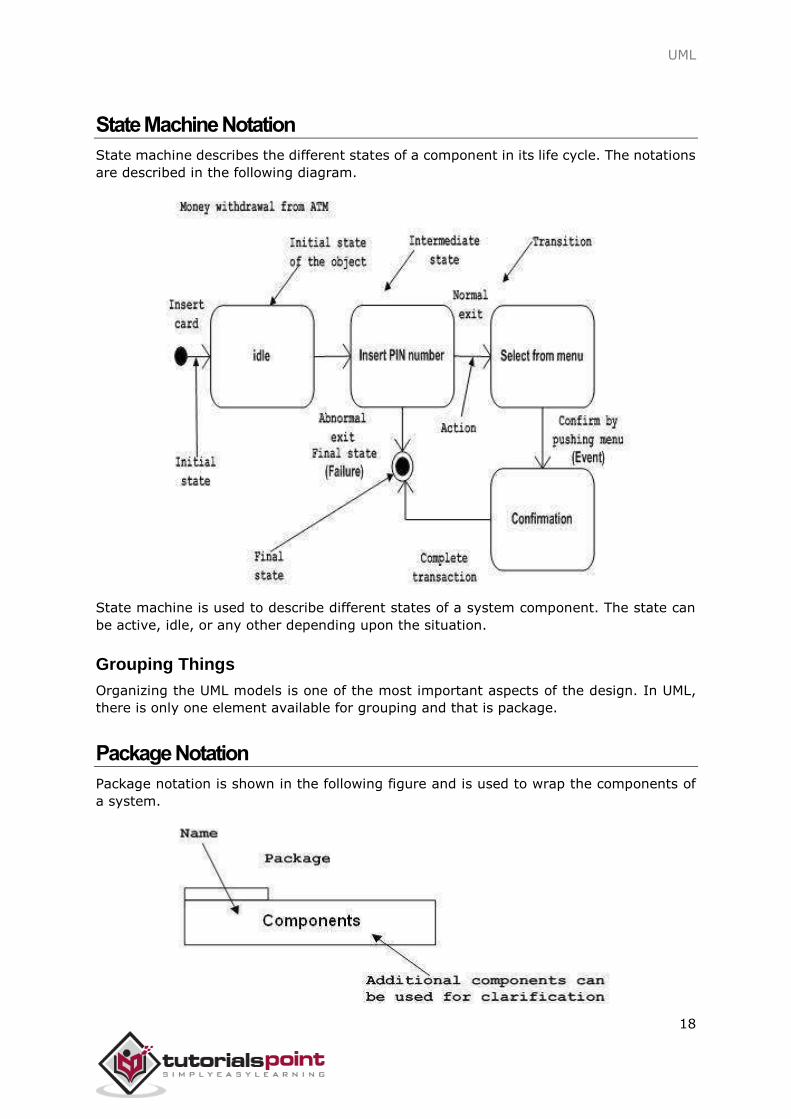
State Machine Notation
State machine describes the different states of a component in its life cycle. The notations
are described in the following diagram.
State machine is used to describe different states of a system component. The state can
be active, idle, or any other depending upon the situation.
Grouping Things
Organizing the UML models is one of the most important aspects of the design. In UML,
there is only one element available for grouping and that is package.
Package Notation
Package notation is shown in the following figure and is used to wrap the components of
a system.
UML
19
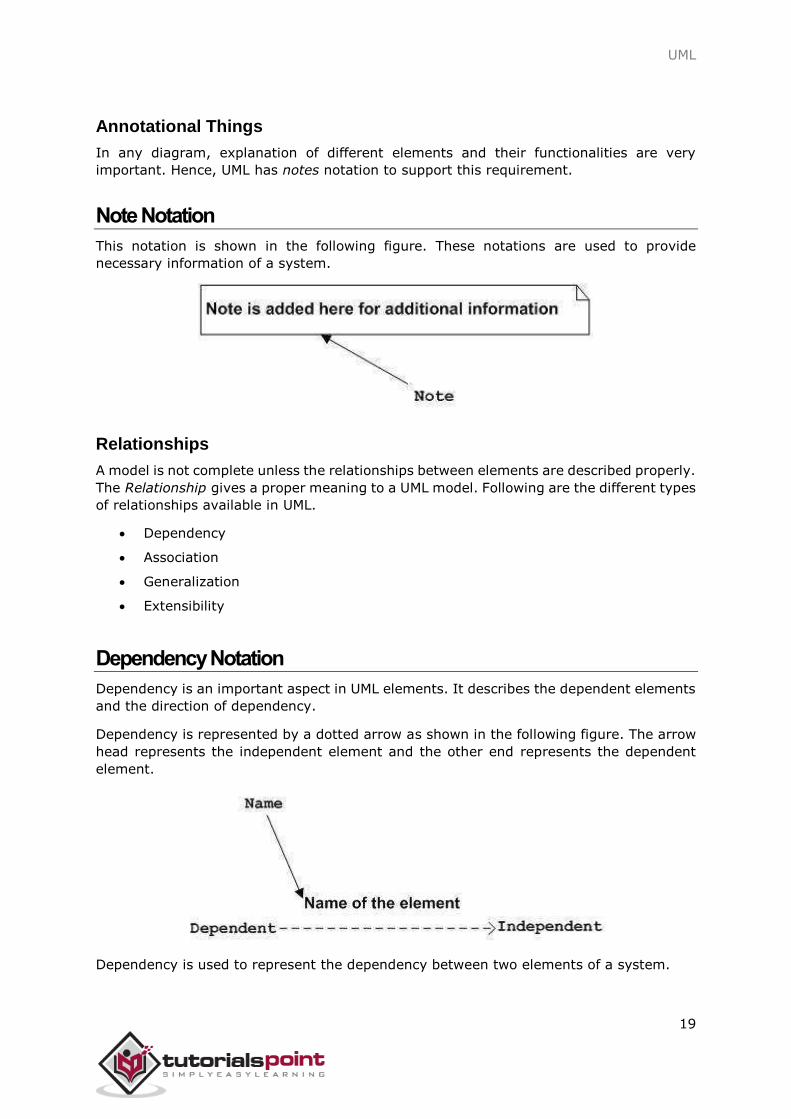
Annotational Things
In any diagram, explanation of different elements and their functionalities are very
important. Hence, UML has notes notation to support this requirement.
Note Notation
This notation is shown in the following figure. These notations are used to provide
necessary information of a system.
Relationships
A model is not complete unless the relationships between elements are described properly.
The Relationship gives a proper meaning to a UML model. Following are the different types
of relationships available in UML.
Dependency
Association
Generalization
Extensibility
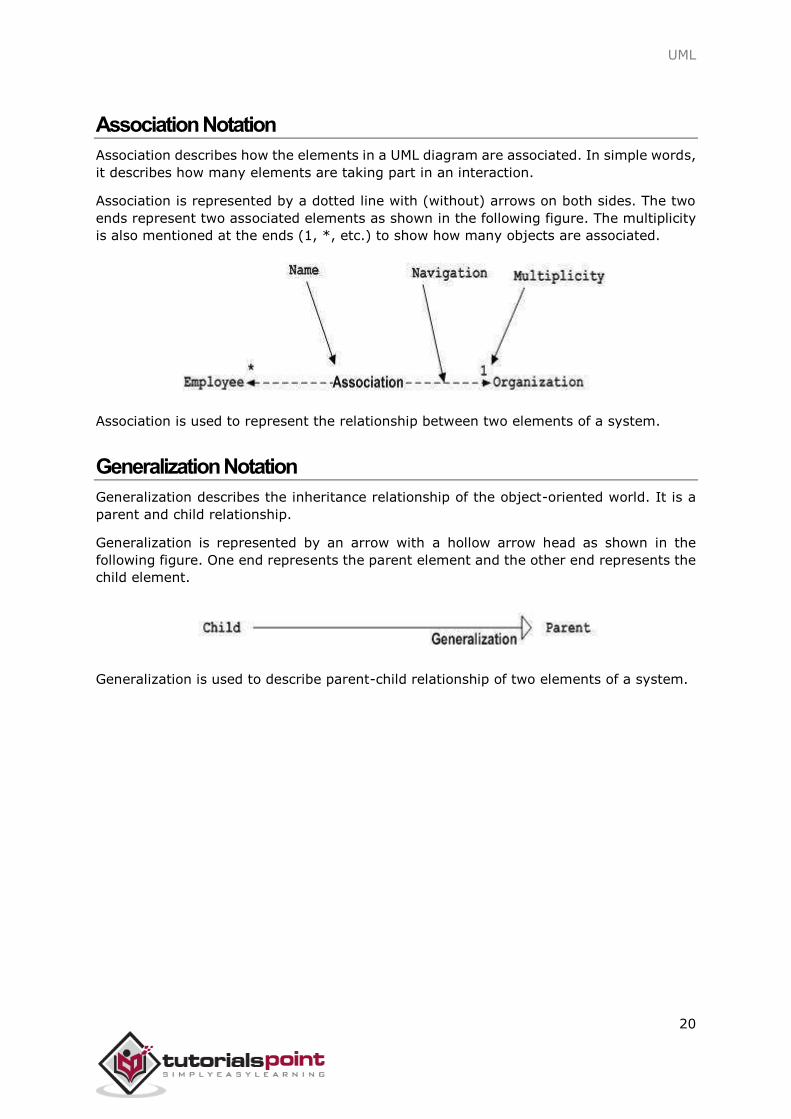
Dependency Notation
Dependency is an important aspect in UML elements. It describes the dependent elements
and the direction of dependency.
Dependency is represented by a dotted arrow as shown in the following figure. The arrow
head represents the independent element and the other end represents the dependent
element.
Dependency is used to represent the dependency between two elements of a system.
UML
20
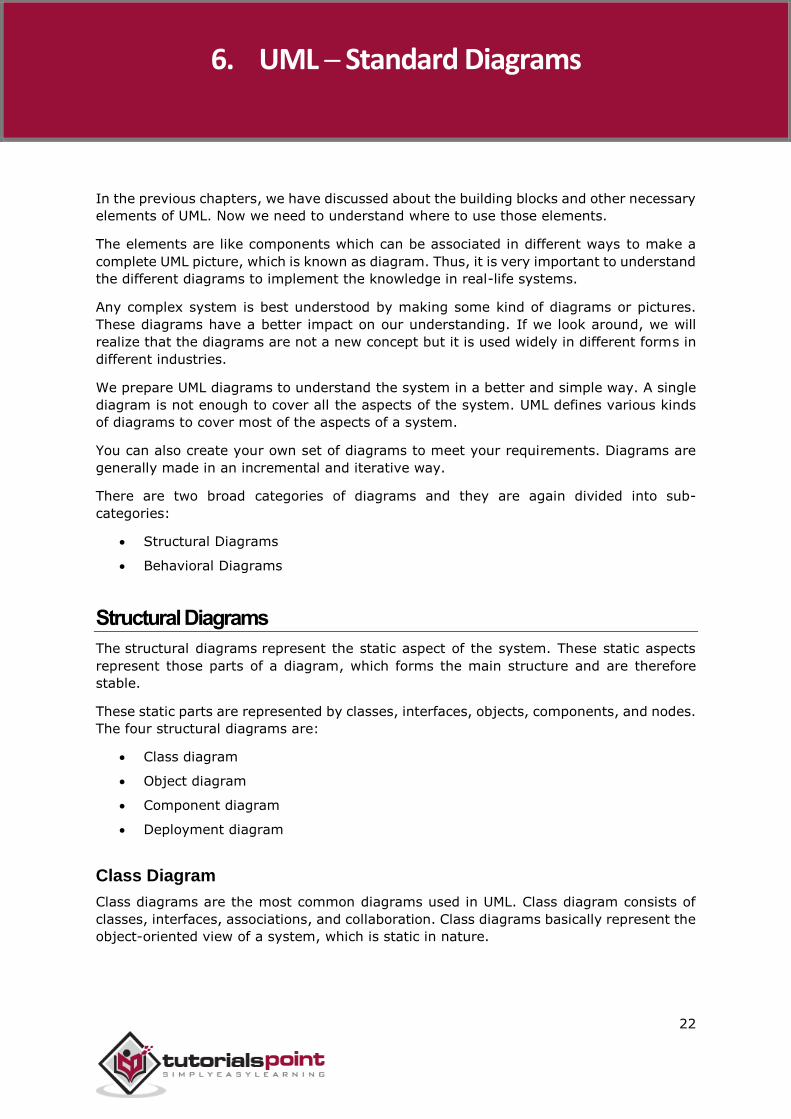
Association Notation
Association describes how the elements in a UML diagram are associated. In simple words,
it describes how many elements are taking part in an interaction.
Association is represented by a dotted line with (without) arrows on both sides. The two
ends represent two associated elements as shown in the following figure. The multiplicity
is also mentioned at the ends (1, *, etc.) to show how many objects are associated.
Association is used to represent the relationship between two elements of a system.
Generalization Notation
Generalization describes the inheritance relationship of the object-oriented world. It is a
parent and child relationship.
Generalization is represented by an arrow with a hollow arrow head as shown in the
following figure. One end represents the parent element and the other end represents the
child element.
Generalization is used to describe parent-child relationship of two elements of a system.

UML
21
Extensibility Notation
All the languages (programming or modeling) have some mechanism to extend its
capabilities such as syntax, semantics, etc. UML also has the following mechanisms to
provide extensibility features.
Stereotypes (Represents new elements)
Tagged values (Represents new attributes)
Constraints (Represents the boundaries)
Extensibility notations are used to enhance the power of the language. It is basically
additional elements used to represent some extra behavior of the system. These extra
behaviors are not covered by the standard available notations.
UML
22
In the previous chapters, we have discussed about the building blocks and other necessary
elements of UML. Now we need to understand where to use those elements.
The elements are like components which can be associated in different ways to make a
complete UML picture, which is known as diagram. Thus, it is very important to understand
the different diagrams to implement the knowledge in real-life systems.
Any complex system is best understood by making some kind of diagrams or pictures.
These diagrams have a better impact on our understanding. If we look around, we will
realize that the diagrams are not a new concept but it is used widely in different forms in
different industries.
We prepare UML diagrams to understand the system in a better and simple way. A single
diagram is not enough to cover all the aspects of the system. UML defines various kinds
of diagrams to cover most of the aspects of a system.
You can also create your own set of diagrams to meet your requirements. Diagrams are
generally made in an incremental and iterative way.
There are two broad categories of diagrams and they are again divided into sub-
categories:
Structural Diagrams
Behavioral Diagrams
Structural Diagrams
The structural diagrams represent the static aspect of the system. These static aspects
represent those parts of a diagram, which forms the main structure and are therefore
stable.
These static parts are represented by classes, interfaces, objects, components, and nodes.
The four structural diagrams are:
Class diagram
Object diagram
Component diagram
Deployment diagram
Class Diagram
Class diagrams are the most common diagrams used in UML. Class diagram consists of
classes, interfaces, associations, and collaboration. Class diagrams basically represent the
object-oriented view of a system, which is static in nature.
6. UML ─ Standard Diagrams
UML
23
Active class is used in a class diagram to represent the concurrency of the system.
Class diagram represents the object orientation of a system. Hence, it is generally used
for development purpose. This is the most widely used diagram at the time of system
construction.
Object Diagram
Object diagrams can be described as an instance of class diagram. Thus, these diagrams
are more close to real-life scenarios where we implement a system.
Object diagrams are a set of objects and their relationship is just like class diagrams. They
also represent the static view of the system.
The usage of object diagrams is similar to class diagrams but they are used to build
prototype of a system from a practical perspective.
Component Diagram
Component diagrams represent a set of components and their relationships. These
components consist of classes, interfaces, or collaborations. Component diagrams
represent the implementation view of a system.
During the design phase, software artifacts (classes, interfaces, etc.) of a system are
arranged in different groups depending upon their relationship. Now, these groups are
known as components.
Finally, it can be said component diagrams are used to visualize the implementation.
Deployment Diagram
Deployment diagrams are a set of nodes and their relationships. These nodes are physical
entities where the components are deployed.
Deployment diagrams are used for visualizing the deployment view of a system. This is
generally used by the deployment team.
Note: If the above descriptions and usages are observed carefully then it is very clear that
all the diagrams have some relationship with one another. Component diagrams are
dependent upon the classes, interfaces, etc. which are part of class/object diagram. Again,
the deployment diagram is dependent upon the components, which are used to make
component diagrams.
Behavioral Diagrams
Any system can have two aspects, static and dynamic. So, a model is considered as
complete when both the aspects are fully covered.
Behavioral diagrams basically capture the dynamic aspect of a system. Dynamic aspect
can be further described as the changing/moving parts of a system.
UML
24
UML has the following five types of behavioral diagrams:
Use case diagram
Sequence diagram
Collaboration diagram
Statechart diagram
Activity diagram
Use Case Diagram
Use case diagrams are a set of use cases, actors, and their relationships. They represent
the use case view of a system.
A use case represents a particular functionality of a system. Hence, use case diagram is
used to describe the relationships among the functionalities and their internal/external
controllers. These controllers are known as actors.
Sequence Diagram
A sequence diagram is an interaction diagram. From the name, it is clear that the diagram
deals with some sequences, which are the sequence of messages flowing from one object
to another.
Interaction among the components of a system is very important from implementation
and execution perspective. Sequence diagram is used to visualize the sequence of calls in
a system to perform a specific functionality.
Collaboration Diagram
Collaboration diagram is another form of interaction diagram. It represents the structural
organization of a system and the messages sent/received. Structural organization consists
of objects and links.
The purpose of collaboration diagram is similar to sequence diagram. However, the specific
purpose of collaboration diagram is to visualize the organization of objects and their
interaction.
Statechart Diagram
Any real-time system is expected to be reacted by some kind of internal/external events.
These events are responsible for state change of the system.
Statechart diagram is used to represent the event driven state change of a system. It
basically describes the state change of a class, interface, etc.
State chart diagram is used to visualize the reaction of a system by internal/external
factors.

UML
25
Activity Diagram
Activity diagram describes the flow of control in a system. It consists of activities and links.
The flow can be sequential, concurrent, or branched.
Activities are nothing but the functions of a system. Numbers of activity diagrams are
prepared to capture the entire flow in a system.
Activity diagrams are used to visualize the flow of controls in a system. This is prepared
to have an idea of how the system will work when executed.
Note: Dynamic nature of a system is very difficult to capture. UML has provided features
to capture the dynamics of a system from different angles. Sequence diagrams and
collaboration diagrams are isomorphic, hence they can be converted from one another
without losing any information. This is also true for Statechart and activity diagram.
UML
26
Class diagram is a static diagram. It represents the static view of an application. Class
diagram is not only used for visualizing, describing, and documenting different aspects of
a system but also for constructing executable code of the software application.
Class diagram describes the attributes and operations of a class and also the constraints
imposed on the system. The class diagrams are widely used in the modeling of object-
oriented systems because they are the only UML diagrams, which can be mapped directly
with object-oriented languages.
Class diagram shows a collection of classes, interfaces, associations, collaborations, and
constraints. It is also known as a structural diagram.
Purpose of Class Diagrams
The purpose of class diagram is to model the static view of an application. Class diagrams
are the only diagrams which can be directly mapped with object-oriented languages and
thus widely used at the time of construction.
UML diagrams like activity diagram, sequence diagram can only give the sequence flow of
the application, however class diagram is a bit different. It is the most popular UML
diagram in the coder community.
The purpose of the class diagram can be summarized as:
Analysis and design of the static view of an application.
Describe responsibilities of a system.
Base for component and deployment diagrams.
Forward and reverse engineering.
How to Draw a Class Diagram?
Class diagrams are the most popular UML diagrams used for construction of software
applications. It is very important to learn the drawing procedure of class diagram.
Class diagrams have a lot of properties to consider while drawing but here the diagram
will be considered from a top level view.
Class diagram is basically a graphical representation of the static view of the system and
represents different aspects of the application. A collection of class diagrams represent the
whole system.
The following points should be remembered while drawing a class diagram:
The name of the class diagram should be meaningful to describe the aspect of the
system.
Each element and their relationships should be identified in advance.
7. UML ─ Class Diagram
UML
27
Responsibility (attributes and methods) of each class should be clearly identified.
For each class, minimum number of properties should be specified, as unnecessary
properties will make the diagram complicated.
Use notes whenever required to describe some aspect of the diagram. At the end
of the drawing it should be understandable to the developer/coder.
Finally, before making the final version, the diagram should be drawn on plain
paper and reworked as many times as possible to make it correct.
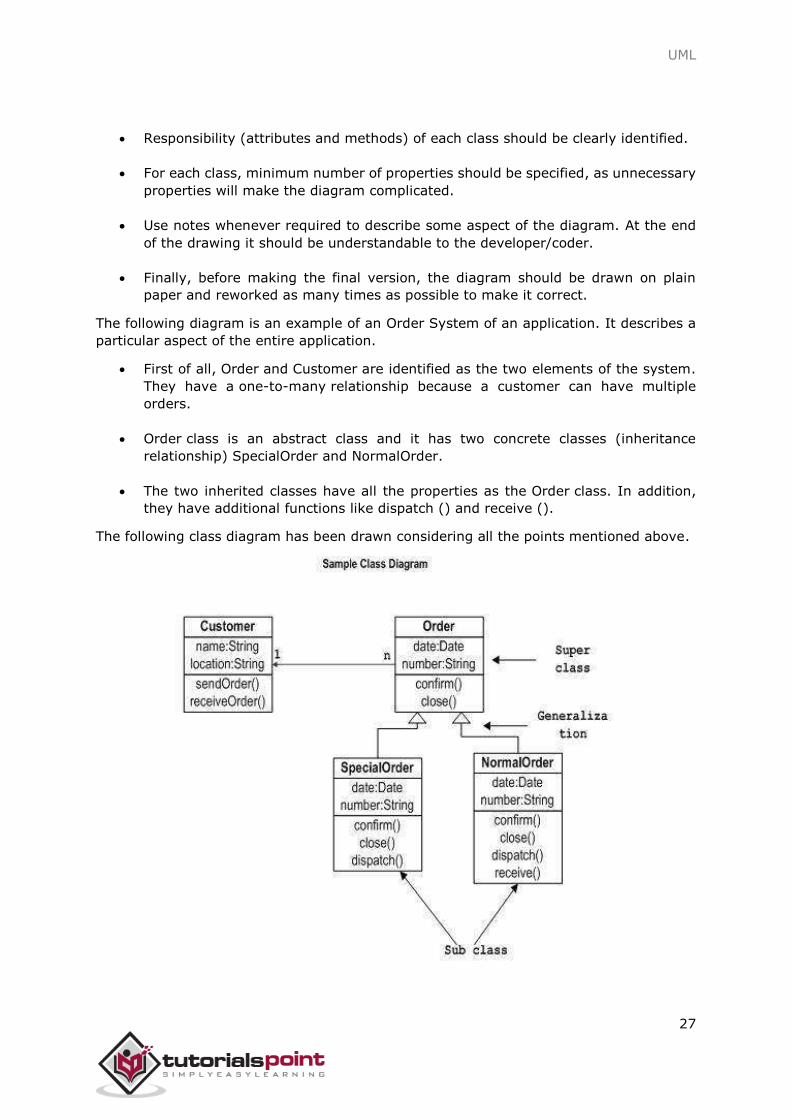
The following diagram is an example of an Order System of an application. It describes a
particular aspect of the entire application.
First of all, Order and Customer are identified as the two elements of the system.
They have a one-to-many relationship because a customer can have multiple
orders.
Order class is an abstract class and it has two concrete classes (inheritance
relationship) SpecialOrder and NormalOrder.
The two inherited classes have all the properties as the Order class. In addition,
they have additional functions like dispatch () and receive ().
The following class diagram has been drawn considering all the points mentioned above.
UML
28
Where to Use Class Diagrams?
Class diagram is a static diagram and it is used to model the static view of a system. The
static view describes the vocabulary of the system.
Class diagram is also considered as the foundation for component and deployment
diagrams. Class diagrams are not only used to visualize the static view of the system but
they are also used to construct the executable code for forward and reverse engineering
of any system.
Generally, UML diagrams are not directly mapped with any object-oriented programming
languages but the class diagram is an exception.
Class diagram clearly shows the mapping with object-oriented languages such as Java,
C++, etc. From practical experience, class diagram is generally used for construction
purpose.
In a nutshell it can be said, class diagrams are used for:
Describing the static view of the system.
Showing the collaboration among the elements of the static view.
Describing the functionalities performed by the system.
Constructing software applications using object-oriented languages.
UML
29
Object diagrams are derived from class diagrams so object diagrams are dependent upon
class diagrams.
Object diagrams represent an instance of a class diagram. The basic concepts are similar
for class diagrams and object diagrams. Object diagrams also represent the static view of
a system but this static view is a snapshot of the system at a particular moment.
Object diagrams are used to render a set of objects and their relationships as an instance.
Purpose of Object Diagrams
The purpose of a diagram should be understood clearly to implement it practically. The
purposes of object diagrams are similar to class diagrams.
The difference is that a class diagram represents an abstract model consisting of classes
and their relationships. However, an object diagram represents an instance at a particular
moment, which is concrete in nature.
It means the object diagram is closer to the actual system behavior. The purpose is to
capture the static view of a system at a particular moment.
The purpose of the object diagram can be summarized as:
Forward and reverse engineering
Object relationships of a system
Static view of an interaction
Understand object behavior and their relationship from a practical perspective
How to Draw an Object Diagram?
We have already discussed that an object diagram is an instance of a class diagram. It
implies that an object diagram consists of instances of things used in a class diagram.
So both diagrams are made of same basic elements but in different form. In class diagram
elements are in abstract form to represent the blue print and in object diagram the
elements are in concrete form to represent the real world object.
To capture a particular system, numbers of class diagrams are limited. However, if we
consider object diagrams then we can have unlimited number of instances, which are
unique in nature. Only those instances are considered, which have an impact on the
system.
8. UML ─ Object Diagrams
UML
30
From the above discussion, it is clear that a single object diagram cannot capture all the
necessary instances or rather cannot specify all the objects of a system. Hence, the
solution is:
First, analyze the system and decide which instances have important data and
association.
Second, consider only those instances, which will cover the functionality.
Third, make some optimization as the number of instances are unlimited.
Before drawing an object diagram, the following things should be remembered and
understood clearly:
Object diagrams consist of objects.
The link in object diagram is used to connect objects.
Objects and links are the two elements used to construct an object diagram.
After this, the following things are to be decided before starting the construction of the
diagram:
The object diagram should have a meaningful name to indicate its purpose.
The most important elements are to be identified.
The association among objects should be clarified.
Values of different elements need to be captured to include in the object diagram.
Add proper notes at points where more clarity is required.
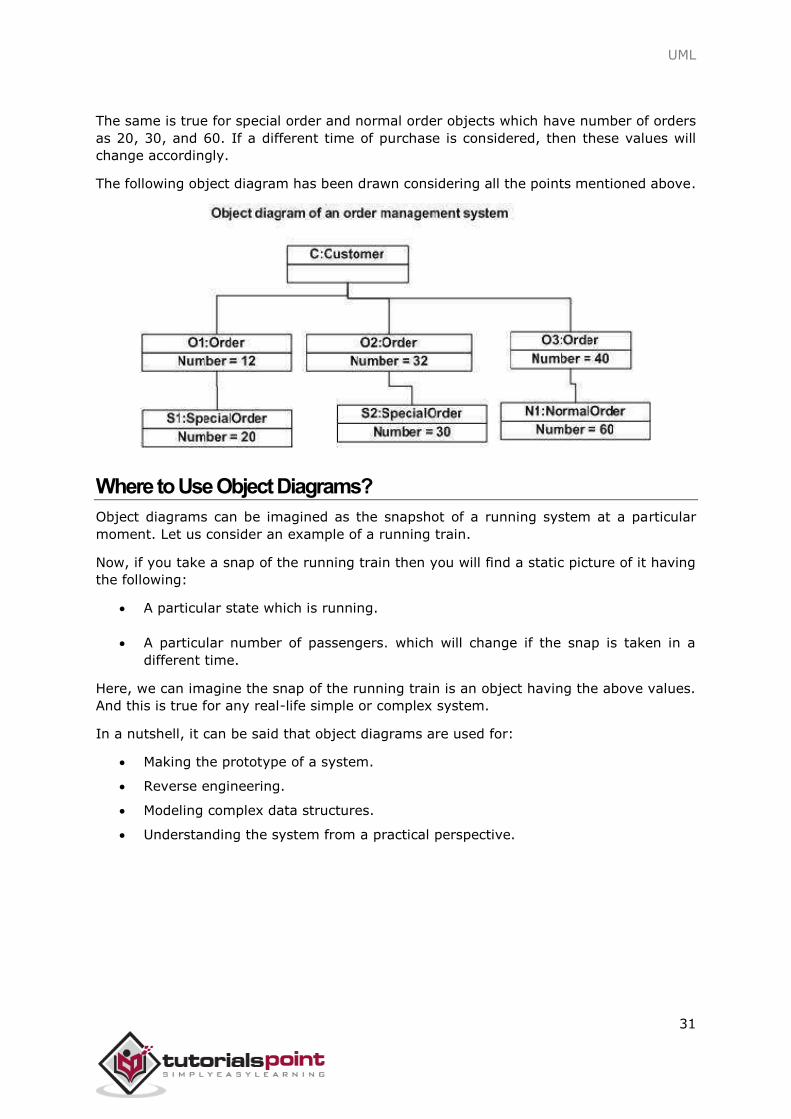
The following diagram is an example of an object diagram. It represents the Order
management system which we have discussed in the chapter Class Diagram. The following
diagram is an instance of the system at a particular time of purchase. It has the following
objects.
Customer
Order
SpecialOrder
NormalOrder
Now the customer object (C) is associated with three order objects (O1, O2, and O3).
These order objects are associated with special order and normal order objects (S1, S2,
and N1). The customer has the following three orders with different numbers (12, 32 and
40) for the particular time considered.
The customer can increase the number of orders in future and in that scenario the object
diagram will reflect that. If order, special order, and normal order objects are observed
then you will find that they have some values.
For orders, the values are 12, 32, and 40 which implies that the objects have these values
for a particular moment (here the particular time when the purchase is made is considered
as the moment) when the instance is captured.
UML
31
The same is true for special order and normal order objects which have number of orders
as 20, 30, and 60. If a different time of purchase is considered, then these values will
change accordingly.
The following object diagram has been drawn considering all the points mentioned above.
Where to Use Object Diagrams?
Object diagrams can be imagined as the snapshot of a running system at a particular
moment. Let us consider an example of a running train.
Now, if you take a snap of the running train then you will find a static picture of it having
the following:
A particular state which is running.
A particular number of passengers. which will change if the snap is taken in a
different time.
Here, we can imagine the snap of the running train is an object having the above values.
And this is true for any real-life simple or complex system.
In a nutshell, it can be said that object diagrams are used for:
Making the prototype of a system.
Reverse engineering.
Modeling complex data structures.
Understanding the system from a practical perspective.
UML
32
Component diagrams are different in terms of nature and behavior. Component diagrams
are used to model the physical aspects of a system. Now the question is, what are these
physical aspects? Physical aspects are the elements such as executables, libraries, files,
documents, etc. which reside in a node.
Component diagrams are used to visualize the organization and relationships among
components in a system. These diagrams are also used to make executable systems.
Purpose of Component Diagrams
Component diagram is a special kind of diagram in UML. The purpose is also different from
all other diagrams discussed so far. It does not describe the functionality of the system
but it describes the components used to make those functionalities.
Thus from that point of view, component diagrams are used to visualize the physical
components in a system. These components are libraries, packages, files, etc.
Component diagrams can also be described as a static implementation view of a system.
Static implementation represents the organization of the components at a particular
moment.
A single component diagram cannot represent the entire system but a collection of
diagrams is used to represent the whole.
The purpose of the component diagram can be summarized as:
Visualize the components of a system.
Construct executables by using forward and reverse engineering.
Describe the organization and relationships of the components.
How to Draw a Component Diagram?
Component diagrams are used to describe the physical artifacts of a system. This artifact
includes files, executables, libraries, etc.
The purpose of this diagram is different. Component diagrams are used during the
implementation phase of an application. However, it is prepared well in advance to
visualize the implementation details.
Initially, the system is designed using different UML diagrams and then when the artifacts
are ready, component diagrams are used to get an idea of the implementation.
This diagram is very important as without it the application cannot be implemented
efficiently. A well-prepared component diagram is also important for other aspects such
as application performance, maintenance, etc.
9. UML ─ Component Diagrams
UML
33
Before drawing a component diagram, the following artifacts are to be identified clearly:
Files used in the system.
Libraries and other artifacts relevant to the application.
Relationships among the artifacts.
After identifying the artifacts, the following points need to be kept in mind.
Use a meaningful name to identify the component for which the diagram is to be
drawn.
Prepare a mental layout before producing the using tools.
Use notes for clarifying important points.
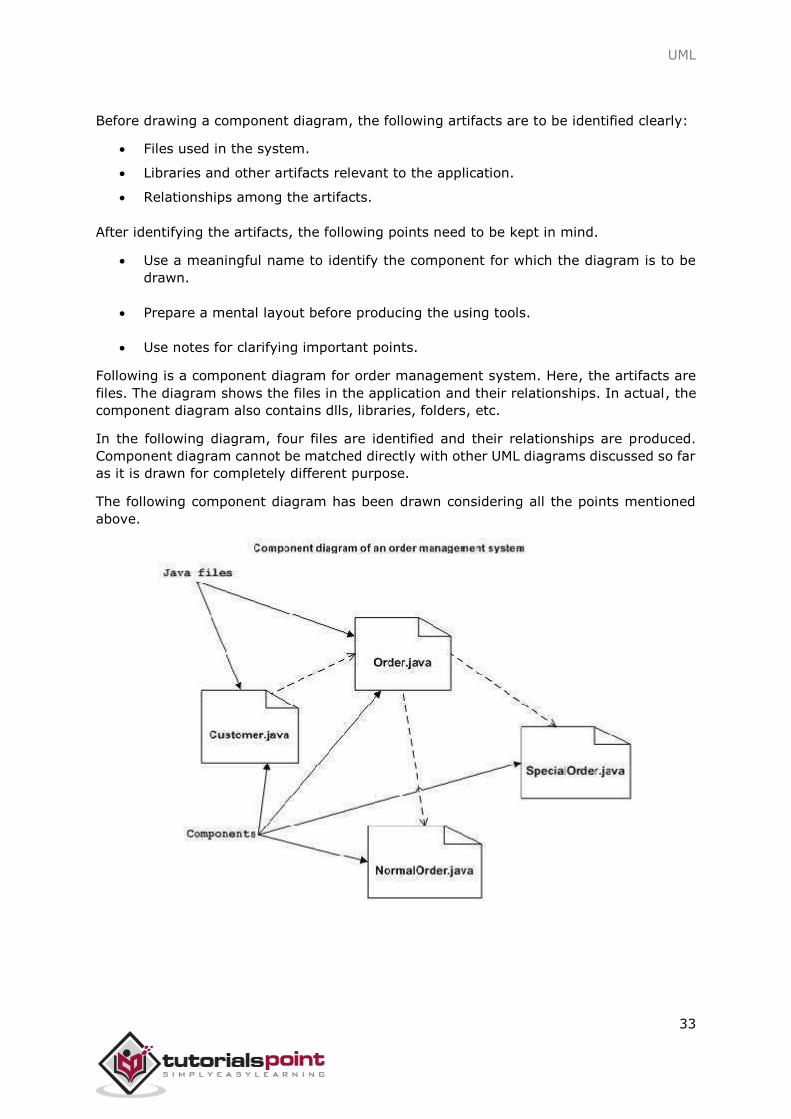
Following is a component diagram for order management system. Here, the artifacts are
files. The diagram shows the files in the application and their relationships. In actual, the
component diagram also contains dlls, libraries, folders, etc.
In the following diagram, four files are identified and their relationships are produced.
Component diagram cannot be matched directly with other UML diagrams discussed so far
as it is drawn for completely different purpose.
The following component diagram has been drawn considering all the points mentioned
above.
UML
34
Where to Use Component Diagrams?
We have already described that component diagrams are used to visualize the static
implementation view of a system. Component diagrams are special type of UML diagrams
used for different purposes.
These diagrams show the physical components of a system. To clarify it, we can say that
component diagrams describe the organization of the components in a system.
Organization can be further described as the location of the components in a system.
These components are organized in a special way to meet the system requirements.
As we have already discussed, those components are libraries, files, executables, etc.
Before implementing the application, these components are to be organized. This
component organization is also designed separately as a part of project execution.
Component diagrams are very important from implementation perspective. Thus, the
implementation team of an application should have a proper knowledge of the component
details.
Component diagrams can be used to:
Model the components of a system.
Model the database schema.
Model the executables of an application.
Model the system's source code.
UML
35
Deployment diagrams are used to visualize the topology of the physical components of a
system, where the software components are deployed.
Deployment diagrams are used to describe the static deployment view of a system.
Deployment diagrams consist of nodes and their relationships.
Purpose of Deployment Diagrams
The term Deployment itself describes the purpose of the diagram. Deployment diagrams
are used for describing the hardware components, where software components are
deployed. Component diagrams and deployment diagrams are closely related.
Component diagrams are used to describe the components and deployment diagrams
shows how they are deployed in hardware.
UML is mainly designed to focus on the software artifacts of a system. However, these two
diagrams are special diagrams used to focus on software and hardware components.
Most of the UML diagrams are used to handle logical components but deployment diagrams
are made to focus on the hardware topology of a system. Deployment diagrams are used
by the system engineers.
The purpose of deployment diagrams can be described as:
Visualize the hardware topology of a system.
Describe the hardware components used to deploy software components.
Describe the runtime processing nodes.
How to Draw a Deployment Diagram?
Deployment diagram represents the deployment view of a system. It is related to the
component diagram because the components are deployed using the deployment
diagrams. A deployment diagram consists of nodes. Nodes are nothing but physical
hardware used to deploy the application.
Deployment diagrams are useful for system engineers. An efficient deployment diagram
is very important as it controls the following parameters:
Performance
Scalability
Maintainability
Portability
Before drawing a deployment diagram, the following artifacts should be identified:
Nodes
Relationships among nodes
10. UML ─ Deployment Diagrams
UML
36
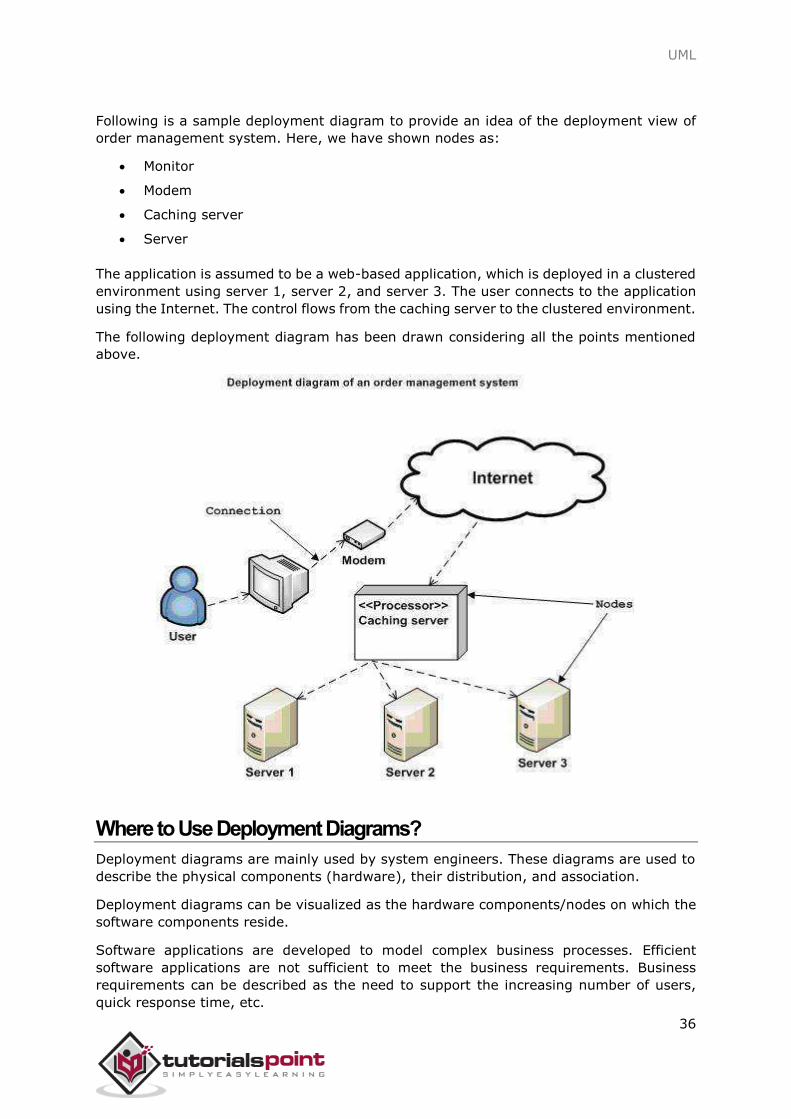
Following is a sample deployment diagram to provide an idea of the deployment view of
order management system. Here, we have shown nodes as:
Monitor
Modem
Caching server
Server
The application is assumed to be a web-based application, which is deployed in a clustered
environment using server 1, server 2, and server 3. The user connects to the application
using the Internet. The control flows from the caching server to the clustered environment.
The following deployment diagram has been drawn considering all the points mentioned
above.
Where to Use Deployment Diagrams?
Deployment diagrams are mainly used by system engineers. These diagrams are used to
describe the physical components (hardware), their distribution, and association.
Deployment diagrams can be visualized as the hardware components/nodes on which the
software components reside.
Software applications are developed to model complex business processes. Efficient
software applications are not sufficient to meet the business requirements. Business
requirements can be described as the need to support the increasing number of users,
quick response time, etc.

UML
37
To meet these types of requirements, hardware components should be designed efficiently
and in a cost-effective way.
Now-a-days software applications are very complex in nature. Software applications can
be standalone, web-based, distributed, mainframe-based and many more. Hence, it is
very important to design the hardware components efficiently.
Deployment diagrams can be used:
To model the hardware topology of a system.
To model the embedded system.
To model the hardware details for a client/server system.
To model the hardware details of a distributed application.
For Forward and Reverse engineering.
UML
38
To model a system, the most important aspect is to capture the dynamic behavior.
Dynamic behavior means the behavior of the system when it is running/operating.
Only static behavior is not sufficient to model a system rather dynamic behavior is more
important than static behavior. In UML, there are five diagrams available to model the
dynamic nature and use case diagram is one of them. Now as we have to discuss that the
use case diagram is dynamic in nature, there should be some internal or external factors
for making the interaction.
These internal and external agents are known as actors. Use case diagrams consists of
actors, use cases and their relationships. The diagram is used to model the
system/subsystem of an application. A single use case diagram captures a particular
functionality of a system.
Hence to model the entire system, a number of use case diagrams are used.
Purpose of Use Case Diagrams
The purpose of use case diagram is to capture the dynamic aspect of a system. However,
this definition is too generic to describe the purpose, as other four diagrams (activity,
sequence, collaboration, and Statechart) also have the same purpose. We will look into
some specific purpose, which will distinguish it from other four diagrams.
Use case diagrams are used to gather the requirements of a system including internal and
external influences. These requirements are mostly design requirements. Hence, when a
system is analyzed to gather its functionalities, use cases are prepared and actors are
identified.
When the initial task is complete, use case diagrams are modelled to present the outside
view.
In brief, the purposes of use case diagrams can be said to be as follows:
Used to gather the requirements of a system.
Used to get an outside view of a system.
Identify the external and internal factors influencing the system.
Show the interaction among the requirements are actors.
11. UML ─ Use Case Diagrams
UML
39
How to Draw a Use Case Diagram?
Use case diagrams are considered for high level requirement analysis of a system. When
the requirements of a system are analyzed, the functionalities are captured in use cases.
We can say that use cases are nothing but the system functionalities written in an
organized manner. The second thing which is relevant to use cases are the actors. Actors
can be defined as something that interacts with the system.
Actors can be a human user, some internal applications, or may be some external
applications. When we are planning to draw a use case diagram, we should have the
following items identified.
Functionalities to be represented as use case
Actors
Relationships among the use cases and actors
Use case diagrams are drawn to capture the functional requirements of a system. After
identifying the above items, we have to use the following guidelines to draw an efficient
use case diagram.
The name of a use case is very important. The name should be chosen in such a
way so that it can identify the functionalities performed.
Give a suitable name for actors.
Show relationships and dependencies clearly in the diagram.
Do not try to include all types of relationships, as the main purpose of the diagram
is to identify the requirements.
Use notes whenever required to clarify some important points.
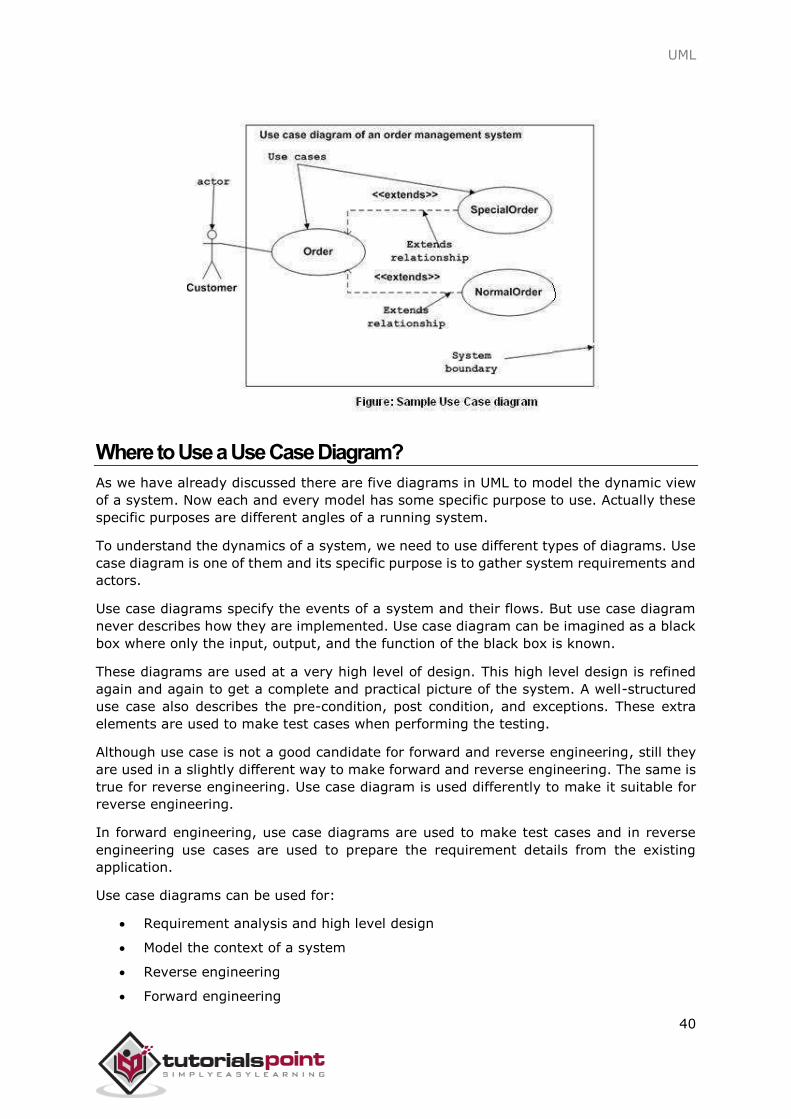
Following is a sample use case diagram representing the order management system.
Hence, if we look into the diagram then we will find three use cases (Order,
SpecialOrder, and NormalOrder) and one actor which is the customer.
The SpecialOrder and NormalOrder use cases are extended from Order use case. Hence,
they have extended relationship. Another important point is to identify the system
boundary, which is shown in the picture. The actor Customer lies outside the system as it
is an external user of the system.
UML
40
Where to Use a Use Case Diagram?
As we have already discussed there are five diagrams in UML to model the dynamic view
of a system. Now each and every model has some specific purpose to use. Actually these
specific purposes are different angles of a running system.
To understand the dynamics of a system, we need to use different types of diagrams. Use
case diagram is one of them and its specific purpose is to gather system requirements and
actors.
Use case diagrams specify the events of a system and their flows. But use case diagram
never describes how they are implemented. Use case diagram can be imagined as a black
box where only the input, output, and the function of the black box is known.
These diagrams are used at a very high level of design. This high level design is refined
again and again to get a complete and practical picture of the system. A well-structured
use case also describes the pre-condition, post condition, and exceptions. These extra
elements are used to make test cases when performing the testing.
Although use case is not a good candidate for forward and reverse engineering, still they
are used in a slightly different way to make forward and reverse engineering. The same is
true for reverse engineering. Use case diagram is used differently to make it suitable for
reverse engineering.
In forward engineering, use case diagrams are used to make test cases and in reverse
engineering use cases are used to prepare the requirement details from the existing
application.
Use case diagrams can be used for:
Requirement analysis and high level design
Model the context of a system
Reverse engineering
Forward engineering
UML
41
From the term Interaction, it is clear that the diagram is used to describe some type of
interactions among the different elements in the model. This interaction is a part of
dynamic behavior of the system.
This interactive behavior is represented in UML by two diagrams known as Sequence
diagram and Collaboration diagram. The basic purpose of both the diagrams are
similar.
Sequence diagram emphasizes on time sequence of messages and collaboration diagram
emphasizes on the structural organization of the objects that send and receive messages.
Purpose of Interaction Diagrams
The purpose of interaction diagrams is to visualize the interactive behavior of the system.
Visualizing the interaction is a difficult task. Hence, the solution is to use different types
of models to capture the different aspects of the interaction.
Sequence and collaboration diagrams are used to capture the dynamic nature but from a
different angle.
The purpose of interaction diagram is:
To capture the dynamic behavior of a system.
To describe the message flow in the system.
To describe the structural organization of the objects.
To describe interaction among objects.
How to Draw an Interaction Diagram?
As we have already discussed, the purpose of interaction diagrams is to capture the
dynamic aspect of a system. So to capture the dynamic aspect, we need to understand
what a dynamic aspect is and how it is visualized. Dynamic aspect can be defined as the
snapshot of the running system at a particular moment.
We have two types of interaction diagrams in UML. One is the sequence diagram and the
other is the collaboration diagram. The sequence diagram captures the time sequence of
the message flow from one object to another and the collaboration diagram describes the
organization of objects in a system taking part in the message flow.
Following things are to be identified clearly before drawing the interaction diagram:
Objects taking part in the interaction
Message flows among the objects
The sequence in which the messages are flowing
Object organization
12. UML ─ Interaction Diagrams
UML
42
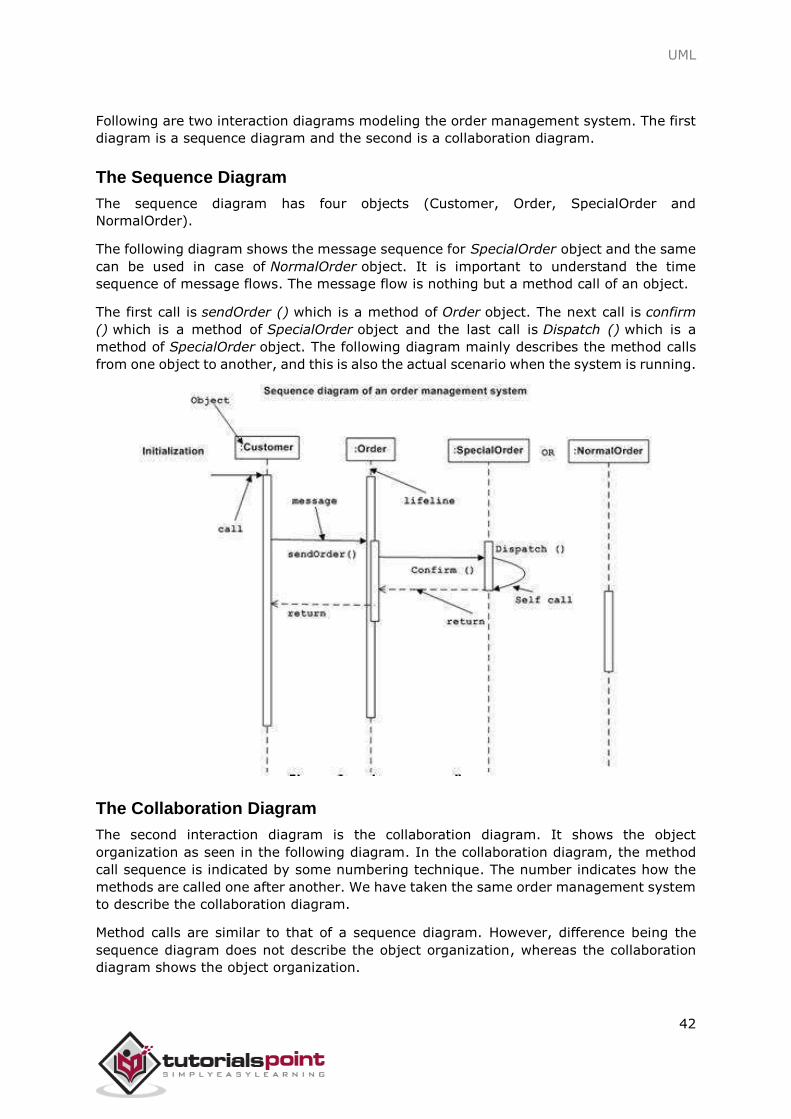
Following are two interaction diagrams modeling the order management system. The first
diagram is a sequence diagram and the second is a collaboration diagram.
The Sequence Diagram
The sequence diagram has four objects (Customer, Order, SpecialOrder and
NormalOrder).
The following diagram shows the message sequence for SpecialOrder object and the same
can be used in case of NormalOrder object. It is important to understand the time
sequence of message flows. The message flow is nothing but a method call of an object.
The first call is sendOrder () which is a method of Order object. The next call is confirm
() which is a method of SpecialOrder object and the last call is Dispatch () which is a
method of SpecialOrder object. The following diagram mainly describes the method calls
from one object to another, and this is also the actual scenario when the system is running.
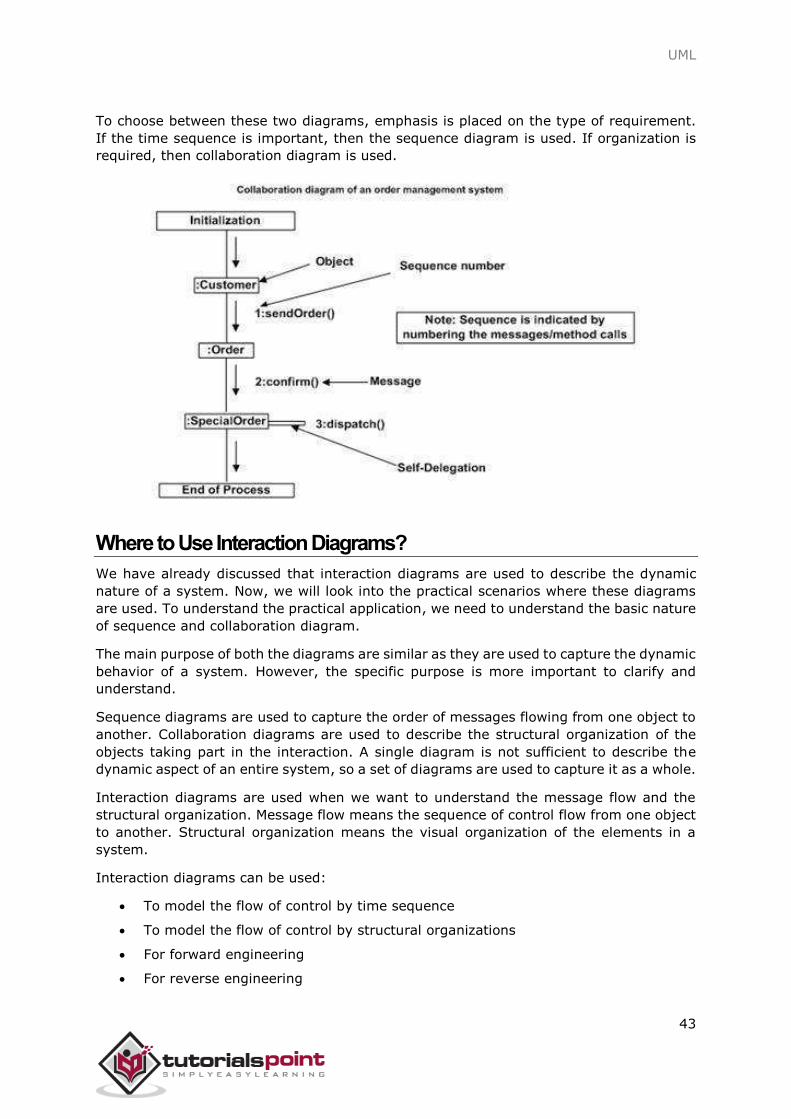
The Collaboration Diagram
The second interaction diagram is the collaboration diagram. It shows the object
organization as seen in the following diagram. In the collaboration diagram, the method
call sequence is indicated by some numbering technique. The number indicates how the
methods are called one after another. We have taken the same order management system
to describe the collaboration diagram.
Method calls are similar to that of a sequence diagram. However, difference being the
sequence diagram does not describe the object organization, whereas the collaboration
diagram shows the object organization.
UML
43
To choose between these two diagrams, emphasis is placed on the type of requirement.
If the time sequence is important, then the sequence diagram is used. If organization is
required, then collaboration diagram is used.
Where to Use Interaction Diagrams?
We have already discussed that interaction diagrams are used to describe the dynamic
nature of a system. Now, we will look into the practical scenarios where these diagrams
are used. To understand the practical application, we need to understand the basic nature
of sequence and collaboration diagram.
The main purpose of both the diagrams are similar as they are used to capture the dynamic
behavior of a system. However, the specific purpose is more important to clarify and
understand.
Sequence diagrams are used to capture the order of messages flowing from one object to
another. Collaboration diagrams are used to describe the structural organization of the
objects taking part in the interaction. A single diagram is not sufficient to describe the
dynamic aspect of an entire system, so a set of diagrams are used to capture it as a whole.
Interaction diagrams are used when we want to understand the message flow and the
structural organization. Message flow means the sequence of control flow from one object
to another. Structural organization means the visual organization of the elements in a
system.
Interaction diagrams can be used:
To model the flow of control by time sequence
To model the flow of control by structural organizations
For forward engineering
For reverse engineering
UML
44
The name of the diagram itself clarifies the purpose of the diagram and other details. It
describes different states of a component in a system. The states are specific to a
component/object of a system.
A Statechart diagram describes a state machine. State machine can be defined as a
machine which defines different states of an object and these states are controlled by
external or internal events.
Activity diagram explained in the next chapter, is a special kind of a Statechart diagram.
As Statechart diagram defines the states, it is used to model the lifetime of an object.
Purpose of Statechart Diagrams
Statechart diagram is one of the five UML diagrams used to model the dynamic nature of
a system. They define different states of an object during its lifetime and these states are
changed by events. Statechart diagrams are useful to model the reactive systems.
Reactive systems can be defined as a system that responds to external or internal events.
Statechart diagram describes the flow of control from one state to another state. States
are defined as a condition in which an object exists and it changes when some event is
triggered. The most important purpose of Statechart diagram is to model lifetime of an
object from creation to termination.
Statechart diagrams are also used for forward and reverse engineering of a system.
However, the main purpose is to model the reactive system.
Following are the main purposes of using Statechart diagrams:
To model the dynamic aspect of a system.
To model the lifetime of a reactive system.
To describe different states of an object during its lifetime.
Define a state machine to model the states of an object.
How to Draw a Statechart Diagram?
Statechart diagram is used to describe the states of different objects in its life cycle.
Emphasis is placed on the state changes upon some internal or external events. These
states of objects are important to analyze and implement them accurately.
Statechart diagrams are very important for describing the states. States can be identified
as the condition of objects when a particular event occurs.
Before drawing a Statechart diagram we should clarify the following points:
Identify the important objects to be analyzed
Identify the states
Identify the events
13. UML ─ Statechart Diagrams
UML
45
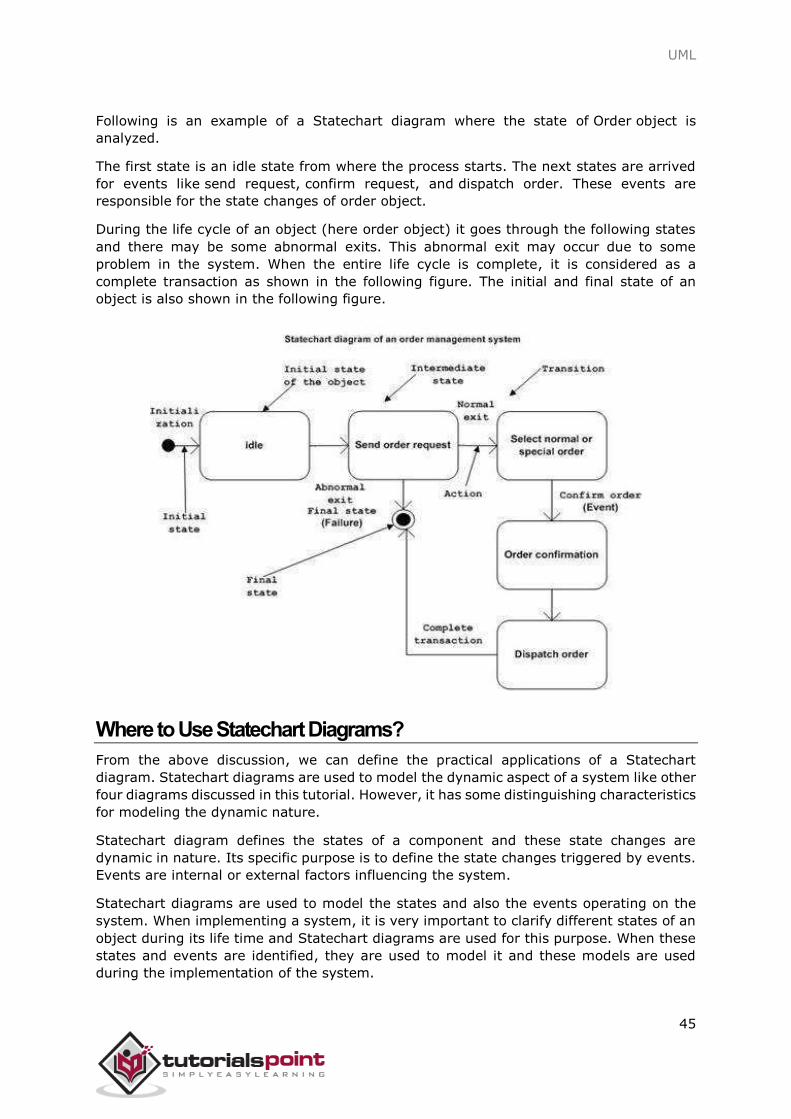
Following is an example of a Statechart diagram where the state of Order object is
analyzed.
The first state is an idle state from where the process starts. The next states are arrived
for events like send request, confirm request, and dispatch order. These events are
responsible for the state changes of order object.
During the life cycle of an object (here order object) it goes through the following states
and there may be some abnormal exits. This abnormal exit may occur due to some
problem in the system. When the entire life cycle is complete, it is considered as a
complete transaction as shown in the following figure. The initial and final state of an
object is also shown in the following figure.
Where to Use Statechart Diagrams?
From the above discussion, we can define the practical applications of a Statechart
diagram. Statechart diagrams are used to model the dynamic aspect of a system like other
four diagrams discussed in this tutorial. However, it has some distinguishing characteristics
for modeling the dynamic nature.
Statechart diagram defines the states of a component and these state changes are
dynamic in nature. Its specific purpose is to define the state changes triggered by events.
Events are internal or external factors influencing the system.
Statechart diagrams are used to model the states and also the events operating on the
system. When implementing a system, it is very important to clarify different states of an
object during its life time and Statechart diagrams are used for this purpose. When these
states and events are identified, they are used to model it and these models are used
during the implementation of the system.

UML
46
If we look into the practical implementation of Statechart diagram, then it is mainly used
to analyze the object states influenced by events. This analysis is helpful to understand
the system behavior during its execution.
The main usage can be described as:
To model the object states of a system.
To model the reactive system. Reactive system consists of reactive objects.
To identify the events responsible for state changes.
Forward and reverse engineering.
UML
47
Activity diagram is another important diagram in UML to describe the dynamic aspects of
the system.
Activity diagram is basically a flowchart to represent the flow from one activity to another
activity. The activity can be described as an operation of the system.
The control flow is drawn from one operation to another. This flow can be sequential,
branched, or concurrent. Activity diagrams deal with all type of flow control by using
different elements such as fork, join, etc.
Purpose of Activity Diagrams
The basic purposes of activity diagrams is similar to other four diagrams. It captures the
dynamic behavior of the system. Other four diagrams are used to show the message flow
from one object to another but activity diagram is used to show message flow from one
activity to another.
Activity is a particular operation of the system. Activity diagrams are not only used for
visualizing the dynamic nature of a system, but they are also used to construct the
executable system by using forward and reverse engineering techniques. The only missing
thing in the activity diagram is the message part.
It does not show any message flow from one activity to another. Activity diagram is
sometimes considered as the flowchart. Although the diagrams look like a flowchart, they
are not. It shows different flows such as parallel, branched, concurrent, and single.
The purpose of an activity diagram can be described as:
Draw the activity flow of a system.
Describe the sequence from one activity to another.
Describe the parallel, branched, and concurrent flow of the system.
How to Draw an Activity Diagram?
Activity diagrams are mainly used as a flowchart that consists of activities performed by
the system. Activity diagrams are not exactly flowcharts as they have some additional
capabilities. These additional capabilities include branching, parallel flow, swimlane, etc.
Before drawing an activity diagram, we must have a clear understanding about the
elements used in activity diagram. The main element of an activity diagram is the activity
itself. An activity is a function performed by the system. After identifying the activities, we
need to understand how they are associated with constraints and conditions.
14. UML ─ Activity Diagrams
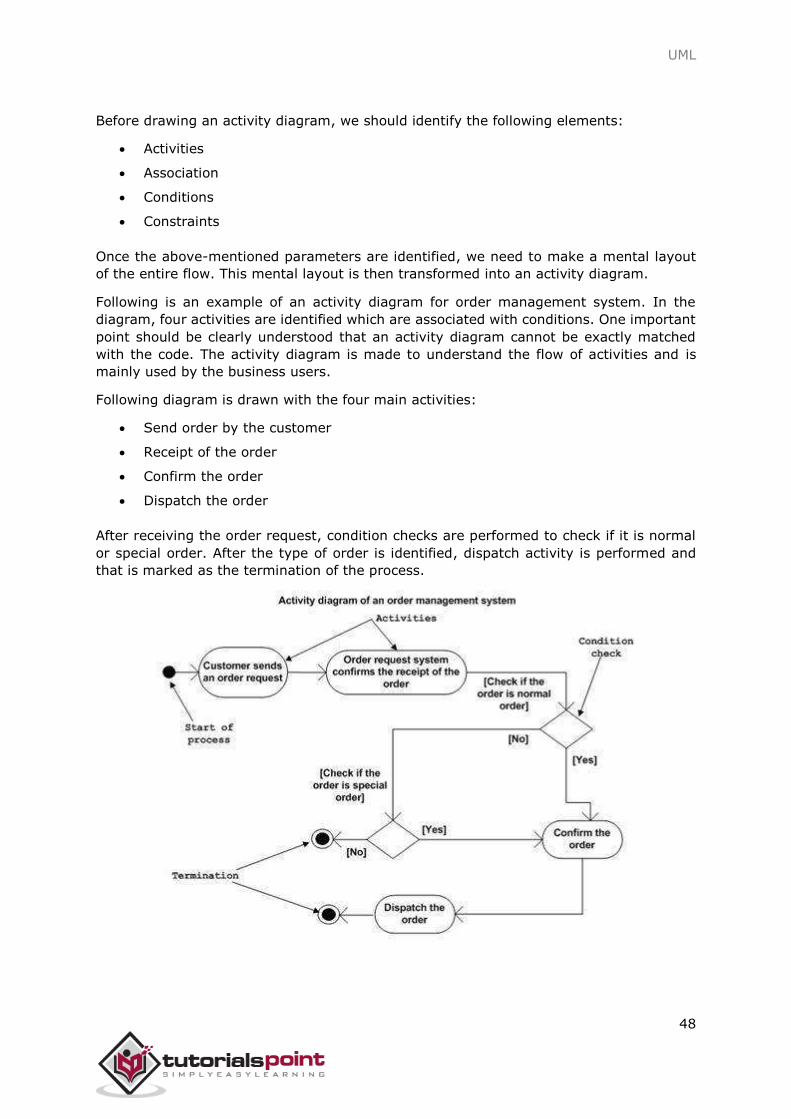
UML
48
Before drawing an activity diagram, we should identify the following elements:
Activities
Association
Conditions
Constraints
Once the above-mentioned parameters are identified, we need to make a mental layout
of the entire flow. This mental layout is then transformed into an activity diagram.
Following is an example of an activity diagram for order management system. In the
diagram, four activities are identified which are associated with conditions. One important
point should be clearly understood that an activity diagram cannot be exactly matched
with the code. The activity diagram is made to understand the flow of activities and is
mainly used by the business users.
Following diagram is drawn with the four main activities:
Send order by the customer
Receipt of the order
Confirm the order
Dispatch the order
After receiving the order request, condition checks are performed to check if it is normal
or special order. After the type of order is identified, dispatch activity is performed and
that is marked as the termination of the process.
UML
49
Where to Use Activity Diagrams?
The basic usage of activity diagram is similar to other four UML diagrams. The specific
usage is to model the control flow from one activity to another. This control flow does not
include messages.
Activity diagram is suitable for modeling the activity flow of the system. An application can
have multiple systems. Activity diagram also captures these systems and describes the
flow from one system to another. This specific usage is not available in other diagrams.
These systems can be database, external queues, or any other system.
We will now look into the practical applications of the activity diagram. From the above
discussion, it is clear that an activity diagram is drawn from a very high level. So it gives
high level view of a system. This high level view is mainly for business users or any other
person who is not a technical person.
This diagram is used to model the activities which are nothing but business requirements.
The diagram has more impact on business understanding rather than on implementation
details.
Activity diagram can be used for:
Modeling workflow by using activities.
Modeling business requirements.
High level understanding of the system's functionalities.
Investigating business requirements at a later stage.

UML
50
UML 2.0

UML
51
UML 2.0 is totally a different dimension in the world of Unified Modeling Language. It is
more complex and extensive in nature. The extent of documentation has also increased
compared to UML 1.5 version. UML 2.0 has added new features so that its usage can be
more extensive.
UML 2.0 adds the definition of formal and completely defined semantics. This new
possibility can be utilized for the development of models and the corresponding systems
can be generated from these models. However, to utilize this new dimension, a
considerable effort has to be made to acquire knowledge.
New Dimensions in UML 2.0
The structure and documentation of UML was completely revised in the latest version of
UML 2.0. There are now two documents available that describe UML:
UML 2.0 Infrastructure defines the basic constructs of the language on which UML
is based. This section is not directly relevant to the users of UML. This is directed
more towards the developers of modeling tools. This area is not in the scope of this
tutorial.
UML 2.0 Superstructure defines the user constructs of UML 2.0. It means those
elements of UML that the users will use at the immediate level. This is the main
focus for the user community of UML.
This revision of UML was created to fulfil a goal to restructure and refine UML so that
usability, implementation, and adaptation are simplified.
UML infrastructure is used to:
Provide a reusable meta-language core. This is used to define UML itself.
Provide mechanisms to adjustment the language.
UML superstructure is used to:
Provide better support for component-based development.
Improve constructs for the specification of architecture.
Provide better options for the modeling of behavior.
The important point to note is the major divisions described above. These divisions are
used to increase the usability of UML and define a clear understanding of its usage.
There is another dimension which is already proposed in this new version. It is a proposal
for a completely new Object Constraint Language (OCL) and Diagram Interchange. These
features all together form the complete UML 2.0 package.
15. UML 2.0 ─ Overview
UML
52
Modeling Diagrams in UML 2.0
Modeling Interactions
The interaction diagrams described in UML 2.0 is different than the earlier versions.
However, the basic concept remains the same as the earlier version. The major difference
is the enhancement and additional features added to the diagrams in UML 2.0.
UML 2.0 models object interaction in the following four different ways.
Sequence diagram is a time dependent view of the interaction between objects
to accomplish a behavioral goal of the system. The time sequence is similar to the
earlier version of sequence diagram. An interaction may be designed at any level
of abstraction within the system design, from subsystem interactions to instance-
level.
Communication diagram is a new name added in UML 2.0. Communication
diagram is a structural view of the messaging between objects, taken from the
Collaboration diagram concept of UML 1.4 and earlier versions. This can be defined
as a modified version of collaboration diagram.
Interaction Overview diagram is also a new addition in UML 2.0. An Interaction
Overview diagram describes a high-level view of a group of interactions combined
into a logic sequence, including flow-control logic to navigate between the
interactions.
Timing diagram is also added in UML 2.0. It is an optional diagram designed to
specify the time constraints on the messages sent and received in the course of an
interaction.
From the above description, it is important to note that the purpose of all the diagrams
are to send/receive messages. The handling of these messages are internal to the objects.
Hence, the objects also have options to receive and send messages, and here comes
another important aspect called interface. Now these interfaces are responsible for
accepting and sending messages to one another.
It can thus be concluded that the interactions in UML 2.0 are described in a different way
and that is the reason why the new diagram names have come into picture. If we analyze
the new diagrams then it is clear that all the diagrams are created based upon the
interaction diagrams described in the earlier versions. The only difference is the additional
features added in UML 2.0 to make the diagrams more efficient and purpose oriented.
Modeling Collaborations
As we have already discussed, collaboration is used to model common interactions
between objects. We can say that collaboration is an interaction where a set of messages
are handled by a set of objects having pre-defined roles.
The important point to note is the difference between the collaboration diagram in the
earlier version and in UML 2.0 version. To distinguish, the name of the collaboration
diagram has been changed in UML 2.0. In UML 2.0, it is named as Communication
diagram.
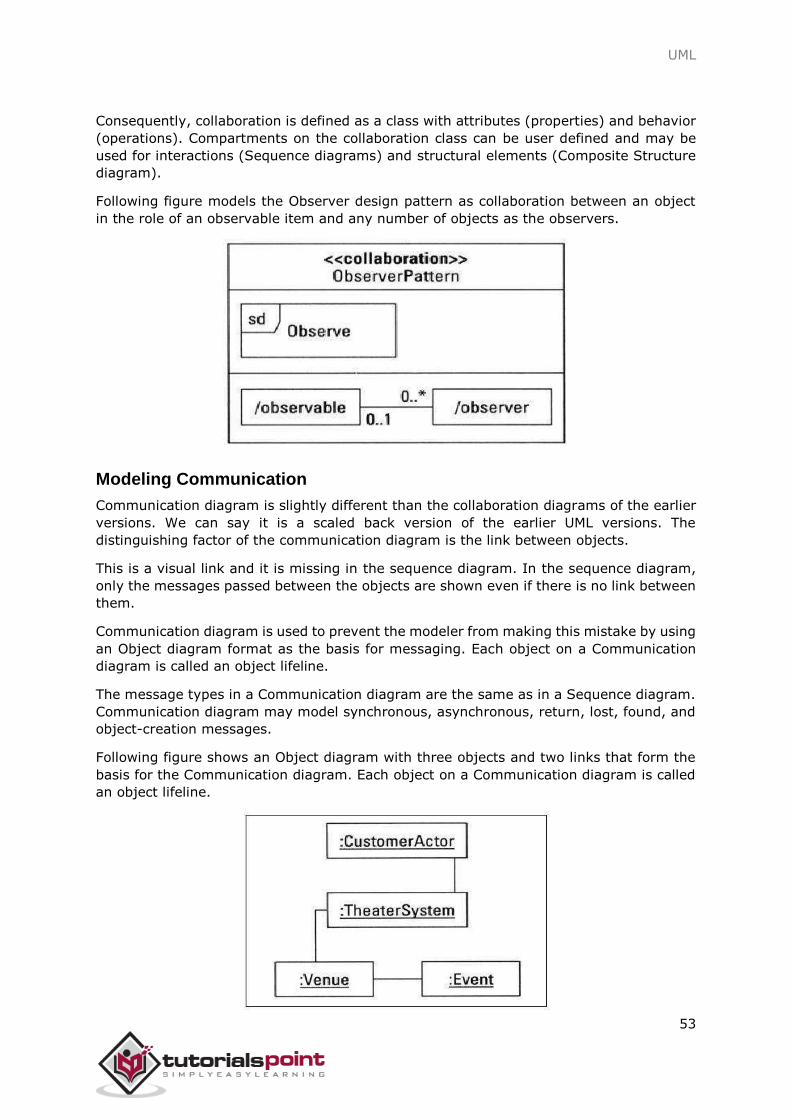
UML
53
Consequently, collaboration is defined as a class with attributes (properties) and behavior
(operations). Compartments on the collaboration class can be user defined and may be
used for interactions (Sequence diagrams) and structural elements (Composite Structure
diagram).
Following figure models the Observer design pattern as collaboration between an object
in the role of an observable item and any number of objects as the observers.
Modeling Communication
Communication diagram is slightly different than the collaboration diagrams of the earlier
versions. We can say it is a scaled back version of the earlier UML versions. The
distinguishing factor of the communication diagram is the link between objects.
This is a visual link and it is missing in the sequence diagram. In the sequence diagram,
only the messages passed between the objects are shown even if there is no link between
them.
Communication diagram is used to prevent the modeler from making this mistake by using
an Object diagram format as the basis for messaging. Each object on a Communication
diagram is called an object lifeline.
The message types in a Communication diagram are the same as in a Sequence diagram.
Communication diagram may model synchronous, asynchronous, return, lost, found, and
object-creation messages.
Following figure shows an Object diagram with three objects and two links that form the
basis for the Communication diagram. Each object on a Communication diagram is called
an object lifeline.
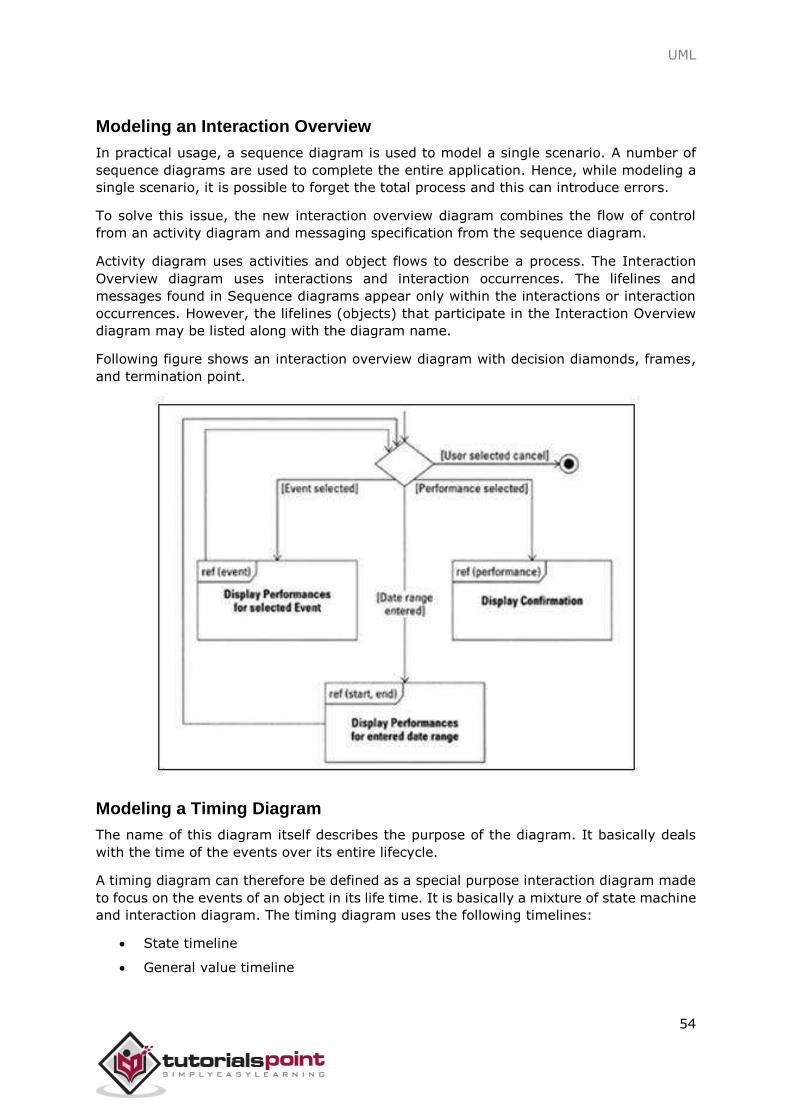
UML
54
Modeling an Interaction Overview
In practical usage, a sequence diagram is used to model a single scenario. A number of
sequence diagrams are used to complete the entire application. Hence, while modeling a
single scenario, it is possible to forget the total process and this can introduce errors.
To solve this issue, the new interaction overview diagram combines the flow of control
from an activity diagram and messaging specification from the sequence diagram.
Activity diagram uses activities and object flows to describe a process. The Interaction
Overview diagram uses interactions and interaction occurrences. The lifelines and
messages found in Sequence diagrams appear only within the interactions or interaction
occurrences. However, the lifelines (objects) that participate in the Interaction Overview
diagram may be listed along with the diagram name.
Following figure shows an interaction overview diagram with decision diamonds, frames,
and termination point.
Modeling a Timing Diagram
The name of this diagram itself describes the purpose of the diagram. It basically deals
with the time of the events over its entire lifecycle.
A timing diagram can therefore be defined as a special purpose interaction diagram made
to focus on the events of an object in its life time. It is basically a mixture of state machine
and interaction diagram. The timing diagram uses the following timelines:
State timeline
General value timeline
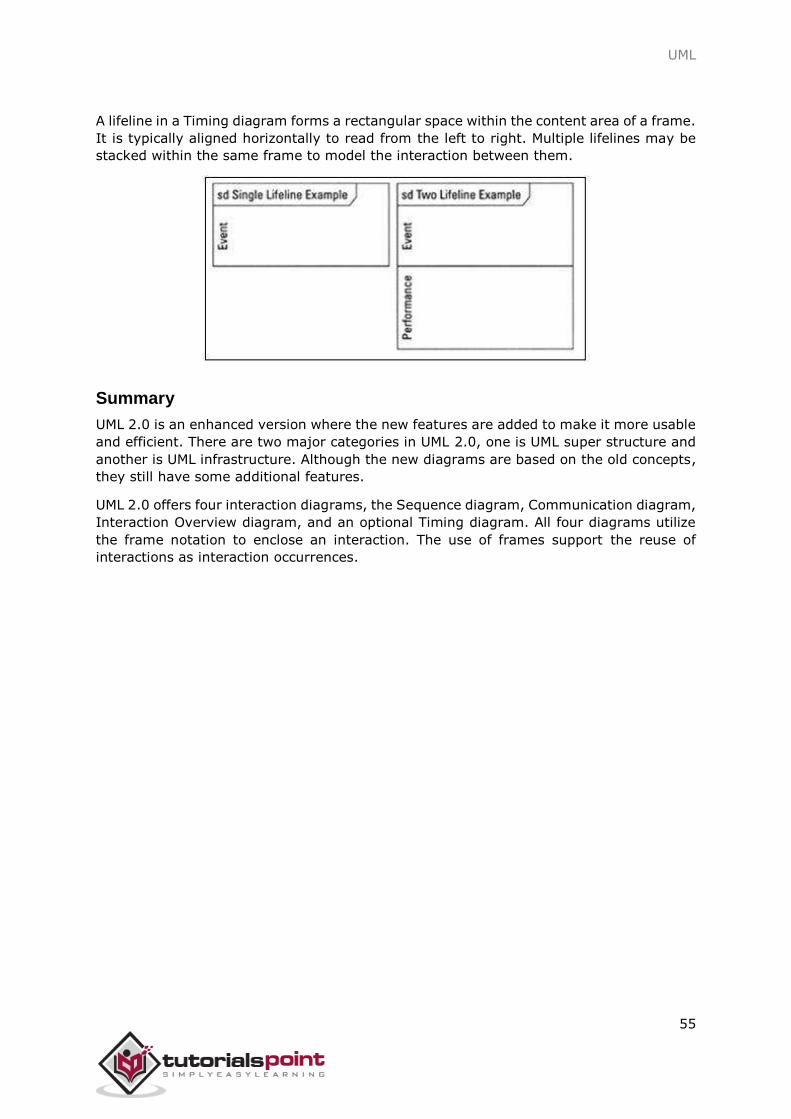
UML
55
A lifeline in a Timing diagram forms a rectangular space within the content area of a frame.
It is typically aligned horizontally to read from the left to right. Multiple lifelines may be
stacked within the same frame to model the interaction between them.
Summary
UML 2.0 is an enhanced version where the new features are added to make it more usable
and efficient. There are two major categories in UML 2.0, one is UML super structure and
another is UML infrastructure. Although the new diagrams are based on the old concepts,
they still have some additional features.
UML 2.0 offers four interaction diagrams, the Sequence diagram, Communication diagram,
Interaction Overview diagram, and an optional Timing diagram. All four diagrams utilize
the frame notation to enclose an interaction. The use of frames support the reuse of
interactions as interaction occurrences.