tw funding relief
TRANSCRIPT

7/30/2019 TW Funding relief
http://slidepdf.com/reader/full/tw-funding-relief 1/8
The Implications of Funding Relief
What Does it Mean for Asset Allocation and
Liability-Driven Investing?
7/30/2019 TW Funding relief
http://slidepdf.com/reader/full/tw-funding-relief 2/8
Funding Relie and the Impact on Asset Allocation and towerswatson.com
While the goal o the legislation was to ree up cash
or employers to spend elsewhere and increase tax
revenue by reducing the amount o tax-deductiblecontributions, a secondary impact may be a sizable
shit in asset allocation away rom liability-hedging
assets. In addition, this law, the most signicant
among multiple recent installments o unding
relie, may set a precedent that leads to a potential
reevaluation o the importance o risk when setting
pension investment policies.
MAP-21 and the Case Against LDI
Liability-driven investing (LDI) trended this past
decade in the wake o the Pension Protection Act
o 2006 (PPA) and word o potential accountingreorm. The rules governing pension plans began
to incorporate more mark-to-market concepts and
emphasize valuing liabilities at current bond yields.
nvestors, oten tasked with managing their unded
status and not simply their asset level, realized the
detrimental impact o interest rate risk and the greater
stabilization benets xed income now oered. Both
the incentive and ability to manage unded status via
iability-matched investments were on the rise. This
strategy proved ruitul as rates dropped in recent
years, since liabilities discounted by those lower rates
ncreased in value, and those who implemented an LDI
strategy saw a commensurate increase in the value o their xed-income investments.
Four years later, the introduction o MAP-21 represents
a departure rom the spirit o PPA and perhaps rom
LDI as well. While the idea behind portions o PPA
was to make liabilities move with the current yield
environment, MAP-21 accomplishes the opposite.
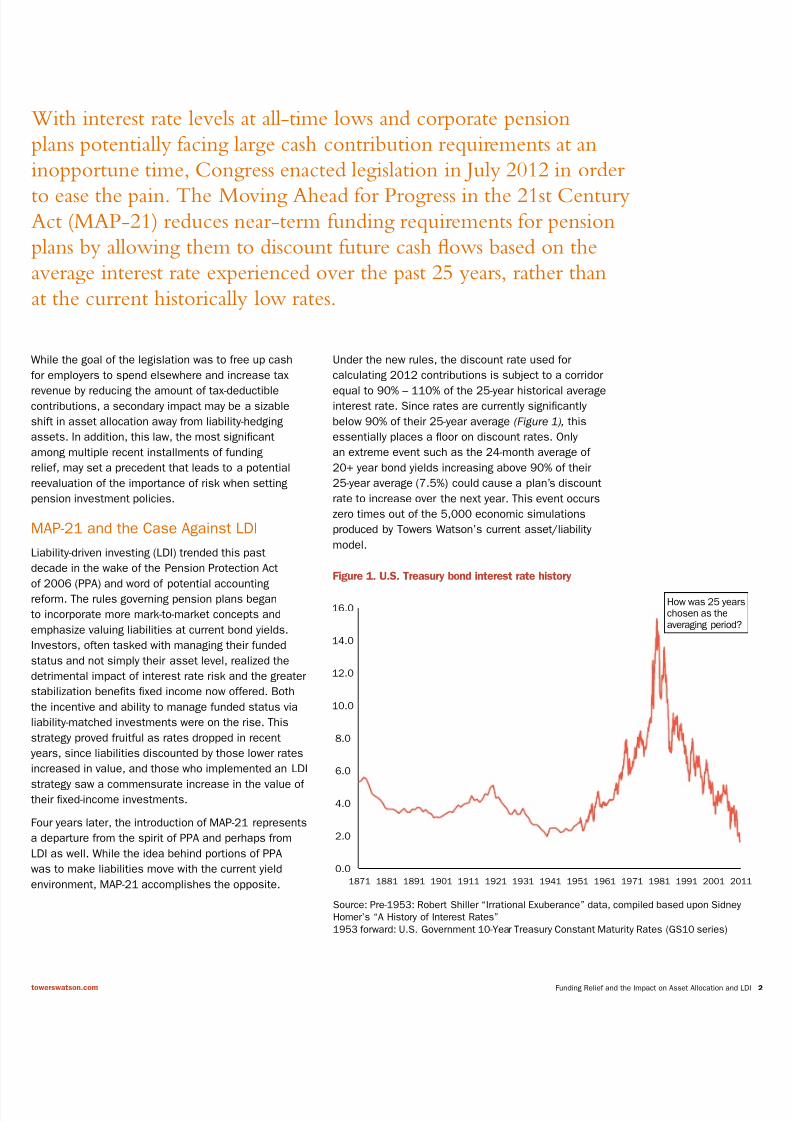
Under the new rules, the discount rate used or
calculating 2012 contributions is subject to a corridor
equal to 90% – 110% o the 25-year historical averageinterest rate. Since rates are currently signicantly
below 90% o their 25-year average (Figure 1), this
essentially places a foor on discount rates. Only
an extreme event such as the 24-month average o
20+ year bond yields increasing above 90% o their
25-year average (7.5%) could cause a plan’s discount
rate to increase over the next year. This event occurs
zero times out o the 5,000 economic simulations
produced by Towers Watson’s current asset/liability
model.
With interest rate levels at all-time lows and corporate pension
plans potentially acing large cash contribution requirements at an
inopportune time, Congress enacted legislation in July 2012 in order
to ease the pain. The Moving Ahead or Progress in the 21st CenturyAct (MAP-21) reduces near-term unding requirements or pension
plans by allowing them to discount uture cash ows based on the
average interest rate experienced over the past 25 years, rather than
at the current historically low rates.
0.0
2.0
4.0
6.0
8.0
10.0
12.0
14.0
16.0
1871 1881 1891 1901 1911 1921 1931 1941 1951 1961 1971 1981 1991 2001 201
Figure 1. U.S. Treasury bond interest rate history
How was 25 yearchosen as theaveraging period?
Source: Pre-1953: Robert Shiller “Irrational Exuberance” data, compiled based upon Sidney
Homer’s “A History of Interest Rates”
1953 forward: U.S. Government 10-Year Treasury Constant Maturity Rates (GS10 series)

7/30/2019 TW Funding relief
http://slidepdf.com/reader/full/tw-funding-relief 3/8
Funding Relie and the Impact on Asset Allocation and towerswatson.com
Further, a plan’s unding discount rate would actually
move in the opposite direction o interest rates over
the next ew years should uture rates unold in
accordance with Towers Watson Investment Ser vice’s
views.* The new law calls or the 90% – 110% corridor
to widen to 85% – 115% in 2013 (and then continue in
5% increments out to 70% – 130%). This means that
a plan’s discount rate will almost certainly decreaserom 2012 to 2013 even i interest rates rise. For
example, a 1% parallel increase in the yield curve rom
2012 to 2013 and then again rom 2013 to 2014
would still result in a plan’s unding discount rate
decreasing in both years. Not only will discount rates
over the next ew years likely be set independently
o the interest rate environment, there is actually
a strong likelihood that the two will move in
opposite directions. This disconnect is illustrated
in Figure 2, which utilizes Towers Watson’s capital
market assumptions to compare the rate used to
value a sample plan’s liability under MAP-21 versus
that under a market-value method. I the assumptionsmaterialize as demonstrated below, the decline in
the value o a plan’s long bond portolio due to rising
yields will no longer be oset by a decline in the value
o a plan’s liabilities as measured or unding.
5th − 25th percentile 25th − 50th 50th − 75th 75th − 95th
Figure 2. Effective interest rate: Market-value method
0%
1%
2%
3%
4%
5%
6%
7%
8%
9%
2012 2013 2014 2015 2016 2017 2018 2019 2020 2021 2022
Mean
5th − 25th percentile 25th − 50th 50th − 75th 75th − 95th
Effective interest rate: Post-MAP-21
0%
1%
2%
3%
4%
5%
6%
7%
8%
9%
2012 2013 2014 2015 2016 2017 2018 2019 2020 2021 2022
Mean
*Towers Watson Investment Services Global Markets Overview, July 2012
7/30/2019 TW Funding relief
http://slidepdf.com/reader/full/tw-funding-relief 4/8
Funding Relie and the Impact on Asset Allocation and towerswatson.com
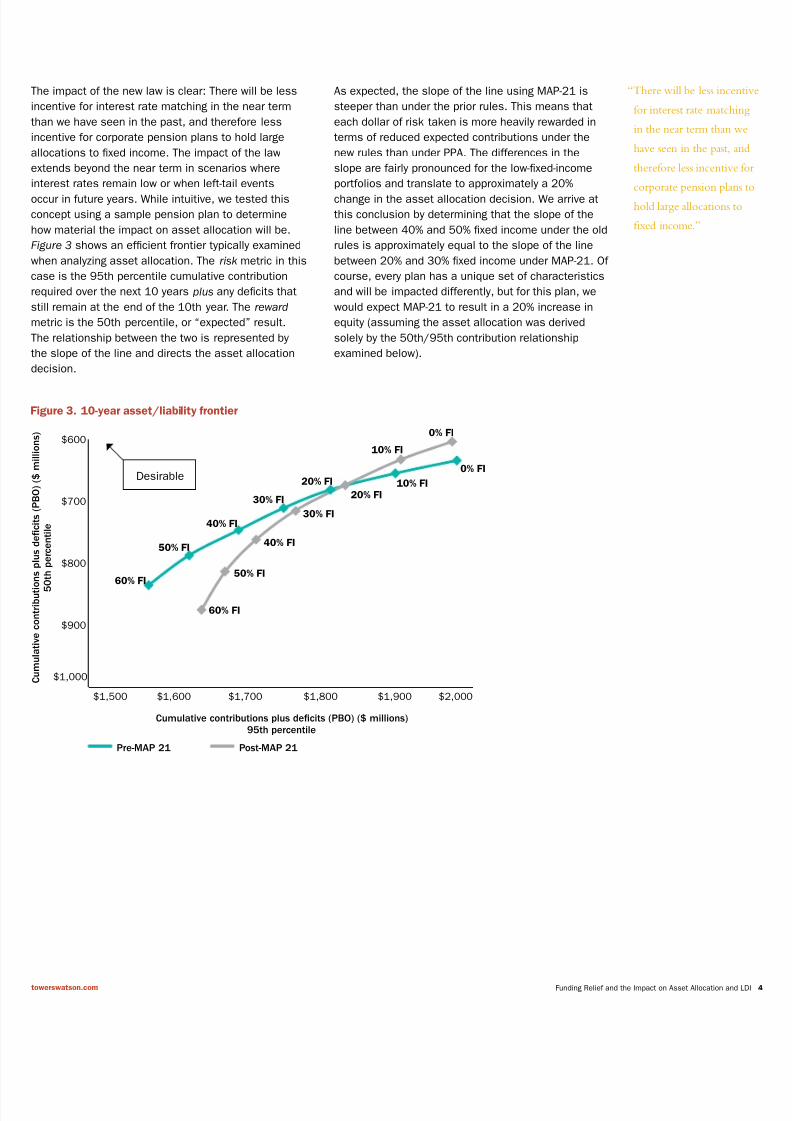
The impact o the new law is clear: There will be less
ncentive or interest rate matching in the near term
than we have seen in the past, and thereore less
ncentive or corporate pension plans to hold large
allocations to xed income. The impact o the law
extends beyond the near term in scenarios where
nterest rates remain low or when let-tail events
occur in uture years. While intuitive, we tested this
concept using a sample pension plan to determine
how material the impact on asset allocation will be.
Figure 3 shows an ecient rontier typically examined
when analyzing asset allocation. The risk metric in this
case is the 95th percentile cumulative contribution
required over the next 10 years plus any decits that
still remain at the end o the 10th year. The reward
metric is the 50th percentile, or “expected” result.
The relationship between the two is represented by
the slope o the line and directs the asset allocation
decision.
Pre-MAP 21 Post-MAP 21
Figure 3. 10-year asset/liability frontier
0% FI
10% FI20% FI
30% FI
40% FI
50% FI
60% FI
0% FI
10% FI
20% FI
30% FI
40% FI
50% FI
60% FI
$600
$700
$800
$900
$1,000
$1,500 $1,600 $1,700 $1,800 $1,900 $2,000
C u m u l a t i v e c o n t r i b u t i o n s p l u s d e c i t s ( P B O ) ( $ m i l l i o n s )
5
0 t h p e r c e n t i l e
Cumulative contributions plus decits (PBO) ($ millions)95th percentile
As expected, the slope o the line using MAP-21 is
steeper than under the prior rules. This means that
each dollar o risk taken is more heavily rewarded in
terms o reduced expected contributions under the
new rules than under PPA. The dierences in the
slope are airly pronounced or the low-xed-income
portolios and translate to approximately a 20%
change in the asset allocation decision. We arrive at
this conclusion by determining that the slope o the
line between 40% and 50% xed income under the old
rules is approximately equal to the slope o the line
between 20% and 30% xed income under MAP-21. O
course, every plan has a unique set o characteristics
and will be impacted dierently, but or this plan, we
would expect MAP-21 to result in a 20% increase in
equity (assuming the asset allocation was derived
solely by the 50th/95th contribution relationship
examined below).
“There will be less incen
or interest rate matchin
in the near term than w
have seen in the past, an
thereore less incentive
corporate pension plans
hold large allocations to
fxed income.”
Desirable
7/30/2019 TW Funding relief
http://slidepdf.com/reader/full/tw-funding-relief 5/8
Funding Relie and the Impact on Asset Allocation and towerswatson.com
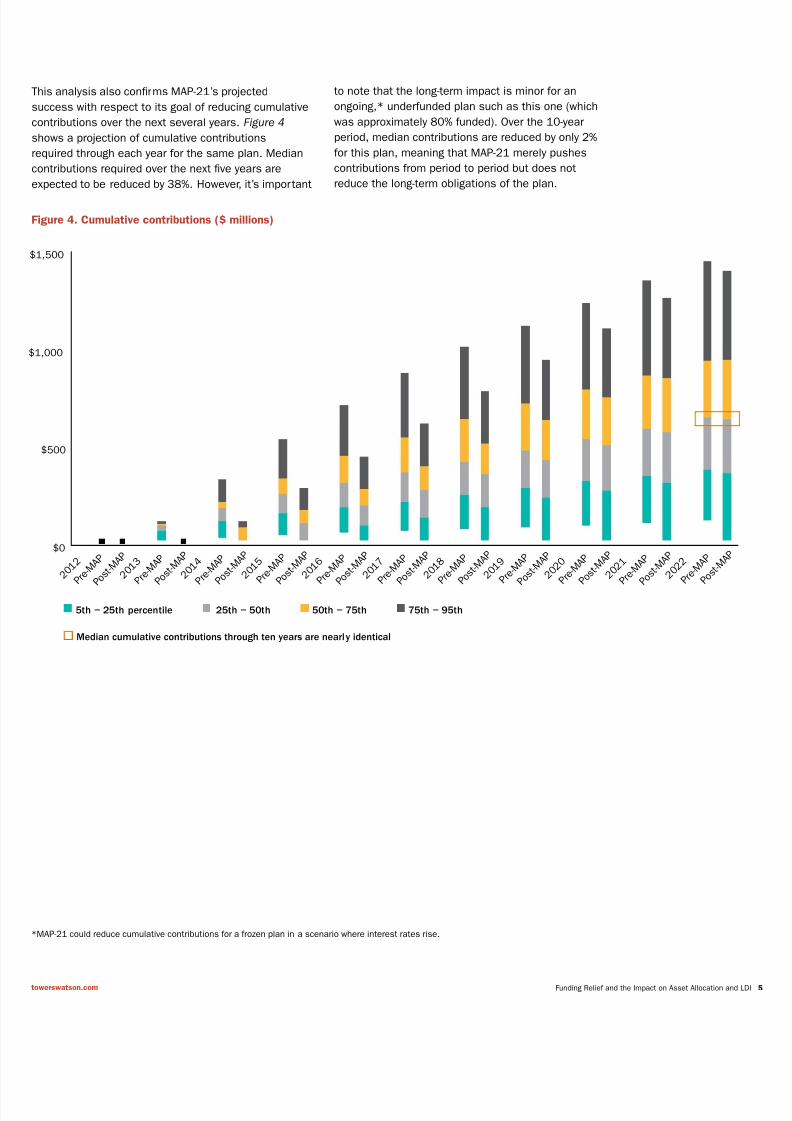
This analysis also conrms MAP-21’s projected
success with respect to its goal o reducing cumulative
contributions over the next several years. Figure 4
shows a projection o cumulative contributions
required through each year or the same plan. Median
contributions required over the next ve years are
expected to be reduced by 38%. However, it’s important
to note that the long-term impact is minor or an
ongoing,* underunded plan such as this one (which
was approximately 80% unded). Over the 10-year
period, median contributions are reduced by only 2%
or this plan, meaning that MAP-21 merely pushes
contributions rom period to period but does not
reduce the long-term obligations o the plan.
5th − 25th percentile 25th − 50th 50th − 75th 75th − 95th
Figure 4. Cumulative contributions ($ millions)
$0
$500
$1,000
$1,500
2 0 1 2
P r e - M
A P
P o s t - M A P
2 0 1 3
P r e - M
A P
P o s t - M A P
2 0 1 4
P r e - M
A P
P o s t - M A P
2 0 1 5
P r e - M
A P
P o s t - M A P
2 0 1 6
P r e - M
A P
P o s t - M A P
2 0 1 7
P r e - M
A P
P o s t - M A P
2 0 1 8
P r e - M
A P
P o s t - M A P
2 0 1 9
P r e - M
A P
P o s t - M A P
2 0 2 0
P r e - M
A P
P o s t - M A P
2 0 2 1
P r e - M
A P
P o s t - M A P
2 0 2 2
P r e - M
A P
P o s t - M A P
*MAP-21 could reduce cumulative contributions or a rozen plan in a scenario where interest rates rise.
Median cumulative contributions through ten years are nearly identical
7/30/2019 TW Funding relief
http://slidepdf.com/reader/full/tw-funding-relief 6/8
Funding Relie and the Impact on Asset Allocation and towerswatson.com
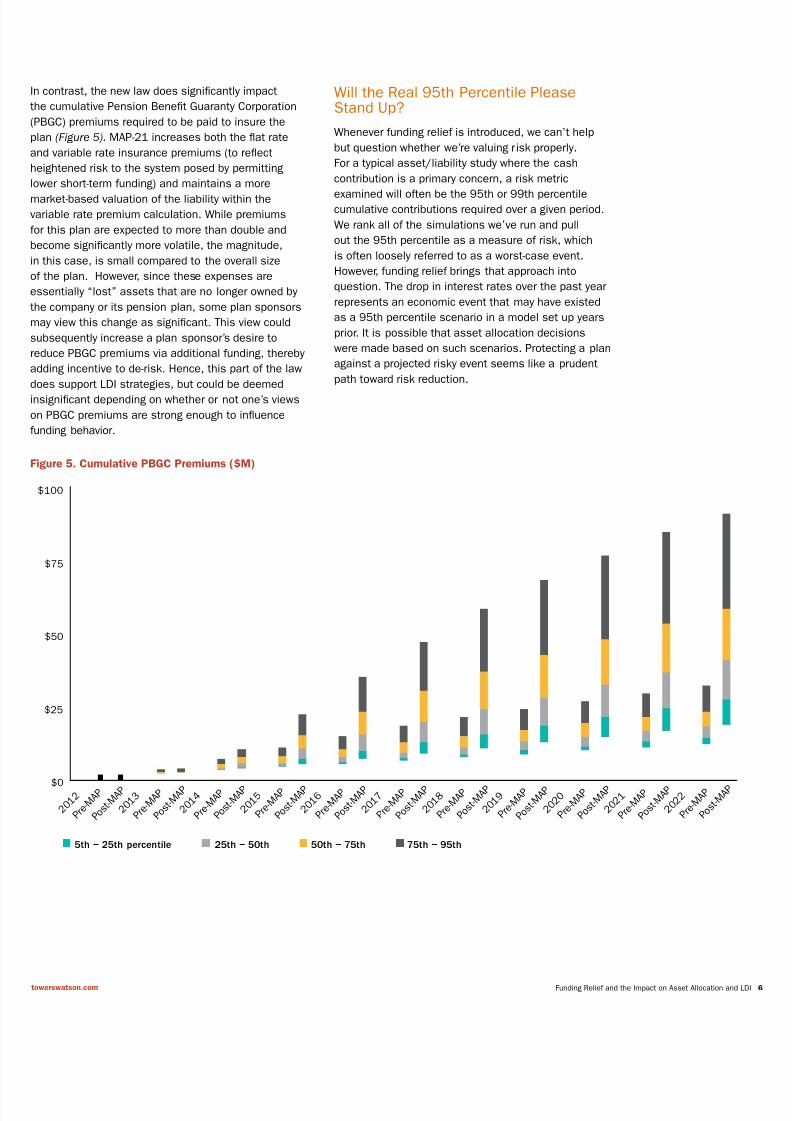
n contrast, the new law does signicantly impact
the cumulative Pension Benet Guaranty Corporation
PBGC) premiums required to be paid to insure the
plan (Figure 5). MAP-21 increases both the fat rate
and variable rate insurance premiums (to refect
heightened risk to the system posed by permitting
ower short-term unding) and maintains a more
market-based valuation o the liability within the
variable rate premium calculation. While premiums
or this plan are expected to more than double and
become signicantly more volatile, the magnitude,
n this case, is small compared to the overall size
o the plan. However, since these expenses are
essentially “lost” assets that are no longer owned by
the company or its pension plan, some plan sponsors
may view this change as signicant. This view could
subsequently increase a plan sponsor’s desire to
reduce PBGC premiums via additional unding, thereby
adding incentive to de-risk. Hence, this part o the law
does support LDI strategies, but could be deemed
nsignicant depending on whether or not one’s views
on PBGC premiums are strong enough to infuence
unding behavior.
Will the Real 95th Percentile PleaseStand Up?
Whenever unding relie is introduced, we can’t help
but question whether we’re valuing risk properly.
For a typical asset/liability study where the cash
contribution is a primary concern, a risk metric
examined will oten be the 95th or 99th percentilecumulative contributions required over a given period.
We rank all o the simulations we’ve run and pull
out the 95th percentile as a measure o risk, which
is oten loosely reerred to as a worst-case event.
However, unding relie brings that approach into
question. The drop in interest rates over the past year
represents an economic event that may have existed
as a 95th percentile scenario in a model set up years
prior. It is possible that asset allocation decisions
were made based on such scenarios. Protecting a plan
against a projected risky event seems like a prudent
path toward risk reduction.
5th − 25th percentile 25th − 50th 50th − 75th 75th − 95th
Figure 5. Cumulative PBGC Premiums ($M)
2 0 1 2
P r e - M
A P
P o s t - M A P
2 0 1 3
P r e - M
A P
P o s t - M A P
2 0 1 4
P r e - M
A P
P o s t - M A P
2 0 1 5
P r e - M
A P
P o s t - M A P
2 0 1 6
P r e - M
A P
P o s t - M A P
2 0 1 7
P r e - M
A P
P o s t - M A P
2 0 1 8
P r e - M
A P
P o s t - M A P
2 0 1 9
P r e - M
A P
P o s t - M A P
2 0 2 0
P r e - M
A P
P o s t - M A P
2 0 2 1
P r e - M
A P
P o s t - M A P
2 0 2 2
P r e - M
A P
P o s t - M A P$0
$25
$50
$75
$100

7/30/2019 TW Funding relief
http://slidepdf.com/reader/full/tw-funding-relief 7/8
Funding Relie and the Impact on Asset Allocation and towerswatson.com
But when the actual economic environment that
transpired in 2011 matched one o these worst-case
scenarios, legislation was enacted to prevent the pain
rom being as severe as indicated by our models.
The real worst-case event in this scenario wasn’t the
95th percentile result, but rather a change in law
ensuring that results did not all below, let’s say, the
75th percentile. This is not the rst example o the
government stepping in to alleviate the downside.
Following the credit crisis in 2008, PPA was amended
with the Worker, Retiree, and Employer Recovery Act
o 2008, which lowered the short-term unding target.
Further relie was oered in 2010 via the Preservation
o Access to Care or Medicare Beneciaries and
Pension Relie Act, which allowed pension plans to
extend the amortization period or ununded liabilities.
While MAP-21 is dierent rom these rounds o relie
because it is permanent and could eventually impact
the upside as well as the downside, this third post-
credit-crisis amendment to PPA raises a question:Should we be ignoring the governmental saety net that
has consistently been implemented in tough times?
the answer is no, this would again point pension
plan investors toward taking more risk. I the upside
o equity risk is always attainable but the downside is
potentially avoidable due to legislative intervention, the
ncentive or xed income is not as strong as indicated
n our models. I there is an unspoken foor at the 75th
percentile, it is possible that risk/reward trade-os
are not currently being analyzed properly. The more
prevalent unding relie becomes, the more likely it
could be viewed as a risk management alternative to
xed income.
Economic Liability and the Case AgainstRDI
Despite these two anti-LDI arguments, we eel the
role o xed income in pension plans should never
change when considering the true economic liability
o a plan. The discussion above ocuses solely on
the contribution rules dictated by the IRS (“rules-
driven investing”). I, instead, we consider that a
plan’s undamental responsibility is to ully pay or
ts obligations regardless o the rules governing its
unding, a change in law would not impact assetallocation behavior.
A duciary is responsible or the series o payments
promised. In determining the total amount needed in
today’s dollars that would und those promises, the
conservative (and responsible, in our view) method
inorming pension asset allocation would be to
discount the payments at a rate we were airly certain
to earn (i.e., current bond yields). Investors relying on
these principles would always value LDI regardless o
the rules surrounding cash contributions.
Conclusion
Liability-matching strategies are valuable when takingan economic approach to liability valuation. However,
investors who allow contribution risk to drive their
decisions may be apt to take on more return-seeking
assets with the recent passing o MAP-21. The new
law lessens the current eectiveness o LDI strategies
with respect to contributions and also brings into
question the importance o risk reduction in a system
where relie laws requently bail us out in hard times.
Further inormation
I you would like to discuss any o the areas covered in
more detail, please contact your local Towers Watsonconsultant or:
Adam Levine
+1 212 309 3813
“Despite these two anti-LDI arguments, we
eel the role o fxed income in pension plans
should never change when considering the
true economic liability o a plan.”
7/30/2019 TW Funding relief
http://slidepdf.com/reader/full/tw-funding-relief 8/8
Copyright © 2012 Towers Watson. All rights reserved.
TW-NA-2012-27708
towerswatson.com
About Towers WatsonTowers Watson is a leading global proessional services
company that helps organizations improve perormance through
eective people, risk and nancial management. With 14,000
associates around the world, we oer solutions in the areas
o employee benets, talent management, rewards, and risk and
capital management.
Please note: This document was prepared or
general inormation purposes only and should not be
considered a substitute or specifc proessional advice.
n particular, its contents are not intended by Towers
Watson to be construed as the provision o investment,
egal, accounting, tax or other proessional advice or
recommendations o any kind, or to orm the basis o
any decision to do or to rerain rom doing anything.
As such, this document should not be relied upon or
nvestment or other fnancial decisions, and no such
decisions should be made on the basis o its contents
without seeking specifc advice. This document is
based on inormation available to Towers Watson at
the date o issue, and takes no account o subsequent
developments ater that date.
In addition, past perormance is not indicative o uture
results. This document may not be reproduced or
distributed to any other party, whether in whole or in
part, without Towers Watson’s prior written permission,
except as may be required by law. In the absence o
its express written permission to the contrary, Towers
Watson and its afliates and their respective directors,
ofcers and employees accept no responsibility and will
not be liable or any consequences howsoever arising
rom any use o or reliance on the contents o this
document including any opinions expressed herein.