two micron tm doped zblan double clad fibre laser...monro, “extruded fluoride fiber for 2.3μm...
TRANSCRIPT

1
Two Micron Tm Doped ZBLAN Double
Clad Fibre Laser
By
Md. Samiul Islam Sarker
Supervisors: Prof. Tanya M. Monro
Associate Prof. David G Lancaster
A thesis submitted in fulfillment of the degree of Master of Science
In the subject of
Experimental Physics
In the Faculty of Sciences School of Chemistry & Physics
July 2011

2
Declaration of Authorship I, Md. Samiul Islam Sarker certify that this work contains no material which has been
accepted for the award of any other degree or diploma in any other university or other
tertiary institution and, to the best of my knowledge and belief contains no material
previously published or written by another person, except where due reference has been
made in the text.
I give consent to this copy of my thesis when deposited in the university library, being
made available for loan and photocopying subject to the provision of the Copyright Act
1968.
I also give permission for the digital version of my thesis to be made available on the
web, via the University‟s digital research repository, the Library catalogue and also
through web search engines, unless permission has been granted by the University to
restrict access for a period of time.

3
To My Parents

4
Abstract
Tm:ZBLAN fibre lasers have potential applications in many research areas, such as eye
safe range detection, medical science and materials processing. In this thesis we
investigate improving the laser performance of a thulium doped fluoride fibre
(specifically ZBLAN) to generate laser output with wavelengths near 2 µm. Two
approaches are demonstrated to investigate laser performance at 2 µm. One is 790 nm
pumping in which the cross-relaxation mechanism is used for efficient operation by
populating the upper laser level. Another is in-band pumping, where 1570 nm light is
directly pumps the emitting laser level, reducing the quantum defect between the pump
and lasing wavelengths, reducing the threshold and increasing the efficiency of the fibre
laser. Tm:ZBLAN fibres fabricated in-house, we also characterized with the aim of
processing towards the development of new classes of fibre laser.
A Tm:ZBLAN double clad fibre laser operating at 1.96 µm is demonstrated with a 1.53
W maximum output power and slope efficiency of 45% with respect to the launch pump
power. Thereafter, the laser performance is analysed using cavity mirrors of various
reflectivities.
A laser with an operating wavelength of 1.57 µm is demonstrated with 1 watt output
power using an Er:Yb co-doped double clad fibre. The slope efficiency of this laser is
measured to be 28.3% with respect to the diode pump power, with a measured beam
quality (M2) of 1.3. This 1.57 µm in-band pump source is then used to pump the 2 µm
Tm:ZBLAN fibre laser.
In addition to the laser development, this thesis also analyses the pump absorption for
different shaped double clad fibres numerically. Understanding of pump absorption is
required to develop an efficient double clad fibre laser. The pump absorption is
measured using cut-back method and compared with the modeled results.
5
Motivation and Thesis Outline
Thulium doped fibre lasers at 2 µm can be developed either using Tm:Silica or
Tm:ZBLAN fibre. There have also been 2 µm lasers in other materials including
tellurite [29]. The higher phonon energy of Tm:Silica ~1000 cm-1 limits the infrared
transmission up to 2.2 µm. On the other hand ZBLAN is a heavy metal fluoride glass
that offers a mid-infrared transparency out to 6 µm due its lower phonon energy of
~500 cm-1. Singly charged fluoride ion and weaker bond strength of ZBLAN glass leads
to greater mid-infrared transparency. Lower phonon energy and lower background loss
around 2 µm of thulium fluoride fibre makes it is a suitable host material for an
efficient operation of fibre laser at around 2 µm.
ZBLAN is therefore a promising glass material for the development of fibre lasers at 2
µm and in other infrared wavelengths. A thulium ion is chosen as a rare earth dopant
due to the fact that, when using high thulium concentrations, cross-relaxation processes
lead to highly efficient lasing at around 2 µm. As a result, Tm:ZBLAN fibre is
considered for the development of the 2 µm laser in this research.
In band pumping approach is focused in this thesis due to the fact that laser
active ions are pumped directly to the upper laser level from ground state. Using in-
band pumping it is therefore possible to improve slope efficiency and threshold pump
power by reducing quantum defects. To date the highest output power reported for a
Tm:ZBLAN fibre laser at ~2 µm is only 53 mW [4], using in-band pumping, but had
record slope efficiency of 74%. This low output power was believed to due to the
unavailability of ~1.6 µm pump sources with sufficient power. It is now possible to
develop a ~1.6 µm source with very good beam quality by using commercial
components. Good beam quality source offers the potential to pump directly into the
core of a Tm:ZBLAN double clad fibre and develop higher output powers at ~ 2 µm
than before. The content of this thesis are:
Chapter 1: Chapter 1 contains a general overview of fibre lasers. The
importance of thulium fibre laser operating around 2 µm and their applications. The
importance of in-band pumping for the development of 2 µm Tm:ZBLAN fibre laser as
well as review for the development of ~1.6 µm Er:Yb sources for in-band pumping are
also summarised. In addition to the literature review, the author provides his own
insights and deeper explanation of these systems.

6
Chapter 2: The introduction of this Chapter describes the motivation for
conducting the pump absorption calculation of a double clad fibre. The result of the
simulation for different outer cladding shapes of Tm:ZBLAN double clad fibre are
provided along with impact of offsetting core and varying the core diameter. Apart from
this a pump absorption measurement of Tm:ZBLAN double clad fibre using cut-back
technique is compared to the modeled result.
Chapter 3: This chapter comprises three sections. The first section is about the
experimental demonstration of ~2 µm 790 nm pumping Tm:ZBLAN fibre laser, results
and discussions. It also includes the characterization of homemade Tm:ZBLAN double
clad fibre. Second section is about the development of Er:Yb in-band pump source at
1.57 µm, where high reflective Fibre Bragg grating (FBG) and 4% Fresnel reflection
formed the resonator cavity including a critical discussion. The third section represents
the in-band pumping approach i.e. towards the development of an in-band pumped
Tm:ZBLAN fibre laser.
Chapter 4: This chapter concludes the thesis with a general discussion and a
description of possible promising future work.

7
List of Publications
Conference paper
H. Ebendorff-Heidepriem, D.G. Lancaster, K. Kuan, R.C. Moore, M.S.I. Sarker, T.M.
Monro, “Extruded fluoride fiber for 2.3μm laser application”, accepted for oral
presentation at CLEO PACRIM, 2011.

8
Acknowledgements
I would like to express gratitude from the very core of my heart to my supervisor Prof.
Tanya Monro for giving opportunity to perform this research in a world class research
environment. Her direction and guidance helps me to learn many things which were
very essential for me. This research would not be possible to finish without her constant
support and co-operation.
I also want to express my cordial gratitude to my co supervisor Associate Prof. David
G. Lancaster. I discussed about many valuable things with him and got ideas to perform
the experiment.
I would also like to thank to the rest of Institute for Photonics & Advanced Sensing
(IPAS) people specially Heike Ebendorff-Heidepriem, Ori Henderson-Sapir, Michael
Oermann, Richard White, Matt Henderson, H. Tilanka Munasinghe, Krishtopher
Rowland, Sebastian Ng, and Chris Kalnins. They helped me in different ways and I am
really grateful to them all.
I would like to acknowledge Dr. Ioannis Dritas, School of Engineering & Mathematical
Science, City University London, who provide me the simulation code for calculation
of pump absorption of a double clad fibre. I am very grateful to him for his kind
cooperation.
Thanks also Dr Selim Mahbub for his support during the time I stayed in Adelaide.
Finally but most importantly, I would like to thank my wife Saki Farhana Noor for her
support, encouragement and willingly offered sacrifice during the time I spent in
Adelaide.

9
Contents
Declaration of Authorship 2
Abstract 4
Motivation and Thesis Outline 5
List of publications 7
Acknowledgements 8
Table of Contents 9
List of Figures 12
List of Tables 15
Chapter1. Literature Review
1.1 Introduction……………………………………………………………….. 16
1.2 Fibre Lasers.................................................................................................. 17
1.3 2 µm Lasers.................................................................................................. 18
1.3.1 Application of Tm Fibre Lasers........................................................ 19
1.4 Limitation of Core Pumping Scheme for Fibre Laser Development........... 21
1.5 Cladding Pumping Fibre Laser…………………………………………… 22
1.6 Fibre Laser Characteristics………………………...................................... 24
1.7 Laser Host Material...................................................................................... 25
1.8 Two Micron Tm Doped Fibre Lasers...……………................................... 27
1.9 Laser Resonator Types of Tm3+ Doped Fibre............................................ 30
1.10 Quasi Four Level Lasers.............................................................................. 31
1.11 Tm-Tm Energy Transfer Process………………......................................... 33
1.12 Tm:ZBLAN and Tm:Silica Fibre Laser at 2 µm….................................... 34
1.13 In-band Pumping Tm Fibre Laser……………............................................ 39
1.14 Review for the Development of ~1.6 µm Laser Source for In-band Pumping.......................................................................................................
41
1.15 Summary......................................................................................................
44
10
Chapter 2. Double Clad Fibre: Comparison of Predicted
and Measured Pump Absorption
2.1 Introduction and Aim...........……………………………………………… 45
2.2 Review of Pump Absorption Calculation for Double Clad Fibre….……. 46
2.3 Boundary Condition for Pump Absorption Calculation…….........……..... 47
2.4 Launched Pump Initial Condition………………………………………… 48
2.4.1 Optimum Container Number Convergence Test...…………........... 51
2.5 Theory of Pump Absorption....................…………...........…….................. 53
2.6 Simulation Results………………………………………………............... 54
2.6.1 Quantification of Pump Absorption by Offsetting the Core……... 57
2.6.2 Quantification of Pump Absorption for Increasing the Core
Diametre………………………………………………………………….....
59
2.7 Summary…………………………………………………………………... 62
2.8 Experimental Measurement of Pump Absorption of a Tm:ZBLAN
Double Clad Fibre
2.8.1 Cut-back Experiment……………………………………………………... 63
2.9 Comparison of Pump Absorption Between Model and Experiment……… 65
2.10 Conclusion………………………………………………………………… 68
Chapter 3. Development of 2 µm Tm:ZBLAN Fibre Laser
3.1.1 Introduction and Motivation……………………………………………… 69
3.1.2 Experimental Setup……………………………………………………….. 69
3.1.3 Results and Discussion…………………………………………….. 71
3.1.4 Summary…………………………………………………………… 77
3.1.5 In-house Double Clad Tm:ZBLAN Fibre Fabrication and
Characterisation
3.1.5.1 Fibre Fabrication…......................................................................... 78
3.1.5.2 Numerical Aperture (NA) Measuring principle………………… 78
3.1.5.3 Experimental Measurement……..................................................... 79
3.1.5.4 Cut-back Measurement.................................................................... 83
3.1.5.5 Summary........................................................................................ 84
3.2 Development of Er:Yb Fibre Laser at 1570 nm
3.2.1 Introduction and Aim................................................................................... 85
11
3.2.2 Er:Yb Absorption Calculation at 980 nm.................................................... 85
3.2.3 FBG Transmission Measurement...……………………………………...... 86
3.2.4 Experimental Setup to Develop 1.57 µm Fibre Laser…..……………….... 88
3.2.5 Results and Discussions……………………………………………. 90
3.2.6 Beam Quality Measurement…………………………….................. 93
3.2.7 Summary…………………………………………………………… 95
3.3 Development of 2 µm Tm:ZBLAN Fibre Laser Using 1570
nm Source
3.3.1 Introduction……………………………………………………………..… 97
3.3.2 Absorption Calcualtion at 1570 nm……………………………………..… 97
3.3.3 Experimental setup.………………………..……………………………… 98
3.3.4 Discussion…………………………………………………………………. 99
3.3.4.1 Knife Edge Spot Size Measurements…………………………...… 100
3.3.4.2 Cut-back Measurement and Discussion…………………………. 102
3.3.5 Summary…………………………………………………………………... 105
3.4 Conclusion………………………………………………………………… 105
Chapter 4. Conclusion and Future Work........................................... 107
Appendix Model Verification and Diode Characterisation…………………... 109
Bibliography………………………………………………………………….. 114

Amendment of thesis
This document provides the answer on comments of referee 1 and referee 2.
Answer on comments of referee 1
Chapter 1
Section 1.3
The near-IR spectral region, i.e. from 1.4 to 1.8 μm is called eye safe region, where
optical absorption by water in the eye prevents power from reaching to the retina.
For cross relaxation and resonant pumping process reference diagram has given.
Energy level diagram for resonant pumping process has moved earlier in the chapter.
Section 1.3.1
Suitable plot for tuning range of Tm fibre laser has been added.
Reference has given to the 1st sentence of last paragraph.
Section 1.5
Figure 1.4 (b) is fixed as a rectangular inner cladding.
Section 1.6
Corrected sentence is: Single mode guidance can be done either by increasing the core
diameter or by decreasing the numerical aperture (NA) at a certain V value.
Corrected sentence is: For a multimode fibre the intensity distribution function often
approximated as a top-hat function of radius a, with uniform intensity distribution
along the core of the fibre.
Section 1.8
Energy level diagrams have given to the first paragraph.
In 1998, when diode pump power began to available, a 5.4 W output power was
achieved from a double clad fibre laser at wavelength near 2 μm.
References added to the last sentence.
Section 1.9
Dichroic mirror act as an input coupler for pump light in Fig 1.7(a).
Section 1.11
Corrected sentence is: The energy transfers for laser materials are mainly through
radiative and nonradiative process. In case of radiative energy transfer process, the
emission of photon by one ion causes the absorption of that photon by another ion.
Section 1.12
Corrected sentence is: The short-infrared wavelength range effectively covered by
Tm3+ doped lasers can pump directly with ~800 nm diodes.
Moreover, it also observed from Figure 1.11 and 1.12 that the absorption wavelength
range spanning from ~1550 nm to ~1850 nm, which is near to laser emitting
wavelength at ~ 2 μm.
Corrected sentence is: A smaller efficiency of the cross relaxation process has the
effect of raising the laser threshold
The 3F4 lifetime is shortened through multiphonon decay. This shortening the life time
of the 3F4 manifold due to multiphonon decay will reduce the 3F4→3H6 quantum
efficiency. The lower quantum efficiency would reduce the slope efficiency.
Section 1.14
Corrected sentence is: The effective absorption coefficient for pump light launched
into the cladding of Er:Yb fibre as a function of pump wavelength is shown in Figure
1.18. In this case the core diameter of an Er:Yb fibre was 30 μm having numerical
aperture 0.22 and the core was surrounded by a pure silica D-shaped inner-cladding of
400 μm diameter (~360 μm along the short axis) and the numerical aperture was 0.4.
The doping concentration to the core of Er:Yb fibre was respectively Yb3+ ion
(~8.7х1020 cm-3) and Er3+ ion (~5.1х1019 cm-3).

Chapter 2
Section 2.1
The first paragraph has deleted as it was repetition of material in Chapter 1.
For consistency “outer core” replaced as “inner cladding” in everywhere.
Corrected sentence is: For small inner cladding area, fibre losses are reduced at laser
wavelength due to the reduction of absorption length.
Corrected sentence is: The core area and numerical aperture should be high enough to
allow a high absorption efficiency of pump power in the single mode core as well as
be able to excite single mode oscillation at laser wavelength.
Section 2.2
Corrected sentence is: A beam propagation method (BPM) can be approximated by
the effective index method to reduce a 3D problem to a 2D one, and still it suffers
from the need to discretize paraxial wave equation throughout dense grids over
realistic propagation distances, especially when large and complex geometries are
involved.
Corrected sentence is: They have demonstrated that the absorption is influenced by
the bend radius for circular fibre, but in fibre design with offset core and rectangular
inner cladding the bend effect is negligible.
Section 2.3 (model verification) now in Appendix
Model verification has moved to appendix (as with other referee comments). In model
verification 1000 container used.
Corrected sentence is: Pump absorption for circular shape becomes saturated with
increasing fibre length due to the non absorption of skew rays.
Figure 2.1 now becomes Figure A1: the caption changed to square shape
Section 2.4 is now 2.3
Corrected sentence is: The interface between inner and outer cladding is an ideal
surface, has no reflective aberration and uniform step refractive index distribution.
Under these conditions the propagated rays in model strictly follow the geometrical

optics domain. Regarding the geometrical boundary condition, it is also assumed that
there are no losses when a pump ray is scattered by a dielectric interface and that
during total internal reflection the refracted energy is negligible compare to the
reflected energy when refraction takes place [92]. Moreover, it is assumed that all
rays propagate in the fibres are independent of each other and have no mode coupling.
Section 2.4.1 now 2.4
Corrected sentence is: The incident points i.e. the spot centre of incident pump
photons are generated on to equally distant co eccentric circumferences (see Figure
2.1) which are centred on the fibre axis and cover a circular area defined by the pump
delivering core.
Corrected sentence is: The incident points are shown Figure 2.1(previously it was
Figure 2.2) as blue star marks at the input end of the fibe.
Figure 2.3 now becomes 2.2 and axes labels have fixed.
Figure 2.3 caption also changed to become understandable.
Section 2.5
ρ is density of ions and recalculated after each time step.
Model verification part transferred to the Appendix section.
Section 2.6
Concentration is fixed as 20000 ppm by weight.
Figure 2.5 is now as 2.4 and explanation as follows:
It is observed in Figure 2.4 (a), that the magnitude of core optical path for circular
inner cladding is levelled around 0.6 mm, also shows the wider groups of bars and
bigger valleys observed in the patterns of optical paths when it compared to Figure
2.4(b). This pattern supports that for circular inner cladding there is a strong overlap
between core volume and meridional rays. On the other hand in figure 2.4 (b) the
magnitude of core optical path in square shape cross-section is levelled at around 0.5
mm and more noisy bar groups emerging above the base line. Therefore, the
propagation of skew rays contributes more strongly in parallelogram shape.
Moreover, in case of circular inner cladding, it is observed in Figure 2.4(a) that longer
ray paths are recorded inside the core containers, they correspond mainly to a small
population of meridional lines which become completely absorbed during the first few
tens of centimetres. In case of square inner cladding Figure 2.4(b), the total ray spatial
paths are generally shorter inside each container but they represent the contribution of
a larger population of rays more sporadically interacting with the core volume and
thus being able to transfer their energy along longer propagation lengths.
Chaotically propagated rays changes to skew rays.
For circular shape, the pump absorption tends to saturation along with the increasing
of length. At the beginning the absorption increases with length sharply. After a
certain distance the increasing becomes smaller and smaller due to the non-absorbtion
of skew rays to the core of a fibre.
Section 2.6.2
Figure 2.8(d) now as 2.7(d): The horizontal axis as well as legend has been fixed.
Section 2.7
“In conclusion” changes to appropriate word.
Corrected sentence is: The presence of higher order modes lead to degradation in the
output beam quality, but most of the application requires diffraction limited beam
quality.
Section 2.8.1 is now as A2 in Appendix
“100 μm” is a core diameter of a fibre
In Figure A2 the units of efficiency η corrected as W/A
Table is deleted according to other referee comments and also standard deviation is
omitted from the graph as the fluctuations are mostly due to a drift rather than
normally distributed random fluctuations
Section 2.8.2 is now 2.8.1
The pump light coupled from the patch fibre to Tm:ZBLAN fibre using the optical
system in section A2.

Corrected sentence is: The cleaving ends have been tested every time by placing fibre
ends under microscope throughout the experiment to ensure the nice cleaving end.
Pp(Zo) is defined for A(Zi) as: Pp(Zo) is pump power measured for smallest fibre
length Zo, very close to the input end of the fibre.
Corrected sentence is: In an optically active fibre the pump wave absorption rate at a
certain point depends on the local population inversion and consequently on the local
flurescence. However, to avoid the flurescence effect, the launched power should be
kept resonably low so that the population inversion remains negligible.
The label on vertical axis of Figure 2.12 is now 2.9 changes to 10log10(P).
Section 2.9
Absorption efficiency is calculated as follows:
Firstly, cutback data is fitted and extrapolated to zero length of a fibre, which gives
the launch pump power at input end. Therefore, with the help of launch pump input
and the transmitted output for every cutback length, absorption efficiency is
calculated.
Further explanation of model calculation differ from experimental valuesas follows:
There might be two other possibilities to differ experimental result from model
calculation. Firstly in model calculation effect of fibre bending was not considered for
pump absorption calculation. Secondly for cut-back measurement we measured
absorption at 10 metre and below 1 metre length only. For more accuracy of
measurement it could be performed the cut back experiment repeatedly througout the
whole length of fibre. But we had limited length of commercial fibre and also needed
to perform fibre laser experiment.
Chapter 3
Section 3.1.2
As it is evident from the microscopic view of the end facet of the fibre that the fibre is
5 μm offset. Considering that we used pump absorption 0.76 dB/m (measured for 10
m length of fibre) to calculate the pump absorption for 5 m fibre.
Explanation for launch efficiency measurement: After collimating and focusing, 790
nm light has been coupled to Tm:ZBLAN fibre and optimised for maximum coupling.
After optimisation output power is recorded. Therefore the launch efficiency to the
fibre was calculated by measuring the difference of input power and transmitted
output power with power absorbed to the fibre, which is 92%. It is noted that
absorbed power is calculated by using cut-back absorption.
Output coupler having 0% reflectivity at 2000 nm butted to the output end of fibre to
examine fibre laser spectrum at ~2 μm laser. It is noted that we didn’t used any index
matching gel to mitigate against Fresnel reflection.
Section 3.1.3
Figures are rearranged
The figure 3.2 (a) for 0% reflective output coupler. The data showed in table 3.2 but
all the data tables have been deleted according to other referee comments.
Resonator layout has explained.
In initial configuration 4% Fresnel reflection used to form the resonator. For 0%
reflective output coupler, mirror butted to the output end.
Here forward direction refers to the increment of input power from zero to maximum
value used in this experiment and backward direction refers to the decrement of input
power started from forward directions maximum value.
Corrected sentence is: Further scaling the output is possible by increasing the launch
pump power as well as by maintaining proper cooling system to protect from thermal
damage of the fibre.
Section 3.1.5.1 is now 3.1.5.2
Fibre fabrication section is now as 3.1.5.1
To increase the core refractive index of ZBLAN fibre part of BaF2 replaced with the
PbF2.
Section 3.1.5.2 is now 3.1.5.3
The variation of NA values might be due the defect of interface between core and
cladding.
Assuming a refractive index of Tm:ZBLAN glass 1.495 at 790 nm, the core refractive
index is 1.4954 ± 0.0001,
∆𝑛, the index difference between core and cladding is 0.0004 ± 0.0001.
Section 3.1.5.3 is now 3.1.5.1
Section 3.1.5.5
To reduce the loss of the fibre the outer and inner surface of the tube should be etched
prior to fibre drawing to achieve a pristine surface. A defect free interface between the
core and cladding glass is prerequisite to achieve low fibre loss. Therefore future
work will focus on further reducing the fibre loss through optimization of fibre
drawing conditions and demonstration of lasing at 2.3 μm.
Section 3.2.5 is now 3.2.4
Corrected sentence is: By pressing the fusion button fibre becomes spliced and the
splicing loss was observed 0.02 dB in Ericsson splicer.
A pump mirror which has HR (900-990 nm) >99.9% and HT (1500-1650 nm) >98%
butted to the rear side of the fibre to separate the lasing signal from pump laser
wavelength.
Section 3.2.6 is now 3.2.5
Corrected sentence is: To verify the accuracy of measurement of a monochromator it
was calibrated for 2nd order wavelength using HeNe source.
Table 3.8 has deleted according to other referee comment.
The length of the fibre was 3.85 m for 1570 nm laser output.
Section 3.2.7 is now 3.2.6
“xx” software changes to LabVIEW software.

Section 3.2.8 is now 3.2.7
For core pumping approach absorption coefficient is very high. Therefore relatively
short length of fibre can be used to form the fibre resonator. That’s why we chose
double clad fibre in our case.
Section 3.3.1
Reference has given for 2nd sentence of 2nd paragraph.
Laser reported by [63] now becomes [2] was single mode.
Section 3.3.2
First the absorption is calculated at 1570 nm from absorption spectra (chapter 1 Fig.
1.11) of a Tm doped ZBLAN glass. As the graph was given absorption (cm-1) as a
function wavelength, so the absorption (cm-1) at 1570 nm was calculated by deducing
the value from base line to 1570 nm. Therefore, the absorption coefficient at 1570 nm
becomes 0.03 cm-1 and the corresponding absorption is 0.13 dB/cm. The data in Table
3.10 was calculated using Beer Lamberts law(data is deleted now).
Section 3.3.3
Initially 1570 nm light is collimated and focused using 18.4 mm and 15.29 mm
aspheric lenses to coupled the light to the core of a Tm:ZBLAN fibre . As the light
was not coupled to the core, therefore 4.5 and 4.51 mm aspheric lenses used to
collimate and focus the light to the core of a Tm:ZBLAN fibre.
The length of fibre 30cm chosen and the absorption at 1570 nm is 60.84% as evident
from figure 3.19.
Section 3.3.4.1
Schematic figure is added to understand the knife edge measurement. 15.29 mm lens
was the same as used in section 3.3.3
Corrected sentence is: the beam cut into micron distance along the x direction as
shown in figure 3.21
The number of significant figures in the spot size in Figure 3.22(a) has changed.
The explanation for overfilling the beam as follows:
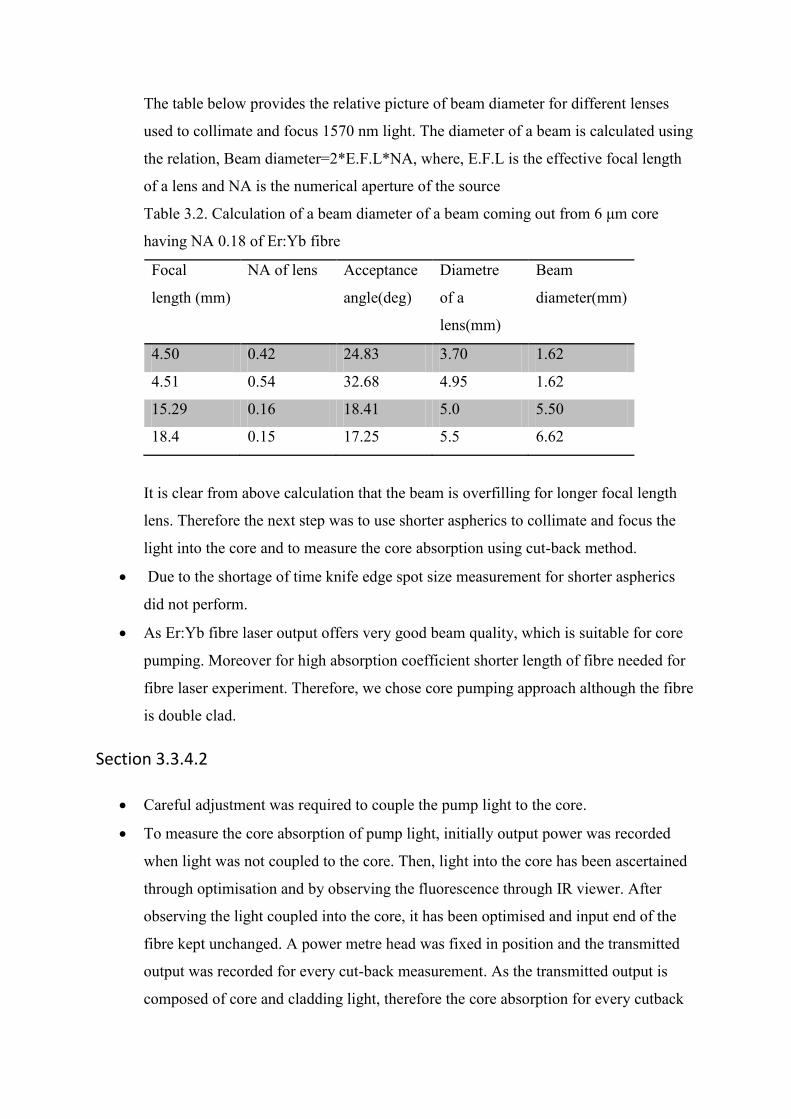
The table below provides the relative picture of beam diameter for different lenses
used to collimate and focus 1570 nm light. The diameter of a beam is calculated using
the relation, Beam diameter=2*E.F.L*NA, where, E.F.L is the effective focal length
of a lens and NA is the numerical aperture of the source
Table 3.2. Calculation of a beam diameter of a beam coming out from 6 μm core
having NA 0.18 of Er:Yb fibre
Focal
length (mm)
NA of lens Acceptance
angle(deg)
Diametre
of a
lens(mm)
Beam
diameter(mm)
4.50 0.42 24.83 3.70 1.62
4.51 0.54 32.68 4.95 1.62
15.29 0.16 18.41 5.0 5.50
18.4 0.15 17.25 5.5 6.62
It is clear from above calculation that the beam is overfilling for longer focal length
lens. Therefore the next step was to use shorter aspherics to collimate and focus the
light into the core and to measure the core absorption using cut-back method.
Due to the shortage of time knife edge spot size measurement for shorter aspherics
did not perform.
As Er:Yb fibre laser output offers very good beam quality, which is suitable for core
pumping. Moreover for high absorption coefficient shorter length of fibre needed for
fibre laser experiment. Therefore, we chose core pumping approach although the fibre
is double clad.
Section 3.3.4.2
Careful adjustment was required to couple the pump light to the core.
To measure the core absorption of pump light, initially output power was recorded
when light was not coupled to the core. Then, light into the core has been ascertained
through optimisation and by observing the fluorescence through IR viewer. After
observing the light coupled into the core, it has been optimised and input end of the
fibre kept unchanged. A power metre head was fixed in position and the transmitted
output was recorded for every cut-back measurement. As the transmitted output is
composed of core and cladding light, therefore the core absorption for every cutback
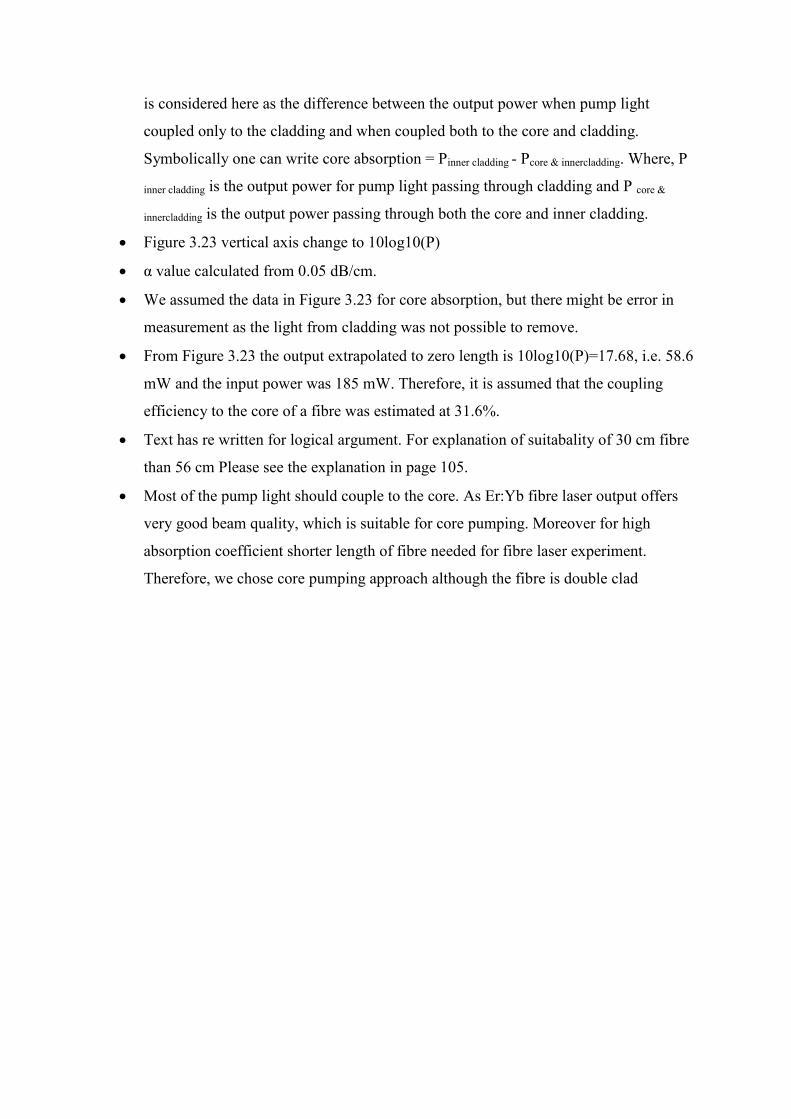
is considered here as the difference between the output power when pump light
coupled only to the cladding and when coupled both to the core and cladding.
Symbolically one can write core absorption = Pinner cladding - Pcore & innercladding. Where, P
inner cladding is the output power for pump light passing through cladding and P core &
innercladding is the output power passing through both the core and inner cladding.
Figure 3.23 vertical axis change to 10log10(P)
α value calculated from 0.05 dB/cm.
We assumed the data in Figure 3.23 for core absorption, but there might be error in
measurement as the light from cladding was not possible to remove.
From Figure 3.23 the output extrapolated to zero length is 10log10(P)=17.68, i.e. 58.6
mW and the input power was 185 mW. Therefore, it is assumed that the coupling
efficiency to the core of a fibre was estimated at 31.6%.
Text has re written for logical argument. For explanation of suitabality of 30 cm fibre
than 56 cm Please see the explanation in page 105.
Most of the pump light should couple to the core. As Er:Yb fibre laser output offers
very good beam quality, which is suitable for core pumping. Moreover for high
absorption coefficient shorter length of fibre needed for fibre laser experiment.
Therefore, we chose core pumping approach although the fibre is double clad
Answer on comments of reffere report 2
Page 20, 2nd paragraph: repititive part of second paragraph has been deleted.
Page 20, Fig 1.2 has deleted.
Page 22, 2nd paragraph corrected the word from confirm to confined
Page 24, 1st paragraph: Figure 1.4(b) is corrected as a representative of a offset fibre.
Page 25: V number has linked linked to normalised frequency as well as weak
guiding regime. Please see page 25. Core refractive index nc used ingeneral. Poulain’s
unexpected discovery of fluorozirconate glasses.
Page 31: K changed to k for Boltzman constant. The value for K also followed by
standard SI table.
Page 34: Figure becomes visible.
Page 38: In band ZBLAN results are plotted with a muliplier factor.
Page 45: 1st paragraph has deleted as it was contained repetition material of chapter 1.
Page 46: Double clad fibre consists of three different layer having step index
refractive index profile from core to outer cladding. The detail has been discussed in
previous chapter.
Explanation for second sentence as follows:
For non circular shape of DCFs, the symmetry of light rays is broken and the
absorption efficiency is improved by blending of the pumping waves [76, 82]. This is
because for non circular shape of inner cladding the symmetry of pumping wave is
broken as well.
Although various cross-sectional shapes have been employed, in practice, only a few
researchers have focused on the influence of cross-sectional shape on the absorption
characteristics of DCF lasers. The reason can be explained as follows.
In order to calculate the absorption characteristics by solving the wave propagation
equation in DCFs it is necessary to calculate the eigen modes. Generally typical
double clad fibre having NA 0.5 and 100 μm inner cladding will support more than
104 eigen modes. It will require a very large amount of computing time and
cumbersome to include all these modes in the calculation.
Page 47: Model verification moved to Appendix.

For circular shape, the pump absorption tends to saturation along with the increasing
of length. At the beginning the absorption increases with length sharply. After a
certain distance the increasing becomes smaller and smaller due to the non-absorbtion
of skew rays to the core of a fibre.
Page 50: Labels become visible now.
Page 52: This sentence moved to the result section.
Page 52: Fig 2.3 Labels have been modified
Page 53: Fig 2.4 labels have been modified
Page 55: ppm by volume changes to ppm by weight. Also explained more explicitly
the reason for only meridional rays contribution for circular shape and logical flow is
maintained.
Page 58: The sentence is corrected. Please see page 58.
Page 61: Horizontal axis label is corrected. Also the pump absorption explanation is
changed according to comment.
Page 62: Corrcted as advised.
Page 63: Table 64,65 as well as other tables have been deleted where the graph
represents the data.
Page 64,65: Pump laser scaling and fluctuation has moved to Appendix.
Page 66: Extra value of 10 in the equation has been deleted.
Page 69 now page 66: Fig 2.13 becomes 2.10, label has changed.
Page 70 becomes page 67: Further explanation of model values differe from
experimental values as follows:
There might be two other possibilities to differ experimental result from model
calculation. Firstly in model calculation effect of fibre bending was not considered for
pump absorption calculation. Secondly for cut-back measurement we measured
absorption at 10 metre and below 1 metre length only. For more accuracy of
measurement it could be performed the cut back experiment repeatedly througout the
whole length of fibre. But we had limited length of commercial fibre and was needed
to perform fibre laser experiment.
Page 72: Repetitions contains in indroduction and motivation section has deleted. Page 73: V number of 1.88 at 2 μm wavelength.
Page 74: Figures are rearranged accordingly. Also Fig 3.3 (a), (b), (c) plotted
seperately. Please see section 3.1.3, page 71.
Page 76: Modified accordingly as comments. For 0% output coupler we did not use index matching gel. Upward direction changes to forward direction. Increasing the output coupler reflectivity’s causes the decrease of slope efficiency of Tm:ZBLAN fibre laser.
Page 79: Labels are modified
Page 80: Modified according to comments.
Page 82: The trerm dag is replaced to to unabsorptive surface coating every where.
Page 83: Refractive index of Tm:ZBLAN 1.495 used as supplied by commercial
Tm:ZBLAN fibre data sheet. In the future, we will measure the refractive index of our
core and cladding glasses to provide insight into the predicted NA.
Page 89: The calculation is for only the cladding absorption. Please see page 85 for
detail
Page 92 now page 87: Fig 3.13 is now 3.12, axis label has been fixed.
Page 93: It has been confirmed from the transmission measurement graph (Figure 3.12) that the reflectivity of FBG is around 1570 nm. Second sentence is corrected as: By pressing the fusion button fibre becomes spliced and the splicing loss was observed 0.02 dB in Ericsson splicer.
Page 96: Additional explanation added for the purpose of transmission measurement.
Page 97: horizontal axis fixed to match with other figures.
Page 100: xx softaware changes to LabVIEW software .
Page 106: M2 value changes to 1.3
Page 107: Initially 100% output is recorded. Therefore data is recorded from above
90% to below 10%. The label of of 90% and 10% indicated in graph.
Page 109: Number of significant figure has modified.
Page 108: Convention for molar weight has chnged to MW
Page 116: Journal for ref 29 now ref 28 has been added.
12
List of Figures
1.1 Optical absorption in water............................................................ 19
1.2 Wavelength tuning of Tm fibre laser…......................................... 20
1.3 Double clad fibre concept……………………………………….. 22
1.4 Various forms of cladding pumped fibre laser………………….. 23
1.5 Diagram for ray propagation through fibre……………………… 24
1.6 Energy level diagram of a thulium doped ZBLAN fibre
laser…………………………………………………………….
28
1.7 Different types of resonator cavity configurations for fibre
laser…………………………………………………………........
30
1.8 Schematic of complete-fibre resonator with fibre Bragg grating.. 31
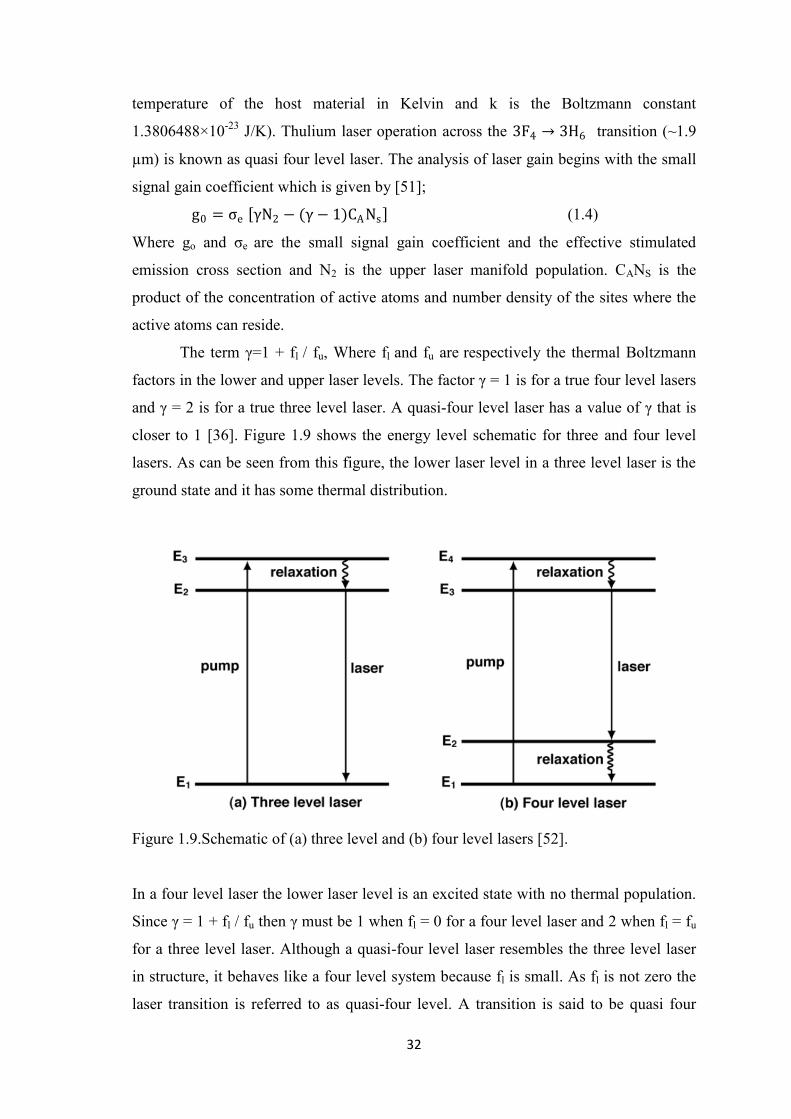
1.9 Schematic of (a) three level and (b) four level lasers.................... 32
1.10 Energy level schematic of Tm-Tm energy transfer process…….. 33
1.11 Room temperature absorption spectrum of a Tm doped ZBLAN
glass for different wavelength region ranging from 300 nm to
2100 nm………………………………………………….............
35
1.12 Absorption spectrum for Tm-doped silica..................................... 35
1.13 Cross relaxation between Tm3+ ions.............................................. 36
1.14 Absorption cross section of Tm:ZBLAN and Tm: Silica.............. 37
1.15 The emission spectrum of the 3F4 → 3H6 transition in Tm3+-
doped Silica and ZBLAN fibre......................................................
38
1.16 Schematic of comparative output of Tm:ZBLAN and Tm:Silica
at 2 µm through 790 nm pumping as well as in-band
pumping.........................................................................................
38
1.17 Absorption and emission cross section as a function of
wavelength of a Tm doped ZBLAN glass for the 3F4-3H6
transition…………………………………………………………
41
1.18 Effective absorption coefficient versus pump wavelength……… 43
1.19 Energy level diagram of Er:Yb co-doped silica…………………. 44
2.1 Ray tracing of a (a) circular (b) D-shape (c) square and (d)
broken-paralalleogram of a double clad fibre………………..
50
2.2 Normalized overlap image of 936 beams propagated along 1 51

13
mm of a 125 µm diameter inner cladding without an absorbing
core for three dimensions as well as two dimension.….
2.3 Verification of pump absorption for 1 m Tm:ZBLAN double
clad fibre with core NA 0.15 and inner cladding NA 0.50. In
figure (a) core diameter 8 micron and in figure (b) 15 micron
core diameter has been used……………………………………..
52
2.4 Image of the core optical path of (a) circular and (b) square
shape of a Tm:ZBLAN double clad fibre………...
55
2.5 Result for pump absorption in a circular d-shape and square
geometry of a double clad fibre………….………………………
56
2.6 Pump absorption quantification for 8/125 Tm:ZBLAN double
clad fibre (a) using the different offset values of 8 µm core (b)
total absorption efficiency versus core offset of 8 µm core and
length of a fibre is 5 m…………………………………………
58
2.7 Pump absorption quantification for different offset values of (a)
10 µm core (b) 15 µm core (c) 20 µm core and (d) their relative
comparison……………………………………………………….
60
2.8 (a) Schematic diagram for cut-back measurement and (b)
experimental setup.........................................................................
64
2.9 Pump absorption of a circular inner cladding of Tm doped core.. 65
2.10 Microscopic image of aTm:ZBLAN double clad fibre…………. 66
2.11 Comparison of absorption efficiency between model and
experiment for circular geometry of a double clad fibre...............
67
3.1 Experimental setup for the development of 2 µm Tm:ZBLAN
double clad fibre laser....................................................................
70
3.2 Laser output for (a) 4% Fresnel reflections and Si filter (b) 30%
(c) 20% reflectivity output coupler................................................
73
3.3 Output spectrum of ~2 µm laser.................................................... 74
3.4 Laser output using an output coupler reflectivity respectively (a)
0% (b) 20% and (c) 30% at 20000 nm. The lower triangle
denotes the backward direction and circle represent upward one.
76
3.5 (a) Definition of NA in optical fibre (b) the diagram of
measuring principle……………………………………………...
79
14
3.6 Experimental setup for a far-field light distribution measurement 80
3.7 Cross-view for fibre ends of 3 pieces of fibre............................... 82
3.8 Cut-back Measurement of Tm:ZBLAN fibre…………………… 83
3.9 Photos of the Tm: ZBLAN fibre guiding 790 nm light in the
cladding, highlighting the discrete scattering regions…………...
84
3.10 Er:Yb absorption calculation for 980 nm pumping....................... 86
3.11 Fibre Bragg grating transmission measurement setup................... 87
3.12 A FBG transmission spectra measurements using
supercontinuum source..................................................................
87
3.13 Experimental setup for the development of 1570 nm Er:Yb fibre
laser................................................................................................
89
3.14 Output spectrum for initial experiment………………………….. 90
3.15 The output spectrum of a Er:Yb fibre laser at 1570 nm................ 92
3.16 Output of Er:Yb fibre laser at 1570 nm......................................... 93
3.17 (a) Concept of M2 used to characterise laser beam quality (b)
Experimental set up for beam quality measurement…………......
94
3.18 Beam quality of 1570 nm source................................................... 95
3.19 Absorption calculation of Tm:ZBLAN double clad fibre at 1570
nm…….………….........................................................................
98
3.20 Experimental setup towards the development of 2 µm laser
using 1570 nm pump source.........................................................
99
3.21 Schematic diagram for knife edge measurement………………... 100
3.22 Spot size measurement using knife edge technique....................... 101
3.23 Core absorption of a Tm:ZBLAN double clad fibre using cut-
back method...................................................................................
104
A.1 Comparison of absorption efficiency with literature for circular
and parallelogram shape fibre having the core 20 µm and clad
600 µm……….…………………………………………………..
109
A.2 790 nm Diode characterization…………………...……………... 111
A.3 Diode power fluctuation measurements………………………… 112
A.4. 980 nm diode characterisation....................................................... 113

15
List of Tables
1.1 Properties for ZBLAN and Silica glass......................................... 26
3.1 Data for NA measurement……………………………………… 81
3.2 Data for beam diametre calculation……………………………... 102
16
Chapter 1
Literature Review
1.1 Introduction
LASER stands for light amplification through stimulated emission of radiation and
many types of lasers have been demonstrated. Fibre lasers at around 2 µm play a key
role as a high intensity source in a diverse area such as telecommunication, laser radar,
materials processing as well as medicine. Many researchers have been involved in the
development of 2 µm lasers using bulk crystals as well fibres. The thulium ion has been
used rigorously to develop these 2 µm lasers. The maximum Tm:Silica fibre laser
reported 1 KW using 790 nm source [1] and 415 W using 1.567 µm pumping in all
fibre format [2]. The slope efficiency of these fibre lasers are respectively 53% and
60%. While in the case of Tm:ZBLAN, 2 µm fibre lasers have reported a maximum
output of 20 W [3] using 790 nm pumping, and when using in-band pumping only 53
mW [4] with high slope efficiency. In in-band pump the absorption is around 1.6 µm,
near to lasing emission. Therefore, it is also possible to pump directly to the emitting
level using this wavelength as a pump source. Thus in-band pumping approach excites
directly the thulium ions into the upper laser level (3F4) increasing the maximum stokes
efficiency providing an attractive means to scale the output power of Tm:ZBLAN fibre
lasers at 2 µm. Presently watt level commercial lasers are achievable at around 1.6 µm
using commercial components. These diodes can be used to exploit in-band pumping of
Tm:ZBLAN fibre lasers.
This thesis is devoted to the development of a Tm:ZBLAN fibre laser at ~2 µm
through 790 nm pumping as well as ~1.6µm in-band pumping. The in-band pumping
approach is based on a hybrid fibre laser scheme, where a cladding-pumped Er,Yb fibre
laser operating at 1.57 µm would be used to pump the Tm:ZBLAN fibre laser. The goal
is to demonstrate an efficient operation of Tm:ZBLAN fibre laser at ~2 µm.
This chapter is therefore describe the need for fibre laser, the state of the art for
fibre laser at 2 µm and also the literature review and scope to develop 2 µm fibre laser.

17
1.2 Fibre Lasers
Lasers can make in various forms from nano-lasers to compact semiconductor based
lasers, which are common in CD and DVD player, barcode scanner as well as to
building sized systems like the National Ignition Facility. Because of lasers high
average power, compact and portable size, high reliability and the ability to propagate a
beam over long distances, its application is rapidly increasing in different areas, such as,
medical, material processing, defence and sensing.
The fiber laser has emerged as a laser design that is an excellent fit for the needs
of such highly demanding applications due to the invention of large mode area (LMA)
fibres and the availability of high brightness semiconductor diode pumps. Normally the
fibre is consisted of the high index core and lower index cladding. The active core is
doped with rare earth ions chosen based on the desired emission wavelength. The
cladding is designed in such a way so that light can be able to propagate through the
core and excite the laser ions. Extensive research has been carried out to fabricate rare-
earth ion doped crystals and glasses after the first lasing demonstration using a ruby
crystal [5]. These rare-earth doped glasses and crystals have been used to demonstrate
solid state lasers for coherent emission of different wavelengths. In comparison to
crystals, glasses have broader laser transitions, which is an essential feature for
wavelength tuning and ultra short pulse generation. Moreover, it also has wider
absorption spectra, relieving the wavelength tolerance for pump sources. Apart from
this single mode optical fibres, which are drawn from glasses exhibit a flexible and
compact gain media for efficient and excellent beam quality laser generation. To date,
single mode fibres can be drawn from silicate, phosphate, fluoride, tellurite, germinate
and chalcogenide glasses etc. The spectral range of glass fibre lasers can cover from the
ultraviolet (UV) to mid-infrared and the output power of a single-element fibre laser
can be up to kilo-watts [6]. The emergence of fibre lasers are even more important as
they are practical to use. Fibre lasers can be made monolithic and compact while at the
same time being highly efficient. They are more straightforward to assemble compared
to the complex and highly skilled assembly processes essential for the production of
conventional laser cavities. The appropriate fibre laser design which is compact,
efficient and flexible, is likely to replace most conventional solid state lasers in

18
applications where peak power is not required. Nonlinearity and mode field diameter
are the main factor that limits the power to further scale for fibre laser.
The fibre laser cavity can be formed by either butt-coupled mirrors or fibre-
integrated mirrors such as Bragg-gratings or loop mirrors. Fibre-based laser systems
have the reputation of being immune to many thermo-optical problems due to their
geometry. Moreover, the beam quality of the guided mode is power independent, as it is
determined by the fibre core design. Their excellent heat dissipation is due to the fact
that heat can be dissipated over the longer length of the fibre and the gain medium is
only a short distance from the outer surface of the fibre. The gain of the laser medium is
determined by the product of population inversion, and interaction length with the laser
radiation in the gain medium and emission cross-section. This can be orders of
magnitude higher in fibres than in other bulk solid state lasers. This results in a very
efficient operation of fibre laser systems exhibiting very high gain and low pump
threshold values.
1.3 2 µm Lasers
Laser sources around two microns have many potential applications in the field of
medicine, communication and eye safe laser radar or lidar. For many of these
applications the wavelength, pulse energy and pulse duration are of primary interest [7].
The near-IR spectral region, i.e. from 1.4 to 1.8 μm is called eye safe region, where
optical absorption by water in the eye prevents power from reaching to the retina [9].
From here on the term “eye safe wavelength” will be used for wavelength range from
1.4 µm to ~2.2 µm. The favourable absorption in water also makes such lasers useful
for medical applications. A spectrum of the optical absorption in water is shown in
Figure 1.1, measured by Hale and Querry [8].
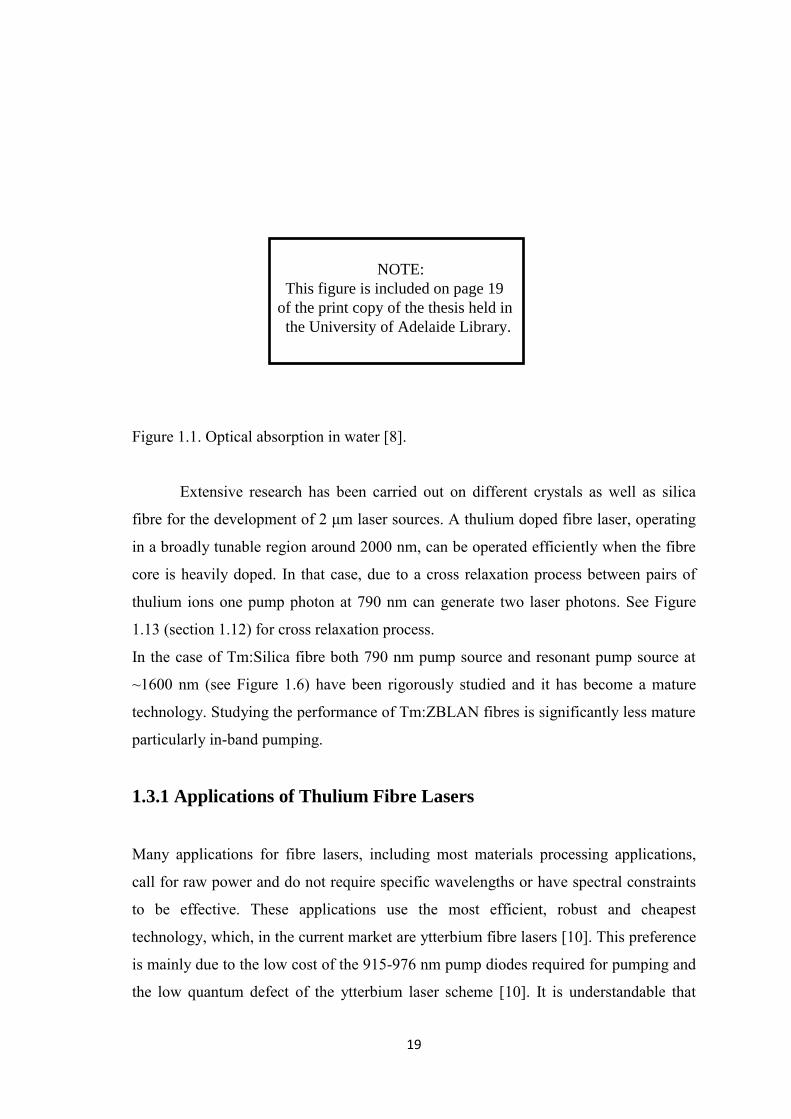
It is observed from the graph that there is strong absorption around 2 µm in human
tissue, which results in a penetration for this particular wavelength of a few hundreds of
microns [9]. The strong absorption by the water in living cells allows for very precise
cutting of biological tissue. The coagulation effect helps to reduce the bleeding during
the laser cutting. 2 µm lasers are therefore ideally suited for many surgical procedures
[9].
19
Figure 1.1. Optical absorption in water [8].
Extensive research has been carried out on different crystals as well as silica
fibre for the development of 2 μm laser sources. A thulium doped fibre laser, operating
in a broadly tunable region around 2000 nm, can be operated efficiently when the fibre
core is heavily doped. In that case, due to a cross relaxation process between pairs of
thulium ions one pump photon at 790 nm can generate two laser photons. See Figure
1.13 (section 1.12) for cross relaxation process.
In the case of Tm:Silica fibre both 790 nm pump source and resonant pump source at
~1600 nm (see Figure 1.6) have been rigorously studied and it has become a mature
technology. Studying the performance of Tm:ZBLAN fibres is significantly less mature
particularly in-band pumping.
1.3.1 Applications of Thulium Fibre Lasers
Many applications for fibre lasers, including most materials processing applications,
call for raw power and do not require specific wavelengths or have spectral constraints
to be effective. These applications use the most efficient, robust and cheapest
technology, which, in the current market are ytterbium fibre lasers [10]. This preference
is mainly due to the low cost of the 915-976 nm pump diodes required for pumping and
the low quantum defect of the ytterbium laser scheme [10]. It is understandable that
NOTE: This figure is included on page 19 of the print copy of the thesis held in the University of Adelaide Library.

20
thulium lasers cannot compete with ytterbium systems in terms of costs. However, in
many cases where the application requires a specific spectral region, thulium doped
fibre lasers are suitably efficient. In order to better understand the needs of the more
advanced thulium fibre lasers systems it is important to understand the applications that
will benefit from their implementation. The following section will discuss this in detail.
There is a great market potentiality for lasers operating in the “eye safe”
wavelength range, especially in free space applications where eye safety is very
important. Because of the tuning range of thulium laser transmission it provides
differential studies of absorption or optimisation of laser signal based on selecting the
optimal transmission wavelengths [11, 12]. Figure 1.2 shows the tuning range of
thulium fibre laser.
Figure 1.2. Tuning range of Tm fibre laser [14]
In addition to applications which generally fall into the eye-safe regime, there are also
applications which specifically call for wavelengths around 2 μm. Medical applications
where particular biological absorption resonances must be hit (or avoided) to optimize a
NOTE: This figure is included on page 20 of the print copy of the thesis held in the University of Adelaide Library.

21
particular procedure are one large area requiring spectrally controlled thulium fibre
lasers. Studies are being conducted to prove the usefulness of the thulium fibre lasers
and allow their use in clinical trials. As thulium lasers prove themselves for medical
applications over conventional surgical alternatives [13], numerous new medical
applications requiring power scaled thulium lasers in the hundreds of watt range will
continue to rise. Such applications will have steep demands on spectral control to target
particular molecules within the thulium bandwidth such as haemoglobin, melanin or
water.
The 2 μm wavelength range is also very attractive for material processing
especially for plastics [9]. Using the absorbed energy of a 2 μm laser; cutting, welding,
and marking are easily possible. Apart from the above described applications, 2 μm
laser systems are also interesting for military and security applications, free space
optical (FSO) communication as well as for the pumping of laser sources for the mid
infra-red region. Thulium lasers have a use in almost every field that a laser might find
an application, as its uniquely broad tuning range enables it to be used for applications
where absorption features must be missed or hit and for applications requiring broad
spectra.
1.4 Limitation of Core Pumping Scheme for Fibre Laser Development
Fibre laser research has accelerated since the first demonstration of a core pumped Nd-
doped silica fibre by a laser diode in 1985 due to great effort by Payne and his co-
workers [15]. The lasing achieved had a low threshold and the output power was
extremely low due to the poor coupling efficiency of 1.5 mW diode into the core. In a
core pumped system, the optical pump beam is injected to the core of the active fibre.
For an efficient coupling efficiency a single mode diode is required. Such pump sources
are low power and costly. When power scaling end pumped laser system, desired a high
input power can only be provided by multimode pump sources. This limitation is
overcome through cladding pumping [16, 17]. The next section will describe the advent
of cladding pumping fibre laser.
22
1.5 Cladding Pumping Fibre Laser
A fibre laser based on ordinary doped single mode fibre can generate a diffraction-
limited output, but it is restricted to pump sources with diffraction limited beam quality
and thus normally to those with low power. However, multimode fibres are optical
fibres which support multiple transverse guided modes for a given optical frequency
and polarization. To increase the coupling efficiency, it is necessary to use a larger fibre
diameter that is matched to the area of high power diode laser. However, an increased
fibre diameter leads to multimode operation and reduced beam quality.
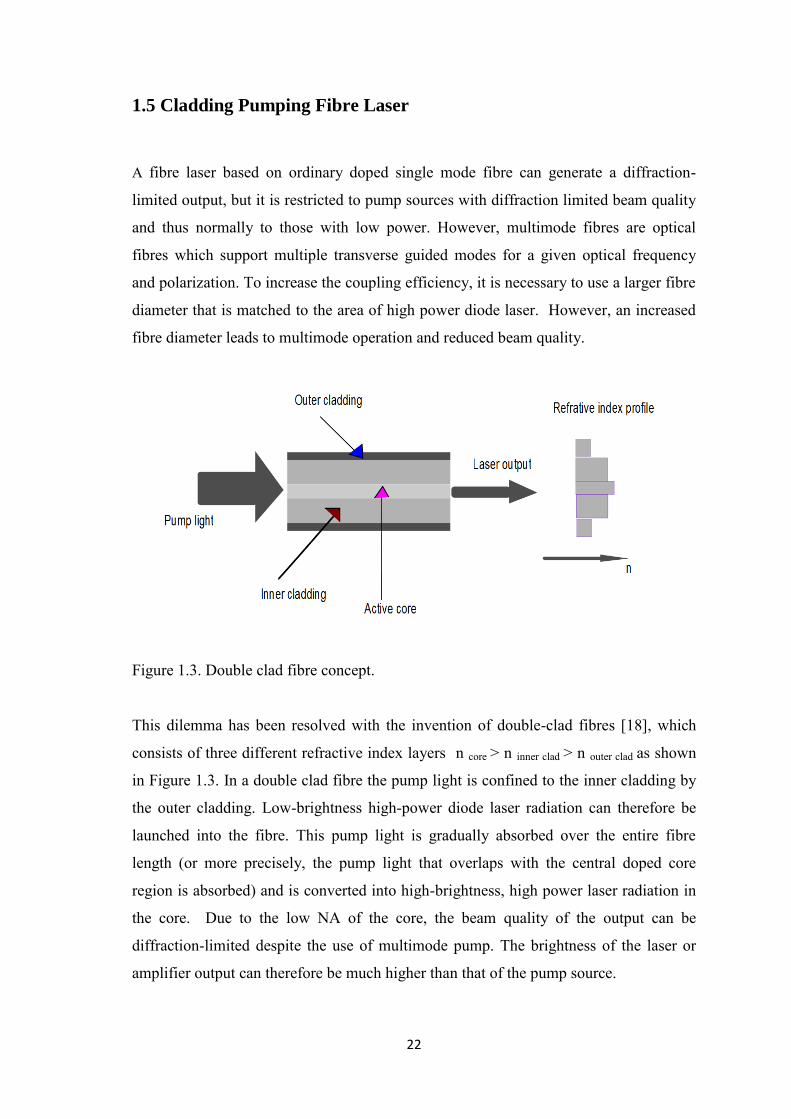
Figure 1.3. Double clad fibre concept.
This dilemma has been resolved with the invention of double-clad fibres [18], which
consists of three different refractive index layers n core > n inner clad > n outer clad as shown
in Figure 1.3. In a double clad fibre the pump light is confined to the inner cladding by
the outer cladding. Low-brightness high-power diode laser radiation can therefore be
launched into the fibre. This pump light is gradually absorbed over the entire fibre
length (or more precisely, the pump light that overlaps with the central doped core
region is absorbed) and is converted into high-brightness, high power laser radiation in
the core. Due to the low NA of the core, the beam quality of the output can be
diffraction-limited despite the use of multimode pump. The brightness of the laser or
amplifier output can therefore be much higher than that of the pump source.

23
Thus, double-clad rare-earth-doped fibres can provide a highly efficient
brightness improvement by pump to laser radiation conversion by the laser. In cladding
pumping, however, the core‟s effective absorption coefficient is smaller than true
absorption coefficient by a factor roughly equal to the overlap between the pump area
and the core area. For a given doped core the length of the fibre must be increased in
order to achieve sufficient pump absorption.
Figure 1.4. Various forms of cladding pumped fibre laser. In each case the black circle
represents the fibre core.
This length increasement depends on the core/cladding area ratio as well as the design
of the fibre profile. Thus when cladding pumping, efficient brightness conversion from
a multimode pump to a single mode output can be achieved, if propagation losses are
not significant despite increasing the fibre length.
For higher laser efficiency it is therefore important to optimize the coupling of
pump radiation from cladding to core. This can be achieved by altering the geometry of
the inner and outer cladding. e.g. Figure 1.4. In the inner cladding of a cylindrically
symmetric double clad fibre Figure 1.4 (a), intensity distribution can exist which have
no overlap with the doped core. This leads to a degradation of the laser efficiency.
Because a portion of the launched light is skew to the fibre axis which will never
(a) (b) (c)
Outer cladding Inner cladding Rare earth doped core

24
crosses the central region of the pump cladding. The pump light absorption can be
significantly improved by breaking the cylindrical symmetry of the inner cladding.
Geometries such as offset core Figure 1.4 (b) or rectangular inner claddings Figure 1.4
(c) have been suggested to minimize the pump absorption [19, 20].
1.6 Fibre Laser Characteristics
The fibre considered here has the central core in which light is guided. The core has a
refractive index denoted by n core and it is imbedded in an outer cladding with a lower
refractive index, n clad, as shown Figure 1.5. The fibre is assumed to have a step index
profile and a core diameter D.
Figure 1.5. Schematic diagram for ray propagation through fibre.
The numerical aperture (NA) which determines the maximum angle of incidence ϕmax
for rays to be coupled into the fibre can be expressed interms of the refreative indices of
the core cladding glasses by
NA = n0 sinϕmax = ncore 1 − nclad
ncore
2
φi
ncladding
ncladding
ncore
φ
θ
25
= ncore2 − nclad
2 (1.1)
The number of modes supported by a fibre is defined by the normalised
frequency or V number. The normalised frequency can be written as
V =2π
λ𝖺NA =
2π
λa ncore
2 − nclad2 (1.2)
where, 𝜆 is the wavelength of light in vacuum, and n core and n clad is the refractive
indices of core and cladding of the fibre with a core radius a.
The single mode guidance of a fibre occurs when V number is less than 2.405. In this
case only fundamental mode would be propagated through the gain media [21, 22].
Therefore single mode guidance can be done either by increasing the core diameter or
by decreasing the numerical aperture (NA) at a certain V value. For single mode
guidance the index contrast between core and cladding is typically small, so that fibers
are weakly guiding, but in general the guidance is sufficient to negotiate bend with radii
of tens of centimeters. A low V number makes a fiber sensitive to bend losses in the
cladding. However, a high V number may increase scattering losses at the core-cladding
interface.
For a multimode fibre the intensity distribution function often approximated as a
top-hat function of radius a, with uniform intensity distribution along the core of the
fibre [23]. However, for a single mode operation the intensity distribution approximates
the Gaussian distribution and is given by [24]
𝐼(𝑟) =2
𝜋𝑤 2𝑒𝑥𝑝
−2𝑟2
𝑤2 (1.3)
where, w is beam spot size.
1.7 Laser Host Material
ZBLAN is a heavy metal fluoride glass with a molar composition of 53% ZrF4, 20%
BaF2, 4% LaF3, 3% AlF3, and 20% NaF, suitably stable glass for optical fibre fabrication
which was first reported by Ohsawa et al. [25]. Low loss, high strength and high
tunability of silica glass makes it suitable to construct fibre lasers. Fluoride glasses are

26
an attractive host for visible and mid-infrared lasers due to its low phonon energy and
wide mid-infrared transparency [26].
Since Poulain‟s unexpected discovery of fluorozirconate glasses, ZBLAN
glasses have drawn much attention because of its broad transmission window, low
optical dispersion, low refractive index, ease of machining and polishing, and small
thermal dependence of the optical properties [27]. The table 1.1, below describes the
properties of ZBLAN glass compared to those of silica glass. In ZBLAN glass the
singly charged fluoride ion has lower bond strength than in silica glass, which leads to
its greater infrared transparency. The ZBLAN glasses stability and hardness are lower
than silica glass. When light propagates through an optical glass it starts to attenuate
because of intrinsic and extrinsic processes. Band-gap absorption, Rayleigh scattering,
and multiphonon absorption are included in intrinsic processes. Lower intrinsic loss can
obtain by shifting infrared edge of multiphonon absorption to longer wavelengths
because band-gap absorption and Rayleigh scattering are only significant at short
wavelengths. The materials which have lower bond strength and the higher reduced
mass are expected to have lower fundamental absorptions at longer wavelength. This is
the case in ZBLAN glass which has an average cation mass of typically 90 [28]. The
minimum loss coefficient for ZBLAN glass is predicted to be as low as 0.01 dB/km at
2.5 μm [29], which is much less than silica‟s 0.2 dB/km at 1.5 μm.
Table 1.1. Properties for ZBLAN and Silica glass [30].
NOTE: This figure is included on pages 26-27 of the print copy of the thesis held in the University of Adelaide Library.

27
ZBLAN fibres have grown a lot of interest as an alternative fibre for long-haul
optical communications since 1980s. ZBLAN fibres fabricated in labs have
demonstrated attenuation coefficients of less than 1 dB/km [30]. Commercial silica
fibres still have a lower background loss 0.2 dB/Km. Aalthough the lower losses have
been achieved, the typical background loss of commercial ZBLAN fibres is in the range
of 10–100 dB/km due to the extrinsic scattering and absorption losses that are relatively
difficult to control in the fabrication process [28]. As a result of the higher loss of
ZBLAN glass, output levels of ZBLAN fibre lasers would be lower than those of silica
fibre lasers. Due to the vast applications of fibre lasers at 2 µm, more research would be
needed into ZBLAN fibre lasers, to further develop the technology.
1.8 Two Micron Tm Doped Fibre Lasers
The development of thulium fibre lasers roots back into the early history of lasers. The
use of thulium as a laser ion was first reported in thulium doped crystal lasers (CaWO4
and YAG) which occurred in the early 1960‟s. During this time numerous crystal hosts
and dopants were being rigorously investigated [31-34]. After being proved as a
potential laser ion, further research continued in thulium‟s emission wavelength in the
1.9 - 2.1 μm range. The development of first fibre lasers begun in the mid 1980s, with
included the production of high quality fibres as well as the development of pump
diodes. The first thulium fibre laser was reported in 1988, and was pumped with a dye
laser at 790 nm. It achieved a few 10‟s of mW of power [35]. Research on thulium fibre
lasers accelerated due to the growing interest in fibre lasers for applications requiring
compact, high power sources at flexible wavelengths. The two main attractive pump
absorption bands of Tm:ZBLAN and Tm:Silica are at ~780-800 nm and at ~1550-1750
nm (see Figure 1.6) will discussed later in section 1.12. The latter absorption bands
coincide with the emission wavelengths of pump erbium fibre laser sources. The detail
of this will discuss in the development of the Er:Yb pump source for in-band pumping

28
in section 1.14. The attractive emission of thulium doped ZBLAN as well as silica
lasers is very broad emission from the 3F4-3H6 transition which ranges from ~1700 to ~
2100 nm [36]. Taking advantage of this large tuning range of rare earth ion, the first
tunable thulium fibre laser was reported in [37] which had a tuning range of 1780 nm to
2056 nm.
Figure 1.6. Energy level diagram of a Tm doped ZBLAN fibre laser.
The first ZBLAN fibre laser at 2 µm demonstrated around 0.2 mW of output
power with slope efficiency of only 0.3% [38]. At the same time Tm:ZBLAN fibre
lasers were studied for range of emission wavelengths but at 2 µm the output as well as
efficiency were not improved [39]. Tm:ZBLAN fibre lasers have been pumped with
semiconductor lasers as well as color centre laser. The slope efficiencies of these lasers
are very high, from70 to 84% [4, 40,41], however the maximum power achieved was
only 53 mW [4]. Then for a give years research on thulium fluoride fibre lasers saw
little improvement in laser performance. Research therefore returned to the
development of high power silica fibre laser at this wavelength. The first watt level
thulium laser was give year soon after the development of the first thulium fibre laser
[42], by simply scaling up pump power of the readily available Nd:YAG pump sources
of 1064 nm. This laser used a single clad fibre, and was core pumped. In 1998, when
diode pump power began to available, a 5.4 W output power was achieved from a
double clad fibre laser at wavelength near 2 μm [43]. The slope efficiency of this laser
was in the range of 30-35%. An increase in the laser efficiency was accomplished
throughout the implementation of high doping concentrations and the use of the cross
3H6
3H4
3H5
3F4
790nm pump
~1.6 µm in-band pump
2 µm
1.47 µm 2.31 µm

29
relaxation process. Cross relaxation in thulium is a long understood process, as it was
demonstrated in thulium doped crystals [44], the basic idea is that two laser photons can
be produced from a single pump photon. The slope efficiency could therefore be double
the quantum defect. This effect was first observed in thulium fibres in Ref [45] where
slope efficiency 46% was achieved. This laser generated 12 W of output power. The
ability to dope thulium in high concentrations was realized by the inclusion of
aluminium oxide in the glass doping formula which reduced clustering and enhanced
the desirable cross relaxation process. This process was further studied by Jackson in
Ref [46, 47]. The realisation of this process and the increase in available diode power
lead to the rapid advance in output power in thulium silica fibre lasers from 12 W in the
year 2000 to the near kilowatt levels currently achievable [48].
The research contained within this thesis aims to develop ZBLAN fibre lasers
using the same technology as is used in silica fibre lasers through the use of high doping
concentrations and the cross relaxation process. In 2004, B.M. Walsh et al. [36]
reported the comparative study on Tm:ZBLAN and Tm:Silica fibre lasers. The
spectroscopy of these materials indicated that Tm:ZBLAN posseses advantages over
Tm:Silica glass due to its lower phonon energies. The result of tunable 790 nm pumped
fibre laser operating from 1.85 to 2.1 µm has been demonstrated that Tm:ZBLAN can
be achieved a factor of 2 higher in slope efficiency and a factor of 3 lower in threshold
than in Tm:Silica fibre lasers [36]. In 2005, M. Eichhorn [49] reported a high average
output of a CW thulium doped fluoride fibre laser at 2 µm using a double end pumping
scheme, of 6 W. The slope efficiency of 32.6% was reported for this fibre laser. A 2.4
m long fluoride double clad fibre was used by Le Verre Fluoré. The fibre was doped
with 25000 ppm thulium. The fibre had a core diameter of 30 µm and an NA=0.08. The
D-shaped outer cladding had an NA=0.47 with a circular diameter of 300 µm, from
which 30 µm was truncated to enhance the pump absorption. Because of the core a fibre
has low NA this fibre would have high bending losses which have been reduced by
introducing an undoped annular ring of higher index concentrically oriented around the
core of a fibre. Following this work, in the year 2008, M. Eichhorn et al. [3] reported
the highest output of a Tm:ZBLAN fibre laser at 2 µm, at 20 W. They used same fibre
geometry. A slope efficiency of 49% was reported, which is still lower than the reported
value of Tm:Silica. There is still room to increase the slope efficiency and output power
of Tm:ZBLAN fibre lasers. The increased interest in thulium fibre lasers since the mid

30
2000s has lead to the development of higher power pump diodes and improvements in
the fibre composition to better enable cross relaxation [1, 45, 46, 48].
1.9 Laser Resonator Types of Tm3+
Doped Fibre
In order to develop a fibre laser it is necessary to understand the resonator cavity
configuration. Commonly there are three kinds of fibre laser resonators as shown in
Figure 1.7
Figure 1.7 Schematic diagram of resonator, with (a) single end pumping (b) a single
counter propagating end pumping and (c) double end pumping configuration [50].
Figure 1.7(a) is the simplest cavity configuration, in which the pump light is launched
into the fibre through a highly reflective dichroic mirror act as an input coupler for
pump light. Laser oscillation forms between the dichroic mirror and the Fresnel

31
reflection (depends on the index of host material) of the cleaved output end facet of the
fibre. In this cavity configuration, addition of output coupler can improve the optical
efficiency of the fibre laser. In Figure 1.7(b), the pump light is launched into the fibre
from the output end, and the dichroic mirror is set at 45 degree with respect to the fibre
axis for extracting laser output. At the end facet of the fibre, a broadband high reflection
mirror is placed to form the laser resonator. For power scaling both ends of the fibre can
be pumped, see Figure 1.7(c).
Fibre laser resonator can also be formed using Fibre Bragg Grating (FBG).
Figure 1.8 shows the formation of resonator using FBG.
Figure 1.8 Schematic of complete-fibre resonator with fibre Bragg grating [50].
Wavelength tuning as well as narrow width laser spectra can be obtained using a bulk
grating in the cavity as an output coupler. However, wavelength-tuning with a bulk
grating is inconvenient, and brings laser instability [50], so the commonly used
wavelength tuning in fibre lasers constructed by using fibre Bragg gratings as the
feedback device and output coupler, as shown in Figure 1.8. Therefore, the FBG laser
resonator can provide wavelength tuning as well as narrow spectral width and high
stability. The next section will describe the quasi four level nature of the thulium fibre
laser.
1.10 Quasi Four Level Lasers
The thermally distributed population of the lower laser level of quasi three level lasers
can cause the laser transition to behave as a quasi four level system. As the lower laser
level is only few hundred wave numbers (cm-1) above ground state, it is populated at
thermal equilibrium at room temperature, since kT is 207 cm-1 at 300K (where T is the
32
temperature of the host material in Kelvin and k is the Boltzmann constant
1.3806488×10⁻²³ J/K). Thulium laser operation across the 3F4 → 3H6 transition (~1.9
µm) is known as quasi four level laser. The analysis of laser gain begins with the small
signal gain coefficient which is given by [51];
g0 = ςe γN2 − (γ − 1)CA Ns (1.4)
Where go and σe are the small signal gain coefficient and the effective stimulated
emission cross section and N2 is the upper laser manifold population. CANS is the
product of the concentration of active atoms and number density of the sites where the
active atoms can reside.
The term γ=1 + fl / fu, Where fl and fu are respectively the thermal Boltzmann
factors in the lower and upper laser levels. The factor γ = 1 is for a true four level lasers
and γ = 2 is for a true three level laser. A quasi-four level laser has a value of γ that is
closer to 1 [36]. Figure 1.9 shows the energy level schematic for three and four level
lasers. As can be seen from this figure, the lower laser level in a three level laser is the
ground state and it has some thermal distribution.
Figure 1.9.Schematic of (a) three level and (b) four level lasers [52].
In a four level laser the lower laser level is an excited state with no thermal population.
Since γ = 1 + fl / fu then γ must be 1 when fl = 0 for a four level laser and 2 when fl = fu
for a three level laser. Although a quasi-four level laser resembles the three level laser
in structure, it behaves like a four level system because fl is small. As fl is not zero the
laser transition is referred to as quasi-four level. A transition is said to be quasi four

33
level if γ < 1.5, and for γ > 1.5 it is quasi-three level. The effect of the phonon energy
regarding energy transfer processes is an important consideration as well. This is true
for thulium lasers and the two-for-one self-quenching process will be discussed later.
Energy transfer processes in thulium will be discussed in the following section.
1.11 Tm-Tm Energy Transfer Process
This section will be discussed the energy transfer process between thulium ions which
are advantageous for 2 µm laser. When an optically active rare earth substance mixed
with solid sate material and exposed to a radiation source, the electronic states can be
excited by absorbing some of photons from the radiation field. The de-excitation of
excited energy levels can be in the form of photons or phonons. The emission of
phonons adds heat to the glass lattice. The energy transfers for laser materials are
mainly through radiative and nonradiative process. In case of radiative energy transfer
process, the emission of photon by one ion causes the absorption of that photon by
another ion. The non-exponential decay of thulium ions from 3H4 manifold is strongly
reduced due to increasing thulium concentration, as a result of the cross relaxation
process, measured in Tm:YAG [53] and Tm:YLF [54] and denoted by P41 in Figure
1.10.
Figure 1.10. Energy level schematic of Tm-Tm energy transfer process [52].

34
In this process an excited ion in 3H4 manifold transfers part of its energy to another ion
in the ground 3H6 state manifold, so that both end up in the intermediate upper laser
level 3F4. The cross relaxation in thulium is represented by (3H4 → 3F4); (3H6 →3F4). The
reverse process is shown in Figure 1.10 as P22. Non radiative decay from the 3H4 energy
level competes with the cross relaxation process in thulium doped materials. Therefore,
lower phonon materials are more advantageous when trying to enhance this process
making ZBLAN glass a suitable host. Thulium lasers can be excited to 3H4 manifold
using commercially available 790 nm diodes. If each pump photon produced only one
laser photon, then the ratio of pump to laser emission is limited to ~0.4.
With the enhancement of the laser efficiency through the cross relaxation
process two laser photons are generated from the one pump photon, therefore increases
the quantum efficiency to ~0.8 [52]. This is highly advantageous situation for 1.9 µm
laser.
1.12 Tm:ZBLAN and Tm:Silica Fibre Laser at ~2 µm
Thulium doped fibre offers an alternative route compared to more conventional thulium
doped bulk lasers. Despite the low emission cross section of a thulium doped fibre, it
can provide high gain due to the long length of the fibre. An additional advantage of
thulium doped fibre lasers is that they can be pumped directly using commercially
available laser diodes. Thulium possesses strong absorption in the wavelength range
780-800 nm [55, 56]. Therefore, the short-infrared wavelength range effectively
covered by Tm3+ doped lasers can pump directly with ~800 nm diodes.
The absorption spectrum of Tm3+-doped ZBLAN glass and Tm:Silica fibre is shown in
Figure 1.11 and 1.12 respectively. From this absorption spectra the strong absorption
near 790 nm, is quite evident. This absorption band also aligns well with the emission
band of commercial diode lasers. The pumping of Tm3+-doped fibre lasers is
comparatively easier and less expensive using the above mentioned source, and offers
an exciting avenue for lasing in the 2 μm wavelength range. Moreover, it also observed
from Figure 1.11 and 1.12 that the absorption wavelength range spanning from ~1550
nm to ~1850 nm, which is near to laser emitting wavelength at ~ 2 μm. Therefore, it is
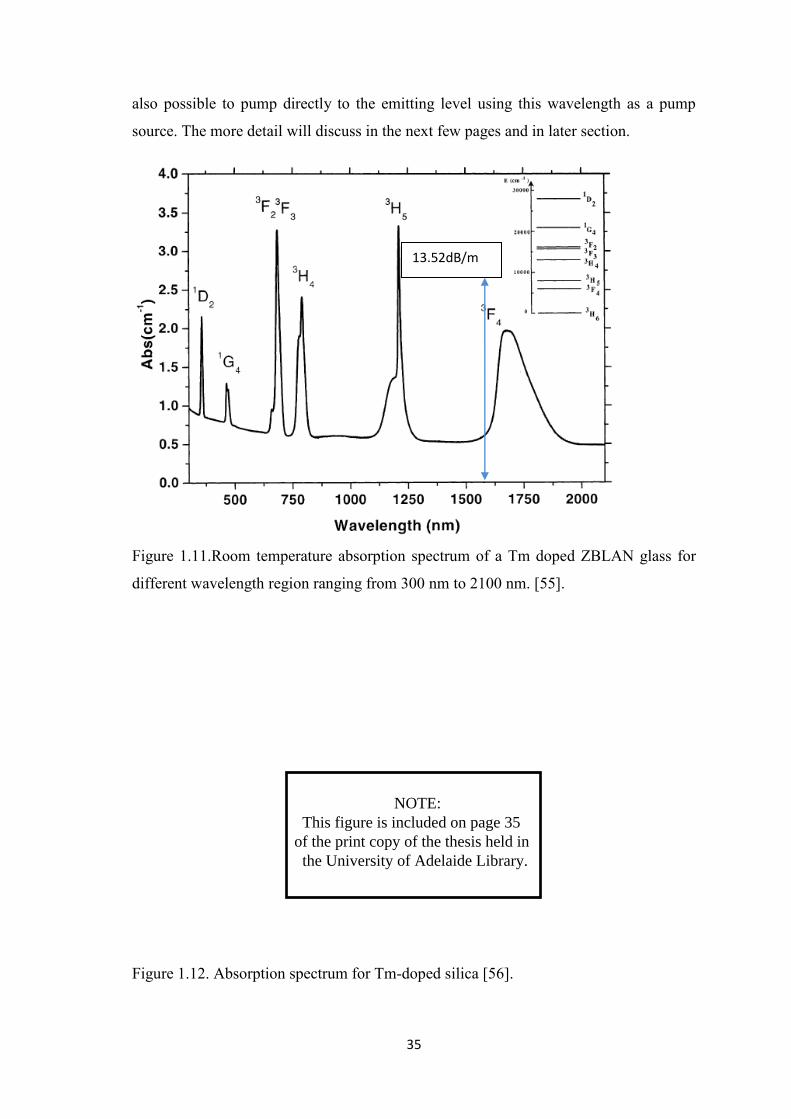
35
also possible to pump directly to the emitting level using this wavelength as a pump
source. The more detail will discuss in the next few pages and in later section.
Figure 1.11.Room temperature absorption spectrum of a Tm doped ZBLAN glass for
different wavelength region ranging from 300 nm to 2100 nm. [55].
Figure 1.12. Absorption spectrum for Tm-doped silica [56].
13.52dB/m
NOTE: This figure is included on page 35 of the print copy of the thesis held in the University of Adelaide Library.
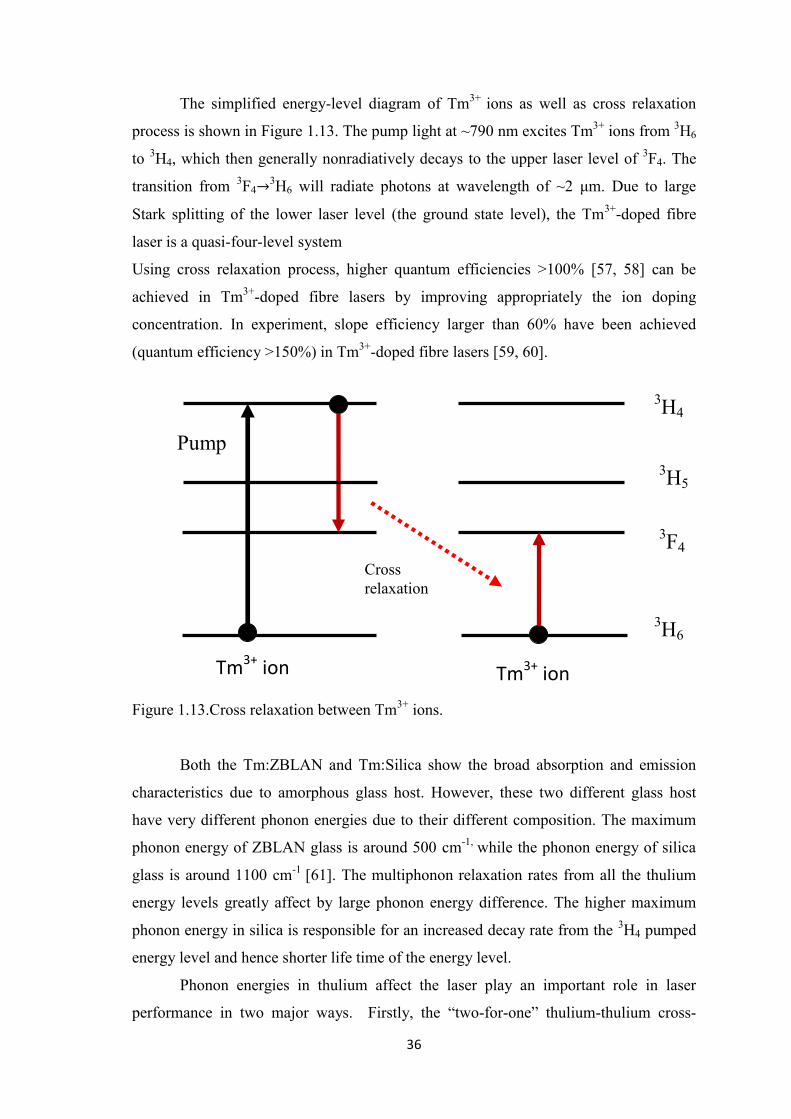
36
The simplified energy-level diagram of Tm3+ ions as well as cross relaxation
process is shown in Figure 1.13. The pump light at ~790 nm excites Tm3+ ions from 3H6
to 3H4, which then generally nonradiatively decays to the upper laser level of 3F4. The
transition from 3F4→3H6 will radiate photons at wavelength of ~2 μm. Due to large
Stark splitting of the lower laser level (the ground state level), the Tm3+-doped fibre
laser is a quasi-four-level system
Using cross relaxation process, higher quantum efficiencies >100% [57, 58] can be
achieved in Tm3+-doped fibre lasers by improving appropriately the ion doping
concentration. In experiment, slope efficiency larger than 60% have been achieved
(quantum efficiency >150%) in Tm3+-doped fibre lasers [59, 60].
Figure 1.13.Cross relaxation between Tm3+ ions.
Both the Tm:ZBLAN and Tm:Silica show the broad absorption and emission
characteristics due to amorphous glass host. However, these two different glass host
have very different phonon energies due to their different composition. The maximum
phonon energy of ZBLAN glass is around 500 cm-1, while the phonon energy of silica
glass is around 1100 cm-1 [61]. The multiphonon relaxation rates from all the thulium
energy levels greatly affect by large phonon energy difference. The higher maximum
phonon energy in silica is responsible for an increased decay rate from the 3H4 pumped
energy level and hence shorter life time of the energy level.
Phonon energies in thulium affect the laser play an important role in laser
performance in two major ways. Firstly, the “two-for-one” thulium-thulium cross-
3H4
3H5
3F4
3H6
Cross relaxation
Tm3+ ion Tm3+ ion
Pump

37
relaxation process between thulium ions is highly dependent on the life time of pump
energy level. Cross relaxation and multiphonon relaxation are competitive process. Due
to larger phonon energies multiphonon relaxation dominates, as a result cross relaxation
process will be diminished [36]. Laser threshold also depends on the efficiency of the
cross-relaxation process. A smaller efficiency of the cross relaxation process has the
effect of raising the laser threshold [36]. The 3F4 lifetime is shortened through
multiphonon decay. This shortening the life time of the 3F4 manifold due to
multiphonon decay will reduce the 3F4→3H6 quantum efficiency. The lower quantum
efficiency would reduce the slope efficiency.
Secondly, due to higher phonon energy, the increased emission of phonons adds
to the heat load, which has a negative impact on lasers by increasing the population of
lower laser level. Thus the threshold of laser will be increased [36]. Therefore,
maximum phonon energies of these two materials play a major role to populate 3F4
energy level for laser actions.
From the absorption and emission spectra reproduced in Figure 1.14 and 1.15,
measured by Walsh et al. [36], it was observed that the absorption and emission cross
section of Tm:ZBLAN is lower than Tm:Silica. Despite the lower phonon energies of
the Tm:ZBLAN which increases the radiative transition rate [36], laser performance is
therefore greatly influenced by the nonradiative quenching.
Figure 1.14. Absorption cross-section of Tm:ZBLAN and Tm: Silica [36].
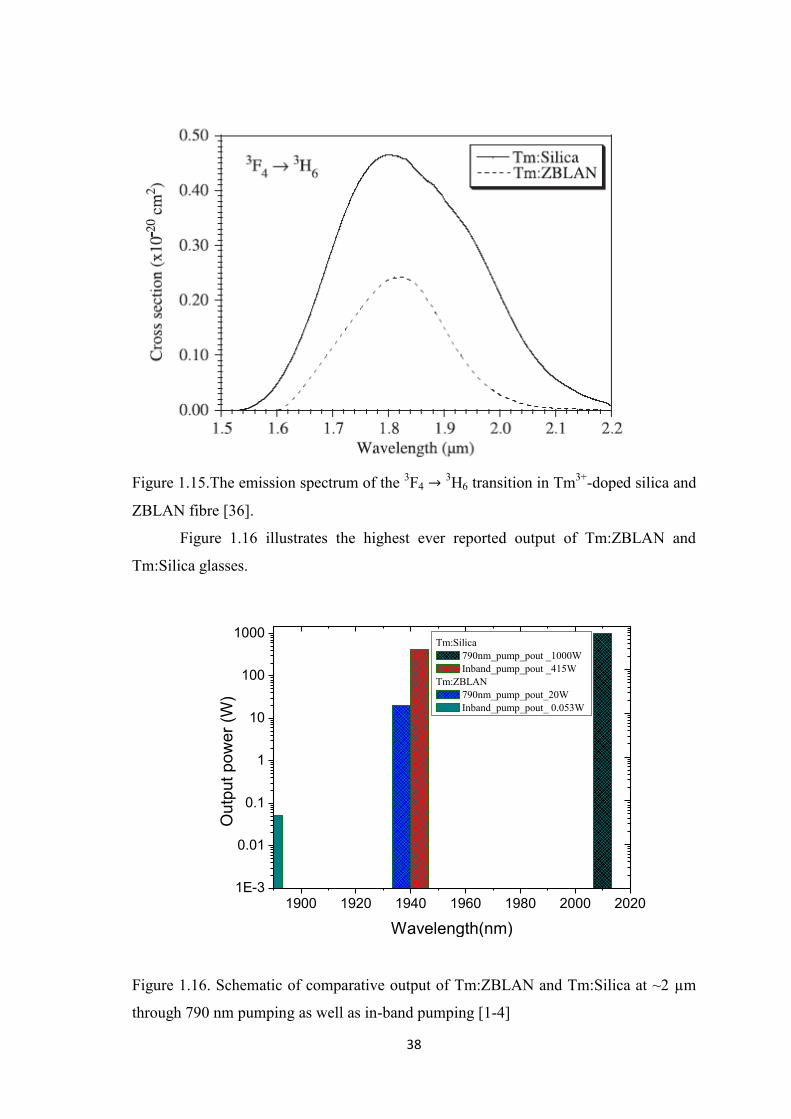
38
Figure 1.15.The emission spectrum of the 3F4 → 3H6 transition in Tm3+-doped silica and
ZBLAN fibre [36].
Figure 1.16 illustrates the highest ever reported output of Tm:ZBLAN and
Tm:Silica glasses.
1900 1920 1940 1960 1980 2000 20201E-3
0.01
0.1
1
10
100
1000
Ou
tpu
t po
we
r (W
)
Wavelength(nm)
Tm:Silica 790nm_pump_pout _1000W Inband_pump_pout _415W
Tm:ZBLAN 790nm_pump_pout_20W Inband_pump_pout_ 0.053W
Figure 1.16. Schematic of comparative output of Tm:ZBLAN and Tm:Silica at ~2 µm
through 790 nm pumping as well as in-band pumping [1-4]

39
It is clear from the Figure 1.16 that Tm:Silica is the most mature technology in efficient
lasing at ~2 µm, using 790 nm pumping and ~1.6 µm in-band pumping. Output powers
from Tm:ZBLAN fibre lasers at ~2 µm is still comparatively low when compared to
Tm:Silica fibre lasers.
1.13 In-Band Pumping Tm:ZBLAN Fibre Laser
As previously mentioned thulium doped fibre lasers operate in eye safe ~ 2 µm
spectral regions and as such has attracted an enormous interest due to its potential
application in medicine, remote sensing and LIDAR. Also discussed previously there
are two main host glasses used for thulium doped fibre lasers around ~2 µm, namely the
thulium doped silica and thulium doped ZBLAN. Various parameters of laser operation,
e.g. threshold pump power, slope efficiency or overall optical to-optical efficiency can
be improved by reducing the quantum defect between the pump wavelength and the
laser wavelength. A method to reduce the quantum defect is in-band pumping directly
into the emitting laser level. It has already shown in Figure 1.6 section 1.8 that the
possible pumping routes are 790 nm and ~1600 nm to develop ~2 μm Tm fibre laser.
For 2 µm lasers using 790 nm pumping, most of the problem associated to the
larger quantum defect ((𝜆p/𝜆l) and low branching ratio to the 3H4 level in thulium [62,
63]. This problem can be solved to the similar way of pumping to the erbium 1.53 μm
transition at 1.48 µm [64], i.e. by pumping to the short wavelength wing of the ground
state absorption.
The development of a thulium doped fibre lasers at 2 µm by in-band pumping at
~1.6 µm offer the advantages of high Stokes limit of up to 84%. Several authors have
reported on Tm:Silica as well as Tm:ZBLAN fibre lasers at ~2 µm using in-band
pumping approaches. A 14% slope efficiency was achieved in a Tm:Silica fibre laser
operating at ~2 µm has been achieved by in-band pumping at 1.61 µm [65]. In 2006,
D.Y. Shen et al. [66] reported an a high power and widely tunable core pumped and
cladding pumped Tm:Silica fibre laser at ~2 µm. It has pumped by a 1565 nm Er:Yb
fibre laser. They used a 3 m double clad fibre with a 30 µm (0.22NA) Er:Yb phospo-
silicate core surrounded by a 400 µm diameter D shaped pure silica inner clad with a

40
NA of 0.49. The reported output at 1.565 nm was 58 W. Using this Er:Yb 1.565 nm
laser as a pump source and using a free running cavity configuration a maximum 17.4
W at 1941 nm was reported. The fibre had a length of 5 m Tm:Silica and had a ~72%
slope efficiency with respect to absorbed pump power. The fibre used is a thulium
doped alumino-silicate core having a diameter of 20 µm and 0.12 NA, surrounded by a
D-shaped pure silica inner cladding with a 200 µm diameter and a 0.49 NA. The
thulium concentration used was ~1.48 wt.% [66]. The effective absorption coefficient
for cladding pumping at 1.565 nm has been reported at ~1.5dB/m. For core pumping a
much shorter length of the fibre (24 cm) was used due to high absorption efficiency
(~150 dB/m). A maximum output of 12.1 W at 1861nm reported with slope efficiency
of 59% with respect to absorb power for the core pumping configuration. A multimode
Tm:Silica fibre laser at 2µm has also been reported through 1.61µm in-band pumping
[67]. They demonstrated the maximum output 370 mW with a 42% slope efficiency.
Moreover using an all fibre format a maximum of 415 W power with a slope efficiency
60% [2] was reported at ~2 µm using 1567 nm pumping. The Tm:ZBLAN fibre has
been pumped with a semiconductor laser at 1.57 µm (FWHM~12 nm) [40], 1.58 µm [4]
and a 1.64 µm pump source generated from a color centre laser (FWHM~0.1 nm) [41].
The slope efficiencies of these Tm-fluoride fibre lasers are generally high (70% to 84%)
and a maximum 2 µm output power achieved so far from an in-band pumped
Tm:ZBLAN fibre is only 53 mW [4]. Therefore, there is great potential to increase the
output power as well as efficiency of Tm:ZBLAN fibre lasers through in-band pumping
scheme.
Figure 1.17 shows the variation of absorption and emission cross section for 3F4-3H6
transition. The graph is reproduced from R. M. Percival et al. [41], where the
fluorescence spectrum has recorded for a short length (≈1 m), of doped fibre by 30 mw
of 790 nm pumping. The Tm3+ concentration was used for this fibre is 1000 ppmw. As
is observed from Figure 1.17, the absorption for 3F4 level starts at 1550 nm and is very
wide. Several authors have used different pump wavelength from 1550 nm to 1660 nm
[4, 40, 41]. Moreover, from Figure 1.17, it also shows that this pump wavelength has
both absorption as well as emission. Choice of the pump wavelength for this band of
pump wavelength is tricky because of the absorption as well as emission [41]. Although
the absorption peak at 1.67 µm in a thulium doped fluoride fibre, it is typically pumped
in the 1.55-1.65 µm wavelength range.
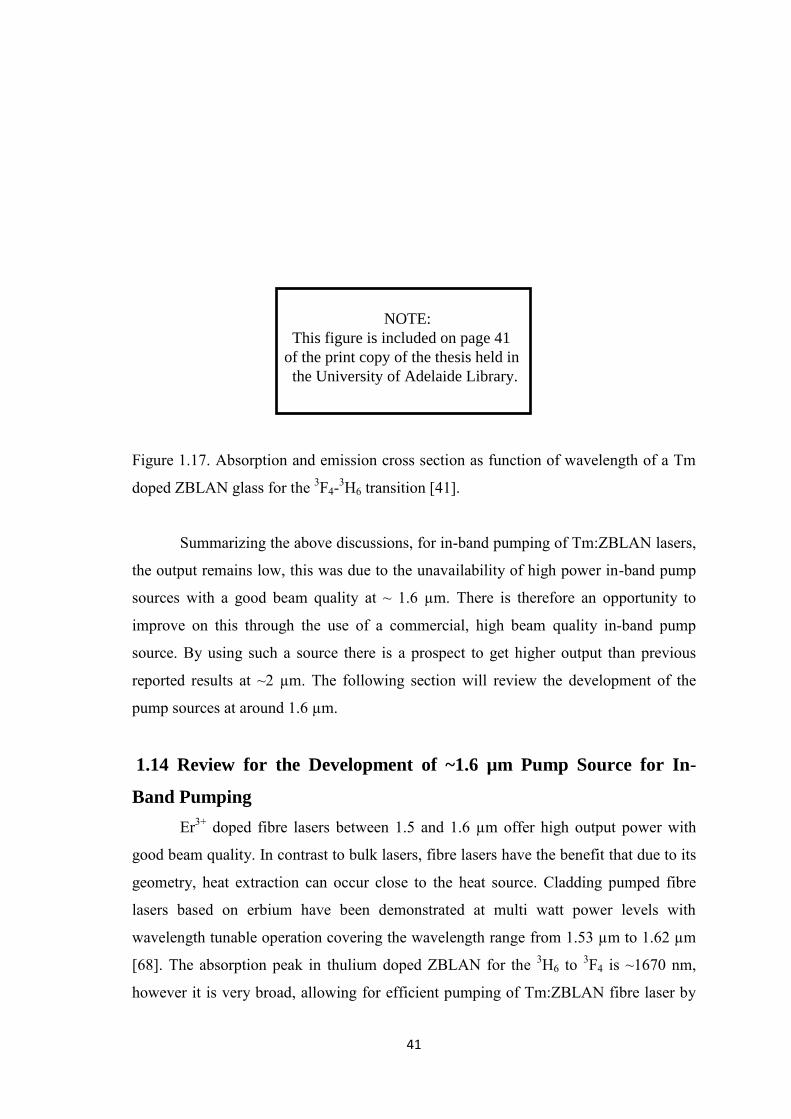
41
Figure 1.17. Absorption and emission cross section as function of wavelength of a Tm
doped ZBLAN glass for the 3F4-3H6 transition [41].
Summarizing the above discussions, for in-band pumping of Tm:ZBLAN lasers,
the output remains low, this was due to the unavailability of high power in-band pump
sources with a good beam quality at ~ 1.6 µm. There is therefore an opportunity to
improve on this through the use of a commercial, high beam quality in-band pump
source. By using such a source there is a prospect to get higher output than previous
reported results at ~2 µm. The following section will review the development of the
pump sources at around 1.6 µm.
1.14 Review for the Development of ~1.6 µm Pump Source for In-
Band Pumping
Er3+ doped fibre lasers between 1.5 and 1.6 µm offer high output power with
good beam quality. In contrast to bulk lasers, fibre lasers have the benefit that due to its
geometry, heat extraction can occur close to the heat source. Cladding pumped fibre
lasers based on erbium have been demonstrated at multi watt power levels with
wavelength tunable operation covering the wavelength range from 1.53 µm to 1.62 µm
[68]. The absorption peak in thulium doped ZBLAN for the 3H6 to 3F4 is ~1670 nm,
however it is very broad, allowing for efficient pumping of Tm:ZBLAN fibre laser by
NOTE: This figure is included on page 41 of the print copy of the thesis held in the University of Adelaide Library.

42
an Er:Yb fibre laser. The good beam quality available from the high power an erbium
fibre laser allows for directly pumping of the core of a thulium doped fibre laser. This
cause pumping also allows for the use of a much shorter length of a fibre. This
approach has an advantage over pumping of of a thulium fibre laser with 790 nm
diodes. Erbium fibre lasers are an excellent pump sources for bulk erbium lasers and
thulium fibre lasers due to the combination of wavelength flexibility, high efficiency
and good beam quality [69]. There are currently two approaches of cladding pumping
erbium fibre lasers emitting at 1.5 µm. One is singly doped with erbium doping and the
other is with Er:Yb co-doping. The main issue of purely erbium doped fibres is the
relatively low achievable doping concentrations due to the detrimental effects of the
onset of ion clustering and simultaneously relatively low values of erbium absorption
cross sections [14]. An alternative approach to overcome the described limitations is
the utilization of Er:Yb co-doped fibres, which are most commonly pumped in the
ytterbium absorption band between 915 nm and 980 nm with diode sources. The
effective absorption coefficient for pump light launched into the cladding of Er:Yb fibre
as a function of pump wavelength is shown in Figure 1.18. In this case the core
diameter of an Er:Yb fibre was 30 μm having numerical aperture 0.22 and the core was
surrounded by a pure silica D-shaped inner-cladding of 400 μm diameter (~360 μm
along the short axis) and the numerical aperture was 0.4. The doping concentration to
the core of Er:Yb fibre was respectively Yb3+ ion (~8.7х1020 cm-3) and Er3+ ion
(~5.1х1019 cm-3). It can be seen from Figure 1.18 that the absorption coefficient for
pump wavelengths in 974-978 nm regime is >6dB/m indicating that relatively short
fibre lengths (< 3m) would be sufficient for efficient pump absorption. For efficient
operation of a cladding pumped Er-doped fibre device it is necessary to co-doped with
Yb3+ ions to increase the pump absorption coefficient and to broaden the absorption
band to better match the emission wavelengths available from high power diode pump
sources. In the pumping scheme of an Er:Yb co-doped fibre as shown in Figure 1.19,
the Yb3+ ions are excited to the 2F5/2 level and the Er3+ ions are then excited via
nonradiative energy transfer from the Yb3+ ion [70, 71]. In addition, to achieve
reasonable efficiency values, strong codoping with Phosphorus is needed to suppress
the back-transfer of energy to the Yb3+ ions, thus allowing for an efficient amplification
of radiation around 1550 nm by using pump light around 976 nm [72]. The maximum
CW power reported to date for a cladding-pumped Er,Yb co-doped fibre laser is 297 W
at 1567 nm [73].
43
Figure 1.18. Effective absorption co-efficient versus pump wavelength [14]
This laser employed a simple resonator configuration with a 6 m long Er,Yb co-doped
double-clad fibre and a 30 µm core diameter with a numerical aperture of 0.21. The
diameter of the D-shaped silica inner cladding was 600 µm. Feedback for lasing was
provided by a perpendicularly cleaved fibre facet and by a butted high reflectivity
mirror. The fibre was pumped by a diode-stack at 975 nm and yielded 297 W of output
at 1567 nm in a beam with M2 parameter of 3.9 for 1.3 kW of pump. 100 W class
single-mode linearly polarized all-fibre sources [74] and wavelength-tunable erbium
fibre sources [75] have also been reported.
It is clear from the above references that the development of ~1.6 µm pump
sources with efficient operation higher outputs have been achieved to use Er:Yb co-
doping fibre rather than erbium doping.
NOTE: This figure is included on page 43 of the print copy of the thesis held in the University of Adelaide Library.

44
Figure 1.19. Energy level diagram of Er:Yb co doped silica [14]
1.15 Summary
As the Tm:ZBLAN has a low phonon energy as well transparency from the visible to
the mid-infrared region, it would be the good choice to pursue Tm:ZBLAN fibre laser
at 2 µm. In-band pumping directly into the emitting laser level is a potential candidate
to increase the efficiency of fibre laser. This can be achieved through currently
available commercial components and the development of a ~1.6 µm source using an
Er:Yb co-doped fibre. The use of a Er:Yb co-doped fibre offers laser outputs at ~1.6 µm
with very good beam quality. With the help of the developed ~1.6 µm source is to the
aim of this research, pump directly into the core of a Tm:ZBLAN fibre. This chapter
has discussed the need for the development of Tm:ZBLAN fibre lasers emitting at 2
µm. It also discussed the importance of 2 µm fibre lasers in the wide variety of potential
applications in the different field of sensing, medical and material processing. This
thesis is devoted to development of a 2 µm Tm:ZBLAN fibre laser through 790 nm
pumping. Following the development of 1.57 µm in-band pump source and it was used
to pump a Tm:ZBLAN fibre laser.
NOTE: This figure is included on page 44 of the print copy of the thesis held in the University of Adelaide Library.

45
Chapter 2
Double Clad Fibre: Comparison of Predicted and Measured
Pump Absorption
2.1 Introduction and Aim
It has already mentioned in Chapter 1, that power scaling in conventional rare-earth-
doped single mode fibres is limited because of poor coupling efficiency from
multimode diode laser arrays to the single mode core of the fibre. To overcome these
problems, double-clad fibres have been developed. A few simple considerations are
needed for an optimum design of a fibre. The pump absorption coefficient in a single
mode core is determined by the absorption cross-section of the dopant in the host glass,
by dopant concentration, and by a reduction factor that in current literature is roughly
approximated by the ratio of inner core area to multimode core area [76]. A large inner
cladding area and high numerical aperture are the prerequisites to ensure high diode
power launch efficiency. On the other hand, a small inner cladding area giving rise the
possibility of increased pump absorption coefficient in the core, as well as reduced
absorption length. As a result, for small inner cladding area, fibre losses are reduced at
laser wavelength due to the reduction of absorption length. Thus, considering the above
two requirements the outer cladding area should be the compromise between these two
for an optimum operation. For the same reason, the core area and numerical aperture
should be high enough to allow a high absorption efficiency of pump power in the
single mode core as well as be able to excite single mode oscillation at laser
wavelength, [77]. Moreover, to increase the pump absorption it is necessary to use a
high doping concentration.
As for the efficient operation of a double clad fibre laser, it is necessary to
understand the pump absorption behaviour for different shapes of a double clad fibre.
So the aim of this chapter is to calculate the pump absorption for different shapes of
Tm:ZBLAN double clad fibre. Further the simulation results would be compared with
the experimental pump absorption measurement of a Tm:ZBLAN double clad fibre.

46
2.2 Review of Pump Absorption Calculation for Double Clad Fibre
Double clad fibre consists of three different layer having step index refractive index
profile from core to outer cladding. The detail has been discussed in previous chapter.
The inner cladding of a double clad fibre act as a power reservoir for pumping waves
and enhances the launching efficiency. On the contrary, it degrades the absorption
efficiency because significant absorption occurs only in the doped core region of a
double clad fibre. To improve the absorption efficiency in double-clad fibres, many
schemes, such as fibre bending [78], multi core fibres [79] etc., have been suggested in
the past years. Among these schemes, DCFs with noncircular inner claddings have been
widely applied [79-81], due to their simplicity and high efficiency. In these DCFs, the
symmetry of light rays is broken and the absorption efficiency is improved by blending
of the pumping waves [76, 82]. This is because; in case of non circular shape of inner
cladding the symmetry of pumping wave is broken as well. Although various cross-
sectional shapes have been employed, in practice, only a few researchers have focused
on the influence of cross-sectional shape on the absorption characteristics of DCF
lasers. The reason can be explained as follows. To calculate the pump absorption
characteristics by solving the wave propagation equation in DCFs it is necessary to
calculate the eigen modes. Generally typical double clad fibre having NA 0.5 and 100
μm inner cladding will support more than 104 eigen modes. Therefore, it will require a
very large amount of computing time and cumbersome to include all these modes in the
calculation. In order to understand the pump absorption of a double clad fibre, different
modelling approaches have been demonstrated [77]. The direct solution of a Maxwell‟s
equation offered by finite difference time domain (FTDT) method [83, 84], is
computationally expensive in restricted spatial dimensions. A beam propagation method
(BPM) can be approximated by the effective index method to reduce a 3D problem to a
2D one, and still it suffers from the need to discretize paraxial wave equation
throughout dense grids [85] over realistic propagation distances, especially when large
and complex geometries are involved [86]. In spite of this, a 3D fast Fourier Transform
(FFT) BPM conducted by Leproux and Fevrier for pump absorption of a double clad
fibre [87]. Liu et al. [88] reported an analytical ray tracing technique to calculate the
pump absorption of circular, offset and rectangular fibre cross-section. They have
demonstrated that the absorption is influenced by the bend radius for circular fibre, but
47
in fibre design with offset core and rectangular inner cladding the bend effect is
negligible. Kouznetsov et al. [89] reported a model for pump absorption in a circular
symmetry double-clad optical fiber amplifier with the paraxial propagation of spatially
random monochromatic light in a fiber with an absorbing core. They reported that pump
absorption is increased due to the mode coupling caused by the fluctuation of refractive
index. They also used the extension of above mentioned technique to calculate
absorption for non-circular cross-sections [86]. Moreover, using an analogy with
quantum mechanics their work has been conducted on double clad fibres with arbitrary
geometries [90]. Furthermore, Mortensen [91] used finite element method (COMSOL
multi physics software) to calculate the fully vectorial eigenmodes for pump absorption
calculation. According to these authors, the calculation of the several hundred modes is
cumbersome.
Recently, I. Dritsas et al. [92] reported a computationally inexpensive method
written in MATLAB to calculate the pump absorption efficiency of a double clad fibre.
They have used a 3D ray tracing technique to record the ray spatial paths occurring
inside the core finite volume elements. This technique is very simple and is validate to
experiment. Therefore in this research ray tracing approach will be used to calculate the
pump absorption for Tm:ZBLAN double clad fibre, to understand the impact of choice
of inner cladding geometry.
2.3 Boundary Condition for Pump Absorption Calculation
MATLAB code written by I. Dritsas et al. [92] has been used for pump absorption
calculation of different cross-section types of a double clad fibre. The motivation is to
understand the pump absorption behavior of different shaped double clad fibres, which
is essential for fibre laser development. Moreover the simulation result would be
compared with measured pump absorption, which will be discussed in later.
Here the pump wavelength 𝜆p = 790 nm is used to calculate the pump absorption
of a Tm:ZBLAN double clad fibre having 8 µm core (0.15NA) and 125 µm inner
cladding (0.50NA) and the doping concentration of 20000 ppm by weight. The
refractive index of core is 1.5075. The inner and outer cladding refractive indices are
1.50 and 1.4142, respectively. In case of outer cladding, the model considered the
refractive index of outer cladding in order to determine the reflection properties back

48
into the inner cladding. For instance for total internal reflection only the refractive index
of the outer cladding is required, as rays are propagated only within the inner cladding.
In this investigation higher numerical aperture of inner cladding has been chosen to
ensure high diode power launch efficiency.
The pump radiation wavelength is transmitted through the various shapes of a
double clad fibre, having the inner cladding diameter of 125 µm. In model [94], it is
assumed that the materials are homogeneous, isotropic and lossless dielectric media.
Moreover further assumption considered in model as follows, the inner cladding
diameter is much larger than the pump wavelength and is suitable for geometrical optics
domain. The interface between inner and outer cladding is an ideal surface, has no
reflective aberration and uniform step refractive index distribution. Under these
conditions the propagated rays in model strictly follow the geometrical optics domain.
Regarding the geometrical boundary condition, it is also assumed that there are no
losses when a pump ray is scattered by a dielectric interface and that during total
internal reflection the refracted energy is negligible compare to the reflected energy
when refraction takes place [92]. Moreover, it is assumed that all rays propagate in the
fibres are independent of each other and have no mode coupling.
2.4 Launched Pump Initial Condition
The pumping scheme considered herein is free space coupling single end pumping, as it
is widely used in the laboratory experiment. All the parameters used for the simulation
is stated in section 2.3. The ray propagation through the fibre is shown in Figure 2.1.
This is accomplished by MATLAB code [92]. The light delivered through a 125 µm
core with a 0.22 numerical aperture. In free space pumping, it is assumed that the
perfectly collimated light is focused into the input facet of a double clad fibre and the
spot size is slightly smaller that the area of a double clad fibre [92]. By assigning a set
of points in the input facet of a double clad fibre, pump photon density distribution is
described in the model. These points represented the spot centre of the incidence pump
photons in the inner cladding. The incident points i.e. the spot centre of incident pump
photons are generated on to equally distant co eccentric circumferences (see Figure 2.1)
which are centred on the fibre axis and cover a circular area defined by the pump
delivering core [92]. Figure 2.1 describes the ray propagation path for different shapes

49
of a double clad fibre. The incident points are shown Figure 2.1 as blue star marks at
the input end of the fibe, while the red line represents the ray propagation path through
the fibre.
(a)
(b)
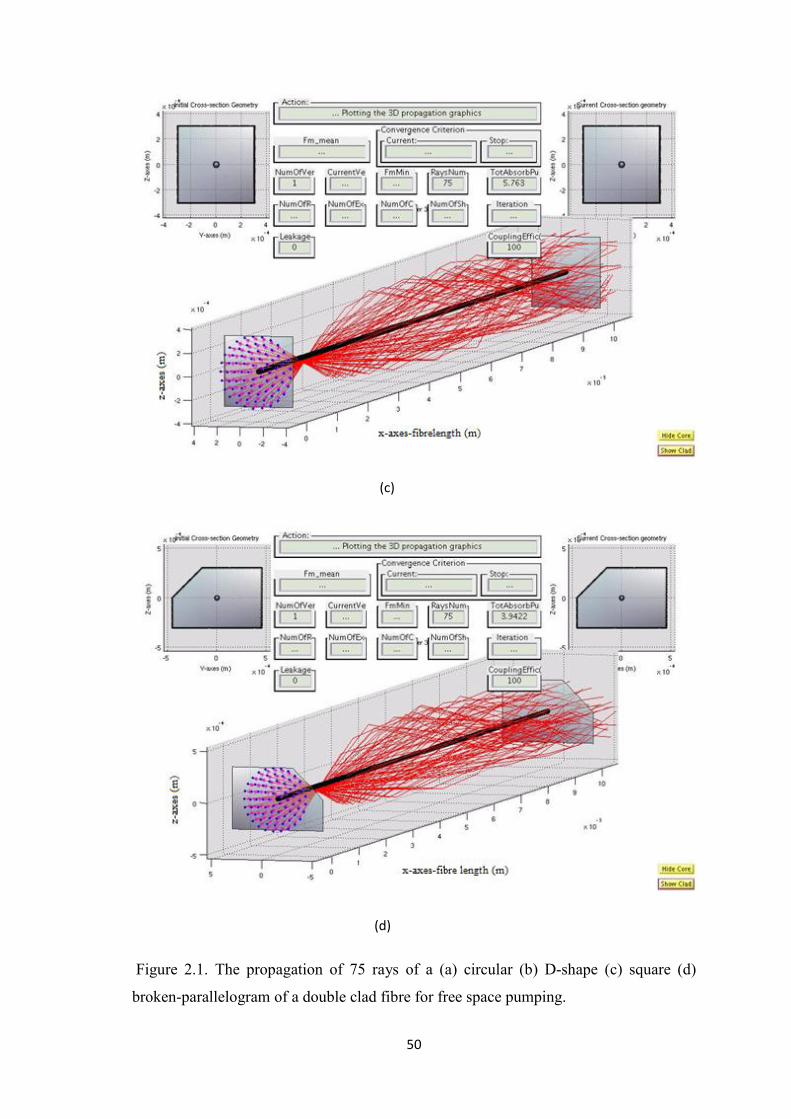
50
Figure 2.1. The propagation of 75 rays of a (a) circular (b) D-shape (c) square (d)
broken-parallelogram of a double clad fibre for free space pumping.
(c)
(d)

51
The energy density distribution of a pump field has also been tested for free
space coupling system. Figure 2.2 shows the pump density distribution for free space
coupling scheme of a double clad Tm:ZBLAN fibre.
Figure 2.2. Normalized overlap image of 936 rays propagated along 0.1 mm length of a
fibre without an absorbing core (a) axially focused free space coupled system and (b)
corresponding cross view in two dimensions.
It is observed from Figure 2.2 that the distribution exhibits the Gaussian shape.
After confirming that the pump density distribution exhibits Gaussian shape, the next
step is to perform a convergence test for the optimum container number for optimum
pump absorption of a double clad fibre.
2.4.1 Optimum Container Number Convergence Test
Container number is a virtual container that segments the core volume of a fibre. When
a ray is passed through the fibre it intersects the core container and transfer its photon
energy to the ion population of a core container and the container records the locally
absorbed power. For optimum absorption of pump wavelength for 1 meter Tm doped
ZBLAN double clad fibre, different container number has been used (see Figure 2.3). In
Figure 2.3 (a), for 8 µm core and 125 µm inner clad, it is observed that for 1000
(a) (b)
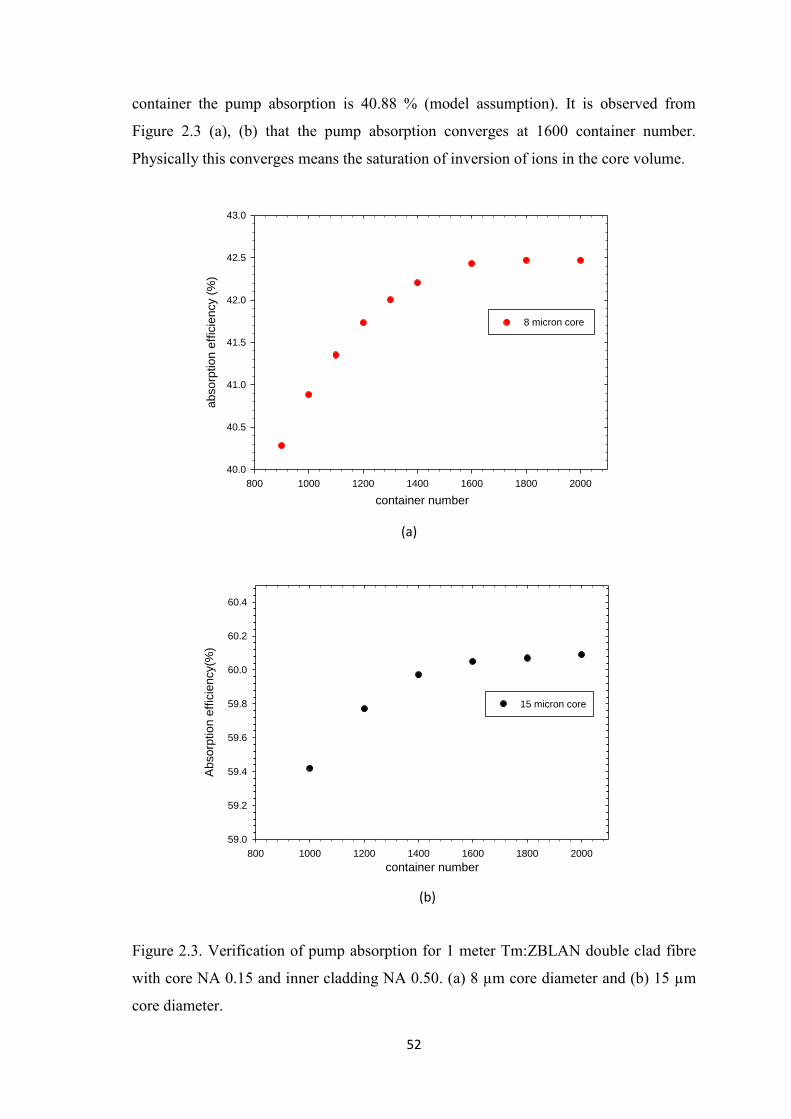
52
container the pump absorption is 40.88 % (model assumption). It is observed from
Figure 2.3 (a), (b) that the pump absorption converges at 1600 container number.
Physically this converges means the saturation of inversion of ions in the core volume.
Figure 2.3. Verification of pump absorption for 1 meter Tm:ZBLAN double clad fibre
with core NA 0.15 and inner cladding NA 0.50. (a) 8 µm core diameter and (b) 15 µm
core diameter.
container number
800 1000 1200 1400 1600 1800 2000
absorp
tion e
ffic
iency (
%)
40.0
40.5
41.0
41.5
42.0
42.5
43.0
8 micron core
container number
800 1000 1200 1400 1600 1800 2000
Absorp
tion e
ffic
iency(%
)
59.0
59.2
59.4
59.6
59.8
60.0
60.2
60.4
15 micron core
(a)
(b)
53
From Figure 2.3 (b) it is observed that the pump absorption is increases due to the
increase of core diameter, but the container number converges to same value, i.e, 1600
as it is observed in Figure 2.3 (a). Thus it can be concluded that for any geometry the
optimum container number remains the same.
2.5 Theory of Pump Absorption
To calculate the pump absorption in this model, each ray considered as coherent stream
of a parallel photons. The flight path of each ray conveyed the propagation of energy by
the photons beam it represents [92]. The core of a fibre segmented into small containers
in order to be able to perform this numerical calculation. When a ray intersects the core,
the path of each ray inside the container is recorded and stored to calculate the pump
absorption. Thulium ion is considered as an active rare earth dopant in ZBLAN glass.
To focus on the influence of pump absorption for different geometries, in model the
absorption starts from when all the ions in the ground state, and finish when it is
inverted. When a ray is passed through the fibre it intersects the core container and
transfer its photon energy to the ion population. This depends on the inversion status of
given containers. The optimum container number for 1 m fibre has chosen 1600, as
discussed detail in container number convergence test, section 2.4.1.
Each ray carries an equal fraction of the photon population launched into double
clad fibre during each time steps (∆𝑡). The number of transmitted photon can be
calculated using the relation Ntrn = Ninc exp −ςρL and the number of locally
absorbed ion is determined by usingNabs = Ninc 1 − exp −ςρL . Where, Ninc is the
number of incident photons, Nabs is the number of absorbed photon, 𝜍 is the absorption
cross section and 𝜌 is the density of unexcited ion inside the container [92]. The
measure of the reduction of the population of unexcited ions inside the container also
gives through the result of absorption. This reduction of population is always compared
against the unexcited ion population left in the container. Therefore the absorption of
photons stopped when all ions have been inverted, indicating a saturated container [92].
The thulium absorption cross section 𝜍 = 0.25 × 10⁻²⁰𝑐𝑚2 at pump wavelength
λp = 790 nm [35] used in the simulation. The thulium concentration, which is 20000
ppm by weight has also been used as supplied by FiberLabs, Japan for Tm:ZBLAN data
sheet. The ground state thulium ion of each container before launching the pump light is

54
given by ρ = CTmNA /VTm
[92], which is equal to the number of thulium ions per cubic
meter of core material, where, CTmis the concentration of thulium in ppm by weight, NA
is the Avogadro‟s constant, VTm is the thulium atomic volume, in cm3. mol-1. After
propagating light through the container the pump absorption for the kth container can
be calculated through the following [92].
Nabs ,tot ,k = Ninc(i,k)
Ri=1
Tj=1 1 − exp(ς ρj,i,k Li,k )
where, R is the number of rays and T is the time steps, Ninc(i,k) is the population of the
ith beam after passing through the k-1containers, ρj,i,k is the ion density of the container
after traversed by all beams that intersects its volume during all j-1 time steps and a
maximum of i-1 beams during the jth time step and 𝐿𝑖 ,𝑘 is the spatial path length of the
ith beam inside the container. Therefore the absorbed pump power is given by [92]
Pabs ,k = Nabs ,tot ,kh cλp TΔtT
j=1 −1
.
Moreover, the cumulative absorption efficiency for the entire (k-1) containers is given
by Ptot ,k% = Pabs ,mkm=1 Pp
−1× 100% .
2.6 Simulation Results
The results reported here for pump absorption calculation of different shapes of a
Tm:ZBLAN double clad fibre using 790 nm pumping. It is noted that the model has
been verified before starting pump absorption calculation. See Appendix for the detail
of model verification.
Tm:ZBLAN double clad fibre having 8 µm core (0.15NA) and 125 µm inner cladding
(0.50NA) and the doping concentration of Tm ion is 20000 ppm by weight. The
refractive index of core is 1.5075. The inner and outer cladding refractive indices are
1.50 and 1.4142, respectively. These parameters here used as in the commercial double
clad fibre supplied by FiberLabs, Horiba, Japan. A 8 µm core Tm:ZBLAN fibre
considered here for pump absorption calculation. According to V parameter, fibre laser
at 2 µm will follow the single mode guidance. As the larger core would lead to the
propagation of higher order transverse modes and the bending loss is significantly
higher for higher order modes compared to the LP01 mode.
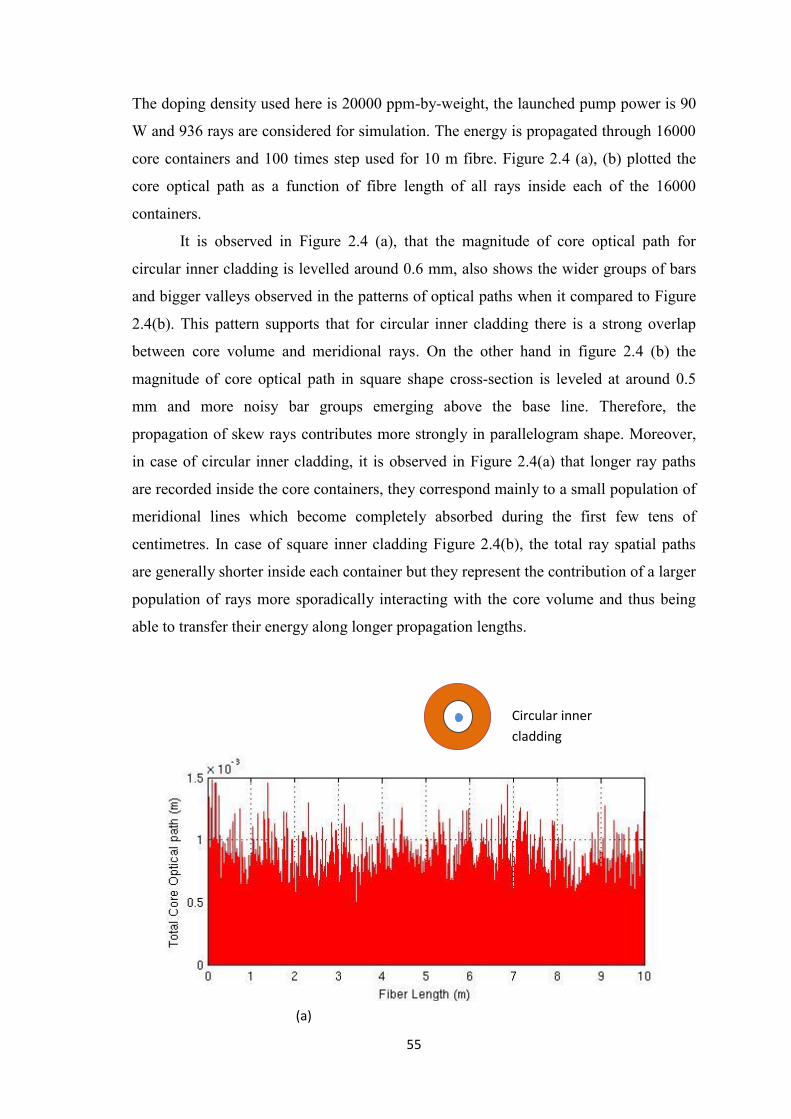
55
The doping density used here is 20000 ppm-by-weight, the launched pump power is 90
W and 936 rays are considered for simulation. The energy is propagated through 16000
core containers and 100 times step used for 10 m fibre. Figure 2.4 (a), (b) plotted the
core optical path as a function of fibre length of all rays inside each of the 16000
containers.
It is observed in Figure 2.4 (a), that the magnitude of core optical path for
circular inner cladding is levelled around 0.6 mm, also shows the wider groups of bars
and bigger valleys observed in the patterns of optical paths when it compared to Figure
2.4(b). This pattern supports that for circular inner cladding there is a strong overlap
between core volume and meridional rays. On the other hand in figure 2.4 (b) the
magnitude of core optical path in square shape cross-section is leveled at around 0.5
mm and more noisy bar groups emerging above the base line. Therefore, the
propagation of skew rays contributes more strongly in parallelogram shape. Moreover,
in case of circular inner cladding, it is observed in Figure 2.4(a) that longer ray paths
are recorded inside the core containers, they correspond mainly to a small population of
meridional lines which become completely absorbed during the first few tens of
centimetres. In case of square inner cladding Figure 2.4(b), the total ray spatial paths
are generally shorter inside each container but they represent the contribution of a larger
population of rays more sporadically interacting with the core volume and thus being
able to transfer their energy along longer propagation lengths.
(a)
Circular inner
cladding

56
Figure 2.4. Image of the core optical path of (a) circular and (b) square inner cladding
shape of a Tm:ZBLAN double clad fibre.
Figure 2.5. Result for pump absorption of a circular, square and d-shape geometry of a
double clad fibre.
Figure 2.5 plotted the absorption efficiency as a function of length of a fibre. In
Figure 2.5, the dotted line shows the absorption for a 125µm straight circular inner
(b)
Square inner
cladding
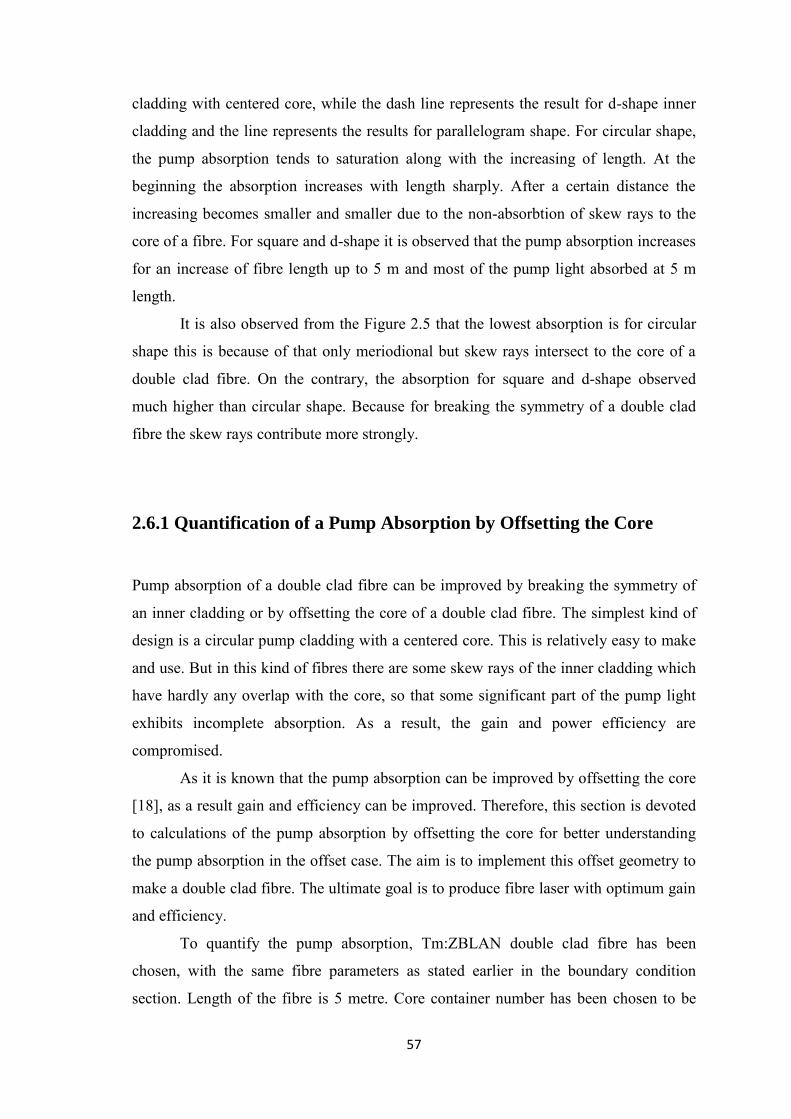
57
cladding with centered core, while the dash line represents the result for d-shape inner
cladding and the line represents the results for parallelogram shape. For circular shape,
the pump absorption tends to saturation along with the increasing of length. At the
beginning the absorption increases with length sharply. After a certain distance the
increasing becomes smaller and smaller due to the non-absorbtion of skew rays to the
core of a fibre. For square and d-shape it is observed that the pump absorption increases
for an increase of fibre length up to 5 m and most of the pump light absorbed at 5 m
length.
It is also observed from the Figure 2.5 that the lowest absorption is for circular
shape this is because of that only meriodional but skew rays intersect to the core of a
double clad fibre. On the contrary, the absorption for square and d-shape observed
much higher than circular shape. Because for breaking the symmetry of a double clad
fibre the skew rays contribute more strongly.
2.6.1 Quantification of a Pump Absorption by Offsetting the Core
Pump absorption of a double clad fibre can be improved by breaking the symmetry of
an inner cladding or by offsetting the core of a double clad fibre. The simplest kind of
design is a circular pump cladding with a centered core. This is relatively easy to make
and use. But in this kind of fibres there are some skew rays of the inner cladding which
have hardly any overlap with the core, so that some significant part of the pump light
exhibits incomplete absorption. As a result, the gain and power efficiency are
compromised.
As it is known that the pump absorption can be improved by offsetting the core
[18], as a result gain and efficiency can be improved. Therefore, this section is devoted
to calculations of the pump absorption by offsetting the core for better understanding
the pump absorption in the offset case. The aim is to implement this offset geometry to
make a double clad fibre. The ultimate goal is to produce fibre laser with optimum gain
and efficiency.
To quantify the pump absorption, Tm:ZBLAN double clad fibre has been
chosen, with the same fibre parameters as stated earlier in the boundary condition
section. Length of the fibre is 5 metre. Core container number has been chosen to be
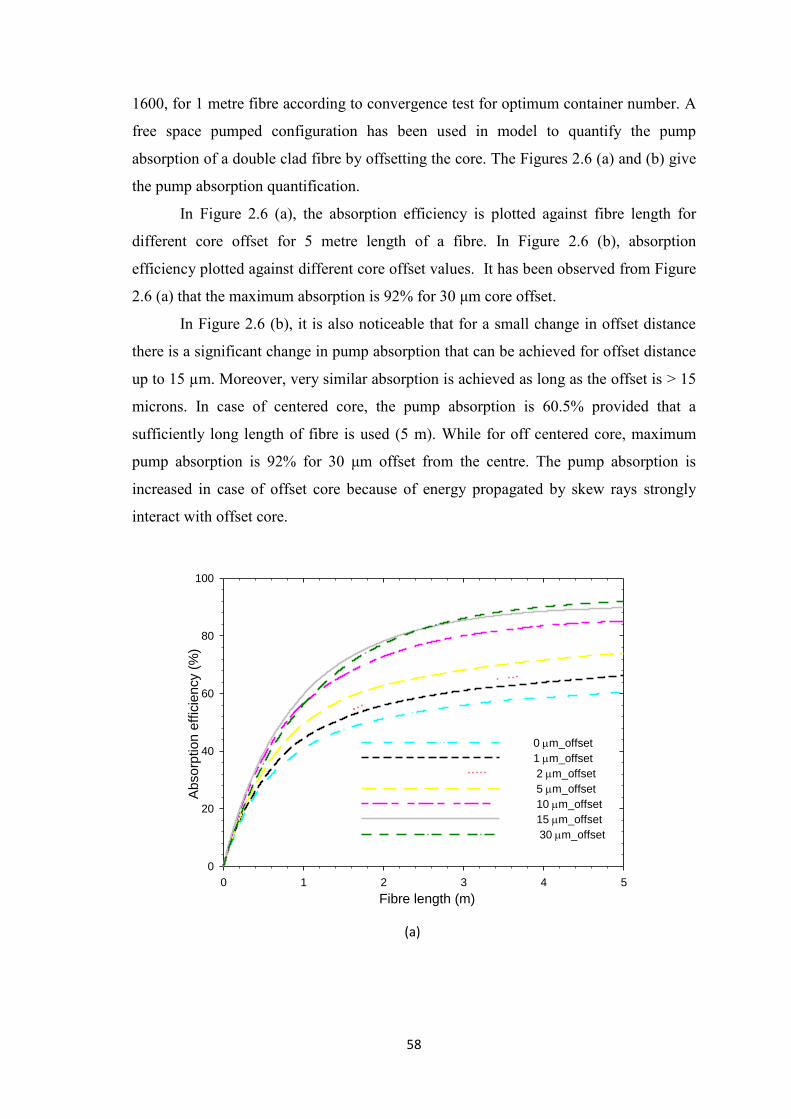
58
1600, for 1 metre fibre according to convergence test for optimum container number. A
free space pumped configuration has been used in model to quantify the pump
absorption of a double clad fibre by offsetting the core. The Figures 2.6 (a) and (b) give
the pump absorption quantification.
In Figure 2.6 (a), the absorption efficiency is plotted against fibre length for
different core offset for 5 metre length of a fibre. In Figure 2.6 (b), absorption
efficiency plotted against different core offset values. It has been observed from Figure
2.6 (a) that the maximum absorption is 92% for 30 μm core offset.
In Figure 2.6 (b), it is also noticeable that for a small change in offset distance
there is a significant change in pump absorption that can be achieved for offset distance
up to 15 µm. Moreover, very similar absorption is achieved as long as the offset is > 15
microns. In case of centered core, the pump absorption is 60.5% provided that a
sufficiently long length of fibre is used (5 m). While for off centered core, maximum
pump absorption is 92% for 30 μm offset from the centre. The pump absorption is
increased in case of offset core because of energy propagated by skew rays strongly
interact with offset core.
Fibre length (m)
0 1 2 3 4 5
Ab
so
rptio
n e
ffic
ien
cy (
%)
0
20
40
60
80
100
0 m_offset
1 m_offset
2 m_offset
5 m_offset
10 m_offset
15 m_offset
30 m_offset
(a)
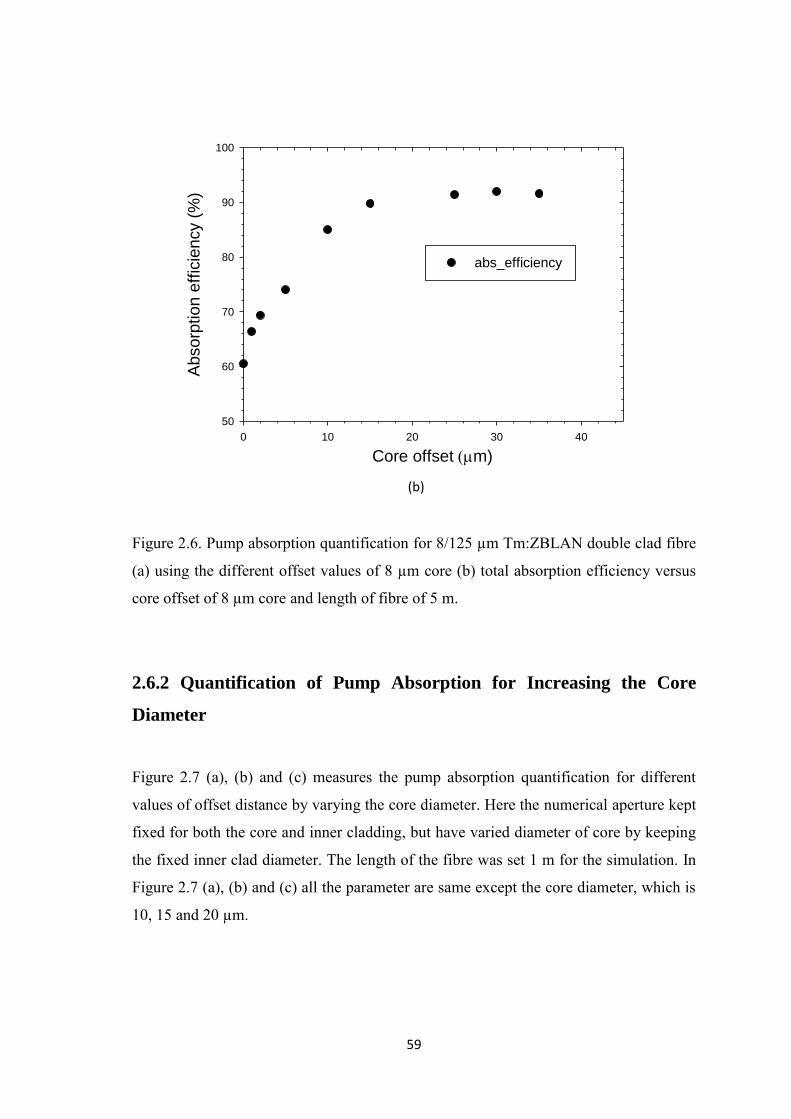
59
Figure 2.6. Pump absorption quantification for 8/125 µm Tm:ZBLAN double clad fibre
(a) using the different offset values of 8 µm core (b) total absorption efficiency versus
core offset of 8 µm core and length of fibre of 5 m.
2.6.2 Quantification of Pump Absorption for Increasing the Core
Diameter
Figure 2.7 (a), (b) and (c) measures the pump absorption quantification for different
values of offset distance by varying the core diameter. Here the numerical aperture kept
fixed for both the core and inner cladding, but have varied diameter of core by keeping
the fixed inner clad diameter. The length of the fibre was set 1 m for the simulation. In
Figure 2.7 (a), (b) and (c) all the parameter are same except the core diameter, which is
10, 15 and 20 µm.
Core offset m)
0 10 20 30 40
Absorp
tion e
ffic
iency (
%)
50
60
70
80
90
100
abs_efficiency
(b)

60
Fibre length (m)
0.0 0.2 0.4 0.6 0.8 1.0
Ab
so
rptio
n e
ffic
ien
cy(%
)
0
20
40
60
80
100
0 m
1 m
2 m
5 m
(a)
Fibre length (m)
0.0 0.2 0.4 0.6 0.8 1.0
Ab
so
rptio
n e
ffic
ien
cy (
%)
0
20
40
60
80
100
m
1 m
2 m
5 m
(b)
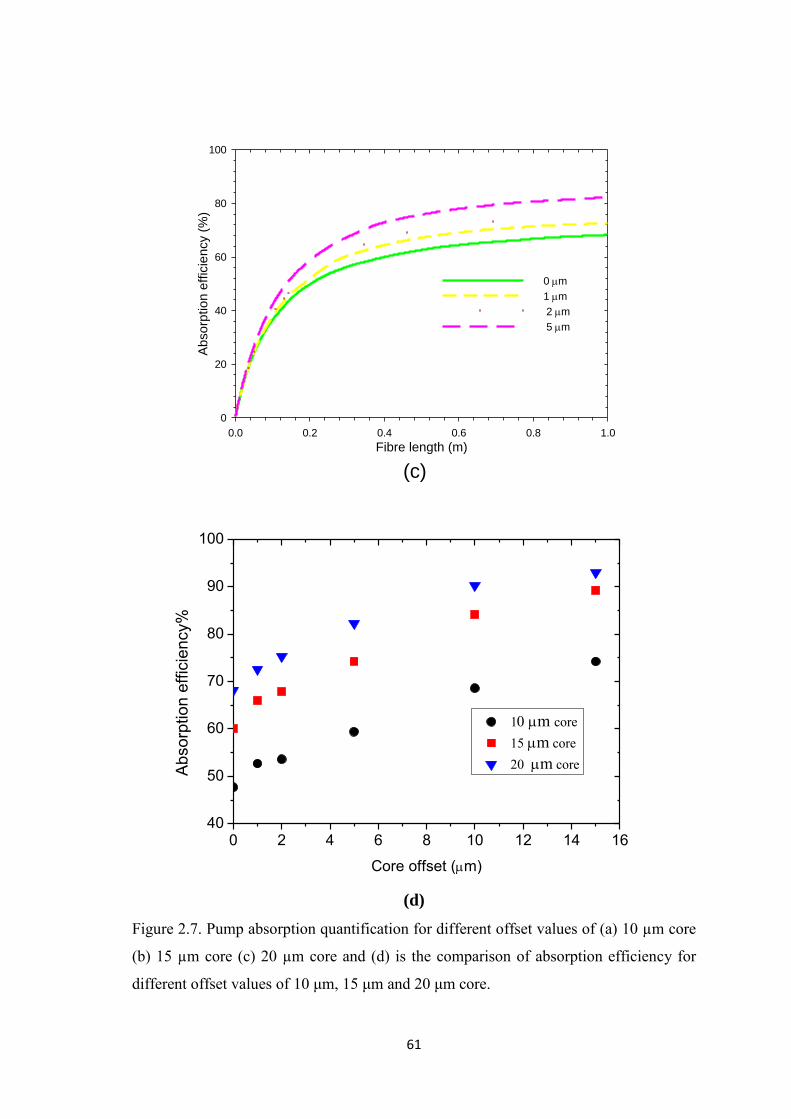
61
0 2 4 6 8 10 12 14 1640
50
60
70
80
90
100
1m core 15m core 20 m coreA
bsorp
tion e
ffic
iency%
Core offset (m)
(d)
Figure 2.7. Pump absorption quantification for different offset values of (a) 10 µm core
(b) 15 µm core (c) 20 µm core and (d) is the comparison of absorption efficiency for
different offset values of 10 μm, 15 μm and 20 μm core.
Fibre length (m)0.0 0.2 0.4 0.6 0.8 1.0
Ab
so
rptio
n e
ffic
ien
cy (
%)
0
20
40
60
80
100
0 m
1 m
2 m
5 m
(c)

62
As it is observed in Figure 2.7 (a) that for 10 µm core, at 0 µm offset values the
pump absorption is 47.7% and it increases as the offset distance increases. An increase
of the offset distance by 1 µm increases the pump absorption to 52.7%, i.e. an
improvement of 5% absorption. For an offset 2 µm, the pump absorption increases, but
not in the same rate as 1 μm offset, because the skew rays interaction mostly happen
just for offsetting the core. In Figure 2.7 (b) pump absorption is also increases with the
increase of offset distance. Here for 15 micron core at 0 µm offset values, the pump
absorption is 60%, whereas, for 1µm offset distance this value reaches to 66%, i.e. 6%
pump absorption increases. The maximum absorption at 5 µm offset is 74.3%. In Figure
2.7(c) maximum absorption at 5 µm offset is 82.2%. Figure 2.7 (d) shows the relative
picture of offset distance versus absorption efficiency for 1metre length of a fibre. In
Figure 2.7 (d), the circle represents the pump absorption for 10 µm core, the square
represents for 15 µm core and the lower triangle in the legend but upper curve in the
Figure represents the 20 µm core diameter of a fibre. Here it is observed that for
increasing the core diameter as well as increasing the offset distances the pump
absorption also increases. The maximum pump absorption for 10 micron core at 15 μm
offset distance is 74%, for 15 μm core it is 89% and for 20 μm core it is 93%.
2.7 Summary
Pump absorption calculation of a double clad fibre presented above in this chapter
demonstrates that the pump absorption increases by breaking the symmetry of a double
clad fibre. Moreover, pump absorption can also be increased by increasing the core
diameter, as well as offset distance. This means that, a short length of fibre can be used
to absorb the pump power for fibre laser operation. Non absorptive losses also reduced
because of a reduction of length of fibre. However, increasing the core size creates core
waveguides that are no longer single mode. The presence of higher order modes lead to
degradation in the output beam quality, but most of the application requires diffraction
limited beam quality. Therefore, it is required to choose a fibre design such that it has
small core diameter with non circular symmetry as well as core offset. Within this
approach one can maintain the single mode guidance, as well as high gain and
efficiency for fibre laser operation.

63
2.8 Experimental Measurement of Pump Absorption of a
Tm:ZBLAN Double Clad Fibre
To compare with model results it is necessary to measure the pump absorption
experimentally. Therefore, the pump absorption is measured through the cut-back
experiment. Before starting cut-back measurement, a 35 W 790 nm limo diode has been
characterised. The efficiency of a diode was 0.9 W/A. Apart from this; diode fluctuation
has also been measured to check the stability of a diode power. The detail of diode
characterisation and fluctuation measurement has given later in appendix section.
2.8.1 Cut-back Experiment
In this section, the experimental pump absorption measurement through cut-back
method is discussed. The aim is to compare the measured absorption with numerical
results. A destructive cut-back technique [93] has been employed in a commercial Tm
doped ZBLAN double clad fibre to calculate the pump absorption. A 790 nm light
coming through a 100 µm patch fibre used an input source for the experiment. The
schematic diagram and experimental setup for cut-back absorption measurement is
shown in figure 2.8. After collimating 790 nm pump source, a 4% Fresnel reflection
power has been used as an input and focused with appropriate optics to couple the
pump light to the Tm:ZBLAN fibre (see diode characterization in appendix section for
detail). A 10.34 m Tm:ZBLAN double clad fibre has been chosen for the experiment. In
order to remove the polymer coating from the fibre, the fibre ends were put in a
dichloromethane (DCM) for about 3 minutes and then stripe the fibre using cleaning
tissue. It is noted that the commercial Tm:ZBLAN double clad fibre has two layers of
coating and it is very fragile. Therefore the fibre handled very carefully and the second
coating removed from the fibre by using Acetone in the cleaning tissue, and stripe until
the second coating is completely removed. After removing the polymer coating from
the fibre ends, it has been cleaved using YORK clever. After cleaving, both ends of the
fibre are placed on V groove upon nano stages. The collimated light is properly coupled
into the inner cladding of a Tm:ZBLAN double fibre. After launching the pump light
into the input end of the fibre, the launching condition kept unchanges. The cleaving
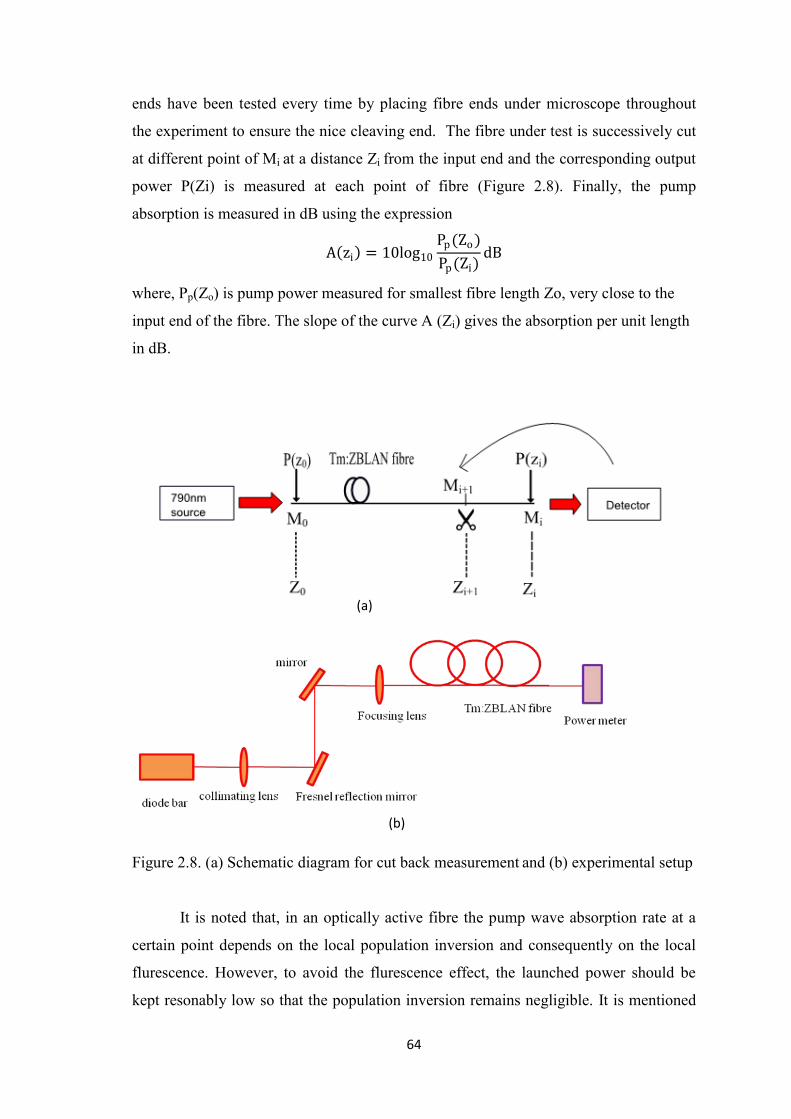
64
ends have been tested every time by placing fibre ends under microscope throughout
the experiment to ensure the nice cleaving end. The fibre under test is successively cut
at different point of Mi at a distance Zi from the input end and the corresponding output
power P(Zi) is measured at each point of fibre (Figure 2.8). Finally, the pump
absorption is measured in dB using the expression
A zi = 10log10
Pp(Zo)
Pp(Zi)dB
where, Pp(Zo) is pump power measured for smallest fibre length Zo, very close to the
input end of the fibre. The slope of the curve A (Zi) gives the absorption per unit length
in dB.
Figure 2.8. (a) Schematic diagram for cut back measurement and (b) experimental setup
It is noted that, in an optically active fibre the pump wave absorption rate at a
certain point depends on the local population inversion and consequently on the local
flurescence. However, to avoid the flurescence effect, the launched power should be
kept resonably low so that the population inversion remains negligible. It is mentioned
(b)
(a)

65
in appendix section that, the diode power fluctuates at low input. In order to satisfy the
experimental condition diode has been operated in high power and a Fresnel reflection
of 4% reflective power has been used as an input power (Figure 2.8(b)), wich is
launched to an input facet of fibre.
Figure 2.9. Pump absorption measurement of a Tm:ZBLAN double clad fibre.
Figure 2.9 shows the pump absorption measurement using cut-back technique. It
is observed from figure that the pump absorption of Tm:ZBLAN double clad fibre is
0.77 dB/m. Using this measured absorption, the next step is to compare the model
absorption of Tm:ZBLAN double clad fibre.
2.9 Comparison of Pump Absorption Between Model and Experiment
The Tm:ZBLAN double clad fibre was supplied by FiberLabs. The fibre data sheet did
not provide any information regarding the fibre core, in particular no information was
provided about whether it is centred or off centred within the cladding, therefore a
microscope image of the end face of Tm:ZBLAN fibre as shown in Figure 2.10, was
taken. After post processing and careful observation of this picture reveals that the core

66
is off centred by about 5 µm. After confirmation of the fact that the core is off centred, a
MATLAB code is used to calculate the absorption for a fibre of 10 m length, with
cntred core as wll as off centred. The analysis is performed as follows.
Figure 2.10. Microscopic image of a (a) Tm:ZBLAN double clad fibre and (b)
coreresponding postprocessing image
Initially it has been consider the same unit length of a fibre of cut back method and then
reduced the simulation length gradually and the corresponding pump absorption is
(a)
(b)
Core offset
50 μm
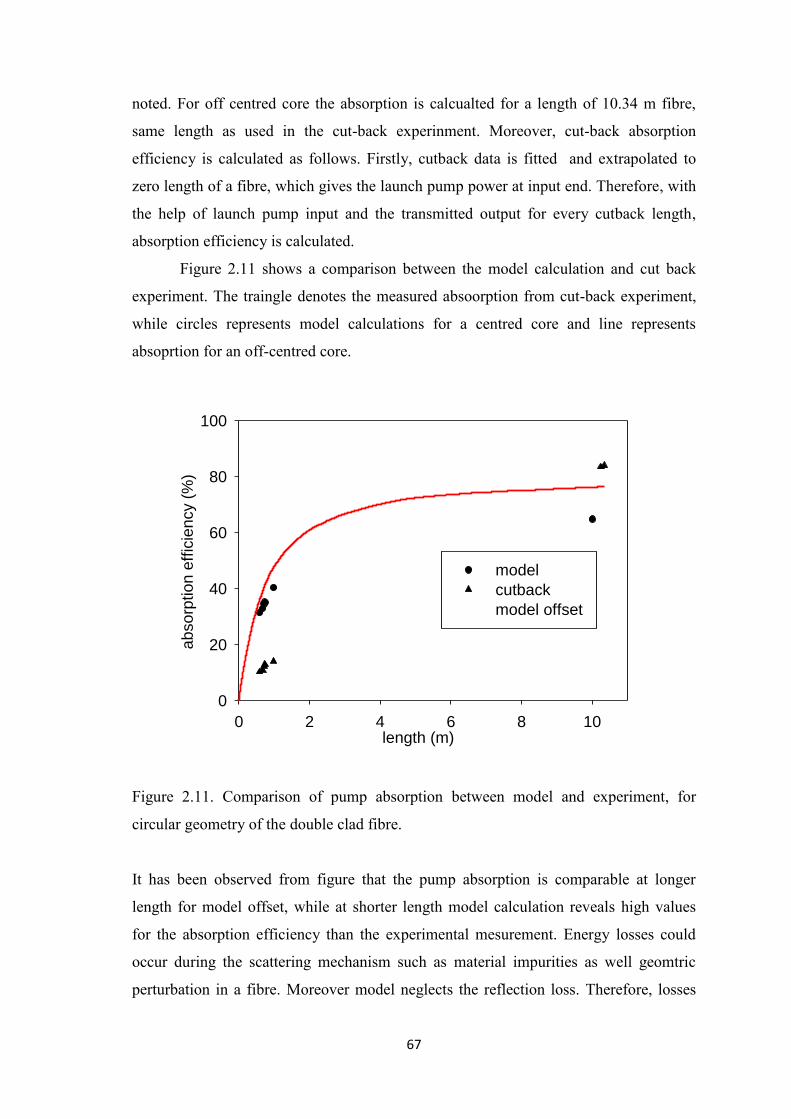
67
noted. For off centred core the absorption is calcualted for a length of 10.34 m fibre,
same length as used in the cut-back experinment. Moreover, cut-back absorption
efficiency is calculated as follows. Firstly, cutback data is fitted and extrapolated to
zero length of a fibre, which gives the launch pump power at input end. Therefore, with
the help of launch pump input and the transmitted output for every cutback length,
absorption efficiency is calculated.
Figure 2.11 shows a comparison between the model calculation and cut back
experiment. The traingle denotes the measured absoorption from cut-back experiment,
while circles represents model calculations for a centred core and line represents
absoprtion for an off-centred core.
Figure 2.11. Comparison of pump absorption between model and experiment, for
circular geometry of the double clad fibre.
It has been observed from figure that the pump absorption is comparable at longer
length for model offset, while at shorter length model calculation reveals high values
for the absorption efficiency than the experimental mesurement. Energy losses could
occur during the scattering mechanism such as material impurities as well geomtric
perturbation in a fibre. Moreover model neglects the reflection loss. Therefore, losses
length (m)0 2 4 6 8 10
absorp
tion e
ffic
iency (
%)
0
20
40
60
80
100
model
cutback
model offset

68
can be taken into model, and thus the absorption efficiency are expected to shift
towards lower level at a shorter length of a fibre. There might be two other possibilities
to differ experimental result from model calculation. Firstly in model calculation effect
of fibre bending was not considered for pump absorption calculation. Secondly for cut-
back measurement we measured absorption at 10 metre and below 1 metre length only.
For more accuracy of measurement it could be performed the cut back experiment
repeatedly througout the whole length of fibre. But we had limited length of
commercial fibre and was needed to perform fibre laser experiment.
2.10 Conclusion
It can be concluded from above simulation as well as experimental analysis that, the
pump absorption is favourable when the symmetry of a double clad fibre is broken.
This is due to the fact that in circular fibres the skew rays never interact to the core.
Pump absorption can be improved by increasing the inner clad diameter as well as off
centred core. Therefore, for appropriate design of a double clad fibre, it is necessary to
understand the pump absorption behaviour, which is essential to develop the fibre laser
in an efficient way.
69
Chapter 3
Development of 2 µm Tm:ZBLAN Double Clad Fibre Laser
3.1.1 Introduction
In Chapter 1 it has been discussed that fibre lasers offer an attractive alternative to
conventional bulk lasers. It has also discussed the detail of lasers operating ~ 2 µm
spectral region have a wide variety of potential application such as free space
communication, remote sensing and medicine are of primary interest. Moreover it has
also discussed about the potentiality of developing Tm:ZBLAN fibre laser at ~ 2 μm.
Therefore this chapter will describe studies and experiments aimed at the development
of efficient Tm:ZBLAN fibre lasers operating at 2 µm. Moreover, in-house Tm:ZBLAN
fibre characterisation will also be investigated.
3.1.2 Experimental Setup
The experimental set up for the development of ~ 2 μm fibre laser is shown in Figure
3.1. Tm:ZBLAN double cald fibre has been used for this experiment, which is supplied
by FiberLabs Inc. Japan. The core diameter of a Tm:ZBLAN fibre is 8 µm (NA 0.15),
and inner clad diameter 125 µm (NA 0.50) with a thulium doping concentration of
20000 ppm by weight. The circular inner-cladding diameter was surrounded by low
refractive index polymer as outer cladding. The V number of Tm:ZBLAN fibre is 1.88
at 2 μm. The length of a Tm:ZBLAN double clad fibre used for this experiment was
5.45 m. The fibre was coiled around a 10 cm diameter aluminium cylinder for cooling
to avoid the heating of a fibre. The main body of the fibre was cooled through a cooling
fan. The absorption of the fibre was measured using the cut-back technique [93], to be
0.76 dB/m. Therefore, for a 5.45 m fibre pump absorption efficiency was 62%. As it is
evident from the microscopic image of Tm:ZBLAN double clad fibre that the core is 5
μm offset from the centre (see Figure 2.10, chapter 2), therefore we followed the

70
cutback absorption as explained in chapter 2, to measure the absorption of a 5.45 m
fibre.
Figure 3.1. Cladding pumping Tm:ZBLAN fibre laser.
The pump source was a 790 nm laser diode with a 100 µm patch fibre (made in
Germany by LIMO GmbH). For collimating and focusing lenses with foci f=26 mm and
f=20 mm have been used. After collimating and focusing, 790 nm light has been
coupled to Tm:ZBLAN fibre and optimised for maximum coupling. After optimisation
output power is recorded. Therefore the launch efficiency to the fibre was calculated by
measuring the difference of input power and transmitted output power along with power
absorbed to the fibre, which is 92%. It is noted that absorbed power is calculated by
using cut-back absorption.
The resonator cavity was formed by butting a dichroic mirror to the input facet
of the fibre, which has high transmission at 790 nm and has high reflectivity at 2000
nm, along with a 4% Fresnel reflection of the rear end of the fibre. Moreover a dichroic
mirror having high reflectivity of a 0%, 20% and 30% at 2000 nm has also been butted
to the output end to measure the performance of fibre laser at ~2 µm. Here 0%
reflectivity at 2000 nm output coupler butted to the output end of fibre to examine fibre

71
laser spectrum at ~2 μm laser. It is noted that index matching gel was not used to
mitigate against Fresnel reflection.
3.1.3 Results and Discussions
A maximum 1.53 W output Tm:ZBLAN fibre laser at 1960 nm has been demonstrated.
The threshold value for this laser was 0.0138 W and the slope efficiency was 45% with
respect to launch pump power, as shown in Figure 3.2 (b).
The performance of laser output has been analysed for single end forward pumping
resonator system using a different reflective output coupler as follows. Initially the
resonator cavity was formed by butting the dichroic mirror which has high reflectivity
at 2000 nm and high transmitivity at 790 nm to the input end of the fibre and the output
fibre end ~4% Fresnel reflectivity act as an output coupler. An uncoated Si slice has
been used to separate the lasing signal from the pump light. Laser output was
collimated and focused to the monochromator. After confirmation of laser spectrum at ~
2 µm, the output power was recorded using a power metre. The output power is plotted
against the launched power which is shown in Figure 3.2. It is observed from Figure
3.2(a) the slope efficiency of laser output at ~ 2 µm is 19.5%.
Moreover, resonator cavity was also formed by keeping input coupler mirror
fixed (HR at 2000 nm), a 20% and 30% reflectivity dichroic mirror butted to the output
end of the fibre as an output coupler to measure the output at ~ 2 µm. The maximum
recorded output is 1.53 W and the slope efficiency is 45% shown in Figure 3.2(b) for an
output coupler mirror of high reflectivity at 790 nm and 20% reflectivity at 2000 nm.
For a mirror of output coupler, high reflectivity at 790 nm and 30% reflectivity at 2000
nm, the slope efficiency becomes 42% with output 1.41 W as shown in figure 3.2(c). It
also observed that laser performance depended on the reflectivity of the output coupler
mirror. It is observed from Figure 3.2 that the maximum output is observed at 20%
reflectivity of output coupler mirror at 2000 nm. Figure 3.2, also shows that increasing
the output coupler reflectivity‟s causes the decrease of slope efficiency of Tm:ZBLAN
fibre laser.

72
0 1 2 3 40.0
0.5
1.0
1.5
2.0
Outp
ut la
ser
po
wer
(W)
Launched pump power
0 1 2 3 40.0
0.5
1.0
1.5
2.0
Outp
ut la
ser
po
wer
(W)
Launched pump power
(a) η = 19.5% (R=4% Fresnel reflections)
(b) η = 45% (R=20%)

73
0 1 2 3 40.0
0.5
1.0
1.5
2.0
Outp
ut la
ser
po
wer
(W)
Launched pump power (W)
Figure 3.2. Laser output for (a) 4% Fresnel reflections and Si filter (b) 20% and (c)
30% reflectivity output coupler.
The output spectrum was measured by monochromator for different output
coupler reflectivities. Figure 3.3 shows the out spectrum for different cavity reflectivity
of a single end pumping system.
Wavelength (nm)
1850 1900 1950 2000 2050
No
rma
lise
d in
ten
sity (
arb
. u
nits)
0.0
0.2
0.4
0.6
0.8
1.0
1.2
(a) R=0%
(c) η = 42% (R=30%)

74
Figure 3.3. Output spectrum at ~1.95 µm for (a) R=0%, (b) R=20%, (c) R=30% mirror
at 2 μm as an output coupler.
It is observed from figure 3.3 (a), (b) and (c) that the output varies from 1950 nm to
1970 nm. The lasing wavelength is between 1.95 µm to 1.97 µm depending on the
cavity reflectivities. Apart from this, the output was also observed for both the forward
and backward direction successively by using 0%, 20% and 30% reflective output
coupler mirror at 2000 nm. The output is shown in Figure 3.4 (a), (b) and (c). For 0%
Wavelength (nm)1850 1900 1950 2000 2050
No
rma
lise
d in
ten
sity (
arb
. u
nits)
0.0
0.2
0.4
0.6
0.8
1.0
1.2
(b) R=20%
Wavelength (nm)
1800 1850 1900 1950 2000 2050
No
rma
lise
d in
ten
sity (
arb
. u
nits)
0.2
0.4
0.6
0.8
1.0
1.2
(c) R=30%
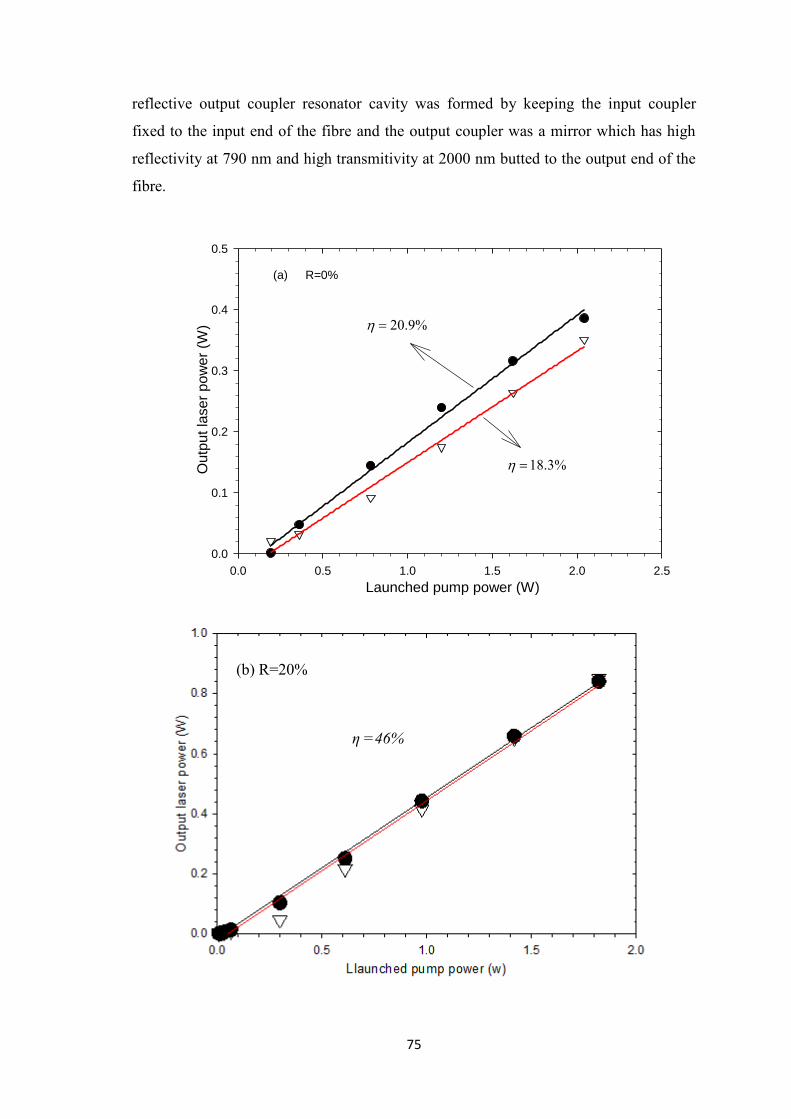
75
reflective output coupler resonator cavity was formed by keeping the input coupler
fixed to the input end of the fibre and the output coupler was a mirror which has high
reflectivity at 790 nm and high transmitivity at 2000 nm butted to the output end of the
fibre.
Launched pump power (W)
0.0 0.5 1.0 1.5 2.0 2.5
Ou
tpu
t la
se
r p
ow
er
(W)
0.0
0.1
0.2
0.3
0.4
0.5
%9.20
%3.18
(a) R=0%
(b) R=20%
η =46%
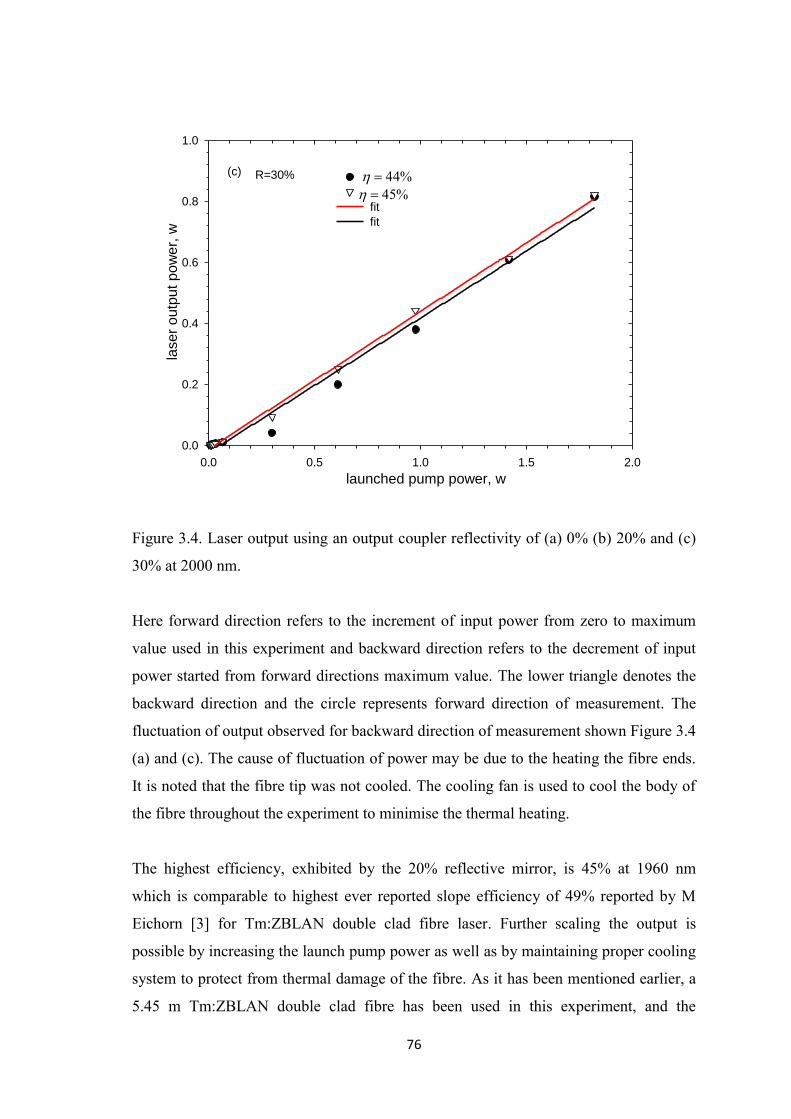
76
Figure 3.4. Laser output using an output coupler reflectivity of (a) 0% (b) 20% and (c)
30% at 2000 nm.
Here forward direction refers to the increment of input power from zero to maximum
value used in this experiment and backward direction refers to the decrement of input
power started from forward directions maximum value. The lower triangle denotes the
backward direction and the circle represents forward direction of measurement. The
fluctuation of output observed for backward direction of measurement shown Figure 3.4
(a) and (c). The cause of fluctuation of power may be due to the heating the fibre ends.
It is noted that the fibre tip was not cooled. The cooling fan is used to cool the body of
the fibre throughout the experiment to minimise the thermal heating.
The highest efficiency, exhibited by the 20% reflective mirror, is 45% at 1960 nm
which is comparable to highest ever reported slope efficiency of 49% reported by M
Eichorn [3] for Tm:ZBLAN double clad fibre laser. Further scaling the output is
possible by increasing the launch pump power as well as by maintaining proper cooling
system to protect from thermal damage of the fibre. As it has been mentioned earlier, a
5.45 m Tm:ZBLAN double clad fibre has been used in this experiment, and the
launched pump power, w
0.0 0.5 1.0 1.5 2.0
lase
r o
utp
ut
po
we
r, w
0.0
0.2
0.4
0.6
0.8
1.0
fit
fit
%45
%44R=30%(c)
77
absorption of pump light was 62%. Therefore, the fibre length was not long enough to
absorb the pump power in one pass. To increase further absorption of pump power a
second mirror could be placed at the output end with required HR coating at the pump
wavelength. Therefore the slope efficiency could be increased further by reflecting the
unabsorbed pump power back to the cavity throughout using a mirror coated with HT at
790 nm.
3.1.4 Summary
A Tm:ZBLAN fibre laser operating at 2 µm has successfully been demonstrated using
different reflective output coupler mirror. The highest slope efficiency and maximum
power achieved were 45% and 1.53 W, respectively, using 20% reflective output
coupler. Further output could be scaled but to avoid the damage of fibre ends these
experiments were not conducted for further higher output. The lasing wavelength is
between 1.95 μm to 1.97 μm depending on the various cavity reflectivities. Moreover
laser performance for both forward and backward direction is observed. Fluctuation of
output observed for backward direction of measurement due to the heating of fibre
ends.

78
3.1.5 In house Tm:ZBLAN double clad fibre Fabrication and
Characterization
This section will describe about the fibre fabrication and characterization of a
Tm:ZBLAN double clad fibre. The aim of this in house double clad Tm:ZBLAN fibre
fabrication and characterisation is to make a fibre laser at 2.3 μm.
3.1.5.1 Fibre Fabrication
In-house step index ZBLAN fibre has fabricated through extrusion technique (rod-in–
tube) [94] as follows (Fabrication by A/Prof. Heike Ebendorff Heidepriem). Cladding
glass composition was used as the common ZBLAN glass composition 53ZrF4-20BaF2-
4LaF3-3AlF3-20NaF. Core index of the glass was increased by replacing the 2 mol%
BaF2 with PbF2. The billets are creating by melting raw materials (in powder form).
When this melts is cast into a mould and cooled down they become billets of about 3x3
cm. The core glass was extruded into a doped 10 mm diameter rod and the cladding
glass was extruded into a tube of hexagonal outer and inner circular shape. The next
step was the extruded core glass rod was drawn down to a cane of 2 mm size outer
diametre. Before fibre drawing, the rod was etched in ZrOCl2/HCl solution to achieve a
pristine surface [95]. The cane is therefore inserted into an extruded hexagonal tube.
This assembly is then drawn down to fibre, by applying a vacuum over the core cane
and cladding tube interface.
3.1.5.2 Numerical Aperture (NA) Measuring Principle
For optical fibres, NA is a very important parameter. It can be used to estimate injection
efficiency and coupling loss, and is very important for coupling of fibre to fibre and free
space light to fibre. In this case we are interested in measuring the NA as it will allow
us to calculate the core refractive index achieved by the addition of the PbF2. It is noted
that, to increase the core refractive index of ZBLAN fibre part of BaF2 replaced with
the PbF2.
The standard measurement of acceptance angle is the NA, which is the sin of the
half acceptance angle, θa, for reasonable small angle, as shown in Figure 3.5
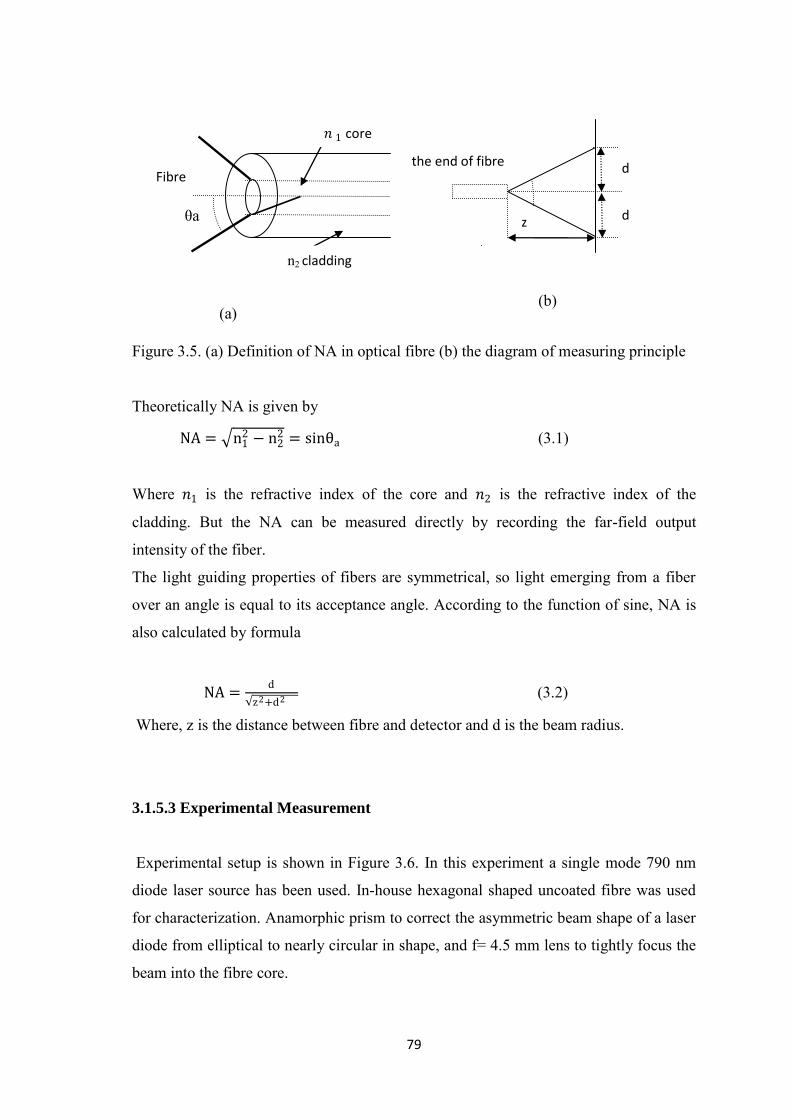
79
Figure 3.5. (a) Definition of NA in optical fibre (b) the diagram of measuring principle
Theoretically NA is given by
NA = n12 − n2
2 = sinθa (3.1)
Where 𝑛1 is the refractive index of the core and 𝑛2 is the refractive index of the
cladding. But the NA can be measured directly by recording the far-field output
intensity of the fiber.
The light guiding properties of fibers are symmetrical, so light emerging from a fiber
over an angle is equal to its acceptance angle. According to the function of sine, NA is
also calculated by formula
NA =d
z2+d2 (3.2)
Where, z is the distance between fibre and detector and d is the beam radius.
3.1.5.3 Experimental Measurement
Experimental setup is shown in Figure 3.6. In this experiment a single mode 790 nm
diode laser source has been used. In-house hexagonal shaped uncoated fibre was used
for characterization. Anamorphic prism to correct the asymmetric beam shape of a laser
diode from elliptical to nearly circular in shape, and f= 4.5 mm lens to tightly focus the
beam into the fibre core.
(b) (a)
z
d the end of fibre
d
𝑛 1 core
Fibre
axis
n2 cladding
θa n2
cl
ad
di
ng

80
3.6. Experimental setup for a far-field light distribution measurement.
A Spiricon silicon CCD camera (SP5103) was used to capture the output beam of the
fibre and it was analyzed by the computer. The beam width was measured by an inbuilt
Gaussian fit routine in the software. To eliminate the light propagating in the cladding a
high refractive index highly absorbing paint was applied to the fibre („absorptive
surface coating‟).
First the experiment was set up and then aligned properly to ensure the light was
effectively coupled into the fibre. A short pice of fibre was taken and then cleaved at
both ends. After cleaving the fibre ends it was placed in between the focusing lens and
the detector to measure the beam width. By measuring the beam width as well as the
distance of the fibre end to the detector we measured the NA of the fibre using equation
3.2.
Three pieces of fibre were chosen to measure the NA. For the first fibre the
length was 33 cm and an absorptive surface coating was placed after 18 cm, in the
second one the length of the fibre was 27 cm and absorptive surface coating was put
after 9 cm and in case of third piece of fibre length was 32 cm and „absorptive surface
coating‟ was placed after 19 cm. The measured value is shown in the table 3.1.

81
Table 3.1. Data for NA measurement.
Distance Z (mm) Beam width 2d
(mm)
NA Average NA
8.53 0.48 0.028 0.030
0.53 0.031
0.57 0.033
8.53 0.68 0.039 0.037
0.57 0.033
0.686 0.040
8.53 0.717 0.042 0.039
0.667 0.039
0.628 0.036
This corresponds to a NA of 0.035 ± 0.005. Therefore assuming a refractive index of
Tm:ZBLAN glass 1.495 at 790 nm, the core refractive index is 1.4954 ± 0.0001,
therefore the ∆𝑛, the index difference between core and cladding is 0.0004 ± 0.0001.
The original fibre recipe included 2.2 mol% PbF2, which was predicted to increase by
0.0015 however measurements indicate only 27% of the predicted ∆𝑛 was achieved. In
the future, we will measure the refractive index of our core and cladding glasses to
provide insight into the predicted NA.
The cross-sectional view of the fibre ends was checked under the microscope as
shown in Figure 3.7. The aim was to correlate the measured values with the cross
viewed image and to check whether an air gap existed. One of challenges is to achieve a
defect free interface between the core and cladding glass. It was found that there was no
air gap between the core and cladding in the measured fibre end faces and the measured
NA‟s were consistent. Cut-back absorption measurement of in-house fabricated fibre
will describe in the following section.
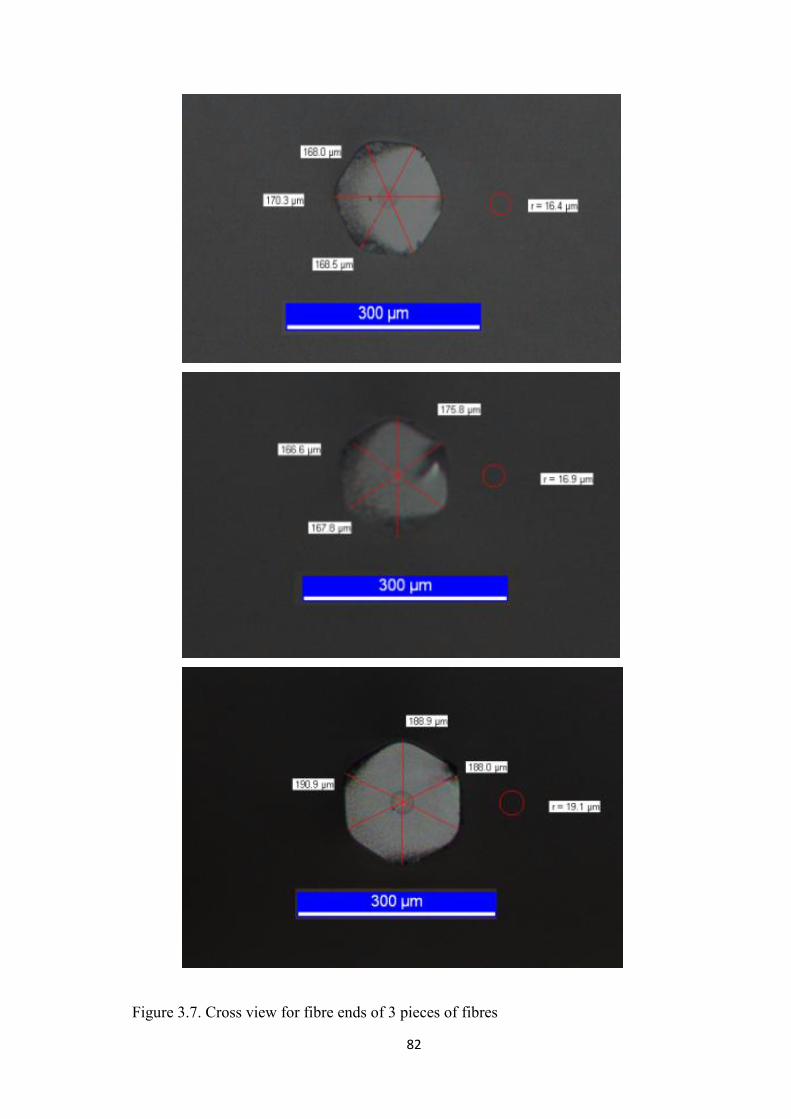
82
Figure 3.7. Cross view for fibre ends of 3 pieces of fibres

83
3.1.5.4 Cut-back Measurement
Cut-back experiment is performed along with my co-supervisor David G. Lancaster. To
conduct this measurement the 35 W fibre coupled (100µm) 790 nm diode laser was
coupled into approximately 1.5 m of the fibre using a 100 µm spot size (pump fibre
output was imaged into the test fibre using a pair of f=25 mm aspheric lenses).
The resultant cutback is shown in figure 3.8, with an absorption measured of 10.9
dB/m. The predicted core absorption for this doped fibre was 1.4 dB/m (0.27 wt%
Thulium), based on the geometry of the fibre and extrapolated from measured thulium
absorptions at 790 nm for higher doped Tm:ZBLAN bulk samples. Therefore the
estimated loss of the fibre was 9.5 dB/m. The high loss is likely due to incomplete
fusing of the core/cladding interface. From Figure 3.9 it also observed that the core
cladding interface of the fibre was not good.
Figure 3.8. Cut-back measurement of the Tm:ZBLAN fibre.
y = -10.86x - 8.129
-25
-20
-15
-10
-5
0
0 0.5 1 1.5
10
Lo
g10
(P)
Length (m)
ZBLAN fibre
10Log10(P)
Linear (10Log10(P))

84
Figure 3.9. Photos of the Tm: ZBLAN fibre guiding 790 nm light in the cladding,
highlighting the discrete scattering regions.
3.1.5.5 Summary
The core refractive index was measured to increase by 0.0004 (27% of the predicted
value) with the addition of 2.2 mol% of PbF2. The loss of the fibre was measured by a
cut-back method with a result of 9.5 dB/m loss (at 790 nm), which is approximately an
order of magnitude too high to consider operating this fibre as a laser especially on the
low gain 2.3 µm transition. The higher loss is due to the tiny holes at the interface
between the core and cladding region in the fibre (Figure 3.9). To reduce the loss of the
fibre the outer and inner surface of the tube should be etched prior to fibre drawing to
achieve a pristine surface [97]. A defect free interface between the core and cladding
glass is prerequisite to achieve low fibre loss. Therefore future work will focus on
further reducing the fibre loss through optimization of fibre drawing conditions and
demonstration of lasing at 2.3 μm.

85
3.2 Development of Er:Yb Fibre Laser at 1570 nm
3.2.1 Introduction and Aim
Fibre lasers operating in the wavelength range of 1.5-1.6 µm have several advantages,
such as eye safe nature, good atmospheric transmission and low fibre loss. Such an
advantage of ~1.6 µm wavelength makes fibre laser of great importance in many
scientific and engineering applications. For example, free space communication, range
finding as well as light imaging detection and ranging (LIDAR) [96]. Cladding pumped
Er:Yb fibre lasers offer the prospect of high output power at 1.5 µm to 1.6 µm with a
high beam quality. Moreover, Er:Yb fibre lasers provide an attractive feature of
wavelength flexibility. Cladding pumped erbium fibre lasers have been demonstrated at
multi-Watt levels covering the wavelength range of 1.53- 1.62 µm [68]. So the
combination of wavelength flexibility, good beam quality, as well as high efficieny
makes erbium fibre laser excellent pump source for bulk erbium lasers and thulium
fibre lasers. Er:Yb co-doped fibres depend on indirect pumping of the lasing erbium
ions through nonradiative energy transfer from Yb ions [70, 71]. This Yb co-doping
improves the pump absorption, which is essential to scale the output power through
cladding pumping.
Therefore, Er:Yb co-doped fibre has been used in this experiment. The aim of
this experiment is to develop watt level output of a 1570 nm source with good beam
quality, which will be used as an in-band pump source to develop 2 µm Tm:ZBLAN
fibre laser.
3.2.2 Er:Yb Absorption Calculation at 980 nm
It has already mentioned in Chapter 1, section 1.14, that the Er:Yb absorption is more
favourable at 975~9080 nm band than 915 nm (see Figure 1.18 in Chapter 1). The SM-
EYDF-6/125-HE double clad fibre is supplied by NUFERN. The minimum peak
cladding absorption at 915 nm is 0.6 B/m and maximum one is 0.9 dB/m, of this Er:Yb
co-doped fibre. However we need to measure the cladding absorption of Er:Yb fibre at
980 nm. As the NUFERN data sheet did not provide any absorption at 980 nm
therefore, by using Er:Yb absorption spectra, absorption can be calculated at 980 nm.

86
From Er:Yb absorption graph (Figure 1.18 in chapter 1) the cladding absorption at 915
nm was calculated to be 1.47dB/m and at 980 nm it is 7dB/m. Therefore the ratio
between this two absorption is 7/1.47=4.8. Using this factor the minimum cladding
absorption at 980 nm of Er:Yb co-doped fibre becomes 0.6*4.8=2.9 dB/m and
maximum is 0.9*4.8= 4.3 dB/m.
Figure 3.10 describes the absorption as a function of fibre length for 4m Er:Yb fibre. It
has observed from above graph that the minimum absorption of Er:Yb for 4m is
93.14% and maximum 98.12%.
Figure 3.10. Er:Yb absorption calculation for 980 nm pumping.
3.2.3 Fibre Bragg Grating (FBG) Transmission Measurement
Before going to develop 1.57 μm Er:Yb fibre laser source, FBG reflectivity has been
verified interms of transmission measurements as follows. Experimental setup to
measure the transmission of FBG is shown in figure 3.11. A FBG supplied by
TeraXion, Canada was inscribed into the core of passive Germanium doped fibre
(GDF) fibre. A supercontinuum white light source has been used to measure the
Fibre length (m)
0 1 2 3 4 5
Absorp
tion (
%)
0
20
40
60
80
100
2.9 dB/m
4.3 dB/m

87
reflectivity of a FBG. After stripping both ends of the passive fibre, it has been properly
cleaned using methanol and been cleaved using YORK cleaver.
Figure 3.11. FBG transmission measurement set up.
Figure 3.12. A FBG transmission spectrum measured using supercontinuum source

88
After cleaving the image from the fibre ends was observed using Ericsson splicer. The
cleaved ends of the fibre were placed on the V-groove of nanosatges. The white light
was coupled to the fibre using microscope objectives and optimised light to the core of
a passive fibre. The collimated output was expanded using a 100xs objective. Cladding
light was suppressed by using Carbon DAG on both ends. Moreover, an aperture was
used to filter the cladding mode and observe the transmission of the FBG using an
Optical Spectrum Analyser (OSA) but no transmission appeared. Then paint stripper
was put in 20 cm away from the rear ends of the fibre to strip the coating. After
stripping, high refractive index paint (absorptive surface coating) was applied on the
exposed fibre to totally suppress the cladding mode.
After ensuring that the light was guided in the core an IR camera was placed at
the output to optimise the light to the core. The output signal is injected to the OSA to
measure the transmission. The output spectrum of passive fibre is shown in Figure 3.12.
It has been confirmed from the transmission measurement graph that the reflectivity of
FBG is around 1570 nm.
3.2.4 Experimental Setup to Develop 1.57 µm Fibre Laser
Figure 3.13 below gives the experimental set up for the development of 1.57µm Er:Yb
fibre laser. Using absorption 4.3dB/m, it has been observed from Figure 3.10, that the
maximum absorption at 980 nm is 98.13% for 4 m fibre. Therefore a 4 m long fibre has
chosen for the experiment. The ER:Yb double clad fiber supplied by NUFERN having
inner clad diameter 125 µm with NA 0.46, and the core diameter 6 µm with NA 0.18.
Therefore the V number of Er:Yb fibre is 2.43. Also a passive FUD-3236 1550-GDF
fibre has been used in this experiment. A FBG having reflectivity >99% at 1570 nm
inscribed to the core of a passive GDF fibre (TERAXION supplied the FBG). The core
NA of the passive fibre is 0.12 and mode field diameter (MFD) 11.2 µm and the inner
clad diameter 126 µm with NA 0.46. The V number of the passive fibre is 2.7.
After removing the coating from passive GDF end and active Er:Yb fibre it was
properly cleaned using methanol. Then the fibre ends were cleaved using YORK
cleaver. Thereafter, the passive GDF fibre end and active Er:Yb fibre end were placed
on the Ericsson splicer and the cleaving end was observed. The left view angle 0.06,
right view angle -0.17 as well as left gap angle 0.27 and right gap angle 0.29 noted.

89
Therefore, by pressing the fusion button fibre becomes spliced and the splicing loss was
observed 0.02 dB in Ericsson splicer. After splicing the passive end with active Er:Yb
fibre, the GDF fibre end cleaved at an angle 5.4 degree to avoid the end Fresnel
reflection. The cleaved fibre end then placed on v-groove of a nano stage.
Figure 3.13. Experimental setup for the development of 1570 nm Er:Yb fibre laser.
It is noted that 980 nm 15 W diode has been characterised before started the
experiment (see appendix section). A 980 nm light is coupled to the passive GDF fibre
using f=26 mm and f=15 mm focal length lenses for collimating and focusing. A FBG
which has reflectivity 99.88% acts as an input coupler. The resonator cavity was formed
using a high reflective FBG input coupler along with a ~4% Fresnel reflection of rear
ends of the fibre. A pump mirror which has HR (900-990 nm) >99.9% and HT (1500-
1650 nm) >98% butted to the rear side of the fibre to separate the lasing signal from
pump laser wavelength. A cooling fan used to cool the fibre to avoid the thermal
damage.

90
3.2.5 Results and Discussions
Initially fibre laser output was not demonstrated at 1570 nm. Therefore we discuss the
procedure required to develop 1570 nm laser. The experiment was conducted in a
different way to get 1570 nm output using FBG as a high reflective input coupler.
Firstly, a FBG was spliced with 3 m Er:Yb codoped fibre and then recoated at
the splicing region. After recoating the splicing region, it was placed on a microscope
slide very carefully and kept for few hours. The Er:Yb fibre wrapped in a 10 cm
diameter aluminium cylinder. Both ends of fibre were placed on V-groove of nano
stages and light was coupled to the fibre through collimating and focusing lens. The
output end of the fibre was butted to the mirror which has HR at 900-990 nm and HT at
1500-1650 nm. Output signal was analysed using a monochromator and the peak
wavelength showed at 1545 nm (Figure 3.14). So it was supposed that splicing might be
an issue, and re-spliced the FBG but left uncoated and followed the same procedure as
stated earlier, but the output signal remain unchanged.
Figure 3.14. Output spectra at 1545 nm.
Wavelength (nm)
1350 1400 1450 1500 1550 1600 1650 1700 1750
Norm
alis
ed inte
nsity (
arb
. units)
0.0
0.2
0.4
0.6
0.8
1.0
1.2
1.4
Expt.1
Expt. 2
Expt. 3

91
Therefore, to verify the accuracy of measurement of a monochromator it was calibrated
for 2nd order wavelength using HeNe source but the calibration of monochromator was
alright.
Thereafter, fibre was spliced again and we kept the grating straight and also kept
the splicing part on microscope slide and got same results i.e. peak at 1545 nm.
Then, again spliced FBG and kept on microscope slide in such a way so that the
splicing region left untouchable. Here longer length (4 m) of Er:Yb fibre used to test
whether the wavelength shift or not but the result remains unchanged as shown in figure
3.14. As the FBG is not working properly therefore it has been anticipated that it is
necessary to measure reflectivity of FBG. The measured reflectivity in terms of
transmission of FBG showed in Figure 3.12. It is noted that the transmission experiment
were performed to verify the reflectivity of FBG is at 1570 nm and discussed detailed in
section 3.2.3.
After confirmation of FBG reflection spectra at 1570 nm, AR coating of input
coupler lenses was checked using OSA. Therefore, 980 nm source was realigned
properly. In order to suppress the Fresnel reflection the input end of passive fibre was
angle cleaved using YORK cleaver and the angle was 5.5degree. The light was
therefore coupled to fibre and observed the output spectrum using monochromator. The
output shows the same as at 1545 nm. It was observed then that the mode of passive
GDF fibre and active Er:Yb fibre is mismatched. The mode field diameter of passive
fibre is 11.2 μm while the mode field diameter of active fibre is 6μm. The calculated V
number of passive fibre is 2.7 and active fibre is 2.43. To suppress the higher order
modes the FBG kept straight and about 20 cm GDF passive fibre wrapped on 1 inch
chuck and the output signal checked using monochromators and it observed that the
output is at 1545 nm (Figure 3.14).
The next step was wrapping the active Er:Yb fibre also in 1 inch chucks around 20 cm
in order strip the higher order modes. The output signal observed at the
monochromators and the spectrum found at 1570 nm as given in Figure 3.15 (length of
the fibre was 3.85 m). Therefore, output was recorded using power metre. It is noted
that initially active Er:Yb fibre was not cooled. It has been observed that the slope
efficiency with respect to the pump power is 17.2% Figure 3.16 (a). The slope
efficiency increased much higher when the cooling fan is used to cool the fibre (Figure
3.16 (b). The maximum efficiency of the fibre with respect to the pump power is
28.2%. Efficiency could be improved further, if the fibre was not miss mode matched.

92
Laser diode pump power (W)
0.0 0.2 0.4 0.6 0.8 1.0
La
se
r o
utp
ut
po
we
r (W
)
0.00
0.02
0.04
0.06
0.08
0.10
0.12
%2.17
(a)
Due to the mode mismatched a significant amount of light lost because of stripping the
higher order modes.
1350 1400 1450 1500 1550 1600 1650 1700 1750
0.0
0.2
0.4
0.6
0.8
1.0
1.2
Norm
alis
ed inte
nsity (
arb
. units)
Wavelength (nm)
Figure 3.15. The output spectrum of a Er:Yb fibre laser at 1570 nm.

93
(b)
Laser diode pump power (W)0 1 2 3 4
La
se
r o
utp
ut
po
we
r (W
)
0.0
0.2
0.4
0.6
0.8
1.0
1.2
%2.28
Figure 3.16. Laser output at 1570 nm for Er:Yb double clad fibre (a) without cooling
(b) with cooling
3.2.6 Beam Quality Measurement
Measurement and analysis of laser beam characteristics is essential for laser based
application such as welding, cutting, cleaning etc. Generally beam characterisation
involves measurement of the beam spatial energy density distribution, which is referred
to as the beam profile. Beam profile analysis provides an insight of the beam spatial
characteristics such as size, shape, position, propagation mode structure properties and
beam quality (M2). The parameter M2 can be calculated using the following equation
[97].
𝑀2 =𝜋𝒲0𝜃𝑜
𝜆 (3.3)
where, 𝒲0 is the beam waist or spot size and θ0 is the cone half angle as shown in
Figure 3.17 (a). It is noted that for M2 =1 the beam becomes perfect Gaussian beam.
The higher M2 value causes the poor beam quality, as in this respect the beam
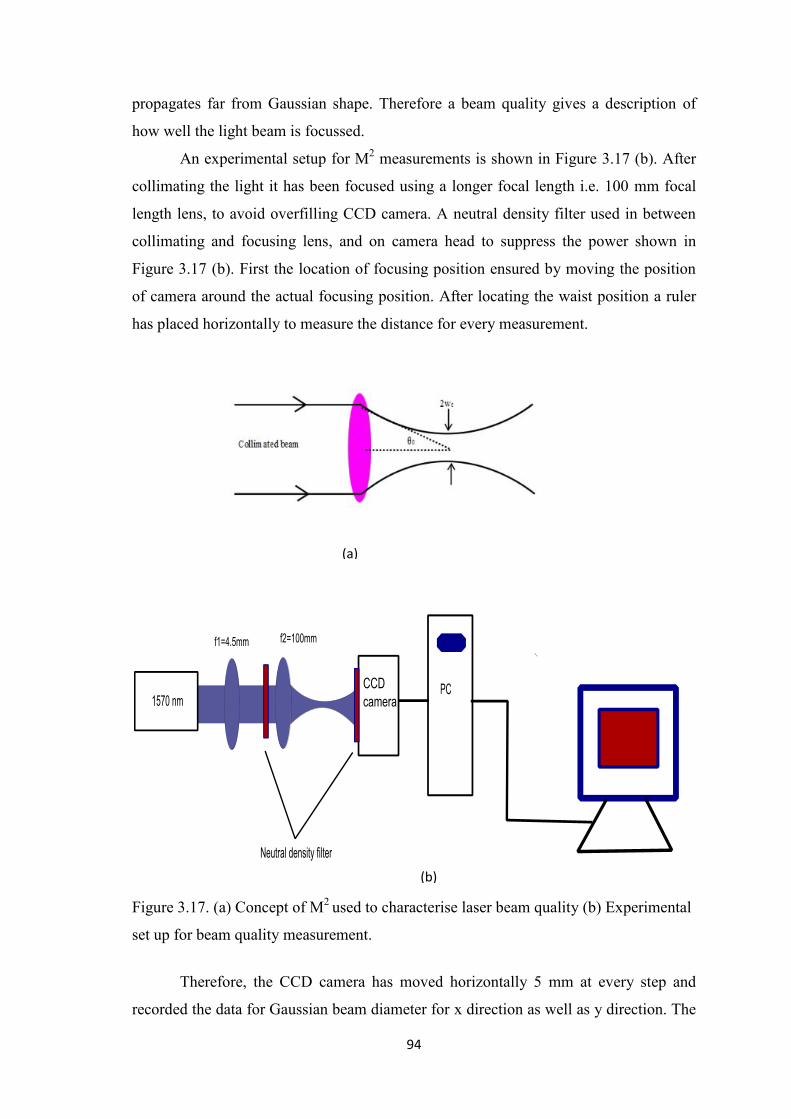
94
propagates far from Gaussian shape. Therefore a beam quality gives a description of
how well the light beam is focussed.
An experimental setup for M2 measurements is shown in Figure 3.17 (b). After
collimating the light it has been focused using a longer focal length i.e. 100 mm focal
length lens, to avoid overfilling CCD camera. A neutral density filter used in between
collimating and focusing lens, and on camera head to suppress the power shown in
Figure 3.17 (b). First the location of focusing position ensured by moving the position
of camera around the actual focusing position. After locating the waist position a ruler
has placed horizontally to measure the distance for every measurement.
Figure 3.17. (a) Concept of M2 used to characterise laser beam quality (b) Experimental
set up for beam quality measurement.
Therefore, the CCD camera has moved horizontally 5 mm at every step and
recorded the data for Gaussian beam diameter for x direction as well as y direction. The
(a)
(b)
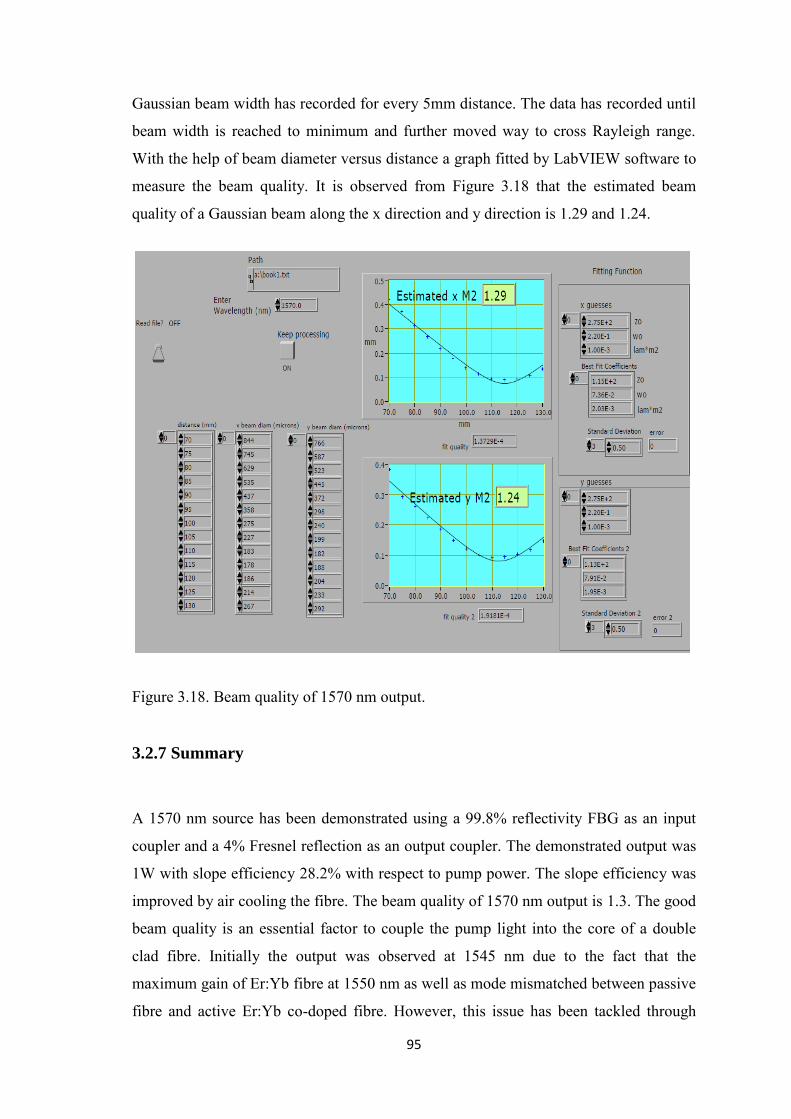
95
Gaussian beam width has recorded for every 5mm distance. The data has recorded until
beam width is reached to minimum and further moved way to cross Rayleigh range.
With the help of beam diameter versus distance a graph fitted by LabVIEW software to
measure the beam quality. It is observed from Figure 3.18 that the estimated beam
quality of a Gaussian beam along the x direction and y direction is 1.29 and 1.24.
Figure 3.18. Beam quality of 1570 nm output.
3.2.7 Summary
A 1570 nm source has been demonstrated using a 99.8% reflectivity FBG as an input
coupler and a 4% Fresnel reflection as an output coupler. The demonstrated output was
1W with slope efficiency 28.2% with respect to pump power. The slope efficiency was
improved by air cooling the fibre. The beam quality of 1570 nm output is 1.3. The good
beam quality is an essential factor to couple the pump light into the core of a double
clad fibre. Initially the output was observed at 1545 nm due to the fact that the
maximum gain of Er:Yb fibre at 1550 nm as well as mode mismatched between passive
fibre and active Er:Yb co-doped fibre. However, this issue has been tackled through

96
higher order mode filtering by wrapping the fibre in a 1 inch chuck. The output power
can go further, but to avoid the thermal damage of splicing the output is kept at 1 W.
Moreover, the slope efficiency could be improved if the passive fibre was mode
matched. Because of mode mismatching a significant amount of light lost because of
stripping the higher order modes.

97
3.3 Development of 2 µm Tm:ZBLAN Fibre Laser Using 1.57
µm In-band Pumping
3.3.1 Introduction
In band pumping is to pump the laser light directly into the emitting laser level.
Thulium doped fibre laser development at 2 µm using in-band pump source at ~1.6 µm
offers advantages of high Stokes‟ limits up to 84%. The lower phonon energy and lower
background losses of Tm:ZBLAN leads to the lower lasing threshold at ~2 µm.
Moreover, a higher total internal conversion efficiency and higher slope efficiency of
Tm:ZBALN fibre are the consequences of the above mentioned advantages. Taking the
advantages of Tm:ZBLAN fibre as well as in-band pumping is a great opportunity to
develop an efficient Tm:ZBLAN fibre laser using 1570 nm pump source.
A 415 W single mode CW Tm:Silica fibre laser at ~2 µm have reported with a
slope efficiency of 60% using an in-band pump source at 1.567 µm [2]. A multimode 2
µm Tm-Silica fibre laser has also been reported with slope efficiency 42% using a 1.61
in-band pump source [67]. Thulium fluoride fibre laser at around 2 µm have also been
reported by using a colour centre laser at 1.57 µm [41], 1.58 µm [4] as well as 1.63 µm
[42]. The maximum slop efficiency of these fibre lasers is 84%, but the output is limited
to only 53 mW. This limitation was might be the unavailability of pump source at
around 1.6 µm with sufficient power and good beam quality. But nowadays it is
possible to develop around 1.6 µm source with very good beam quality and sufficient
output power, to make a Tm:ZBLAN fibre laser at around 2 µm efficiently.
Therefore, in-band pumping approach has been used towards the development
of ~2 µm Tm:ZBLAN fibre laser. The aim is to demonstrate the efficient operation of
around 2 µm laser using in-band 1570 nm pumping.
3.3.2 Absorption Calculation at 1570 nm
In order to develop a 2 µm laser pump using a 1570 nm source, first the absorption is
calculated at 1570 nm from absorption spectra of a Tm doped ZBLAN glass, chapter 1
Fig. 1.11. As the graph was given absorption (cm-1) as a function wavelength, so the
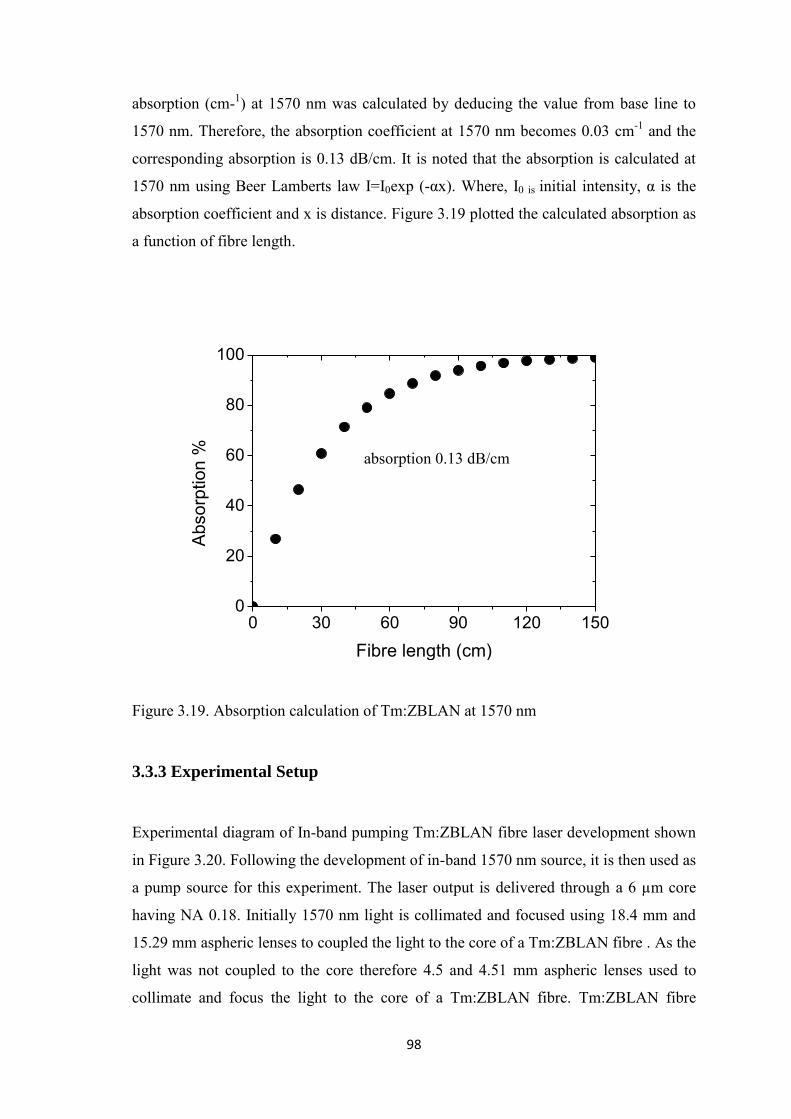
98
absorption (cm-1) at 1570 nm was calculated by deducing the value from base line to
1570 nm. Therefore, the absorption coefficient at 1570 nm becomes 0.03 cm-1 and the
corresponding absorption is 0.13 dB/cm. It is noted that the absorption is calculated at
1570 nm using Beer Lamberts law I=I0exp (-αx). Where, I0 is initial intensity, α is the
absorption coefficient and x is distance. Figure 3.19 plotted the calculated absorption as
a function of fibre length.
0 30 60 90 120 1500
20
40
60
80
100
Ab
so
rptio
n %
Fibre length (cm)
Figure 3.19. Absorption calculation of Tm:ZBLAN at 1570 nm
3.3.3 Experimental Setup
Experimental diagram of In-band pumping Tm:ZBLAN fibre laser development shown
in Figure 3.20. Following the development of in-band 1570 nm source, it is then used as
a pump source for this experiment. The laser output is delivered through a 6 µm core
having NA 0.18. Initially 1570 nm light is collimated and focused using 18.4 mm and
15.29 mm aspheric lenses to coupled the light to the core of a Tm:ZBLAN fibre . As the
light was not coupled to the core therefore 4.5 and 4.51 mm aspheric lenses used to
collimate and focus the light to the core of a Tm:ZBLAN fibre. Tm:ZBLAN fibre
absorption 0.13 dB/cm

99
supplied by FiberLabs, Japan having the core diameter 8 µm with NA 0.15, and the
cladding diameter 125 µm with NA 0.48 have been used to perform the experiment.
The length of fibre 30cm chosen and the absorption at 1570 nm is 60.84% as evident
from figure 3.19.
Figure 3.20. Experimental setup towards the development of 2 µm laser using 1570 nm
pump source.
3.3.4 Discussion
A 1570 nm source developed in house with a beam quality (M2) 1.3. The beam quality
is important parameter for tightly focusing; specifically it is important for core pumping
method. The 1570 nm output coming out from Er:Yb 6 µm core have been collimated
and focused and we tried to couple the light into the 8 µm core of Tm:ZBLAN double
clad fibre. Initially it has been observed that the light is not guided in the core. Then it
was checked alignment of collimated beam and refocused, but light was not coupled to
the core. It is noted that the Er:Yb output offers very good beam quality, which is
suitable for core pumping and consequently shorter length of fibre needed for fibre laser
experiment. Therefore, we chose core pumping approach although the fibre is double
clad. The diameter of the collimated beam is also measured and found the value is 6.11
µm, which is comparable to 6 μm core of 1570 nm light. After measuring the
collimated beam spot size, therefore the next step was to measure the beam spot size of
the focusing beam using knife edge method as follows.
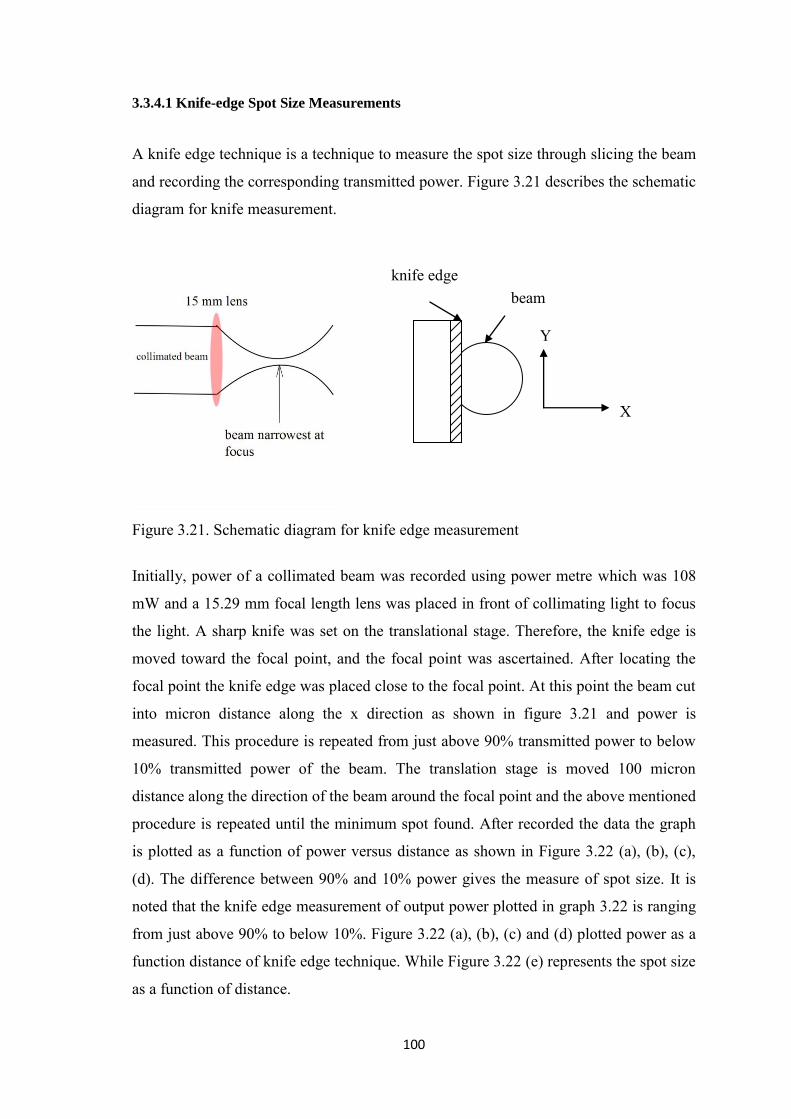
100
3.3.4.1 Knife-edge Spot Size Measurements
A knife edge technique is a technique to measure the spot size through slicing the beam
and recording the corresponding transmitted power. Figure 3.21 describes the schematic
diagram for knife measurement.
Figure 3.21. Schematic diagram for knife edge measurement
Initially, power of a collimated beam was recorded using power metre which was 108
mW and a 15.29 mm focal length lens was placed in front of collimating light to focus
the light. A sharp knife was set on the translational stage. Therefore, the knife edge is
moved toward the focal point, and the focal point was ascertained. After locating the
focal point the knife edge was placed close to the focal point. At this point the beam cut
into micron distance along the x direction as shown in figure 3.21 and power is
measured. This procedure is repeated from just above 90% transmitted power to below
10% transmitted power of the beam. The translation stage is moved 100 micron
distance along the direction of the beam around the focal point and the above mentioned
procedure is repeated until the minimum spot found. After recorded the data the graph
is plotted as a function of power versus distance as shown in Figure 3.22 (a), (b), (c),
(d). The difference between 90% and 10% power gives the measure of spot size. It is
noted that the knife edge measurement of output power plotted in graph 3.22 is ranging
from just above 90% to below 10%. Figure 3.22 (a), (b), (c) and (d) plotted power as a
function distance of knife edge technique. While Figure 3.22 (e) represents the spot size
as a function of distance.
knife edge beam
Y
X
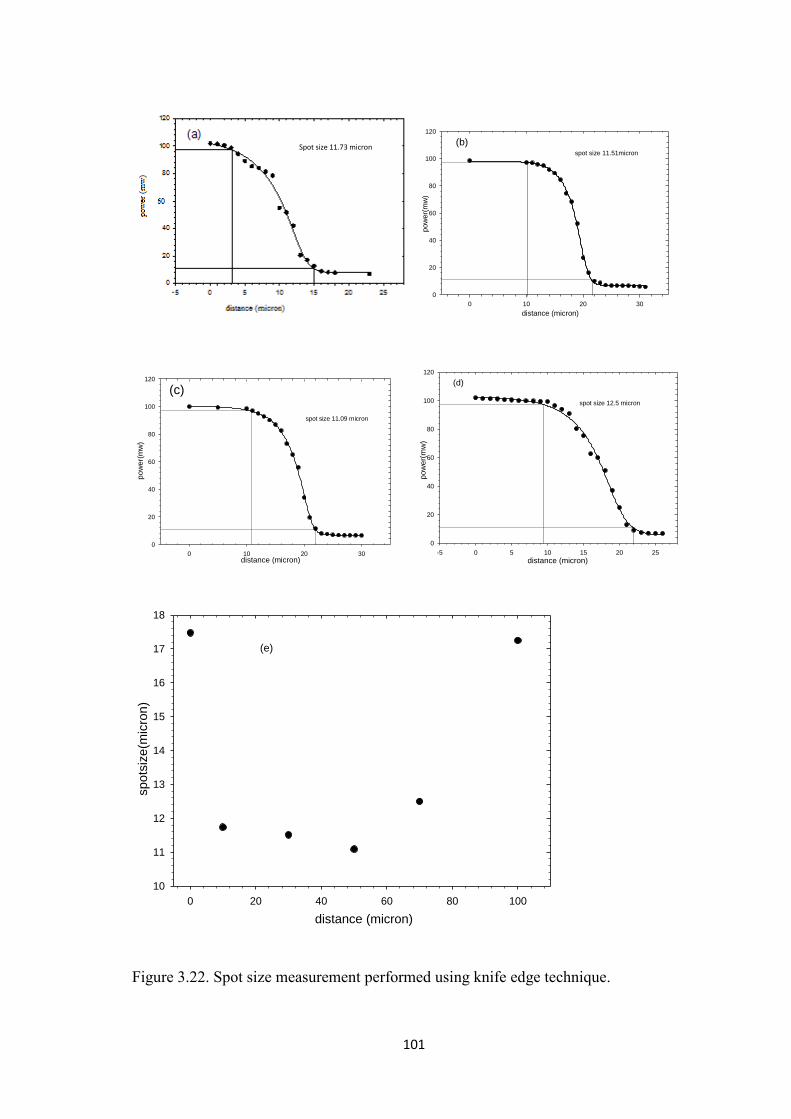
101
Figure 3.22. Spot size measurement performed using knife edge technique.
distance (micron)
0 10 20 30
pow
er(
mw
)
0
20
40
60
80
100
120
spot size 11.51micron
(b)
distance (micron)0 10 20 30
po
we
r(m
w)
0
20
40
60
80
100
120
spot size 11.09 micron
(c)
distance (micron)-5 0 5 10 15 20 25
po
we
r(m
w)
0
20
40
60
80
100
120
spot size 12.5 micron
(d)
distance (micron)
0 20 40 60 80 100
spots
ize(m
icro
n)
10
11
12
13
14
15
16
17
18
(e)
Spot size 11.73 micron
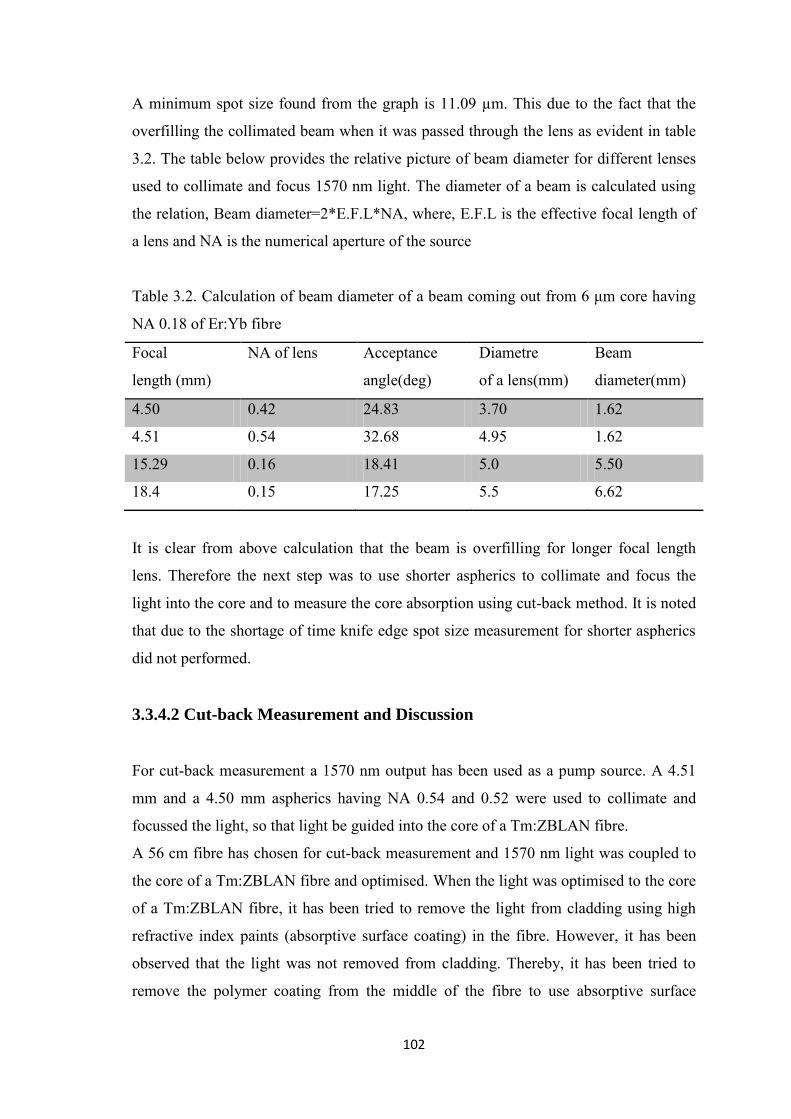
102
A minimum spot size found from the graph is 11.09 µm. This due to the fact that the
overfilling the collimated beam when it was passed through the lens as evident in table
3.2. The table below provides the relative picture of beam diameter for different lenses
used to collimate and focus 1570 nm light. The diameter of a beam is calculated using
the relation, Beam diameter=2*E.F.L*NA, where, E.F.L is the effective focal length of
a lens and NA is the numerical aperture of the source
Table 3.2. Calculation of beam diameter of a beam coming out from 6 μm core having
NA 0.18 of Er:Yb fibre
Focal
length (mm)
NA of lens Acceptance
angle(deg)
Diametre
of a lens(mm)
Beam
diameter(mm)
4.50 0.42 24.83 3.70 1.62
4.51 0.54 32.68 4.95 1.62
15.29 0.16 18.41 5.0 5.50
18.4 0.15 17.25 5.5 6.62
It is clear from above calculation that the beam is overfilling for longer focal length
lens. Therefore the next step was to use shorter aspherics to collimate and focus the
light into the core and to measure the core absorption using cut-back method. It is noted
that due to the shortage of time knife edge spot size measurement for shorter aspherics
did not performed.
3.3.4.2 Cut-back Measurement and Discussion
For cut-back measurement a 1570 nm output has been used as a pump source. A 4.51
mm and a 4.50 mm aspherics having NA 0.54 and 0.52 were used to collimate and
focussed the light, so that light be guided into the core of a Tm:ZBLAN fibre.
A 56 cm fibre has chosen for cut-back measurement and 1570 nm light was coupled to
the core of a Tm:ZBLAN fibre and optimised. When the light was optimised to the core
of a Tm:ZBLAN fibre, it has been tried to remove the light from cladding using high
refractive index paints (absorptive surface coating) in the fibre. However, it has been
observed that the light was not removed from cladding. Thereby, it has been tried to
remove the polymer coating from the middle of the fibre to use absorptive surface

103
coating in the uncoated region. However, as the Tm:ZBLAN fibre is very fragile, it was
not possible to remove the coating from the middle of a fibre. Therefore, to measure the
core absorption of pump light, initially output power was recorded when light was not
coupled to the core. Then, light into the core has been ascertained through optimisation
and by observing the fluorescence through IR viewer. After observing the light coupled
into the core, it has been optimised and input end of the fibre kept unchanged. A power
metre head was fixed in position and the transmitted output was recorded for every cut-
back measurement.
As the transmitted output is composed of core and cladding light, therefore the
core absorption for every cutback is considered here as the difference between the
output power when pump light coupled only to the cladding and when coupled both to
the core and cladding. Symbolically one can write core absorption = Pinner cladding - Pcore
and inner cladding. Where, P inner cladding is the output power for pump light passing through
cladding and P core and inner cladding is the output power passing through both the core and
inner cladding. There might be some contribution of cladding light absorption but that is
very negligible for such a short piece of fibre in comparison to the core absorption.
Figure 3.23 shows cut-back core absorption measurement of Tm:ZBLAN
double clad fibre. From Figure 3.23 the output extrapolated to zero length is
10log10(P)=17.68, i.e. 58.6 mW and the input power was 185 mW. Therefore, it is
assumed that the coupling efficiency to the core of a fibre was estimated at 31.6%.
From cut-back measurement as shown in figure 3.23, it has been observed that the
pump absorption at 1570 nm is 0.05 dB/cm, which shows some discrepancy with
calculated absorption 0.13 dB/cm (from absorption spectra Figure 1.10 ) . Therefore the
next step is to calculate the absorption cross section from cut back absorption and to
compare with literature as follows.
Absorption cross section is calculated by using σ = α/N, where α= 0.013
cm-1 is the absorption coefficient (calculated from absorption 0.05 dB/cm), N is the ion
density calculated using N =M x δ x NA
MW x total batch weight , where, M = 20000 ppm =20
gm/litre is the mass of dopants, δ = 4.33 g/cm3 is the ZBLAN glass density, NA =
6.023x10²³ is the Avogadro‟s number, MW = 225.93 is the TmF3 molecular weight and
total batch weight is the weight for glass sample. Therefore, using the above parameters
the absorption cross-section becomes 0.54x10⁻²² cm2. While the calculated absorption

104
the absorption cross section 1.35x10⁻²² cm2 [56]. It is observed that the measured
absorption is 2.5 times less than calculated value from literature.
0 10 20 30 40 50 6014.0
14.5
15.0
15.5
16.0
16.5
17.0
17.5
18.0 data
linear
10lo
g1
0(P
)
Length(cm)
y=0.054*x+17.68
Figure 3.23. Core absorption measurement of a Tm:ZBLAN double clad fibre using
cut-back method.
Moreover, pump absorption at 1570 nm of Tm:ZBLAN fibre having 8 μm core
and 125 μm inner cladding has been calculated from data sheet supplied by FiberLabs,
Japan as follows. It has found from data sheet that the absorption at 1570 nm is 0.19
dB/m and the core absorption becomes
πrinnerclad2 πrcore
2 ∗ 0.19dB m = 1252 82 ∗0.19dB
m= 46.3dB/m
As a result core absorption at 1570 nm is 46.3 dB/m and the corresponding absorption
coefficient is 0.1 cm-1. Considering this calculated absorption values, 95% of pump
light should absorb to the core of a 30 cm fibre.
Therefore for accurate measurement of cut-back absorption shorter fibre length should
be used, as according to Tm:ZBLAN fibre data sheet, most of the pump light should
absorb at around 30 cm fibre length. Therefore, two things are essential to perform
meaningful operation of fibre laser at 2 μm using 1570 nm pumping. Firstly, careful
adjustment is required to couple the pump light to the core. Secondly to measure the
105
core absorption efforts are needed to remove the coating from the body of the fibre.
Once getting accurate picture of core absorption and careful adjustment of optical
elements to couple the light into core it would be possible to develop fibre laser at 2 µm
using 1570 nm pumping. Therefore development of 2 μm laser using core pumping
method is a subject of future work.
3.3.5 Summary
A 2 µm Tm:ZBLAN fbre laser was tried to develop using 1570 nm in-band pumping
approach. According to core pump absorption calculation of a Tm:ZBLAN fibre, it
shows that the absorption is only 31.2% for 56 cm fibre. This measurement was the
initiative to measure the pump absorption. However considerable effort is needed to
remove the coating from the body of the fibre, in order to measure the pump absorption
accurately. Initiatives were taken to remove the coating from the body of the fibre but
due to the fragile nature of ZBLAN fibre as well as time limit of the thesis it was not
possible to finish. Further research is needed to measure the pump absorption
accurately. Also coupling efficiency of pump light to the core should be improved
considerably for fibre laser operation. Once the appropriate measurement is finish it is
possible to go for fibre laser development through the optimization of 1570 nm pump
light to the core.
3.4 Conclusion
A 1.53 W Tm:ZBLAN fibre laser at around 2 µm have been developed and
demonstrated using 790 nm pumping with a maximum slope efficiency of 45%. Er:Yb
co-doped fibre laser at 1570 nm has also been developed with maximum efficiency
28.2% for an in-band pumping. The measured beam quality of 1570 nm was 1.3, which
is suitable for core pumping. The core pumping is mainly due to relatively good beam
quality offered by Er:Yb sources which allows the use of core pumped fibre
configurations. Initiatives were also taken to develop a Tm:ZBLAN fibre laser at ~2
µm using 1.57 µm source in a core pumping method. However from cut back
absorption measurement, it has been observed that the absorption efficiency only is
31.2%. The cut-back measured absorption cross section shows some discrepancy with

106
literature results. It is noticeable that in cut-back measurement it is not been possible to
suppress the cladding light, due to some experimental difficulties as stated earlier. This
experiment should be conducted in near future to demonstrate efficient operation of
fibre laser at ~2 µm using in-band 1570 nm pump source.

107
Chapter 4
Conclusion and Future Work
The motivation of this thesis was to investigate the Tm:ZBLAN fibre laser of around 2
µm using 790 nm pumping, and 1570 nm in-band pumping. So this thesis is primarily
focused on developing a 2 µm Tm:ZBLAN fibre laser, and Er:Yb fibre laser at 1.57µm
for in-band pumping.
The lower phonon energy and lower background losses of Tm:ZBLAN leads to
the lower lasing threshold at ~2 µm. Moreover, a higher total internal conversion
efficiency and higher slope efficiency of Tm:ZBALN fibre are the consequences of low
phonon energy and low loss of Tm:ZBLAN fibre. Taking the advantages of
Tm:ZBLAN fibre and in-band pumping, it is a great opportunity to develop an efficient
Tm:ZBLAN fibre laser at ~2 µm.
The need for Tm:ZBLAN fibre lasers was discussed, including 790 nm pumping
as well as in-band pumping in Chapter 1. In in-band pumping laser, active ions are
pumped directly to the upper laser level from the ground state resulting a very high
Stokes efficiency of around 2 µm for Tm:ZBLAN and Tm:Silica fibre lasers. It is noted
that, Tm:Silica fibre lasers at around 2 µm become a mature technology in terms of
output power using 790 nm pumping as well as ~1.6 µm in-band pumping. While for
Tm:ZBLAN fibre laser the maximum output at 2 µm is 20 W [3] using a 790 nm
pumping, and it is only 53 mW [4] for in-band pumping. Therefore, Tm:ZBLAN fibre
has potentiality for the development of around 2 µm laser, particularly through in-band
pumping.
In this thesis, a 1960 nm Tm:ZBLAN fibre laser was demonstrated with 1.53 W
output and maximum slope efficiency of 45%, which is comparable to the highest
reported slope efficiency of 49% [3]. The output could be scaled further through proper
thermal management. For the experiment, a 5.45 m fibre has been used, and
demonstrated that for a laser of 1970 nm the absorption of 790 nm pump light to the
fibre is 62%. Therefore, by placing a mirror which is HR at 790 nm at opposite end of
the fibre, the residual unabsorbed pump power could be passed through the fibre.
Thereby, the gain as well as efficiency can be improved.

108
Moreover, 1.57 µm Er:Yb fibre laser has been developed using high reflectivity
FBG as an input coupler and 4% Fresnel reflection at rear end of the fibre as an output
coupler. The Watt level output is measured with slope efficiency of 28.2%, with respect
to the diode pump power. As beam quality is an important parameter, especially where
tight focusing is necessary, therefore M2 value is measured which is 1.3 for 1.57 µm
laser. It is observed that slope efficiency was increased due to the cooling of the fibre.
Slope efficiency of 1.57 µm laser could be improved further if there was no mode
mismatch between passive GDF fibre and active Er:Yb co-doped fibre.
One of the main aims of this thesis was to develop 2µm Tm:ZBLAN fibre laser
using 1570 nm pumping. As it is already showed that this source offers very good beam
quality, it is possible to pump directly to the core of a Tm:ZBLAN fibre. The measured
pump light coupling to the core is 31.6% and absorption is only 31.2% for 30 cm fibre.
Therefore, to demonstrate an efficient fibre laser at 2 µm, the coupling efficiency of
1570 nm pump light is anticipated to improve. Therefore, this study will help further to
develop 2 µm laser using in-band pumping.
As understanding the pump absorption behaviour is necessary for an appropriate
design of a double clad fibre laser, pump absorption of a different shape of a double
clad fibre has been analysed using MATLAB code. It is represented that the pump
absorption increases by breaking the symmetry of a double clad fibre. Moreover, pump
absorption can also be increased by offsetting the core. Therefore, pump absorption is
favourable when the symmetry of a double clad fibre becomes broken. This is due to
the fact that the skew rays never interact to the core of a circular fibre.
Due to the time limit of the thesis, only a development of ~1.9 µm Tm:ZBLAN
fibre laser has been completed and a development of 2µm Tm:ZBLAN fibre laser using
1.57 µm pumping will be a subject of future work. A home-made Tm:ZBLAN double
clad fibre is under preparation and will be used for the future development of fibre
lasers at 2 µm and 2.3 µm.
In summary, this thesis has presented some significant research on different
types fibre laser, in particular, Tm:ZBLAN, and revealed some interesting features of
fibre lasers. It is anticipated that the outcome of this thesis will have some contributions
in many potential applications in the areas of LIDAR, Sensing, Medicine, Defence
industry and materials processing.

109
Appendix
A1. Model Verification
In order to implement the model in an accurate and correct way, firstly the literature
results [92] have been reproduced using the same parameters as mentioned in the
literature. A 10 m fibre was used in the simulation. The core NA of the fibre is 0.175
and an inner cladding NA 0.48. The diameter of the core is 20 µm surrounded by a
circular inner cladding of 600 µm. The doping density is 20000 ppm by volume,
container number is 1000 and the launched power is 90W [92]. To calculate the data
points from graphs shown in literature, Engauge Digitizer 4.1, a digitize software has
been used. After reading the data from literature, it was plotted to compare with the
simulation results (see figure A1). Figure A1 shows the pump absorption as a function
of fibre length. It is observed from Figure A1 (a), (b) that the pump absorption is
increases for increasing the fibre length up to 4 m. Thereafter, increasing the fibre
length for circular shape the pump absorption becomes saturated due to the non
absorption of skew rays as in Figure A1 (a). It is evident from the graph that the results
are comparable with the literature.
Fibre length(m)
0 2 4 6 8 10
Abso
rption
eff
icie
ncy(%
)
0
20
40
60
80
100
Calculated
Ioannis et. al
(a)
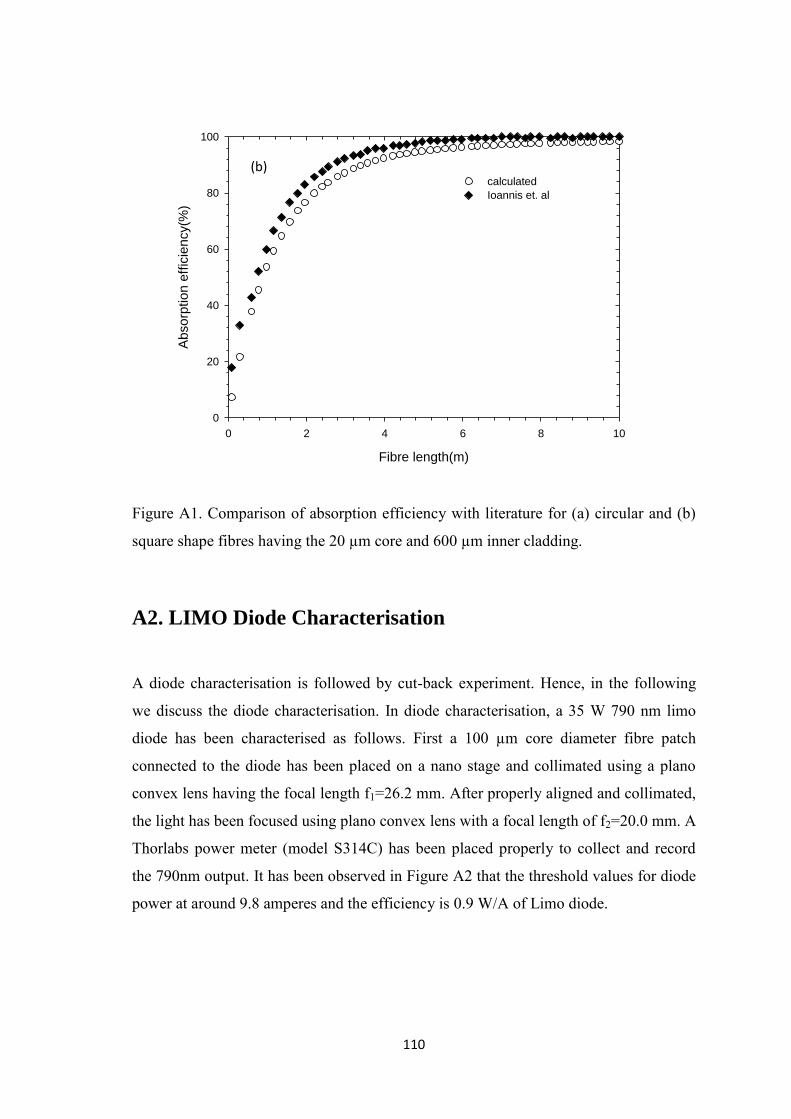
110
Figure A1. Comparison of absorption efficiency with literature for (a) circular and (b)
square shape fibres having the 20 µm core and 600 µm inner cladding.
A2. LIMO Diode Characterisation
A diode characterisation is followed by cut-back experiment. Hence, in the following
we discuss the diode characterisation. In diode characterisation, a 35 W 790 nm limo
diode has been characterised as follows. First a 100 µm core diameter fibre patch
connected to the diode has been placed on a nano stage and collimated using a plano
convex lens having the focal length f1=26.2 mm. After properly aligned and collimated,
the light has been focused using plano convex lens with a focal length of f2=20.0 mm. A
Thorlabs power meter (model S314C) has been placed properly to collect and record
the 790nm output. It has been observed in Figure A2 that the threshold values for diode
power at around 9.8 amperes and the efficiency is 0.9 W/A of Limo diode.
Fibre length(m)
0 2 4 6 8 10
Ab
so
rptio
n e
ffic
ien
cy(%
)
0
20
40
60
80
100
calculated
Ioannis et. al
(b)
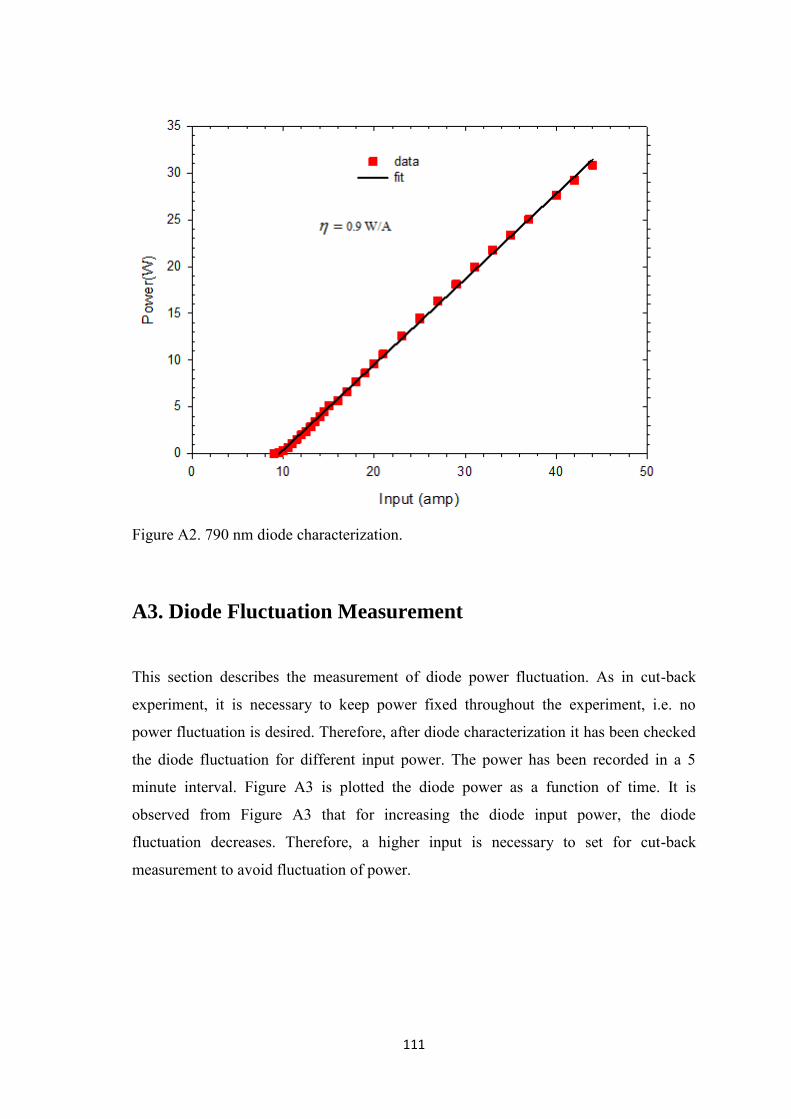
111
Figure A2. 790 nm diode characterization.
A3. Diode Fluctuation Measurement
This section describes the measurement of diode power fluctuation. As in cut-back
experiment, it is necessary to keep power fixed throughout the experiment, i.e. no
power fluctuation is desired. Therefore, after diode characterization it has been checked
the diode fluctuation for different input power. The power has been recorded in a 5
minute interval. Figure A3 is plotted the diode power as a function of time. It is
observed from Figure A3 that for increasing the diode input power, the diode
fluctuation decreases. Therefore, a higher input is necessary to set for cut-back
measurement to avoid fluctuation of power.

112
0 10 20 30 405.0
5.5
6.0
6.5
7.0
Po
we
r (m
W)
Time (mins)
slope 0.005
0 10 20 30 4043.0
43.5
44.0
44.5
45.0
Po
we
r (m
W)
Time (mins)
slope 0.002
Figure A3. Diode power fluctuation measurements for (a) low power and (b) relatively
higher power.
A4. 980 nm Diode Characterisation
A 980 nm 15 W source out of 200 µm patch fibre has been used as a pump source to
develop 1570 nm source. Initially diode is fixed for 30 Ampere, though the driver goes
upto 50 Ampere. The diode is cooled using CPU fans. The duty cycle is kept fixed 86%
throughout the characterisation. After collimating the beam, the diode data was
(b)
(a)

113
recorded using Thorlabs power metre head. From the calibration graph A4, it shows the
diode efficiency is 0.32 W/A.
Figure A4. 980 nm diode characterisation.
114
Bibliography
[1] T. Ehrenreich, R. Leveille, I. Majid, K. Tankala, G. Rines, and P. F. Moulton. 1-
kW, all-glass Tm:fiber laser. Fiber Lasers VII: Technology, Systems, and
Applications (2010) (Session 16: Late breaking news).
[2] M. Meleshkevich, N. Platonov, D. Gapontsev, A. Drozhzhin. 415W Single-Mode
CW Thulium Fiber Laser in all-fiber format. IPG Photonics, 50 Old Webster Rd.,
Oxford, MA, 01540, USA V.Sergeev, V.Gapontsev. IPGLaser GmbH,
Siemenstrasse 7, Burbach, D -57299, Germany.
[3] M. Eichhorn and S. D. Jackson. Comparative study of continuous wave Tm3+
doped silica and fluoride fibre laser. Applied Physics B 90, 35-41 (2008).
[4] T. Yamamoto, Y. Miyajima, T. Komukai, and T. Sugawa. 1.9 µm Tm-doped
fluoride fibre amplifier and laser pumped at 1.58um. Electronics Letters 29, 986
(1993).
[5] T. H. Maiman. Stimulated optical radiation in ruby masers. Nature 187, 493-494
(1960).
[6] V. P. Gapontsev. High power fibre laser and its application. in Proceedings of the
4th International Symposium on High-Power Fiber Lasers and Their
Applications, St. Petersburg, Russia, June 2008.
[7] R.M. Measure. Laser Remote Sensing: Fundamentals and Applications. (Krieger
Publishing Company, Malabar Florida) 1992.
[8] G.M. Hale, M.R. Querry. Applied Optics 12, 555 (1973).
[9] K. Scholle, S. Lamrini, P.pp Koopmann and P. Fuhrberg. 2 µm laser sources and
their possible applications. Frontiers in Guided wave optics and optoelectronics
ISBN 978-953-7619-82-4, February 2010.
[10] IPG, "YLR-HP Series: 1-50kW Ytterbium Fibre Lasers (2009), retrieved August
6, 2009, http://www.ipgphotonics.com/.
[11] S. W. Henderson, P. J. M. Suni, C. P. Hale, S. M. Hannon, J. R. Magee, D. L.
Bruns, and E. H. Yuen. Coherent laser radar at 2 μm using solid-state lasers.
Geoscience and Remote Sensing. IEEE Transactions on 31, 4-15 (1993).
[12] G. J. Koch, J. Y. Beyon, B. W. Barnes, M. Petros, J. Yu, F. Amzajerdian, M. J.
Kavaya, and U. N. Singh. High-energy 2 μm Doppler lidar for wind
measurements. Optical Engineering 46, 116201-116214 (2007).

115
[13] S.-J. Xia, J. Zhuo, X.-W. Sun, B.-M. Han, Y. Shao, and Y.-N. Zhang. Thulium
Laser versus Standard Transurethral Resection of the Prostate: A Randomized
Prospective Trial. European Urology 53, 382-390 (2008).
[14] W. A. Clarkson, D.Y. Shen, P. J. Jander and J. K. Sahu. Tm doped fiber laser
pumped by a cladding-pumped Er,Yb fiber laser, Optoelectronics Research
Centre, University of Southampton, 2006.
[15] R. J. Mears, L. Reekie, S. B. Poole, and D. N. Payne. Neodymium-doped silica
singlemode fibre lasers. Electronics Letters 21, 738 (1985).
[16] H. Po. E. Snitzer, R, Tumminelli, L. Zenteno, F. Hakimi, N. M. Cho, and T.
Haw. Double clad high brightness Nd fibre laser pumped by GaAlAs phased
array. Presented at the Optical Fibre Communication, Conference Paper PD07
(1989).
[17] H. Po, J. D. Cao, B. M. Laliberte, R. A. Minns, R.F. Robbinson, B. H. Rockney,
R. R. Tricca and Y. H. Zhang. Electronics Letters 29, 1500 (1993).
[18] R. Mauer. Optical waveguide light source. U.S. Patent 3 808 549, Apr. 30, 1974.
[19] CE. Snitzer, H. Po, F. Hakimi, R. Tumminelli, and B. C. McCollum. Double-clad,
offset core Nd fibre laser. Optical Fiber Sensors, vol. 2, OSA Technical Digest
Series. Washighton, DC: Optical Society of America, 1988.
[20] H. Zellmer, A. T¨unnermann, and H. Welling. Double-clad fibre laser with 30 W
output power. in OSA TOPS, vol. 16, Optical Amplifiers and Their Applications.
Washington, DC: Optical Society of America, 1997.
[21] D. Mercuse. Bell System Technical Journal 56, 5 (1977).
[22] D. Mercuse. Gaussian approximation of the fundamental modes of graded index
fibres. Journal of Optical Society America 68, 103-109 (1978).
[23] M.F.G. Digonnet. C. J. Gaeta, Applied Optics 24, 333 (1985).
[24] A. W. Snyder and J. D. Love. Optical waveguide theory. Chapmann and Hall,
1983.
[25] K. Ohsawa, T. Shibata, K. Nakamura, and S. Yoshida. Fluorozirconate glasses for
infrared transmitting optical fibers. Proceedings of the 7th European Conference
on Optical Communication (ECOC), pp. 1.1-1–1.1-4, Copenhagen, Danmark,
September 1981.
[26] J. Lucas, M. Chanthanasinh, M. Poulain, M. Poulain, P. Brun, and M. J. Weber.
Preparation and optical properties of neodymium fluorozirconate glasses. Journal
of Non-Crystalline Solids 27, 273–283 (1978).
116
[27] M. Poulain, and J. Lucas. Verres fluores au tetrafluorure de zirconium proprietes
optiques d‟un verre dope au Nd3+ Materials Research Bulletin 10, 243–246
(1975).
[28] Xiushan Zhu and N. Peyghambarian. High-Power ZBLAN Glass Fiber Lasers:
Review and Prospect. Advances in Optoelectronics, Volume 2010 (2010), Article
ID 501956, doi:10.1155/2010/501956.
[29] P. France, M. G. Drexhage, J.M. Parker, M. W. Moore, S. F. Carter, and J.
V.Wright. Fluoride Glass Optical Fibres, Blackie and Son, London, UK, 1990.
[30] G T. Kanamori and S. Sakaguchi. Preparation of elevated NA fluoride optical
fibres. Japanese Journal of Applied Physics, vol. 25, no. 6, pp. L468–L470, 1986.
[31] L. F. Johnson, G. D. Boyd, and K. Nassau. Proceedings of IRE (1962).
[32] L. F. Johnson, J. E. Geusic, and L. G. Van Uitert. Coherent Oscillations from
Tm3+, Ho3+, Yb3+ and Er3+ Ions in Yttrium Aluminium Garnet. Applied Physics
Letters 7, 127-129 (1965).
[33] L. F. Johnson, L. G. Van Uitert, J. J. Rubin, and R. A. Thomas. Energy Transfer
from Er3+ to Tm3+ and Ho3+ Ions in Crystals. Physical Review 133, A494
(1964).
[34] B. H. Soffer and R. H. Hoskins. Energy Transfer and CW Laser Action in
Tm3+:Er2O3, Applied Physics Letters 6, 200-201 (1965).
[35] D. C. Hanna, I. M. Jauncey, R. M. Percival, I. R. Perry, R. G. Smart, P. J. Suni, J.
E. Townsend, and A. C. Tropper. Continuous-wave oscillation of a monomode
thulium doped fibre laser. Electronics Letters 24, 1222-1223 (1988).
[36] B. M. Walsh and N. P. Barnes. Comparison of Tm:ZBLAN and Tm: silica fiber
lasers; Spectroscopy and tunable pulsed laser operation around 1.9 μm. Applied
Physics B 78, 325-333 (2004).
[37] D. C. Hanna, R. M. Percival, R. G. Smart, and A. C. Tropper. Efficient and
tunable operation of a Tm-doped fibre laser. Optics Communications 75, 283-286
(1990).
[38] J. N. Carter, R.G. Smart, D.C. Hanna, and A.C. Tropper. CW diode-pumped
operation of 1.97 µm thulium doped fluozirconate fibre laser. Electronics Letters
26, 599-601 (1990).
[39] R. G. Smart, J. N. Carter, A. C. Tropper, and D. C. Hanna. Continuous-wave
oscillation of Tm3+ -doped fluorozirconate fibre lasers at around 1.47 μm, 1.9 μm
117
and 2.3 μm when pumped at 790 nm. Optics Communications 82, 563-570
(1991).
[40] R. M. Percival, D. Szebesta, C.P. Seltzer, S.D. Perrin, S.T. Davey and M. Louka.
1.6 µm semiconductor diode pumped thulium doped fluoride fibre laser and
amplifier of very high efficiency. Electronics Letters 29 21210 (1993)
[41] R. M. Percival, D. Szebesta, C. P. Seltzer, S.D. Perrin, S.T. Davey, and M. Louka.
A 1.6-µm pumped 1.9 µm thulium-doped fluoride fibre laser and amplifier of
very high efficiency. IEEE Jounal of Quantum Electronics 31, 489-493 (1995).
[42] D. C. Hanna, I. R. Perry, J. R. Lincoln, and J. E. Townsend, "A 1-Watt thulium-
doped cw fibre laser operating at 2 μm," Optics Communications 80, 52-56
(1990).
[43] S. D. Jackson and T. King. High-power diode-cladding-pumped Tm-doped silica
fiber laser. Optics Letters 23, 1462-1464 (1998).
[44] T. Becker, R. Clausen, G. Huber, E. W. Duczynski, and P. Mitzscherich.
Spectroscopic and laser properties of thulium doped YAG at 2 μm. Optical
Society of America 150-153 (1989).
[45] R. A. Hayward, W. A. Clarkson, P. W. Turner, J. Nilsson, A. B. Grudinin, and D.
C. Hanna. Efficient cladding-pumped Tm-doped silica fibre laser with high power
single mode output at 2μm. Electronics Letters 36, 711-712 (2000).
[46] S. D. Jackson. Cross relaxation and energy transfer up conversion processes
relevant to the functioning of 2 μm Tm3+-doped silica fibre lasers. Optics
Communications 230, 197-203 (2004).
[47] S. D. Jackson and S. Mossman. Efficiency dependence on the Tm and Al
concentrations for Tm-doped silica double-clad fibre lasers. Applied Optics 42,
(2003).
[48] P. F. Moulton, G. A. Rines, E. V. Slobodtchikov, K. F. Wall, G. Frith, B. Samson,
and A. L. G. Carter. Tm-Doped Fibre Lasers: Fundamentals and Power Scaling.
IEEE Journal of Selected Topics in Quantum Electronics 15, 85-92 (2009).
[49] M. Eichhorn. High-peak-power Tm-doped double-clad fluoride fibre amplifier.
Optics Letters 24 3329 (2005).
[50] Y. Tang and J. Xu. High Power Tunable Tm3+-fiber Lasers and Its Application in
Pumping Cr2+:ZnSe Lasers. Frontiers in Guided wave optics and optoelectronics
ISBN 978-953-7619-82-4, February 2010.

118
[51] N. P. Barnes, W. J. Rodriguez, B.M. Walsh. Journal of Optical Society America
B, 13, 2872 (1996).
[52] B.M. Walsh. Review of Tm and Ho materials; spectroscopy and lasers. NASA
Langley research centre, Hampton, VA 23681.
[53] G. Armagan, B. M. Walsh, N. P. Barnes, E. A. Modlin, A. M. Buoncristiani.
Proceedings on Advanced Solid State Lasers, 20, 141(1994).
[54] A. M. Tkachuk, M. F. Joubert, R. Moncorge, D. I. Mironov, A. A. Nikitichev.
Optics & Spectroscopy 85, 885 (1998).
[55] J.L. Doualan, S. Girard, H. Haquin, J.L. Adam, J. Montagne. Spectroscopic
properties and laser emission of Tm doped ZBLAN glass at 1.8 µm. Optical
Materials 24 563-574(2003).
[56] S. Agger, J.H. Povlsen and P. Varming. Single-frequency thulium-doped
distributed feedback fibre laser. Optics Letters 29, 1503-1505 (2004).
[57] R.G. Smart, J.N. Carter, A.C. Tropper and D.C. Hanna. Continuous-wave
oscillation of Tm-doped fluorozirconate fibre laser at around 1.47m, 1.9 and 2.3
when pumped at 790nm. Optics Communication 82, 563-570 (1991).
[58] J. Geng, J. Wu, and S. Jiang. Efficient operation of diode-pumped single-
frequency thulium-doped fibre lasers near 2 μm. Optics Letters 32, 355-357
(2007).
[59] N. Y. Voo, J. K. Sahu, and M. Ibsen. 345-mW 1836-nm Single-Frequency DFB
Fibre Laser MOPA. IEEE Photonics Technology Letters 17, 2550 (2005).
[60] J. Xu, M. Prabhu, J. Lu, K. Ueda, and Da Xing. Efficient double-clad thulium-
doped fibre laser with a ring cavity. Applied Optics 40, 1983-1988 (2001).
[61] R. Reisfeld, C.K. Jorgensen. Hand book on the Physics and Chemistry of Rare
Earths, K.A. Gschneidner, Jr., L. Eyrinh (Elsevier Sci. Publishers 1987) Chapter
58.
[62] R. M. Percival, D. Szebesta, C.P. Seltzer, S.D. Perrin, S.T. Davey. Highly
efficient CW cascade operation of 1.47 and 1.82 um transition in Tm-doped
fluoride fibre laser. Electronics Letters 28, 1866-1867 (1992).
[63] E. Snitzer, H. Po, F. Hakimi, R.Tumminelli and B.C. McCollum. Erbium fibre
laser amplifier at 1.55 um with pump and Yb sensitized Er oscillator. Proc. Conf.
Optical Fibre Communication, New Orleans, LA, Paper PD2, 1988
119
[64] Y. H. Tsang, A.F. El-Sherif and T.A. King. Broadband amplified spontaneous
emission fibre source near 2um using resonant in-band pumping. Journal of
Modern Optics 52, 109 (2005).
[65] R. M. Percival, D. Szebesta, and S.T. Davey. Highly efficient and tunable
operation of a two color Tm-doped fluoride fibre laser. Electronics Letters 28,
671-672 (1992).
[66] D. Y. Shen, J. K. Sahu, and W. A. Clarkson. High-power widely tunable Tm:fibre
lasers pumped by an Er,Yb co-doped fibre laser at 1.6µm. Optics Express 14,
6084–6090 (2006).
[67] Y. H. Tsang and T.A. King. Multi-mode 2µm Tm-silica fibre lasers with 1.61µm
in-band pumping. Journal of Modern Optics 54, 1659-1667 (2007).
[68] M. Laroche, P. Jander, W.A. Clarkson, J.k. Sahu, J. Nilson and Y. Jeong. High
power cladding-pumped tunable Er,Yb-fibre laser. Electronics Letters 40, 855-
856 (2004).
[69] P. Blixt, J. Nilsson, T. Carlnäs, and B. Jaskorzynska, “Concentration-dependent
upconversion in Er3+ doped fiber amplifiers: Experiments and modelling. IEEE
Photonics Technology Letters 3(11), 996–998 (1991).
[70] J. D. Minelly, W. L. Barnes, R.I. Laming, P.R. Morkel, J.E. Townsend, S.G.
Grubb, and D.N, Payne. Diode array pumping of Er3+/Yb3+ co-doped fibre laser
and amplifiers,” IEEE Photonics Technology Letters 5, 301 (1993).
[71] G.G. Vienne, J.E. CAplen, L. Dong, J.D. Minelly, J. Nilsson, and D.N. Payne.
Fabrication and characterization of Yb3+:E3+ phosposilicate fibre for lasers.
Journal of Lightwave Technology 16 1990 (1998).
[72] K. Tankala, B. Samson, A. Carter, J. Farroni, D. Machewirth, N. Jacobson, U.
Manyam, A. Sanchez, M.-Y.Cheng, A. Galvanauskas, W. Torruellas, and Y.
Chen. New developments in high power eye-safe LMA fibers. Proc. SPIE 6102,
610206 (2006).
[73] Y. Jeong, S. Yoo, C. A. Codemard, J. Nilsson, J. K. Sahu, D. N. Payne, . Horley,
P. W. Turner, L. M. B. Hickey, A. Harker, M. Lovelady, and A. Piper.
Erbium:ytterbium codoped large-core fibre laser with 297 W continuous-wave
output power. IEEE Journal of Selected Topics in Quantum Electronics 13, 573–
579 (2007).
[74] A. Yusim, J. Barsalou, D. Gapontsev, N. S. Platonov, O.Shkurikhin, V. P.
Gapontsev, Y. A. Barannikov, and F. V. Shcherbina. 100 watt single-mode CW

120
linearly polarized all-fiber format 1.56 µm laser with suppression of parasitic
lasing effects. Proc. SPIE 5709, 69–77 (2005).
[75] D. Y. Shen, J. K. Sahu, and W. A. Clarkson. Highly efficient Er,Yb-doped fibre
laser with 188 W free-running and >100 W tunable output power. Optics Express
13, 4916–4921 (2005).
[76] L. Zenteno. „High-power double-clad fiber lasers. Journal of Lightwave
Technology 11, 1435 (1993).
[77] A. Bertoni, G.C. Reali. A model for optimisation of double clad fibre laser
operation. Applied Physics B 66, 547-554 (1998).
[78] D. Inissis, D.J. DiGiovanni, T.A. Strasser, A. Hale, C. Headley, A.J. Stentz, R.
Pedrazzani, D. Tipton, S.G. Kosinsky, D.L. Brownlow, K.W. Quoi, K.S. Kranz,
R.G. Huff, R. Espindola, J.D. LeGrange, G. Jacobovtz-Veselka, D. Boggavarapu,
X. He, D. Caffey, S. Gupta, S. Srinivasan, K. McEuen, R. Patel. CLEO ‟97 Post-
deadline papers, CPD31-2 (1997).
[79] H. Zellmer, U. Willamowsky, A. Tunnermann, H. Welling, S. Unger, V. Reichel,
H.R. Muller, J. Kirchhof, P. Albers. „High-power CW neodyminum-doped fibre
laser operating at 9.2 W with high beam quality. Optics Letters 20, 578–580
(1995).
[80] T. Weber, W. Luthy, H. P. Weber, V. Neuman, H. Berthou, G. Kotrotsios, J. P.
Dan, and H. E. Hintermann. Cladding-pumped fibre laser. IEEE Journal of
Quantum Electronics 31, 326–329 (1995).
[81] J. Xu, M. Prabhu, J. Lu, K. Ueda, and D. Xing. Efficient double-clad thulium-
doped fibre laser with a ring cavity. Applied Optics 40, 1983–1988 (2001).
[82] A. Liu and K. Ueda. Propagation losses of pump light in rectangular double-clad
fibers. Optical Engineering 35, 3130–3134 (1996).
[83] M. P. Goorjian, A. Tafloye, M.R. Joseph and C. S. Hagness. Computational
modeling of femtosecond optical solitons from Maxwell‟s equations. IEEE
Journal of Quantum Electronics 28, 2416-22 (1992).
[84] C.S. Hagness, D. Rafizadeh, T.S. Ho, & A. Tafloye. FDTD microcavity
simulations: design & experimental realization of waveguide-coupled single
mode ring and whispering gallery mode disk resonators. IEEE Journal of
Lightwave Technology 15, 2154-65 (1997).

121
[85] Y. Tsuji, & M, Koshiba. Adaptive mesh generation for full vectorial guided-mode
and beam propagation solutions. IEEE Journal of Selelected Topics in Quantum
Electronics 6, 163-9 (2000).
[86] D. Kouznetsov & J. Moloney. Efficiency of pump absorption in double clad fibre
amplifiers. II. Broken circular symmetry. Journal of Optical Society America B
19, 1259-63 (2002).
[87] P. Leproux S. Fevrier. V. Doya, P. Roy and D. Pagnoux. Modeling &
optimisation of double clad fibre amplifiers using chaotic propagation of the
pump. Optical Fibre Technolology 7, 324-339 (2001).
[88] A. Liu & K. Ueda. The absorption characteristics of circular, offset & rectangular
double clad fibres. Optics Communication 132, 511-518 (1996).
[89] D. Kouznetsov & J. Moloney. Efficiency of pump absorption in double clad fibre
amplifiers. I. Fibres with circular symmetry. Journal of Optical Society America
B 18, 743-9 (2001).
[90] D. Kznetsov & J. Moloney Efficiency of pump absorption in double clad fibre
amplifiers. III. Calculation of modes. Journal of Optical Society America B 19,
1304-9 (2002).
[91] N. A. Mortensen. Air-clad fibres: pump absorption assisted by chaotic wave
dynamics. Optics Express 15, 8988 (2007).
[92] I Dritsas, T Sun & K T V Grattan. Numerical simulation based optimisation of the
absorption efficiency in double-clad fibres. Journal of Optics A: Pure and Applied
Optics 8, 49-61(2006).
[93] D. Marcuse. Principles of Optical Fibre Measurement. Academic Press, New
York, 1981.
[94] H. Ebendorff-Heidepriem and T. M. Monro. Extrusion of complex preforms for
microstructured optical fibres. Optics Express, 15, 15086 (2007).
[95] H. Ebendorff-Heidepriem, D.G. Lancaster, K. Kuan, R.C. Moore, M.S.I. Sarker,
T.M. Monro, Extruded fluoride fibre for 2.3 µm laser application, CLEO, 2011.
[96] V. Philippov, C. Codemard, Y. Jeong, C. Alegria, J.K. Sahu, J. Nilsson, and G.N.
Pearson. High energy in-fibre pulse amplification for coherent lidar applications.
Optics Letters 29, 2590 (2004).
[97] R. Corte, R. Villagomez, V Coello and R. Lopez. Laser beam quality factor (M2)
measured by distorted Fresnel zone plate. Revista Maxicana Defisica 54, 279
(2008).