u - durham e-theses - durham university
TRANSCRIPT
Durham E-Theses
Virtual software in reality
Knight, Claire
How to cite:
Knight, Claire (2000) Virtual software in reality, Durham theses, Durham University. Available at DurhamE-Theses Online: http://etheses.dur.ac.uk/4244/
Use policy
The full-text may be used and/or reproduced, and given to third parties in any format or medium, without prior permission orcharge, for personal research or study, educational, or not-for-pro�t purposes provided that:
• a full bibliographic reference is made to the original source
• a link is made to the metadata record in Durham E-Theses
• the full-text is not changed in any way
The full-text must not be sold in any format or medium without the formal permission of the copyright holders.
Please consult the full Durham E-Theses policy for further details.
Academic Support O�ce, Durham University, University O�ce, Old Elvet, Durham DH1 3HPe-mail: [email protected] Tel: +44 0191 334 6107
http://etheses.dur.ac.uk
Virtual Software in Reality
Claire Knight
Visualisation Research Group, Department of Computer Science, Research Institute in Software Evolution. University of Durham,
E-mail: [email protected] Durham, DH1 3LE, UK.
1997-2000; June 2000
PhD Thesis
The copyright of this thesis rests with the author. No quotation from it should be published without the written consent of the author and information derived from it should be acknowledged.
1 4 NOV 2000
Virtual Software in Reality Claire Knight Abstract
Abstract
Software visualisation is an important weapon in the program comprehension armoury. It is a technique
that can, when designed and used effectively, aid in understanding existing program code. It can achieve
this by displaying information in new and different forms, which may make obvious something missed in
reading the code. It can also be used to present many aspects of the data at once. Software, despite many
software engineering advances in requirements, design and implementation techniques, continues to be
complex and large and i f anything seems to be growing in these respects. This means that techniques that
failed to aid comprehension and maintenance are certainly not going to be able to deal with the current
software. Therefore this area requires research to be able to suggest solutions to deal with the information
overload that is sure to occur.
There are several issues that this thesis addresses; all of them related to the creation of software
visualisation systems that are capable of being used and useful well into the next generation of software
systems. The scale and complexity of software are pressing issues, as is the associated information
overload problem that this brings. In an attempt to address this problem the following are considered to
be important: abstractions, representations, mappings, metaphors, and visualisations. These areas are
interrelated and the first four enable the final one, visualisations. These problems are not the only ones
that face software visualisation systems. There are many that are based on the general theory of the
applicability of the technique to such tasks as program comprehension, rather than the detail of how a
particular code fragment is shown. These problems are also related to the enabling technology of three-
dimensional visualisations; virtual reality. In summary the areas of interest are: automation, evolution,
scalability, navigation and interaction, correlation, and visual complexity.
This thesis provides an exploration of these identified areas in the context of software visualisation.
Relationships that describe, and distinguish between, existing and future software visualisations are
presented, with examples based on recent software visualisation research. Two real world metaphors (and
their associated mappings and representations) are defined for the purpose of visualising software as an
aid to program comprehension. These metaphors also provide a vehicle for the exploration of the areas
identified above. Finally, an evaluation of the visualisations is presented using a framework developed for
the comparative evaluation of three-dimensional, comprehension oriented, software visualisations.
This thesis has shown the viability of using three-dimensional software visualisations. The important
issues of automation, evolution, scalability, and navigation have been presented and discussed, and their
relationship to real world metaphors examined. This has been done in conjunction with an investigation
into the use of such real world metaphors for software visualisation. The thesis as a whole has provided
an important examination of many of the issues related to these types of visualisation in the context of
software and is therefore a valuable basis for future work in this area.
- i -
Virtual Software in Reality Claire Knight Acknowledgements
Acknowledgements
This thesis is the result of many hours of work on my part, but without the support of many others it would
have been impossible for me to have been able to dedicate the required time and effort. My thanks go to
all those who have helped me during that time; i f you are not mentioned below it is purely an oversight on
my part and this does not devalue your contribution in any way.
My parents, Frances and Michael, provided me with support, help, and guidance throughout the duration
of this research, and beyond that in all other aspects of my life. Their influence and support provided me
with the impetus to carry on in research; in studying for this PhD and in gaining employment beyond that.
Having said that, I must apologise to them for the times I have taken out my annoyance and despair on
them; research isn't always plain sailing.
My sister, Liz, my Grand-dad (Norman Smith) and my Gran (Phyllis Knight) have also provided support
over different things at different times during my studies for which I am most grateful.
My thanks also go to Malcolm Munro, who has been a great (if busy) supervisor, and a very good friend.
I have a lot of respect for him, and his guidance has been invaluable. I have learnt a lot from him, and
hopefully wil l continue to do so. Along with Walter Graham and Nigel Thomas, he has been one of the
people whom I've spent many a happy hour on the rocks (OK, so it was indoors as well as out!). These
people, and the climbing, have (just about) kept me sane in the last couple of years.
I wish to thank Jill Munro, James Ingham, my Dad, and Liz Burd for proof reading this thesis and offering
comments and constructive criticism on earlier versions of it. Without their help I wouldn't have the
thesis I have now. Jill and Dad were thorough in the extreme in highlighting grammatical, spelling, and
consistency errors. James provided much valuable feedback on both wording and the concepts in this
thesis. Liz also supplied feedback on the content, especially the program comprehension section.
Many other members of the Department of Computer Science have provided me with plentiful
discussions, friendships and fun times. The most prominent of these not mentioned above (past and
present) are; Pete Young, Nicolas Gold, Steve Glover, Sarah Drummond and Alex Jones.
Thanks must also go to Rachel McCrindle and Marc Roper for making the viva as pleasant as these things
can be (at least from the candidate's point of view) and not making too many comments on my use of
crutches after a climbing fall! Finally I wish to thank those who provided funding for this research. It was
part funded by an EPSRC studentship, and the remainder was provided by Malcolm's research funds. I
am grateful to both parties for their willingness to invest in both me and in software visualisation research.
Virtual Software in Reality Claire Knight Copyright and Declaration
Copyright
The copyright of this thesis rests with the author. No quotation from this thesis should be published
without prior written consent. Information derived from this thesis should also be acknowledged.
Declaration
No part of the material provided has previously been submitted by the author for a higher degree in the
University of Durham or in any other University. Al l the work presented here is the sole work of the
author and no-one else.
This research has been documented, in part, within the following publications:
o C. Knight, M . Munro. The Power of (Software) Visualisation. University of Durham, Computer Science Technical Report 01/00.
• C. Knight, M . Munro. Visualising Software - A Key Research Area. Proceedings of the IEEE International Conference on Software Maintenance, Oxford, England, August 30 - September 3, 1999. (Short paper.)
o C. Knight, M . Munro. Visualising Software - A Key Research Area. University of Durham, Computer Science Technical Report 8/99.
• C. Knight, M . Munro. Comprehension with[in] Virtual Environment Visualisations. Proceedings of the IEEE 7 t h International Workshop on Program Comprehension, Pittsburgh, PA, May 5-7, 1999, pp4- l l .
• C. Knight. Virtual Reality for Visualisation. University of Durham, Computer Science Technical Report 13/98.
• C. Knight. Visualisation for Program Comprehension: Information and Issues. University of Durham, Computer Science Technical Report 12/98.
• C. Knight, M . Munro. Using an Existing Game Engine to Facilitate Multi-User Software Visualisation. University of Durham, Computer Science Technical Report 8/98. Presented at the 2 n d Annual Workshop on System Aspects of Sharing a Virtual Reality, 1998 (co-located with CVE '98, Manchester, England).
- i i i -
Virtual Software in Reality Claire Knight Contents
Contents
A B S T R A C T i
A C K N O W L E D G E M E N T S i i
C O P Y R I G H T i i i
D E C L A R A T I O N Hi
C O N T E N T S iv
L I S T O F F I G U R E S ix
L I S T O F T A B L E S x i
1 I N T R O D U C T I O N 1
1.1 BACKGROUND 2
1.1.1 Software Maintenance 2
1.1.2 Program Comprehension 3
1.1.3 Visualisation 4
1.1.4 Virtual Reality 4
1.1.5 Software Visualisation 4
1.2 OBJECTIVES 5
1.2.1 Virtual Software; Software Visualisation 5
1.3 CRITERIA FOR SUCCESS 7
1.4 THESIS OVERVIEW 7
2 C O M P R E H E N S I O N 9
2.1 INTRODUCTION 1 0
2.2 COMPLEXITY ISSUES 1 0
2.3 COGNITIVE MODELS A N D STRATEGIES 1 1
2.3.1 Top Down (Hypothesis Driven) U
2.3.2 Plans, Chunks and Cliches 11
2.3.3 Bottom Up 12
2.3.4 Knowledge-Based. 13
2.3.5 As Needed/Goal Directed and Systematic 14
2.3.6 Syntactic and Semantic Knowledge 14
2.3.7 Integrated Model 15
2.4 M E N T A L MODELS 1 5
2.5 PROGRAM RELATIONS 1 6
- iv -
Virtual Software in Reality Claire Knight Contents
2.6 DESIRABLE PROPERTIES AND AREAS OF RESEARCH 17
2.7 CONCLUSIONS 20
3 T H R E E - D I M E N S I O N A L V I S U A L I S A T I O N A N D V I R T U A L R E A L I T Y 2 1
3.1 INTRODUCTION 22
3.2 VIRTUAL REALITY ENVIRONMENTS 22
3.2.1 What is Virtual Reality? 22
3.2.2 Types 23
3.2.3 Perception 24
3.2.4 Gestalt Psychology and Ecological Optics 27
3.2.5 Immersion 28
3.2.6 Metaphors 31
3.2.7 Spatial Orientation and Navigation 33
3.2.8 Entertainment 34
3.2.9 Urban Virtual Environments 36
3.2.10 Summary 38
3.3 THREE-DIMENSIONAL VISUALISATION 39
3.3.1 Why Three Dimensions? 40
3.3.2 Tacit Knowledge 43
3.3.3 Task Dependence 44
3.3.4 Example Visualisations 44
3.3.4.1 Portal 45
3.3.4.2 Information Pyramids™ 47
3.3.4.3 SeeNet3D 48
3.3.5 Summary 49
3.4 CONCLUSIONS 50
4 S O F T W A R E V I S U A L I S A T I O N 5 1
4.1 INTRODUCTION 52
4.2 TWO-DIMENSIONAL VISUALISATION 53
4.2.1 SHriMP 54
4.2.2 VIFOR 54
4.2.3 CARE. 55
4.2.4 Cross-Referencing 55
4.2.5 SeeSys and SeeSoft 56
4.2.6 Summary 57
4.3 THREE-DIMENSIONAL VISUALISATION 57
4.3.1 Existing Taxonomies 58
4.3.2 Tangible from Intangible 64
4.3.3 Benefits and Challenges 6 5
Virtual Software in Reality Claire Knight Contents
4.3.4 IAnotAI 66
4.3.5 Abstractions 68
4.3.6 Summary 69
A A CONCLUSIONS 6 9
5 V I S U A L I S I N G S O F T W A R E 7 1
5.1 INTRODUCTION 7 2
5.2 TERMS 73
5.3 RELATIONSHIPS 7 4
5.4 RELATIONSHIP ISSUES 7 9
5.4.1 Evolution 7 9
5.4.2 Scalability 80
5.4.3 Navigation and Interaction 80
5.4.4 Automation 80
5.5 GENERAL ISSUES 81
5.5.7 Correlation 81
5.5.2 Visual Complexity 81
5.5.3 Metaphor 82
5.6 SUMMARY 83
6 R E A L I T Y ; M A P P I N G S A N D M E T A P H O R S 8 4
6.1 INTRODUCTION 85
6.1.1 Language Issues 85
6.2 SOFTWARE W O R L D 87
6.2.1 Overview Description 88
6.2.2 Features of the Visualisation 89
6.2.3 Additional Information Display in the Visualisation 90
6.2.4 Full Mapping 91
6.2.5 Navigation 103
6.2.6 Scalability 103
6.2.7 Automation 104
6.2.8 Evolution 104
6.2.8.1 Overview Description 104
6.2.8.2 Representational Issues 105
6.2.8.3 Use of and for an Evolving Visualisation 111
6.2.8.4 Remarks I l l
6.2.9 Concluding Remarks 112
6.3 SOFTWARE LANDSCAPE 1 1 2
6.3.1 Overview Description 112
6.3.2 Geology and Geography 113
6.3.3 Visualisation Details 115
- vi -
Virtual Software in Reality Claire Knight Contents
6.3.4 Full Mapping 117
6.3.5 Navigation 126
6.3.6 Scalability 127
6.3.7 Automation 127
6.3.8 Evolution 128
6.3.9 Concluding Remarks 128
6.4 SUMMARY 129
7 I M P L E M E N T A T I O N 130
7.1 INTRODUCTION 131
7.2 VISUALISATION IMPLEMENTATION 131
7.2.1 Introduction to Maverik 131
7.3 V I R T U A L ENVIRONMENT TECHNOLOGY ISSUES 132
7.3.1 Limitations of Maverik 133
7.3.1.1 Limitations Due to Implementation Issues 133
7.3.1.2 Limitations Due to Automation Issues 134
7.4 AUTOMATION ISSUES 135
7.4.1 Overview of Process 135
7.4.2 Automation in Detail 136
7.4.2.1 Parsing the Source Code 136
7.4.2.2 Extracting Information 137
7.4.2.3 Generating MAVERIK Source 137
7.5 SUMMARY 138
8 E V A L U A T I O N ; F R A M E W O R K A N D S C E N A R I O S 139
8.1 INTRODUCTION 140
8.2 EVALUATION FRAMEWORK 140
8.2.1 Introduction 140
8.2.2 Metaphor Features 142
8.2.3 Software Visualisation Evaluation System 142
8.2.3.1 The Framework 143
8.2.4 Discussion of the Framework 145
8.3 EVALUATION OF THE EVALUATION (JUSTIFICATION FOR THE FRAMEWORK) 146
8.3.1 Application of the Framework to Software World 146
8.3.2 Application of the Framework to Software Landscape 150
8.3.3 Lessons Learnt - Suitability of the Mapping and Metaphor 154
8.3.4 Conclusions 156
8.4 SCENARIOS 156
8.4.1 Scenario One - Impact 157 8.4.1.1 Problem 157
8.4.1.2 Solution 157
- vii -
Virtual Software in Reality Claire Knight Contents
8.4.2 Scenario Two - Structural Condition 160
8.4.2.1 Problem 161
8.4.2.2 Solution 161
8.4.3 Scenario Three - System Structure 165
8.4.3.1 Problem 165
8.4.3.2 Solution 165
8.4.4 Scenario Four - Method Usage 168
8.4.4.1 Problem 169
8.4.4.2 A Solution 169
8.4.5 Scenario Conclusions 170
8.5 SUMMARY 170
9 C O N C L U S I O N S 1 7 1
9.1 INTRODUCTION 172
9.2 SUMMARY OF RESEARCH 173
9.3 CRITERIA FOR SUCCESS 174
9.4 FUTURE W O R K 176
9.5 CONCLUSION 178
R E F E R E N C E S 1 7 9
B I B L I O G R A P H Y 189
- vi i i -
Virtual Software in Reality Claire Knight List of Figures
List of Figures
FIGURE 2-1 - COGNITIVE DESIGN ELEMENTS FOR SOFTWARE EXPLORATION 1 9
FIGURE 3-1 - PORTAL INTERFACE 4 6
FIGURE 3-2 - PROJECT ISLANDS 4 6
FIGURE 3-3 - A N INFORMATION PYRAMID 4 7
FIGURE 3-4 - INTERNET TRAFFIC I N SEENET3D 4 8
FIGURE 3-5 - ALTERNATIVE SEENET3D REPRESENTATION 4 9
FIGURE 4 -1 - C A L L GRAPH: M E D I U M SIZED SYSTEM 5 3
FIGURE 4-2 - SEESOFT SCREENSHOT 5 6
FIGURE 4-3 - VISUAL REPRESENTATION OF MYERS' TAXONOMY 5 9
FIGURE 4-4 - TOP L E V E L OF THE PRICE ET AL. SOFTWARE VISUALISATION T A X O N O M Y 6 0
FIGURE 4-5 - D E T A I L OF THE SCOPE CATEGORY OF THE TAXONOMY 6 0
FIGURE 4-6 - D E T A I L OF THE CONTENT CATEGORY OF THE T A X O N O M Y 6 1
FIGURE 4-7 - D E T A I L OF THE FORM CATEGORY OF THE TAXONOMY 6 1
FIGURE 4-8 - D E T A I L OF THE METHOD CATEGORY OF THE TAXONOMY 6 2
FIGURE 4-9 - D E T A I L OF THE INTERACTION CATEGORY OF THE TAXONOMY 6 2
FIGURE 4 - 1 0 - D E T A I L OF THE EFFECTIVENESS CATEGORY OF THE T A X O N O M Y 63
FIGURE 5-1 - RELATIONSHIP SUMMARY 7 8
FIGURE 6-1 - SOFTWARE WORLD MAPPING SPECIFICATION STRUCTURE 9 2
FIGURE 6-2 - SKETCH OF THE VIEW SEEN OF THE WORLD 93
FIGURE 6-3 - SKETCH OF A COUNTRY SHOWING THE COMPONENT CITIES 93
FIGURE 6-4 - SKETCH OF A CITY PLAN 9 4
FIGURE 6-5 - SKETCH OF THE FRONT OF A TOWN HALL BUILDING 95
FIGURE 6-6 - SKETCH OF THE PRISM USED TO SHOW CLASS NAMES 9 6
FIGURE 6-7 - SKETCH SHOWING THE NAMING OF QUADRANTS I N THE GARDEN 9 6
FIGURE 6-8 - SKETCH SHOWING A PATH FROM THE GARDEN 9 7
FIGURE 6-9 - SKETCH SHOWING THE LAYOUT OF THE GARDEN QUADRANTS A N D PATHS 97
FIGURE 6 - 1 0 - SKETCH OF A MONUMENT, SHOWING THE INSIDE ROOMS 9 8
FIGURE 6 - 1 1 - SKETCH SHOWING THE LAYOUT OF BUILDINGS ON A BLOCK 100
FIGURE 6 - 1 2 - SKETCH SHOWING A BUILDING DOOR 100
FIGURE 6 - 1 3 - SOFTWARE LANDSCAPE MAPPING SPECIFICATION STRUCTURE 1 1 8
FIGURE 8-1 - GRAPHICAL VIEW OF FRAMEWORK 144
FIGURE 8-2 - TASK FEATURES BEING THE PRIMARY CONCERN 145
FIGURE 8-3 - SCENE FROM SOFTWARE WORLD SHOWING CENTRAL GARDEN, WITH VARYING SEES OF
BUILDINGS I N THE FOREGROUND 158
FIGURE 8-4 - MONUMENT I N SOFTWARE WORLD 159
FIGURE 8-5 - VARIABLE INFORMATION AVAILABLE 160
- ix -
Virtual Software in Reality Claire Knight List of Figures
FIGURE 8-6 - OVERVIEW OF A DISTRICT SHOWING M A N Y SMALL METHODS WITH MOST PROCESSING
REPRESENTED BY THE THREE LARGER BUILDINGS 161
FIGURE 8-7 - CLOSE UP VIEW OF BUILDINGS I N A DISTRICT 162
FIGURE 8-8 - SOFTWARE WORLD OVERVIEW OF A DISTRICT BASED ON A REASONABLY SIZED CLASS, WITH
TWO METHODS THAT CONTAIN LARGE AMOUNTS OF CODE 163
FIGURE 8-9 - V I E W ACROSS A DISTRICT THAT SHOWS A UTILITY CLASS WITH LOTS OF SMALL METHODS ... 164
FIGURE 8 - 1 0 - V I E W OF A DISTRICT THAT SHOWS HOW THE AUTOMATION A N D LAYOUT CATER FOR SMALL
AMOUNTS OF CODE WHILE STILL MAINTAINING THE METAPHOR A N D MAPPING CONSTRAINTS 164
FIGURE 8 - 1 1 - V I E W ALONG A STREET (BETWEEN BLOCKS) TOWARDS THE CENTRAL GARDEN AREA 166
FIGURE 8 - 1 2 - V I E W THAT SHOWS THE DIFFERENCE BETWEEN PUBLIC METHODS A N D THOSE THAT HAVE
SOME FORM OF ACCESS MODIFIER APPLIED TO THEM. T H E BROWN BUILDINGS SHOW PRIVATE
METHODS I N THIS CLASS 167
FIGURE 8 - 1 3 - NOTICEBOARD STRUCTURE FOR COMMUNICATION OF KNOWLEDGE, ACTUAL LAYOUT A N D
STRUCTURE DEPENDENT ON IMPLEMENTATION TECHNOLOGY 168
- X -
Virtual Software in Reality Claire Knight List of Tables
List of Tables
T A B L E 6-1 - A C T U A L MAPPINGS FROM JAVA CODE TO GRAPHICS 9 1
T A B L E 6-2 - GEOGRAPHIC L A N D FEATURES 1 1 4
T A B L E 6-3 - GEOGRAPHIC VEGETATION FEATURES 1 1 4
T A B L E 6-4 - GENERAL GEOGRAPHIC FEATURES 1 1 5
T A B L E 6-5 - A C T U A L MAPPINGS FROM JAVA CODE TO GRAPHICS 1 1 7
T A B L E 8-1 - SUMMARY OF VISUALISATION EVALUATIONS 155
- xi -
Virtual Software in Reality
Chapter One - Introduction
Virtual Software in Reality Claire Knight Introduction
1.1 Background
Program comprehension is an important part of many aspects of the software engineering process because
of its tight integration with any code-based activity. Whilst program comprehension does not exclusively
deal with code at the statement level, many of the endeavours requires the code to be used as the primary
information source. To be able to modify code (either through replacement, change, or by addition)
requires that what currently exists be understood and either replicated to some extent or corrected or
enhanced in some way. This activity, in particular, is an important and resource consuming part of
software maintenance and so any technique which purports to be able to aid comprehenders and
maintainers is an important and useful development.
Visualisation is a more recent technique used to represent many things in a graphical way. It is current
only due to the fact that technology has reached a point whereby the use of graphics a feasible way of
dealing with data. Due to, primarily, the current hardware and technology advances, visualisation
research is receiving a lot of attention in many areas. The scientific and information visualisation fields
have developed relatively sophisticated techniques for the display and manipulation of complex data.
What is unusual is that the software engineering community, exactly those who have played a part in
enabling such tools, shy away from the new technologies. Visual representation has much to offer in
dealing with large data sets, presenting complex data, providing efficient browsing and manipulation, and
hence aiding such tasks as program comprehension and software maintenance.
Software visualisation is one way of addressing many of the shortfalls of the changing arena of program
comprehension. Software, despite many software engineering advances in requirements, design and
implementation techniques, continues to be complex and large and i f anything seems to be growing in
these respects. This means that techniques that failed to aid comprehension and maintenance are certainly
not going to be able to deal with the current software and that this area requires research to be able to
suggest solutions to deal with the information overload that is sure to occur.
1.1.1 Software Maintenance
Software maintenance is generally considered to be the last phase in the software lifecycle. Whilst this
could be argued from the standpoint that it follows the previous requirements, specification and design, it
is not that simple. During the process of maintenance it may be necessary to go back to any other level of
the lifecycle. Maintenance is often overlooked from a managerial viewpoint and software is not seen as a
company resource. This very often means that there is not enough support or funding for the software
engineers in the company to perform adequate maintenance. This reason alone provides motivation for
producing tools which can help the maintainer.
- 2 -
Virtual Software in Reality Claire Knight Introduction
Lientz and Swanson [Lien80] provide an early definition of software maintenance but later research work
at the Centre for Software Maintenance (now encompassed within the Research Institute in Software
Evolution) at the University of Durham defines software maintenance as:
"Software Maintenance is the set of activities (both technical and managerial) necessary to ensure that software continues to meet organisational needs".
Empirical studies have produced various statistics as to the true cost of software maintenance, but exact
figures apart, all have shown that much time, effort and money is and needs to be used in this phase.
Figures produced in these studies show that the maintenance phase consumes between 50% and 70% of
the software budget. Any tools that help with maintenance should therefore be of interest to maintainers
and companies alike.
1.1.2 Program Comprehension
Program comprehension is a major factor of software maintenance. Ogando et al. [Ogan94] summarise
this as:
"Successful maintenance requires precise knowledge of the data items in the program, the way these items are created, and their relationships."
Chapin and Lau [Chap96] describe program comprehension as the most skilled and labour intensive part
of software maintenance, and Oman [Oman90b] writes that the key to effective software maintenance is
program comprehension.
The problem with code maintenance is that very often the creator(s) of the original code are no longer
around and people who are unfamiliar with the system, and sometimes the language of implementation,
have to carry out the work. Much work is still being done with comprehension because researchers are
trying new ways of displaying the program code, in varying levels of detail.
There have been various studies carried out about the types of comprehension done during maintenance,
and also how programmers and engineers comprehend code. Empirical studies have shown that indented
and spaced code is easier to read. Colour has also been found to be of use to some programmers. The
tools used to aid comprehension can be categorised into two main areas; static analysis tools and dynamic
analysis tools. Static analysis tools provide information to the user of the tool based only on the source
code whilst dynamic analysis tools are used with the program as it is executing.
There are several different ideas as to the strategies maintainers and programmers use when
comprehending code. A good overview of the different strategies and their interrelationships can be
Virtual Software in Reality Claire Knight Introduction
found in Storey et al. [Stor97]. A very useful distinction that they make is that a mental model is the
representation in the programmer's mind and that the cognitive model is the processes and structures that
are used to help the programmer to form their mental model.
1.1.3 Visualisation
Visualisation has come to the forefront of scientific investigation in recent years because it relies on the
use of graphical machines. For many years it was not feasible to find, or even expect to find, such
equipment on everyone's desks. With the advancements made in hardware and corresponding falling
costs, visualisation has the potential to become a very powerful tool.
The scientific and information visualisation communities have done much to advance the techniques in
this area and have succeeded in opening up many new directions of research. At this moment the software
engineering community, including software maintenance and program comprehension, are slow to
consider, adapt and adopt such work. The novelty should not be an issue. These techniques are now well
established in the fields in which they are used, therefore there is some benefit to such techniques. Studies
have also shown the effectiveness of some of them, within their domains.
1.1.4 Virtual Reality
Virtual Reality (VR) is an enabling technology for the modern developments in visualisation. It allows
sophisticated and powerful representations to be used to create a wide-ranging number of visualisation
styles and techniques. These techniques all have the benefit of using three-dimensions, and when used
effectively, can provide much more information and interaction at any one point than the more traditional
two-dimensional forms of visualisation. There are cognitive issues (good and bad) associated with the use
of three dimensions and VR, but by taking into account these problems and benefits it is a useful
mechanism to use for dealing with large amounts of complex information.
1.1.5 Software Visualisation
Much of the research that claims to be software visualisation still deals with the two dimensional
techniques of nodes and arcs, although some now incorporate extra filtering or display techniques. Whilst
these existing techniques have benefit and can be very useful in certain situations they are not the only
display mechanism that is either appropriate or effective. The challenges of both scale and complexity are
- 4 -
Virtual Software in Reality Claire Knight Introduction
not adequately met with existing techniques and so new areas need to be investigated in order to at least
begin to address them.
New research for comprehension and maintenance activities should try to counter the problems and
deficiencies of existing work. Unfortunately much of the research activity is still directed at changing the
graph representations or adding an extra dimension to those images. This may solve certain small issues,
but go no way towards solving the greater ones, nor do the extensions work for all cases and very often
create a whole new set of problems. The application of three-dimensions without regard to its usage can
cause more problems than the existing techniques. Applied with thought and consideration, three
dimensions has the power to enhance the knowledge and comprehension of those using the visual
representations.
1.2 Objectives
Many of the problems relating to the current state of the art in software visualisation have been mentioned
in the introductory text above. The primary ones are complexity and scale. These are both vital
components of software and without it, with current languages, software would not be able to deal with
many of the problems that it is created to solve. Having decided that these properties are an integral part
of software, the task for software visualisation is to find ways of showing both these attributes, but also to
provide ways of going beyond them and allowing access to the information that is usually obscured by
them.
One critical element of software that must be considered, i f the focus is software visualisation, is of the
intangible nature of software. Not only are the relations and components of software related in many
ways, the shape of these relations and the software as a whole, cannot be determined through any
representation of the software in reality. Unlike scientific visualisation, which visualises data based on the
premise that the source of the data has a form in reality, such as the brain, software visualisation has to
deal with the fact that software (apart from an interface) does not have a form. Program code is only a
series of zeros and ones; electrical pulses in circuitry. There needs to be some way of representing the
code in a more manageable way that allows the process of knowledge gathering to take place with relative
ease.
1.2.1 Virtual Software; Software Visualisation
There are several issues that this research addresses; all of them related to the creation of software
visualisation systems that are capable of being used and useful well into the next generation of software
Virtual Software in Reality Claire Knight Introduction
systems. As has been mentioned the scale and complexity of software are pressing issues, as is the
associated information overload problem that this brings. In an attempt to address this problem the
following are considered to be important:
• Abstractions
• Representations
• Mappings
» Metaphors
• Visualisations
These identified areas are interrelated and the first four enable the final one, visualisations. The
consideration of real world metaphors (by definition, three-dimensional) is controversial but also under
researched. It will form part of this work to assess the reasons why it may be desirable and how it can be
used to good advantage. In doing so, the representations, mappings and abstractions within this metaphor
wil l be designed to enable the process of program comprehension to proceed as smoothly and as user
controlled as is possible. Together these facets will provide the basis of software visualisation systems
that can be intelligence amplifying program comprehension aids.
These problems are not the only ones that face software visualisation systems. There are many that are
based on the general theory of the applicability of the technique to such tasks as program comprehension,
rather than the detail of how a particular code fragment is shown. These problems are also related to the
enabling technology of three-dimensional visualisations; VR. In summary the areas of interest are:
• Automation
• Evolution
• Scalability
• Navigation and Interaction
• Correlation
• Visual Complexity
In creating software visualisation systems that act as intelligence amplification aids and in doing so
address the above issues, there is much scope for usable and powerful tools. An even more useful
enhancement to this research is to consider an extension of the VR concept to virtual environment
technology. This then allows many users to work with the visualisation and each other in virtual space,
and provides a common frame of reference for detailed technical discussion. This enhancement would
also go some way towards addressing some long standing software engineering issues such as the informal
transfer of system knowledge between maintainers. Because of technological issues, the consideration of
multi-user will be restricted purely to the theoretical aspect of this thesis, and the co-operative processes
and personal issues that are the focus of much other research wil l be taken as actualities for this research.
- 6 -
Virtual Software in Reality Claire Knight Introduction
1.3 Criteria for Success
The criteria for success of this research can be considered to be, in overview, the creation of three-
dimensional software visualisation techniques that can be applied to large, complex, and evolving
software systems without loss of usability and without hindrance to the program comprehension task.
This can be broken down into areas, of which this research will address all at some degree of detail. The
criteria for success are therefore:
A. Demonstrating the viability of using three-dimensions for software visualisation.
B. Defining real world metaphors for software visualisation.
C. Assessing the suitability of real world metaphors for representing intangible data sources.
D. Examining the ability of a visualisation to be able to scale to deal with increased size and complexity.
E. Demonstrating the automatability of the visualisation technique.
F. Identifying the impact that issues such as evolution, navigation and correlation of information have on
software visualisation.
G. The development of a framework as a way of being able to judge whether a virtual environment based
software visualisation is able to meet the visual and comprehension demands that wil l be placed upon
it.
Chapter 9 provides an evaluation of the research presented in the rest of this thesis against these identified
areas.
1.4 Thesis Overview
This thesis is organised into nine chapters, with this being the first. Chapter 2 provides an overview of
program comprehension. The various models and techniques suggested as ways of carrying out
comprehension of code are presented, as are central concepts such as the use of mental models.
Chapter 3 introduces VR and three-dimensional visualisation. These two topics are presented together
because of the link between them; one provides an implementation mechanism for the other. The various
issues that relate to these topics are presented and discussed and an overview of the subject areas is
provided.
Chapter 4 moves to consider software visualisation, after Chapter 3 considered only general visualisation.
To provide a context, this chapter begins with a brief survey of two-dimensional techniques and some of
the problems with this form of representation. Following this, three-dimensional software visualisation is
considered, along with some more issues relating to the use of three-dimensional information but in the
domain of software visualisation.
- 7 -

Virtual Software in Reality Claire Knight Introduction
Chapter 5 contains the theory behind this research. The derivations and route taken to reach this
classification of software visualisation are provided as rationale for the decisions made and the work
presented later in the thesis. This chapter allows the current state of the art to be related to this research
and the future directions of the field of software visualisation. This information is presented through the
use of relationships, based on definitions that also form part of the chapter.
Chapter 6 then presents two theoretical visualisations of Java code that attempt to address the issues and
theories of the previous chapter. The visualisations are classed as theoretical because they do not consider
the technology limitations and concern themselves more with the usability and task suitability for which
they are intended. The first of these visualisations is also discussed in detail in the context of evolution,
an important consideration for software.
Chapter 7 provides an introduction to the implementation process of the automated prototype. The
process of generating the visualisations is provided, as is an overview of the technology used to achieve
this prototype.
Chapter 8 evaluates the visualisations presented in Chapter 6. This is done by means of an evaluation
framework and several usage scenarios. The evaluation framework is also presented in this chapter with a
discussion of its component parts and a rationale for their inclusion. This framework is applied to both
theoretical visualisations. The scenarios also demonstrate the use of one of the visualisations when
carrying out representative program comprehension tasks.
Chapter 9 presents a summary of this research and the conclusions that can be drawn from it. The
research is then evaluated against the criteria for success identified in section 1.3. Further work is also
considered in this chapter.
Virtual Software in Reality
Chapter Two - Comprehension
Virtual Software in Reality Claire Knight Comprehension
2.1 Introduction
Program comprehension is an important part of not only software maintenance, but also the entire
software engineering process. It is required for many tasks that are carried out under these broad headings
but for all the aim is the same. Program comprehension is carried out with the aim of understanding an
existing piece of code. It is a gradual process of building up the necessary understanding by examining
sections of the source code. Using the knowledge gained from the source code explanations and
understanding can be built and refined. According to Biggerstaff et al. [Bigg94] this process of discovery
and refinement is known as the Concept Assignment Problem, whilst several other program
comprehension strategies have different terms or processes to describe the same activities (such as bottom
up comprehension). An overview of many types of program comprehension can be found in Robson et al.
[Robs91] and Von Mayrhauser and Vans [Mayr95].
Despite the importance of program comprehension to such a diverse and wide range of other software
maintenance activities there still remains much work to be done to improve the tools and refine the
techniques that exist today. Software continues to increase in size and complexity and whilst the program
comprehension theories may support this growth, the tools and techniques developed for helping
maintainers do not keep up with the speed, and size of change.
2.2 Complexity Issues
Program comprehension can be carried out in many ways and using different methods. Not only are
current software systems difficult to comprehend because their size and complexity far exceeds that of the
human brain but also that everyone works in different ways. It is this difference that requires research into
easing program understanding to provide alternative ways for discovering information and validating
hypotheses. Many authors recognise the complexity and the cognitive effort required for program
comprehension including Pennington [Penn87], Bennett and Ward [Benn94] (especially for large-scale
systems) and Letovsky [Leto87].
In order to talk about the support necessary in modern program comprehension tools it is first necessary to
look at the range of theories that exist about how programmers carry out the various tasks making up the
overall comprehension process and also to examine the comprehension process as a whole. Once key
features have been identified from this, the type of support most needed for the various tasks can be
incorporated into new tools.
- 10-
Virtual Software in Reality Claire Knight Comprehension
2.3 Cognitive Models and Strategies
Many authors have documented the ways in which studies have shown that programmers understand code
such as Corbi [Corb89], Oman and Cook [Oman90a] and Chan and Munro [Chan97]. These documents
provide brief overviews of the strategies. To provide more information, the details of the main theories,
strategies and concepts are summarised in the following subsections.
2.3.1 Top Down (Hypothesis Driven)
Brooks [Broo83] proposed a top down theory of program comprehension that centred on beacons as
knowledge structures. His theory is hypothesis driven and he theorises that programmers use increasingly
specific hypotheses to derive the functionality of the code. The programmer then has to verify (or reject)
these hypotheses through examination of the code and then refining those hypotheses as necessary.
Brooks maintains that programmers use beacons for the verification of their hypotheses, and that beacons
can be described as stereotypical sections of code.
Beacons are surface features of programs that indicate the function of that program and empirical studies
have shown that beacons are a key element of program understanding (Wiedenbeck [Wied91]). These
studies have also shown that incorrect beacons have been proved to be a hindrance to experienced
programmers. Wiedenbeck also makes the point that beacons are not the only mechanisms used during
program comprehension, but are good starting points towards understanding.
Soloway and Ehrlich [Solo84] observed a top-down approach to comprehension by expert programmers
when the code is familiar. The mental model is then constructed by forming a hierarchy of goals and
programming plans. Rules of discourse are then used to break down goals into lower levels and sub-
goals.
2.3.2 Plans, Chunks and Cliches
Plans are related to the beacon concept. Basic plans can be seen as program fragments of stereotypical
code that achieves a simple, single, goal. Programs are therefore plans containing several plans (which
may themselves contain other plans). Soloway and Ehrlich [Solo84] suggest that expert programmers
have knowledge not only of these plans but also of rules of programming discourse. These rules specify
programming conventions and therefore set up expectations in the minds of programmers. The results
obtained by these authors from experiments agree with their suggestions that plans are used by expert
programmers during the comprehension process. In similar results to the beacon experiments (as carried
- 11 -
Virtual Software in Reality Claire Knight Comprehension
out by Wiedenbeck [Wied91]) un-plan like structures in code hinder experienced programmers and they
need to spend more time bringing in other reasoning strategies to compensate.
Implementation cliches as defined by Rich and Waters [Rich88] are also related to plans and beacons.
Cliches are combinations of commonly used elements and are at a level above primitive code elements
such as assignments. Cliches can be said to consist (generally) of roles and constraints. The roles of a
cliche can vary from one occurrence to the next, whilst the constraints are fixed elements of the cliche.
Chunks (Soloway and Ehrlich [Solo84]) are another descriptive term that has been used to describe higher
level sections of code. They are considered to be syntactic or semantic abstractions of text structures in
the source code. These abstractions can be directly compared to the program fragments that achieve a
single goal. Whilst the terms cliche, chunk and plan are not interchangeable, they are similar in definition
and focus in the context of program comprehension. Plans and syntactic chunk abstractions can be seen as
similar whilst cliches and semantic chunk abstractions are similar but obviously at a higher level of
abstraction.
2.3.3 Bottom Up
Bottom-up comprehension is based on the concept of building up understanding from the bottom by
reading source code and then mentally building these smaller pieces of information into higher level
abstractions.
Pennington [Penn87] suggests that programmers gather various sorts of information from program code
and that these differing sorts of information have different mental representations. Pennington believes
that comprehension is achieved through a bottom up process of recognition of operations via control flow
and understanding the local code. She identified five levels of knowledge:
• Operations
• Control flow
« Data flow
6 State
• Function
Following empirical studies of this method Pennington concluded that knowledge is initially built up at
lower levels than functions. The results suggest that control flow information is acquired before detailed
function information is added to the programmers' knowledge of the code.
Based on the theory and results of Pennington, Teasey [Teas94] carried out experiments as to the effect of
naming style and programmer expertise on the comprehension process. His results showed that the task
demands influence the knowledge that is extracted during comprehension (and hence the strategy
employed) and that novices and experts have different comprehension processes.
- 12-
Virtual Software in Reality Claire Knight Comprehension
2.3.4 Knowledge-Based
Letovsky [Leto87] carried out some empirical studies of programmers understanding code and from this
developed several theoretical strategies about hypothesis generation and verification. These were
• Questions
• Conjectures
o Inquiries
Questions can be roughly categorised into one of five types:
• Why questions
Asking about the purpose of actions or designs
• How questions
Asking about the way a program (sub) goal is achieved
• What questions
Asking about functions or variables in the program
• Whether questions
Asked about the behaviour of the code
• Discrepancy questions
Reflect confusion over an apparent inconsistency in the code
Conjectures were defined to be
"any plausible inference about the program"
and from analysis of the empirical data, conjectures were split into two; content and certainty. Content
conjectures can be defined as why, how, what and word (where word is a subtype of what and based on
meaningful program identifiers) whilst the certainty conjectures can be defined as guesses or conclusions.
An idealised inquiry is based around questions, conjectures and then searches of the code. Letovsky
[Leto87] defines an inquiry to be:
"The subject is reading along and encounters some fact that prompts him to ask a question.
He conjectures answers to his questions.
He attempts to find an answer by searching through the code and/or documentation for relevant information, or occasionally, by doing detailed reasoning about the program.
At some point he finds something that allows him to draw a conclusion. He then resumes his previous activity."
This is very much like the hypothesis driven ideas proposed by Brooks [Broo83].
Letovsky suggested that programmers are opportunistic and exploit either bottom-up or top-down
comprehension strategies as needed. He developed a model that contained a knowledge base, a mental
- 13-
Virtual Software in Reality Claire Knight Comprehension
model and an assimilation process. The knowledge base is any prior knowledge or experience the
programmer may have. The mental model is a representation of the programmers' current understanding
of the program and the assimilation process describes the evolution of the mental model using both the
knowledge base and source code of the program being studied.
2.3.5 As Needed/Goal Directed and Systematic
Based on the results of experiments carried out, Littman et al. [Litt86] speculated that there were two
types of strategy employed when comprehending existing source code; as-needed and systematic. The as-
needed approach is based on the localised understanding of areas of the source code thought to impact and
be impacted by a change. Those areas of the code that do not fall into this container of impact are then
not considered during the comprehension process. The level of knowledge achieved is based on a
subjective judgement as to what is necessary by the maintainer. The systematic strategy suggests that the
entire program code be understood before any changes are attempted.
In addition to the two strategies, Littman et al. [Litt86] suggest that there are two forms of knowledge;
static knowledge and causal knowledge. Static knowledge is knowledge from an analysis of the source
code in it's textual non-running form whilst causal knowledge covers the interactions between the various
parts of the software, often when it is running. The authors also divide the mental model created by the
programmer into weak mental models and strong mental models. Weak mental models contain only static
program knowledge and are built by programmers using the as-needed strategy. Strong mental models
contain not only static program knowledge but also causal knowledge about the program. Programmers
who use the systematic strategy for understanding build strong mental models, although the authors
acknowledge that it is unrealistic for many real systems to even try and obtain complete systematic
understanding.
2.3.6 Syntactic and Semantic Knowledge
According to Schneiderman and Mayer [Schn79] (as referenced in Robson et al. [Robs91]) program
comprehension is the process of forming internal semantics about the program under consideration. This
information would be represented in a range of abstraction levels from an overview of the program's
operation down to the function of a small piece of code. The authors then presented the knowledge
required for this process as being split into semantic and syntactic. Semantic knowledge is domain and
experienced based knowledge such as general programming concepts whilst syntactic knowledge deals
with the actual code statements required to achieve a given task. These concepts can be seen, albeit in
slightly different forms, in the ideas of Letovsky [Leto87] and in the work by Von Mayrhauser et al.
[Mayr97].
- 14-
Virtual Software in Reality Claire Knight Comprehension
2.3.7 Integrated Model
Comprehension through a mixture of top-down and bottom-up strategies is now accepted. Studies carried
out by Von Mayrhauser et al. [Mayr97] showed that programmers frequently switch between the levels of
abstraction that they are working at and are primarily concerned with what the software does and how it is
accomplished. Their studies show that cross-referencing of information from many sources is required
and carried out by programmers when they are trying to understand program code.
The integrated model has four major components:
1. program model,
2. situation model,
3. top-down model (domain model) and
4. knowledge base.
The first three of these are the comprehension processes whilst the fourth is necessary in successfully
building the previous three. The top-down model is usually invoked i f the code is familiar where
hypotheses are the driving force of cognition (Brooks [Broo83], Letovsky [Leto87]).
I f the code is new to the programmer then the program model is built up first (defined by Pennington
[Penn87] as the control flow). Once this basic program model exists then the situation model is
developed. This again works from the bottom up and involves the mental creation of a dataflow
abstraction.
2.4 Mental Models
A programmer builds an understanding of the system through the creation of a mental model of that
system. This model is built from the scarcest information and then refined as more of the code is
examined and placed in context. Wiedenbeck [Wied91] writes that this initial orientation phase (the basic
mental model) is important because it allows the basic goals and operations of the program to be
structured, and provides a framework for a more detailed study of the program. Burd et al. [Burd96]
describe this process as gradually piecing together the software puzzle.
As Davis [Davi95] summarises, the information gathering process is significant in forming a mental
representation. He also writes about the programmer trying to solve a puzzle because of the non-linear
comprehension that has been shown to take place. Non-linear comprehension requires that related
- 15-
Virtual Software in Reality Claire Knight Comprehension
information can be freely navigated and is not restricted to a strict one directional fixed flow of
information.
Pennington [Penn87] makes the observation that the memory representation of text is assumed to have
levels and that the mental representations of text and associated knowledge structures are linked in the
comprehension process.
A l l program comprehension strategies support the creation of a mental model in some form. Many
cognitive scientists believe that bias can come from the way in which humans develop and use their
mental representations of situations (information provided by Stacy and MacMillian [Stac95]). I f humans
then perform deductive (or even inductive) reasoning based on the mental model rather than the
propositions or facts to hand then this bias can interfere with that reasoning. This can cause judgmental
errors by programmers, and they may even erroneously explain away events that needed more
investigation.
Many other authors acknowledge the use of a mental model when carrying out program comprehension
including Letovsky [Leto87], Young and Munro [Youn97], Storey et al. [Stor97] and Teasey [Teas94].
2.5 Program Relations
A program is a complex set of relations between the elements of that program. Much of the previous
program comprehension work has focused solely on control and data flow but these are only two of many
possible relations that may be of use to the maintainer. Some authors refer to the complexity and number
of relations in a program, such as Livados [Liva93] and Pennington [Penn87] whilst others acknowledge
that the relations of a program are usable for program comprehension (Ball [Ball96]).
Much has been written about program code containing relations but there has been little work on
extending program comprehension research into effective use of these other relations. One exception is
the work done by Chan and Munro [Chan97] which is based around a matrix of program relations to
reflect the many dimensions of a piece of code. A tool has been implemented that allows programmers
and maintainers to examine different views of the code at different levels of abstraction. The tool allows
maintainer directed browsing with appropriate (context dependent) alternate relations presented depending
on the current piece under investigation.
- 1 6 -

Virtual Software in Reality Claire Knight Comprehension
2.6 Desirable Properties and Areas of Research
Program comprehension is very much a gradual process where the maintainer gathers information through
studying various aspects of the code at different times, and possibly by returning to previously examined
pieces of code. Wiedenbeck [Weid91] supports this view of program comprehension. This process is
true regardless of the strategy employed to examine the various pieces of code that constitute the system.
"Comprehension of computer programs involves detecting or inferring different kinds of relations between program parts."
Pennington [Penn87]
The important word in the quote by Pennington is detecting. The process of linking together pieces of
evidence and any relations between them (such as validating alibis) is a common process in detective
work.
Letovsky's empirical work [Leto87] concentrated on programmers asking questions and then conjecturing
answers. This process is very like hypothesis verification and both these activities can be equated with the
search through evidence to find strong facts. The process of enquiry, directed by some fact or facts can
easily be equated with the work of a detective.
Corbi [Corb89] actually explicitly recognises the detective process used by programmers when trying to
comprehend existing code:
"To successfully modify some aging programs, programmers have become part historian, part detective and part clairvoyant."
Generally the process of investigation is deductive because the programmers are not trying to create any
new "axioms". The main concern is to try and make sense of the information (or evidence) that they
already have.
This process of detective work points to the need to provide flexible tools that allow for the evidence
gathering and hypothesis refinement to be achieved in several ways, thus supporting many of the different
strategies said to be employed during program comprehension. To be able to freely move between related
pieces of information allows this knowledge discovery and clarification to proceed in a non-linear fashion.
This should then enable the maintainer to work more easily simply by using the tool to follow their train of
thought, or to put it another way, their line of inquiry.
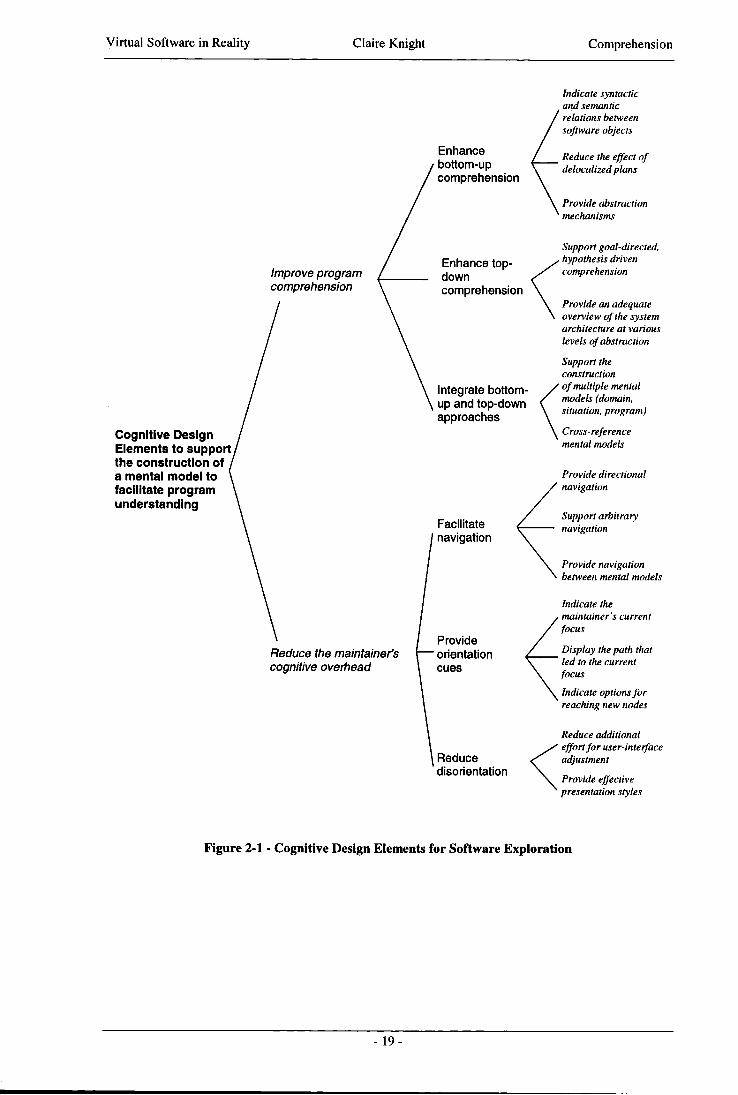
Storey et al. [Stor97] identified a hierarchy of cognitive issues that are important when considering what
facilities a program comprehension tool should include. They identify the fact that software exploration
tools can be likened to hypermedia document browsers. Because of this a hierarchy of hypermedia
cognitive issues has been adapted to form program comprehension guidelines. This hierarchy of elements
is shown in detail in Figure 2-1. Also identified is the lack of support in existing systems for the
- 17-
Virtual Software in Reality Claire Knight Comprehension
integrated and top-down models of comprehension and the inability to switch between different mental
model information. Navigation and orientation cues were also identified as an area for future research.
The work done by Chan and Munro [Chan97] identifies the need to provide different viewpoints for
maintainers. This allows them to choose the most appropriate view for the current task, and also to be
able to switch between views to gain a higher or lower level understanding of some piece of information.
As long ago as 1987 authors had realised the benefit of cross-referencing information but few tools have
actually implemented such functionality. Munro and Robson [Munr87] implemented an interactive cross-
reference tool that solved a problem at the time of cross referencers only producing large listings of
textual information. Foster and Munro [Fost87] produced a cross-reference tool that allowed maintainers
to cross-reference the source code, and included documentation. Fletton and Munro's [Flet88] work is
also related to this cross-referencing idea.
Landis et al. [Land88] identified the use of cross-referencing but suggested it is only useful for variable
information and determining where to make changes of that nature. In terms of dataflow it was considered
to be of less use, and a criticism of the method was that variables with the same names in different scopes
could be listed and confuse the programmer.
Von Mayrhauser et al. [Mayr97] suggest that cross referencing of related areas of code would make
identification of areas where changes need to be made easier. These cross-reference links should be,
where possible, hypertext and also link to algorithm and/or domain information. They also identify the
need to provide orientation cues in the documentation and propose the use of some form of browser
history with on-line sticky notes to make this effective. They also think that documentation of the system
(which could be included in any tool that was used to aid comprehension) should have a high-level road
map of the system structure.
- 18-
Virtual Software in Reality Claire Knight Comprehension
Enhance bottom-up comprehension
Indicate syntactic and semantic
r
relations between software objects
Reduce the effect of delocalized plans
Provide abstraction k mechanisms
Improve program comprehension
Enhance top-down comprehension
Integrate bottom-up and top-down approaches
Cognitive Design Elements to support/ the construction of a mental model to facilitate program understanding
Facilitate navigation
Support goal-directed, . hypothesis driven
comprehension
Provide an adequate overview of the system architecture at various levels of abstraction
Support the construction
' of multiple mental models (domain, situation, program)
Cross-reference mental models
Provide directional navigation
Support arbitrary navigation
Provide navigation between mental models
Reduce the maintained cognitive overhead
Provide ' orientation cues
Indicate the maintainer's current focus
Display the path that led to the current focus
Indicate options for reaching new nodes
i Reduce disorientation
Reduce additional ' effort for user-interface
adjustment
Provide effective ' presentation styles
Figure 2-1 - Cognitive Design Elements for Software Exploration
- 19-
Virtual Software in Reality Claire Knight Comprehension
2.7 Conclusions
This chapter has provided an overview of the main ideas and strategies of the program comprehension
field, and where possible made explicit the relation between similar concepts. Building on this, the mental
model idea can be seen as central to the program comprehension process regardless of the mechanisms
used to construct it. There is also much research still to be done in program comprehension and a
summary of areas where authors have identified deficiencies is provided. Many of these areas have
provided a basis for software visualisation; an area that is examined in much more detail in Chapter 4.
- 2 0 -
Virtual Software in Reality
Chapter Three - Three-Dimensional Visualisation and Virtual Reality
Virtual Software in Reality Claire Knight Three-Dimensional Visualisation and VR
3.1 Introduction
Virtual Reality (VR) is a useful mechanism for enabling a wide range of three-dimensional applications to
be realised. It is also a good implementation system for three-dimensional information visualisations, of
which software visualisation can be considered to be a subset. There are many issues, both technological
and otherwise, surrounding such a relatively new technique as VR and they will be examined in this
chapter. It is appreciated that the concepts of VR may have been around for a long time but the various
technologies of which it may comprise are a more recent innovation.
A closely related field is that of three-dimensional visualisation (mentioned briefly above) and a general
introduction to both visualisation and then the use of three dimensions will follow the various VR
discussions. These concepts will be introduced as theory and where appropriate citing examples of such
work from the literature. It is not the intention to provide an exhaustive summary of this sort of
visualisation as other authors have already done so [Youn96].
3.2 Virtual Reality Environments
Virtual Reality (VR) has become a hot topic in recent years. The increasing power available in today's
desktop computers and consequently their ability to display better graphics has pushed this field into the
public eye. The more advanced industrial and research systems have very sophisticated machinery
available to them including spatial monitoring of users and haptic devices for use with the VR systems,
but a VR system does not have to include all of these as will be discussed below. Due to the public
perception of VR much of the actual capabilities do not yet match the expectation, although with ever
more technological improvements this is getting closer.
3.2.1 What is Virtual Reality?
A good definition of Virtual Reality (VR) is given by Isdale, [Isda93] (referenced from Aukstakalnis et al.
[Auks92]):
"Virtual Reality is a way for humans to visualize, manipulate and interact with computers and extremely complex data."
This definition puts the emphasis in computer representations of some form, along with the ability to be
able to interact and manipulate the visualisations provided in some way. Some people view VR as purely
the special headsets and control pads/gloves and nothing more. Others see VR as much more, such as
reading a book where the mind creates the virtual environment. These two views are extremes and the
- 2 2 -

Virtual Software in Reality Claire Knight Three-Dimensional Visualisation and VR
definition provided above takes a middle view and the one which best encompasses the computer science
perspective when VR is taken as a tool rather than a technology to be investigated.
3.2.2 Types
There are several types of VR systems around. These range from the simplest display on a normal
computer monitor to fully immersive systems. The systems that make use of computer monitors as
standard are known as "Window on a World" systems (WOWs). Many of the computer games available
today fall into this category - especially the first person viewing systems such as Wolfenstein, Doom,
Descent, Quake, Quake 2, and Quake 3 Arena and many of the desktop flight simulators. Various other
games make use of three-dimensional views (especially the sporting simulators such as the FIFA range of
games made by EA Sports) but generally the camera view is not one which lends itself to giving the user a
perception of VR. It can be argued that it is just a different view provided by a WOW, a more passive
viewpoint where there is control over the contents of the window but the camera views and direction of
looking are controlled elsewhere. Video mapping is a technique that is used to put an image of the user
into the world and the user can then view his own interaction on a standard monitor using the WOW
method.
The total VR system is one that immerses the user (viewpoint) within the virtual world. Special
technology is needed to be able to achieve this. These systems use head mounted displays that contain all
the visual and auditory information necessary for effectively interacting in the virtual world. A variation
is when a room is converted into a complete visual environment using several large projections of the
virtual world the user is immersed in. There also needs to be appropriate tracking mechanisms and a
means of interaction with the user. This sort of system has been popularised by the research, development
and now commercialisation of CAVE environments [John94, Keny95, Roy95, John95, Leig96, Leig98,
and Leig99]. CAVE is a projection based virtual environment system that surrounds the viewer with up to
four screens and allows both physical and virtual objects to occupy the same space. The CAVE
environment is an inside-out viewing paradigm, where the design is such that the viewer is inside a
physical (and virtual) space looking out at the world as opposed to looking in on the world from an
outside viewpoint (as with WOW systems).
There are ways to combine VR displays and worlds with information visualisation of a more conventional
nature. In this way even more information can be presented to the user. A simple example is having a
map of the virtual world displayed in one corner (or easily accessible from a movement/trigger). Base
information is then combined with the virtual experience, enhancing the ways in which the user can
interact with the system. The more adaptable and flexible a VR system, the more it is likely to be used
and accepted by an "average", standard user.
- 2 3 -
Virtual Software in Reality Claire Knight Three-Dimensional Visualisation and VR
The equipment for immersive VR systems is getting more sophisticated as the available hardware
improves. Instead of just head mounted displays and sensory gloves there are now full body sensor suits
making use of position sensors allowing more sophisticated worlds to be created and experienced.
Another use of the position tracking of humans is to create fluid, realistic animation in computer games
and simulations. EA Sports and Gremlin Interactive have both used this technique with their football
games (FIFA 97 and Actua Soccer respectively).
Immersive VR relies on stereo vision. The brain constantly generates information such as depth
perception based in its fusing of the images from each eye. VR technologies play on this by causing the
brain to do the hard work. Two images, differing slightly, are presented to the user by means of two
monitors, or in front of each eye in a head-mounted display. The brain, when the images are processed
quickly enough can cause the perception of depth. Generally a refresh rate of greater than 60hz is
required so that there is no perceived flickering for the user, hence the view can be assumed (mentally at
least) to be real.
Rendering in a VR system needs to exceed 20 frames a second since this is the minimum level that the
brain will take a series of still images and perceive smooth animation. The experience of reality is also
enhanced by the use of audio. Three-dimensional audio, implemented correctly and accounting for the
problems of the brain trying to work out the placement of the sound in the mind, can make the virtual
world more like what is known as reality. Three-dimensional audio can also add to the perceptual
experience and may add to the realism. There have not been enough studies or examples of work in this
area to conclude one way or another [Lumb95, Madh95].
Recently some studies have been done that claim the closeness of head mounted displays cause
unnecessary stress and vision strain in the wearer. The claim is that it is the closeness of the images, and
forcing the brain not to focus on the close object but to generate depth perception that causes the problems
[Isda93, Chri95].
3.2.3 Perception
Perception is the observation of the surrounding world. It can be used in part explaining why things
appear as they do. In principle, science is capable of explaining the world - biologically with vision and
wavelengths of light from physics. Perception needs to be understood to facilitate the creation of an
environment. It can also be of benefit in understanding observational errors, the senses upon which
perception depends and for creating a machine to simulate or fool human behaviour in some way.
Perception is never exactly in accord with the reality in which that perception is made. The human brain
is very good at missing details, distorting them, or even making the eye see what is not there. Some of the
- 2 4 -
Virtual Software in Reality Claire Knight Three-Dimensional Visualisation and VR
missing detail is necessary to cut out the complexity. Surfaces of some objects are recognised as shiny but
the brain (unless being specifically focused on the reflection) does nothing more than provide a hazy
mirrored view. This type of missing detail is not an error, but a way of allowing humans to keep their
sanity! Optical illusions play on this idea of confusing the brain and exploit defects. It is these facts that
can allow virtual environments to be created with some success.
By knowing and understanding perception in general, rather than in a particular case, things that are
perceived easily or that trick the brain can be used to good effect. In addition i f something is noticed by
our senses then there is still no guarantee that it will be perceived. Again this is exploited with optical
illusions. Information on the visual ability of humans and their use of vision for recognition can be found
in the writings of Findlay and Newell [Find95]. They cover several approaches to recognition and relate
this to vision. They also acknowledge the fact that the human visual system (be it eye, brain or a
combination of these) is very good at recognising things even from crude (basic) images.
Perception of life is an individual phenomenon. With exactly the same stimuli two people may respond
completely differently. Everything that has gone before in a person's life will affect their perception of a
situation, as well as any prejudices and biases they may hold that relate to the stimuli. This indicates that
perception is more than just vision or spatial awareness. Existing knowledge stored in the brain can also
be influential in determining the perception of a given event.
Pettifer and West [Pett97b] discuss perception (and philosophy) in relation to the use of metaphysical
models in virtual worlds. They make the point:
"Various commentaries on the distinctions between the 'objective universe' and our experience or perception of it have been made throughout human history (indeed, the very question of whether or not there is an 'objective' existence outside our perception of it is one that underpins many philosophical works)."
They then go on to say that the ideas of Immanuel Kant (German Philosopher, 1724-1804) are most
appropriate when discussing perception in relation to VR and virtual environments. This is because he
made the distinction between "the thing itself and "the thing for me". The first is the objective nature of
something which humans cannot directly experience whilst the second is the subjective experience,
something humans are able to perceive.
Perception is composed of various "inputs". A l l of the senses contribute to an overall perception of some
event. Seeing and hearing contribute to distance perception, touch (skin) deals with closeness to objects
and the position/motion of muscles and joints (the skeletal and muscular system) provide motion and
position information. Additionally i f something does not affect one or more of these sensory inputs then
nothing will be perceived.
Learning to perceive can and does happen. A person's face becomes recognisable as a friend or a
colleague when the brain associates a perception of that person with knowledge that it knows whom that
- 2 5 -
Virtual Software in Reality Claire Knight Three-Dimensional Visualisation and VR
person is. This in itself is more than just recognition. The brain (and eyes) are then capable of looking for
this person in a crowd using features from the face. This means that the brain is capable of complex
perception. There is the knowledge of being in or near a crowd and there is the scanning of faces within
the crowd trying to locate a familiar face.
There are many other examples where learning to perceive something has a beneficial effect. Learning a
new language (both written and spoken) requires perception of both images on a page and sounds to the
ears. Al l learning provides more perceptual knowledge. Reading diagrams from a particular field can be
virtually impossible without knowing what particular symbols means. Once there is this knowledge and
using several diagrams the brain learns to perceive the mass of printed information as something
meaningful.
Gardner [Gard93] summarises this perceptual learning through experience as:
"These perceptual associations are not so strange. People pick up a lot of rules as they go through life. Not necessarily hard and fast rules; people use a kind of fuzzy logic. When we see something, we relate it to other things."
In deciding to move in a particular path there is very often the ulterior motive of wanting to move from
one location to another, not just to move along that route. It is the perception of the space/world that
allows a decision on which path to take. Generally the physical world properties are not compelling in
their own right, other than to avoid obstacles when moving from one place to another.
Friedhoff and Benzon [Frie91] write (pi2):
"The tendency to impose form, whether on the surface irregularities of a cave, or in inkblots, clouds or shadows, is suggestive of an organising function of vision - an organising tendency so strong that random shapes can trigger the perception of vivid illusions."
This information is something that can be exploited, both by visualisation and those wanting to learn more
about the human brain. In better understanding the way the brain and eye perceive colours and images
then the better the visualisations that can be created.
Aesthetics is an important factor to consider in relation to perception. Aesthetics very often determines
how long something is viewed for either because it is aesthetically pleasing, or because it is appalling! It
is perception that lets the viewer know what they think is aesthetic. Aesthetics also relates back to the
philosophical ideas of Kant (included in [Pett97b]) because it is a subjective judgement. By Kant's
definition this means humans can directly perceive it, rather than anything objective, which he says, is
impossible to directly experience.
Gelernter [Gele98] discusses this concept of aesthetics in his book, and covers not only the outward,
visible appearance of objects, but also their inner beauty; the aesthetics of their functionality. Both of
these can affect the perception of the user in VR and software visualisation. I f an object does not do what
- 2 6 -
Virtual Software in Reality Claire Knight Three-Dimensional Visualisation and VR
is expected of it within the bounds of the virtual space, or the visual representation of a piece of code
presents the functionality as complex and convoluted for a simple task (for example) then the object,
environment, or code will be perceived badly. Another aspect of things being aesthetically pleasing to the
user is that they are more likely to match the perceptual expectations of the user and hence be accepted
[Chri95]. Virtual representations that force the user to adapt their visual processing and perceptual skills
are not likely to receive much use and certainly will hinder more than help.
In presenting spatially arranged information, i.e. visually, there is the benefit that the human perception
skills can be used for part of the comprehension. This moves some of the comprehension load away from
the conscious cognitive processing [Cros97, Cros99, Chen99].
3.2.4 Gestalt Psychology and Ecological Optics
Most VR worlds are built based on Euclidean Geometry [Cast97], which is based on five postulates. It
was later proved that the fifth postulate, which Euclid himself was unhappy with (from a mathematical
viewpoint), could be disproved hence creating two new non-Euclidean geometries. One geometry is that
of being on the outside of a sphere (which is actually closer to our reality than Euclidean Geometry) and
the other the inverse; that of being on the inside of a sphere. Despite reality not being based on Euclidean
geometry it is accepted for use in architecture and VR worlds because our limited perception in reality is
imperceptibly close to it.
There are two relatively modern theories of perception; Gestalt psychology and Ecological optics. These
try and explain the way that an environment is seen and comprehended at a perceptual level.
Gestalt psychology has five basic laws of perceptual organisation. These are:
• Proximity
• Similarity
• Good continuation
• Closure
« Common fate
The last four of these are grouped under Pragnanz principles and are concerned with figure perception.
Gestalt is the concept that perceptually the whole is greater than the sum of the parts. The relationships
between objects are more important than details on those objects. Every book, paper or web site seems to
classify the laws or principles in different ways but the above information was provided by Gardner
[Gard93]. It is also the case with Gestalt theory that the spatial and temporal parts of the relationships
between the various parts of the visual stimuli are distinct and important [Chri95],
- 2 7 -

Virtual Software in Reality Claire Knight Three-Dimensional Visualisation and VR
Cloze testing came from the idea of closure. It refers to the human ability (and indeed inclination) to
complete things even i f parts are missing. The application of closure (and cloze testing) has been widely
applied in the field of text comprehension. Some of this work has been extended to apply to program
comprehension and Davis [Davi95] documents a guessing measure of program comprehension which uses
some of these theories.
Gestalt theories were developed in the early part of the 20 t h century. Following this an even newer form
of perceptual psychology emerged. This is known as ecological optics, although sometimes it is referred
to as Gibsonian theory (after James J. Gibson who created it). Ecological optics takes the view that the
eye detects environment invariants, which are things that hold true over a long period of time and the
visual system has evolved to over millions of years. Gardner [Gard93] relates these perceptual invariants
to VR systems:
"To a large extent, the use of perceptual invariants can be programmed into the system. Textures, texture gradients, linear perspective, aerial perspective, motion parallax, ... can be part of the graphics and animation system."
Over time Gibson moved the emphasis from invariants to affordances. An affordance can be seen as a
possible action, and Gibson maintained that these affordances could be perceived directly rather than
through stimulus identification. Findlay and Newell [Find95] discuss aspects of ecological optics and also
the criticisms that have been directed towards the theories, especially since the more recent changes in
thought regarding human vision.
Card et al. [Card91] applied the affordance concept of active perception in their work on The Information
Visualizer. They make use of both animation and three-dimensional graphics to enable easier information
retrieval of database texts.
"Thus interactive animation and 3D perspective graphics both allow us to apply Gibson's active perception tenants and to pack the space more densely with information than would otherwise be possible. By manipulating objects or moving in space, the user can disambiguate images, reveal hidden information, or zoom in for detail - rapidly accessing information."
A l l of these features can be seen to be desirable from a visualisation standpoint, and ecological optics
provides a psychological basis for their use.
3.2.5 Immersion
Immersion was mentioned in the earlier section 3.2.1 What is Virtual Reality? The sentence
"The total VR system is one that immerses the user (viewpoint) within the virtual world."
has viewpoint in brackets because the use of the term has come to mean several things in VR. There are
two main uses of the word immerse in VR literature. The first is that to be immersive a system has to have
- 2 8 -
Virtual Software in Reality Claire Knight Three-Dimensional Visualisation and VR
a head mounted display (HMD), motion tracking, stereoscopic display and associated paraphernalia. The
second, which is now starting to be used more, is that immersive describes the perceptual experience the
user has of the virtual environment. This second definition does not rely on specific pieces of technology
and therefore the term can be used to describe both traditionally immersive systems and what have been
called window on a world (WOW) systems.
Hodges et al. [Hodg95] suggest that "true" immersion is necessary to distinguish VR from interactive
graphics and write
"User immersion in a synthetic environment distinctively characterizes virtual reality (VR) as different from interactive computer graphics or multimedia. In fact, the sense of presence in a virtual world elicited by immersive VR technology indicates that VR applications may differ fundamentally from those commonly associated with graphics and multimedia systems."
In writing this they are saying that to experience immersive VR, extra hardware technology such as head
mounted displays are required.
Bolas [Bola94] also supports this view. He writes
"The powerful experience of immersion in 3D visualizations - something "stereopaths" have always known - is now opening up to computer users everywhere. Nowhere is this truer than in the field of virtual reality."
This assumes the use of stereoscopic projection of some kind (be it projectors, double monitors or head
mounted displays) to present the virtual world to the user. Ellis [E1H94] goes one step further and
includes other devices, such as haptic interaction tools, in his concept of VR immersion.
"In fact, we can define virtual environments as interactive, virtual image displays enhanced by special processing and by nonvisual display modalities, such as auditory and haptic, to convince users that they are immersed in a synthetic space."
This definition is still reliant on the technology used by the VR system and does not consider the
perceptual experience the user is able to obtain.
Gardner [Gard93] makes a distinction between immersion and inclusion in The Creator's Toolbox, when
relating virtual environments to aspects of perception. Whilst he does not provide any evidence for
whether the hardware is included in his definition, he does not explicitly say it is required.
"Currently, most virtual reality interfaces represent only the hands, if anything, for visual representation of self. To the best of my knowledge, no one has represented the user's feet for calibrating ground textures or even the user's own nose (arguably the most viewed object in a person's visual experience) for self-perception in a virtual reality interface. This distinguishes immersion from inclusion, which, respectively, give the feelings of being surrounded by the other world and being part of its environment."
In talking about inclusion, Gardner is touching on what is known as the concept of degree of presence. It
has also been argued that the degree of presence felt by users is dependent on the immersive level of a VR
system. This may well be true, but again some people believe that a user can only feel fully present in a
virtual environment i f they are using headsets, three-dimensional mice and wands. There is also an
- 2 9 -
Virtual Software in Reality Claire Knight Three-Dimensional Visualisation and VR
associated degree of presence problem. This is where users who are in the VR have "virtual out of body
experiences". This occurs when the user concentrates on something in reality (at least the nearest there is
to our knowledge!). The problem occurs when other users are not aware that they have changed focus and
try to communicate and interact with them in the VR. This problem has been documented by several
authors, including the work done by Benford et al. [Benf96] in trials with the MASSIVE system.
Kalawsky et al. [Kala99] suggest that an important feature of VR, compared with the prevalent interfaces
in mainstream use today, is that they can afford a sense of "being". VR literature often terms this as the
"sense of presence" felt in the virtual environment. The authors say that this is often confused with
immersion:
"The term immersion is also used erroneously sometimes to describe the same experience, but here it is taken to describe the extent of peripheral display imagery."
An alternative view of immersion is documented by Machover and Tice [Mach94]. Their view is that the
equipment used does not define a system as being VR (or not).
"VR is unique in its emphasis on the experience of the human participant. VR focuses the user's attention on the experience whilst suspending disbelief about the method of creating it. We feel that neither the devices used nor the level of interactiveness or fidelity determine whether a system is "VR". "
Bowers et al. [Bowe96] are also of the opinion that the term immersion needs to be redefined. Early on in
the paper they write
"In the conclusion of our paper, we examine the implications of our work for the design ofCVEs and suggest - in line with our empirical studies - a redefinition of a central concept much used in VR research: immersion."
This comment is supported by a discussion later in the paper. The authors suggest that the reader may
object to the research and its results due to the consideration of purely desktop VR systems and (in the old
meaning of the word) non-immersive VR systems. As part of the defence of this they write
"Our second response to the objection that we have confined ourselves to non-immersive desktop virtual worlds is to urge a reconsideration of what is meant by 'immersive' in such contexts. We would suggest the utility of understanding 'immersion', not in terms of different technical arrangements (e.g. HMD versus screen-based presentation), nor in narrowly defined perceptual or psychophysical terms (e.g. is the virtual world all that one can see/hear? To what extent does the virtual world take account of human perceptual systems?), but as a practical accomplishment brought off through the work done in giving social activity an orderliness in the virtual world. As such immersion would need to be understood as involving relations between one's real-world activities, one's virtual world activities, one's ability to display one's activities in either world to others, relations which are ongoingly achieved, maintained and (if necessary) repaired."
This is a view taking into account the human factors of VR systems, and realistically, the situations in
which VR in the workplace can be effectively used. The use of expensive, specialist, and possibly bulky,
equipment is not bringing the benefits of VR any closer to widespread acceptance in the workplace (or the
- 3 0 -
Virtual Software in Reality Claire Knight Three-Dimensional Visualisation and VR
home). It is also possible to create perceptually immersive environments without the use of such
equipment through the careful design of and then the experience of an absorbing VR experience.
To avoid confusion, anywhere in this thesis where immersive may have been used according to the second
definition the term inside will be used instead, unless the use of the term is explained at that point in the
text. This is done so that, hopefully, no confusion is caused, and it avoids changing the most common
meaning of the term immersion.
3.2.6 Metaphors
A metaphor is where a word or phrase (or in terms of visualisation, a graphical representation of that word
or phrase) is used in place of another. This tends to suggest some form of analogy between the two
concepts, although this may be at a higher level of abstraction than individual words or phrases.
Blackwell [Blac96] poses the question of whether these abstractions should be seen as metaphor or
analogy, although a discussion of the distinctions and use of these terms is beyond the scope of this thesis.
From a VR perspective the metaphors act as a mapping from the concepts required in the virtual world to
their graphical representation. This need was identified by Levialdi et al. [Levi95] in the construction of
their database visualisation system.
"Using VR visualization techniques to represent the results of queries implies the definition of a mapping, or metaphor, among the objects of the database and the objects of some virtual world."
According to Benford et al. [Benf96] the use of natural metaphors can aid the usability of virtual
environments.
"... an attempt to exploit people's natural understanding of the physical world, including spatial factors in perception and navigation, as well as general familiarity with common spatial environments..."
Fitzpatrick et al. [Fitz96] also apply the spatial metaphor to the level of social interaction possible within
the virtual world representation of the metaphor.
"Even though space is an intuitive, familiar metaphor to work with, there can be a more encompassing meaning of space in the virtual world, independent of graphical and VR depictions, that is driven by social world needs and the needs of individuals participating in multiple social worlds."
This view of using real world interface metaphors is also supported by Vaananen and Schmidt [Vaan94,
Vaan93]. The authors are of the view that these types of metaphor solve many navigation issues because
they impose familiar structures and interaction possibilities on the system and these are visually
recognisable by the user.
Pettifer and West [Pett97a] suggest that the potential power of VR comes from the strength of its
metaphor, and the fact that it is closer to natural interaction than many other forms of computer system.
-31 -

Virtual Software in Reality Claire Knight Three-Dimensional Visualisation and VR
They also identify the benefits of natural metaphors, and making use of perceptual and spatial skills learnt
and used in the real world in the virtual environment.
"A three-dimensional world metaphor has much more scope for direct human/computer interaction than the two-dimensional desktop because it engages in us those perceptual and spatial faculties that allow us to comprehend our surroundings and to process effortlessly the vast amounts of information that are presented to our senses second by second. It is the potential to directly engage these faculties that is the defining characteristic of virtual reality. As the immersive environment is far richer than the desktop, the metaphors for interaction assume a far greater significance. ... The role and management of metaphors for the virtual environment therefore assumes key significance."
It is obvious from the above that the design of the metaphor used in the virtual environment can play a
large part in the usability of that system, both in terms of human-computer interaction, and in terms of
enabling the user to carry out the required tasks. What is also of benefit is that in using three-dimensional
environments some of the cognitive processing needed for navigation and Visual interpretation can be
shifted to the sub-conscious as these are activities that are carried out daily with no real thought.
Metaphors are often criticised for hiding the original data or causing the user to have false expectations of
what an object does or is capable of. Monin and Monin [Moni94] have this view. There is the distinction
between metaphors that work because of some direct resemblance between two things and others that
work through some common attitude to both things. This common attitude often a direct result of
accidental and extraneous reasons and that a disparity between the two facets can hold potential dangers
relating to comprehension and expectation.
This problem of the use of metaphors is summed up eloquently by Wiss and Carr [Wiss98]:
"As always, metaphors are difficult to find and easy to abuse."
They also say that proving a metaphor works is a difficult task, and certainly this has to be true in a wider
sense because of the variability of the users and tasks. What is more contentious is that such systems
require some formal way of assuring users or sponsors that metaphors work, simply because of this known
variability. Ideally each system would be able to support a range of metaphors to cater for all tastes, but
as with every interface the more it is used the easier it is to use it, and once a system has been "learnt" the
metaphor will become more acceptable thus invalidating the need for such figures or proofs.
An experimental study carried out by Dutton et al. [Dutt99] support the use of metaphors as their results
led to the conclusion that after the initial use of the metaphor based system, responses and performance
were enhanced in systems with metaphors. Their studies also showed that (in this particular study) the
two different systems founded on metaphors outperformed the system without, but that the two metaphors
were as good as each other.
- 3 2 -
Virtual Software in Reality Claire Knight Three-Dimensional Visualisation and VR
3.2.7 Spatial Orientation and Navigation
I f the VR environment is a representation of the spatial world that we already know then there is a need to
model orientation and navigation features found in the real world. In any spatial setting some form of
base orientation needs to be found which can then be used for navigation and re-orientation as movement
occurs. Hemmje et al. [Hemm94] relate this to their database visualisation work although what they write
is readily extendible to all spatial visualisations.
"It is necessary to move, i.e. change position in the context space and explore information visible from each point of view. It is important to achieve an orientation, i.e. to determine the relation between a current point of view (e.g. from an information item) and the whole of an information space."
Many authors document the problems of getting lost in "cyberspace" when dealing with spatial virtual
environments. Ingram and Benford [Ingr95] write
"More recent experiences with virtual reality suggest that users will also suffer from the commonly experienced "lost in hyperspace " problem when trying to navigate virtual environments."
They relate the orientation and navigation processes to the cognitive map the user has of the environment.
Cognitive maps can be one of two sorts. Linear maps are based on movement through the space and the
observations made during that movement. Spatial maps do not require movement through the space.
Generally, linear maps are the first created of an environment, and over time the map may evolve to being
a spatial map. Exploration rather than guidance through an environment encourages the development of a
spatial map. Their research has focused on providing ways to ease the navigation (and orientation)
problems that occur in VR.
Pettifer and West [Pett97a] also relate the problem to the systems and metaphors in use today.
"Losing a cursor on the desktop is one thing, losing yourself in cyberspace is quite another."
Three-dimensional worlds are potentially infinite whereas desktops are of generally finite space even if
current implementations are able to cover several screens.
Hubbold et al. [Hubb93] discuss design issues that are important to consider for VR systems and cover
orientation when discussing perceptual consistency.
"More important is the creation of an environment in which the user remains comfortable and well oriented."
Pettifer and West [Pett97b] also comment on the construction of virtual environments, and that the aim
must be to construct these environments so that they correspond with human perceptual requirements.
Backing up these comments made by the above authors, Pesce [Pesc93] asserts:
"The first perogative in the engineering of a holosthetic environment is: design to avoid disorientation. Disorientation represents a step towards the amputation of the self, and necessarily precedes the dislocation of self that concludes in holosthetic psychosis."
- 3 3 -
Virtual Software in Reality Claire Knight Three-Dimensional Visualisation and VR
Another aspect of perceptual orientation, often missed, is that of causality. It provides a continuity of
experience in "reality" so by providing such continuity in virtual realities allows natural comprehension,
interaction and orientation. This is not implying that the causalities need to model exactly the laws of time
and motion, but that the "laws" used in the environment need to be continuous throughout that
environment, allowing things to be comprehended, and to an extent, explainable. A ball floating in mid
air is considered strange, but provide a context of outer space and the ball's behaviour is perfectly
acceptable. Attention is given to the issue of causality by Pettifer and West in [Pett97b] and Pettifer in
[Pett96].
Crossley et al. [Cros97] give reasons why VR interactive interfaces can allow an intuitive and natural way
to explore and comprehend complex information:
"A well-designed user interface with good spatial representation of information can be effective in assisting the user in the following tasks:
• browsing and navigation,
• searching,
o comparing,
• grouping,
• analysis,
• creating new information."
The authors also recognise the importance of metaphors and navigation when using such interfaces.
It is easy to cause navigation and orientation problems i f attention is not given to the design of the virtual
environment. This would obviously make the system worse than two dimensional graphics or plain text
because the cognitive overload gets so large. Conversely, i f suitable attention is paid to the design of the
virtual environment, the metaphors used, the interface between the environment and the user, and the use
of suitable "laws" (relating to the metaphor if the metaphor allows) then there is a great potential for the
use of VR and virtual environments.
3.2.8 Entertainment
Academia has often been accused of being detached from reality, and such attitudes prompted Potts
[Pott93] to write his paper on the practice of using industry as laboratory rather than the more popular
method of research then transfer in the software engineering field.
VR applied to the creation of desktop environments can learn much from the gaming industry in terms of
design and even human-computer interaction issues. Benford et al. [Benf97] refer to Doom (created by Id
- 3 4 -
Virtual Software in Reality Claire Knight Three-Dimensional Visualisation and VR
Software, [IdSoftware] now effectively superseded by Quake, Quake 2, and Quake 3 Arena) in their
paper. They discuss the method of reducing disorientation of users that Doom uses, although for
implementation purposes for their work they did not employ such approaches.
"We did consider the use of "solid" objects as another way of avoiding disorientation, similar to the approach of games such as Doom where one is constrained by solid boundaries to move through corridors and other enclosing spaces."
A l l the games mentioned above (created by Id Software) are of the first person genre where the user's
viewpoint of the game is through the eyes of their character and all follow the convention of solid
boundaries and what are approximations of real-world physics. Id Software is not the only games
company producing such games. A very recent release based on the same principle is Unreal [Unreal],
produced by Epic MegaGames. This is a first person shooting game that also supports multiplayer
(online) games.
In a panel session held at the 1996 ACM CSCW Conference [Dame96] the following is written
"In addition, virtual worlds employ fast 3-D graphic rendering engines found in gaming environments but their application is almost purely social or creative. Avatars do not generally die or kill other avatars in virtual worlds."
Whilst this killing aspect may be true of many games including Quake 2, there are also many social and
teamwork variations of the games. Quake and Quake 2 have a team based variant where the object is to
both defend your own flag and try to capture the opponents. The players are split into two teams for this
variant and to be successful requires co-operation and communication between players. There is also a
great deal of strategy to be employed within the team for aspects such as attack and defence. The latest in
the Quake line of products, Quake 3, is targeted primarily at the multiplayer gamers and the online gaming
communities.
Another area where games companies excel is in listening to their customers. They provide alterations
and (free) bug fixes more readily than the "serious" software companies, and a lot of these enhancements
improve the usability of the system. Over time their products then incorporate these features at release.
Many (if not all) games released today for the PC platform provide key, mouse and joystick configuration
settings so that the user can create a setup that they are comfortable with, and even have familiar
configurations in each product.
Not only can academia learn from the graphics produced in games, it can also learn from the advances
made in human-computer interaction. An added advantage of learning from the concepts used by games
companies is that the techniques used have been empirically evaluated by many millions of users.
- 3 5 -
Virtual Software in Reality Claire Knight Three-Dimensional Visualisation and VR
3.2.9 Urban Virtual Environments
In addition to conventional hypertext links researchers have done some work in improving orientation and
navigation within hypertext structures. This phenomenon of being lost is space is also a problem for
three-dimensional worlds and there are many solutions in common with the problem of getting lost in
hyper/cyberspace. These solutions often take the form of orientation cues, predefined navigable paths
(possibly with tour guides of some form), overview maps and the use of natural navigable metaphors.
Urban virtual environments are included in their own section because they tie together the concepts of
spatial orientation, navigation cues, "reality" and the legibility aspects investigated as a way to solve the
problems of being lost in hyper/cyberspace.
Dieberger [Dieb96] created a textual virtual environment that works in conjunction with a World Wide
Web browser. Whilst the virtual environment uses no graphics it is able to convey a spatial user interface
where objects in the environment are associated with links to web pages. By navigating through the
virtual environment, the appropriate web pages can be automatically loaded. This allows users to navigate
the web with spatial navigational metaphors.
The use of spatial metaphors allows the user to create a mental representation of that world, as they do in
reality in moving through their natural environment. What can be missed in these artificial environments
are the navigational cues. By creating a rich description of the (hyper) space Dieberger was able to
provide suitable information for users to navigate their way through the information on the collection of
web pages.
Whilst the work by Bray [Bray96] involves generating spatial visualisations of web information he has
concentrated on web page statistics, about the type of content a page has (graphics or text), the level of
H T M L and the links to and from sites. These sample statistics were an effort to find out the size of the
web and what average sites and pages are like. In trying to answer the question of what does the web look
like he writes
"The Web, when you 're in it, feels like a place. It manifests, however, as a sequence of panels marching across your screen. This leads to an absence of perspective, of context, and finally, of comfort. Most of us who have worked with the Web, want to see where we are."
In terms of two-dimensional navigation Dieberger [Dieb94] identified several "tools":
• Backup-links.
• History lists of visited pages/nodes.
• A pictorial representation of the last few nodes visited.
• "Bread crumbs" as markers of where the user has already been.
• Categorisation (or typing) of links.
- 3 6 -
Virtual Software in Reality Claire Knight Three-Dimensional Visualisation and VR
» Explicit overview maps.
He suggests that the underlying problem is in not communicating the underlying structure to the users and
that not all of these tools try and tackle that problem. Thiiring et al. [Thiir95] support this view and write
"For reducing the mental effort of comprehension, it is not sufficient to simply impose a coherent structure on a document; it is also necessary to the reader. This can be accomplished most efficiently by providing a comprehensive overview of the document components and their relations in terms of graphical maps or browsers."
Jiihne et al. [Juhn98] attempted to provide a guided tour system for web pages using a Java applet in
conjunction with a web browser. Ariadne (as the system is called) stores guided tours and is then able to
provide a graphical overview of the structure whilst concurrently displaying the web page. The overview
is shown as a two-dimensional graph and makes use of colour to inform the user where they have and
haven't been in the tour, and where they currently are.
Ingram and Benford [Ingr95] also try and address the problem of getting lost in hyperspace. They tried to
apply legibility and cognitive mapping features that have been used in urban environment design. Their
proposals of using these features would be restricted by the speed the information structure changes and
they write:
"Thus, we would see our technique being of most benefit when applied to long term, persistent and slowly evolving visualisations. Furthermore, we are particularly interested in the automatic application of legibility techniques. A typical future application of this work might be in enhancing visualisations of large information systems such as the World Wide Web."
The five features that were identified for use in urban environments and which Ingram and Benford
[Ingr95] proposed for hyperspace are:
• Landmarks
• Districts
• Paths
• Nodes
• Edges
A l l these contribute to the legibility of the environment. They are also of use in any form of (virtual)
space - not just hyperspace. Their application goes beyond the visualisation of hypertext worlds and
extends into any form of VR.
Landmarks are static and recognisable objects in the environment. Because they are static they can be
used as orientation and location markers.
Districts can be defined as areas of the environment that have a local coherence. They can be said to
have a distinct character and this allows the entire of a district to be seen as a single item. Several things
- 3 7 -
Virtual Software in Reality Claire Knight Three-Dimensional Visualisation and VR
can identify a section of the environment as a district, common ones being the architecture of the buildings
or their use.
Paths can be considered to be main routes of travel through the environment.
Nodes are important items along paths. These can be considered to be like mini-landmarks, in that they
provide bearing along the paths.
Edges provide borders to districts or objects, and can be composed of structures or features of the
environment.
Dieberger [Dieb93a, Dieb93b, Dieb93c, Dieb94, Dieb95a, Dieb95b, and Dieb97] carried out navigation
and layout work using city metaphors to create The Information City. He used a city metaphor, with
houses, to display hypertext information. He ties together metaphors and navigation and writes
"When talking about navigation in information spaces we automatically use metaphors but we do not fully use these metaphors. Metaphors are incomplete mappings from a source to a target domain thus carry certain restrictions. We should see these restrictions not as obstacles but as devices to communicate structure to our users."
and later in the paper
"/ get the impression that we don't use metaphors to their full potential in navigation. They are not only vehicles to make something easier to understand, but - especially in the case of information spaces - they are also structuring devices."
I f the points made by Dieberger about metaphors are considered to be true, then making the metaphor
tally with the features identified by Ingram and Benford [Ingr95] provides the capability of creating
powerful metaphors. These metaphors can then convey not only the information of the information
spaces, but provide navigation and orientation information that is based on that information. This means
that evolving data sets with suitably evolving visualisations can still remain familiar because the
landmarks, and inter-data relationships wil l evolve with the data thus providing a degree of cognitive
familiarity.
3.2.10 Summary
The previous sections have provided an overview of VR from a human oriented perspective as well as
considering the technological issues. The points and discussion presented, whilst split into sections, are
often interrelated and may impact on all of the other areas. Where it makes things clearer, such
relationships have been pointed out. Because of the difficulty of completely separating the concerns, it
may also be that within some of the sections there is some overlap of information.
- 3 8 -
Virtual Software in Reality Claire Knight Three-Dimensional Visualisation and VR
An area that is near to VR is that of three-dimensional visualisation, because of the technology needs of
the visualisations. This has not really been addressed in this section, and hence is covered in much more
detail in the next section.
3.3 Three-Dimensional Visualisation
Visualisation can be used with computer science in the same ways it is being used in other disciplines.
Because part of computer science research is concerned with how to implement visual systems and how to
create the hardware to make VR useful it does not prevent the field from using its own tools.
Visualisation has been defined in several ways. One definition is:
"Visualization is the use of computer-generated media based on data in the service of human insight/learning."
comp.viz.faq - comp.visualization newsgroup FAQ
There are grounds for dispute in this definition. Human beings are visualising things all the time in
thought and action. The term visualisation should not be restricted to those images or displays that a
computer can present.
Another definition from the same source follows the same line of thought but it is included because of the
other part of the definition.
"Visualization: the use of computer imagery to gain insight into complex phenomena "
The last part of this definition is something that is very true. Many hold the view that one of the great uses
of visualisation is to provide help for humans when dealing with complex ideas and concepts.
A better definition from the FAQ file is:
"The purpose of visualization is insight, not virtual realities or pictures."
Eugene N. Miya, President, Bay Area ACM/SIGGRAPH
But this does not go far enough.
Friedhoff and Benzon [Frie91], write (pl6):
"... is that much is to be gained by recognizing that visualization, because of the computer, is emerging as a distinctive new discipline."
This brings in again the reliance on computers but it does not rule out other forms of visualisation. The
point is that the technological advances have brought visualisation to the forefront. Having done this and
providing such a rich vein of opportunity for exploring visualisation, computers do not have to be the only
form of visualisation. In a later paragraph (pi6) the authors write:
- 3 9 -
Virtual Software in Reality Claire Knight Three-Dimensional Visualisation and VR
"If this new discipline of visualization is to realize its full potential, however, it will also have to borrow from those areas traditionally concerned with imagery such as art history and perceptual and cognitive psychology. The field of visualization should not be so absorbed by the miracles that are its technical basis that it ignores a larger interest in the way in which images can be used to enhance the power of our thinking."
A better definition of visualisation is one that encompasses several of these ideas. One such definition
could be:
"Visualisation is a discipline that makes use of various forms of imagery to provide insight and understanding and to reduce complexity of the phenomena under consideration."
This is a general definition that covers all aspects of visualisation as a discipline rather than concentrating
on any specific area. In situations where more clarification is needed then qualifying statements can be
added to the definition.
3.3.1 Why Three Dimensions?
It is often said that a picture is worth a thousand words. What suitable numerical value can then be
attached to three-dimensional images? I f a two-dimensional picture is worth a thousand words and can
easily and, one would hope, clearly explain the same then a three-dimensional image can contain many
more. The one biggest advantage of using three dimensions is that there is an extra dimension that can be
exploited to encode some extra knowledge or to aid visualisation of the knowledge shown in the two
dimensions through the provision of auxiliary evidence.
There are many ways of creating a three dimensional effect, some of which are better suited to
visualisation than others. The first, most basic, three-dimensional perception comes from our own eyes in
everyday life. The brain is constantly fusing together images of our surroundings from each eye and using
this information to aid the creation of what is known as depth perception.
Stereograms (also known as autostereograms) make use of the brain fusing two images together to present
a three dimensional image in a two-dimensional printed page. These became very popular in the early
1990s and there are now several books available containing these images. Simplified versions of these are
Single Image Random Dot Stereograms (SIRDS) that are simply dots on a page. The images can then be
seen by allowing the eye and brain to fuse together the two images hidden in the dots. The only problem
with these methods is that the three-dimensional image only has the colours of the two-dimensional image.
Depth perception is created but there is no way of encoding colour in the separated images. The principle
of stereograms lies in presenting the viewer with two slightly different images, one for each eye. Two
image versions of these (using photographs and paintings) have been around for about a century. It is
only with the advent of better computer graphics techniques that the single images containing a three-
- 4 0 -
Virtual Software in Reality Claire Knight Three-Dimensional Visualisation and VR
dimensional image have become popular and widely available. One of the problems with this form of
three-dimensional imaging is the inability to make use of the third dimension to aid in the visualisation.
Computer systems provide a wide scope for creating three-dimensional images. The earliest were
technical drawing packages (such as AutoCad) that allowed things to be drawn in orthographic
projections. These packages advanced with the hardware to allow, at first simple, three-dimensional
images to be shown on the screen based on the orthographic projections.
From the three-dimensional images displayed in this form, several authoring tools (and code libraries for
programmers) that allowed three-dimensional scenes to be constructed were created. The first of these
were rendering programs (one version widely available and used is POV-Ray) that allowed a scene to be
described in terms of objects and their properties, the camera view to be used, the lighting angle(s) and
sources and certain special effects. The problems with such systems was that whilst they produced
stunning three-dimensional graphic scenes they took an excessively long time to process. Rendering
programs and computer hardware have improved but to create animated renderings still takes an
extremely long time and this method is currently not realistically possible for instant virtual world
generation. The systems that are interactive need to be able to process images and render new world
views in real time.
The rendering programs led onto programs that took scene scripts and then generated a WOW type of
virtual world. These systems allowed three-dimensional worlds to be defined and then generated. The
advantage was that once a world had been defined the user could move through that world and with each
virtual "step" the scene would be updated to reflect the new viewpoint. Within the world, properties for
the displayed objects could be defined and, since the end result was interactive, "hot spots" could be
defined. This means that i f the user carried out a certain action in a certain place an event could be
triggered to do many things. Some examples of hot spot actions are loading a different world and
requesting a certain World Wide Web page. Simplified versions of the world rendering programs are
ones that render a world and then perform what is known as a "fly-through" of the world. This means the
user is taken on a tour of the generated world but has no control of the route taken. Often architectural
demonstrations use this to provide the clients with a guide to the finished building(s), inside and out.
Advances are now being made in multi-user virtual worlds. These are generally still based on the window
on a world VR technology but enable other users to see a representation of the user and for a user to see
representations of them. One such game that has been adapted is Quake. Programs known as Quake
Servers run on one machine and co-ordinate the multiplayer information so that the game running on the
player's machine can see the other players and be seen by other players. Multiplayer games, especially
those that are network compatible, are starting to become popular even i f they are not as sophisticated as
VR systems.
-41 -
Virtual Software in Reality Claire Knight Three-Dimensional Visualisation and VR
With the popularity of computer supported collaborative working, research is being carried out into the
effectiveness of using such systems instead of group databases and e-mail systems. The limiting factor in
this, and much of networked simple VR and three-dimensional images, is the hardware. The networking
and even the desktop computers still lack the power to create such worlds realistically in real time. Whilst
there are many examples of successful VR environments, such as many games on the market now, these
do not require dynamic regeneration or real time radiosity calculations (for example) both of which can be
very resource intensive. An added hindrance from a network perspective is the amount of information that
needs to be shared between clients of the system to accurately reflect changes in the world. This is again
something hindered by dynamic regeneration since this requires many environment updates be sent to the
client as well as user movement and action changes, thus causing much network traffic.
Using three dimensions for visualisation adds an element of familiarity and realism into systems. The
world is a three-dimensional experience and by making the visualisation more like that world means there
is less cognitive strain on the user. This in turn makes the system easier and more comfortable to use
because of all the experience and knowledge the user has built up elsewhere. In using three dimensions
the depth cues that make the world, and the visualisation, appear three-dimensional can be used as part of
the visualisation. This means that the aim of the visualisation to aid the comprehension of complex
phenomena can be achieved without adding unnecessary complications because of the visualisation used.
Stasko, [Stas92], when writing about an Information Visualizer System from Xerox Pare writes that the
designers noted that:
"... the three-dimensional displays help shift the viewing process from being a cognitive task to being a perception task. This transfer helps to enable humans' pattern matching skills."
This is only true of well designed displays, but supports the views that images and views that are known to
the user aid them in understanding the images and views presented.
Chalmers [Chal95] writes
"In designing an information display, we should support movement and exploration through the space so as to let people build up their own models of the information. By moving and searching through a complex environment, looking in detail at some parts, and in overview at others, we make sense of it and make our decisions about how to use it and work with it.
Note that it is not enough to have an information space through which people can move. One has to give thought to what people will see from different positions and angles."
This, whilst containing basic information, is very often ignored or not implemented properly. This forces
the user into patterns of working they are not familiar with and can decrease the effectiveness of that work.
Later in the paper the following is written:
"For such uses of an information space, a naturalistic 3D view seems a powerful but familiar way of controlling information detail. Perspective lets us gain an overview of distant regions and detail of what is close."
- 4 2 -

Virtual Software in Reality Claire Knight Three-Dimensional Visualisation and VR
From the simple scale above, and the information provided by Chalmers ([Chal95]), it would seem
appropriate to choose interactive three-dimensional worlds as one of the best forms of information and
therefore software visualisation.
3.3.2 Tacit Knowledge
The maintenance and documentation of tacit knowledge is an issue in whichever domain that information
is considered important, but more specifically it is an area that has been written about in relation to
software engineering and software maintenance and the knowledge and understanding of software
systems. This is also an important issue for all organisations [Cros99]:
"When tacit knowledge is difficult to make explicit (codify), new ways of transmitting the knowledge through the organisation need to be found. Failure to do so can lead to loss of expertise when people leave, failure to benefit from the experience of others, needless duplication of a learning process, and so on."
An impelling reason for using virtual environments for the visualisation of data is that the storage and
exchange of tacit knowledge can be supported in such an environment, and even more importantly,
directly where such knowledge is appropriate and necessary; a visualisation of the data the knowledge
covers. The location and management of knowledge is also an important factor when trying to address the
information overload problem that is so exacerbated by the current climate of mass data generation.
Crossley et al. [Cros99] put this succinctly as:
"Finding relevant information is not sufficient; finding who knows it, and sharing it with the relevant people is also crucial.
In making use of such features in virtual environment visualisations, adequate consideration must be given
to the mechanisms by which such knowledge transfer can take place. Many of these issues are resolved by
the choices made in implementation, and others by making use of research done with avatars and users in
these environments [Benf95]. Other considerations are more practical, such as how and where notes and
messages are left for (a) other users and (b) attached to objects in the visualisation. These decisions can
be tailored to suit the purpose of the visualisation and the metaphor used to represent the underlying data.
The virtual environment provides a common frame of reference in which knowledge transfer and
communication can take pace. Salzman et al. [Salz99] advocate careful consideration of the
representation (and hence metaphor) that is used, and the type of information that the system needs to be
able to display. They use the term exocentric to refer to an outside view of the phenomena whilst an
inside view is termed egocentric. These two types of view are of importance as soon as the visualisation
is used as a common frame of reference, indeed they could be considered to be of importance anyway
because they may affect the knowledge discovery process.
- 4 3 -
Virtual Software in Reality Claire Knight Three-Dimensional Visualisation and VR
Tacit knowledge is also often kept in notes made by the individual. This sort of information, when even
only partially relevant to the visualised data, may be considered to be useful by another member of the
project or a future user of the data. I f this information were stored with the data then it would be available
for future use. This form of documentation is important because of the context the information is
automatically placed in, and can thus provide the opportunity for "leaps of faith" which may prove vital in
the solution of a particular problem. Work on the annotation of objects in virtual space has been carried
out by Harmon et al. [Harm96].
The use of a virtual environment for these purposes may sound to some as overkill, but in visualisation
systems that support multiple users at any one point unplanned interaction can occur which is seen as an
important way of passing on this type of knowledge [Naka96]. It is also of way of finding out who knows
about one's area of interest and who may previously be just another name or face in the organisation, or
even worse not known at all. The storage of notes and working theory information is also an undervalued
resource and one that can be easily captured by a virtual environment visualisation without requiring much
effort from the user.
3.3.3 Task Dependence
As with facilitating the transfer of tacit knowledge, the task to which the visualisation wil l be put has a
role to play in the design of the metaphor (thus representation) and the environment in which the
visualisation is located. The importance the task places on the visualisation design is elucidated by
Kennedy et al. [Kenn96] in their framework information visualisations. Eick [Eick97] also acknowledges
that this is important:
"Since the analysis needs of each dataset are often unique, some of the best visualizations are task-oriented. These visualizations help frame interesting questions as well as answer them."
It is only through the use of appropriate visualisations that the use of such systems wil l become accepted.
In this case, "appropriate" considers not only the dataset but also the analysis task. The visualisation has
to lead to insight and understanding in some way to have any validity.
3.3.4 Example Visualisations
Shneiderman [Shne96] asserts that there are many visual design guidelines that can be used for
information visualisation but that the basic principles from all of these can be summarised as the Visual
Information Seeking mantra: Overview first, zoom and filter, then details-on-demand. This is a very top
down oriented view to the gathering of information from visual sources, but it is on this basis that
Shneiderman developed his Task by Data Type taxonomy of information visualisation. The seven
- 4 4 -
Virtual Software in Reality Claire Knight Three-Dimensional Visualisation and VR
identified tasks are: Overview, Zoom, Filter, Details-on-demand, Relate, History, Extract. The seven
identified data types are: One-dimensional, Two-dimensional, Three-dimensional, Temporal, Multi
dimensional, Tree, Network. This work was done to be able to classify and validate existing
visualisations and techniques but examples of the use of this taxonomy with sample visualisations are not
provided to illustrate any of the points.
The example visualisations in the next few sections are intended to provide a sample of the diverse three-
dimensional visualisations that exist. These could be classified by Shneiderman's taxonomy but to make
judgements on the ability of the visualisations to ful f i l the various task demands requires usage of each
system. It is also not the focus of this thesis to consider the classification of information visualisations.
Any obvious parallels wil l be made but no tick sheet of properties wil l be produced for these example
visualisations. It is also not the focus of this thesis to provide an exhaustive summary of information
visualisations. A very good and thorough one is in Young's work [Youn96].
3.3.4.1 Portal
Some prototype systems developed by Walker et al. [Walk96] show the varied applications of three-
dimensional visualisations. Their rationale for such systems is that the use of a three dimensional
interactive interface has the capacity to provide intuitive access to data landscapes, and as they phrase it:
"...an appealing vision, which remains largely unfulfilled."
One such application (called Portal) provides a landscape of project information, where the individual
projects are islands. The user representation is also important. The avatar is coloured according to the
type of user, and information is tailored to their perceived needs based on the chosen type. The portal
interface can be seen in Figure 3-1, with the choice of users shown above a model of the labs in which the
projects are located.
- 4 5 -
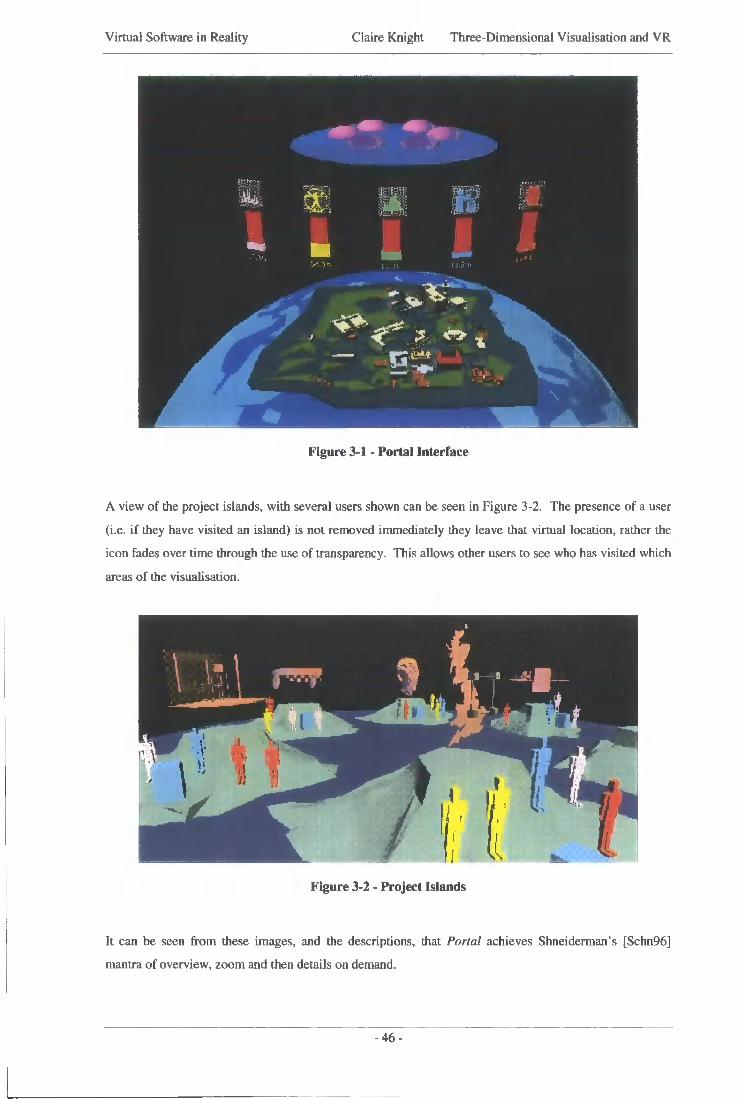
Virtual Software in Reality Claire Knight Three-Dimensional Visualisation and VR
Figure 3-1 - Portal Interface
A view of the project islands, with several users shown can be seen in Figure 3-2. The presence of a user
(i.e. i f they have visited an island) is not removed immediately they leave that virtual location, rather the
icon fades over time through the use of transparency. This allows other users to see who has visited which
areas of the visualisation.
1 i
•
i ,
f
\ !
U ! I
Figure 3-2 - Project Islands
It can be seen from these images, and the descriptions, that Portal achieves Shneiderman's [Schn96]
mantra of overview, zoom and then details on demand.
- 4 6 -
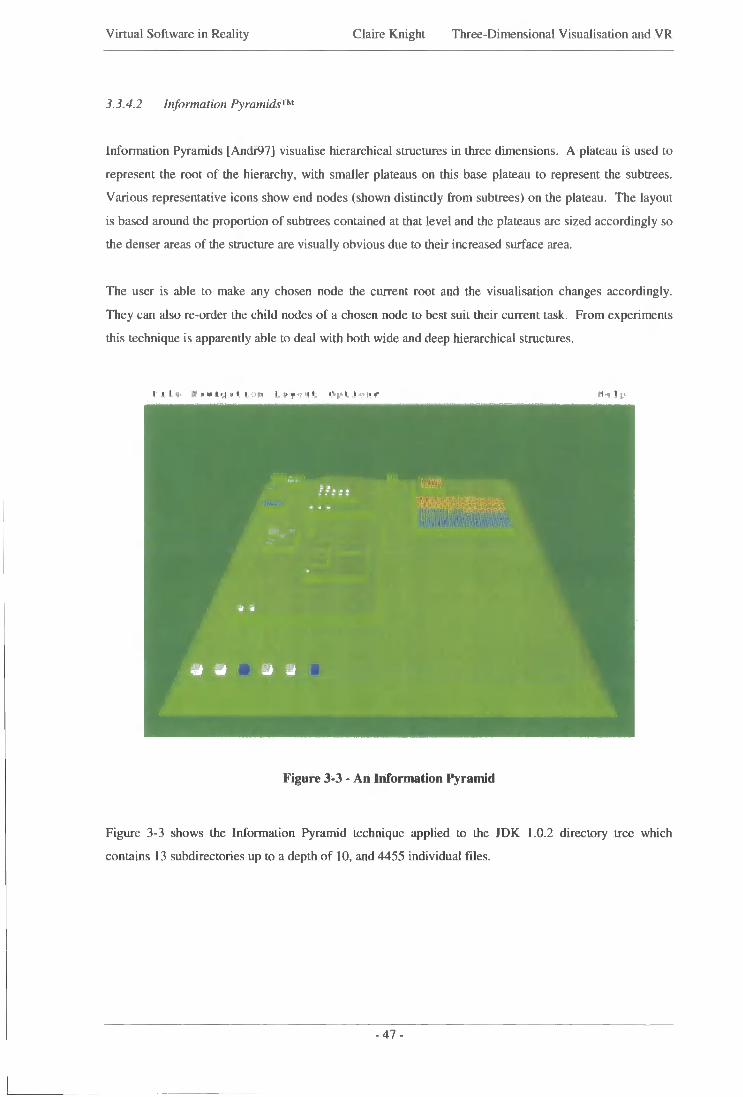
Virtual Software in Reality Claire Knight Three-Dimensional Visualisation and VR
3.3.4.2 Information Pyramids™
Information Pyramids [Andr97] visualise hierarchical structures in three dimensions. A plateau is used to
represent the root of the hierarchy, with smaller plateaus on this base plateau to represent the subtrees.
Various representative icons show end nodes (shown distincdy from subtrees) on the plateau. The layout
is based around the proportion of subtrees contained at that level and the plateaus are sized accordingly so
the denser areas of the structure are visually obvious due to their increased surface area.
The user is able to make any chosen node the current root and the visualisation changes accordingly.
They can also re-order the child nodes of a chosen node to best suit their current task. From experiments
this technique is apparently able to deal with both wide and deep hierarchical structures.
Figure 3-3 - An Information Pyramid
Figure 3-3 shows the Information Pyramid technique applied to the JDK 1.0.2 directory tree which
contains 13 subdirectories up to a depth of 10, and 4455 individual files.
- 4 7 -
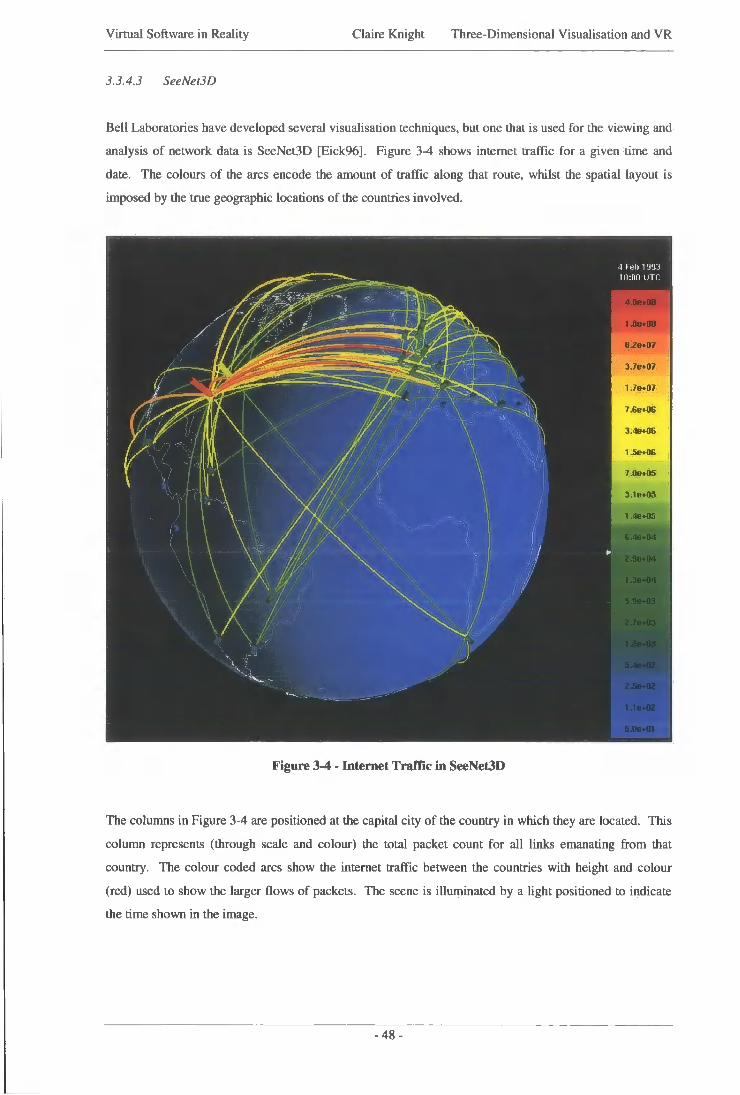
Virtual Software in Reality Claire Knight Three-Dimensional Visualisation and VR
3.3.4.3 SeeNet3D
Bell Laboratories have developed several visualisation techniques, but one that is used for the viewing and
analysis of network data is SeeNet3D [Eick96]. Figure 3-4 shows internet traffic for a given time and
date. The colours of the arcs encode the amount of traffic along that route, whilst the spatial layout is
imposed by the true geographic locations of the countries involved.
4.0ev0a
B .20*07
3.7e+07
17e+07
7.6e*06
3.4e+06
I 1.5e*06
7.06+03
3.1B+05
1.4et05
1.1
r,.0e*0l
Figure 3-4 - Internet Traffic in SeeNet3D
The columns in Figure 3-4 are positioned at the capital city of the country in which they are located. This
column represents (through scale and colour) the total packet count for all links emanating from that
country. The colour coded arcs show the internet traffic between the countries with height and colour
(red) used to show the larger flows of packets. The scene is iUurninated by a light positioned to indicate
the time shown in the image.
- 4 8 -
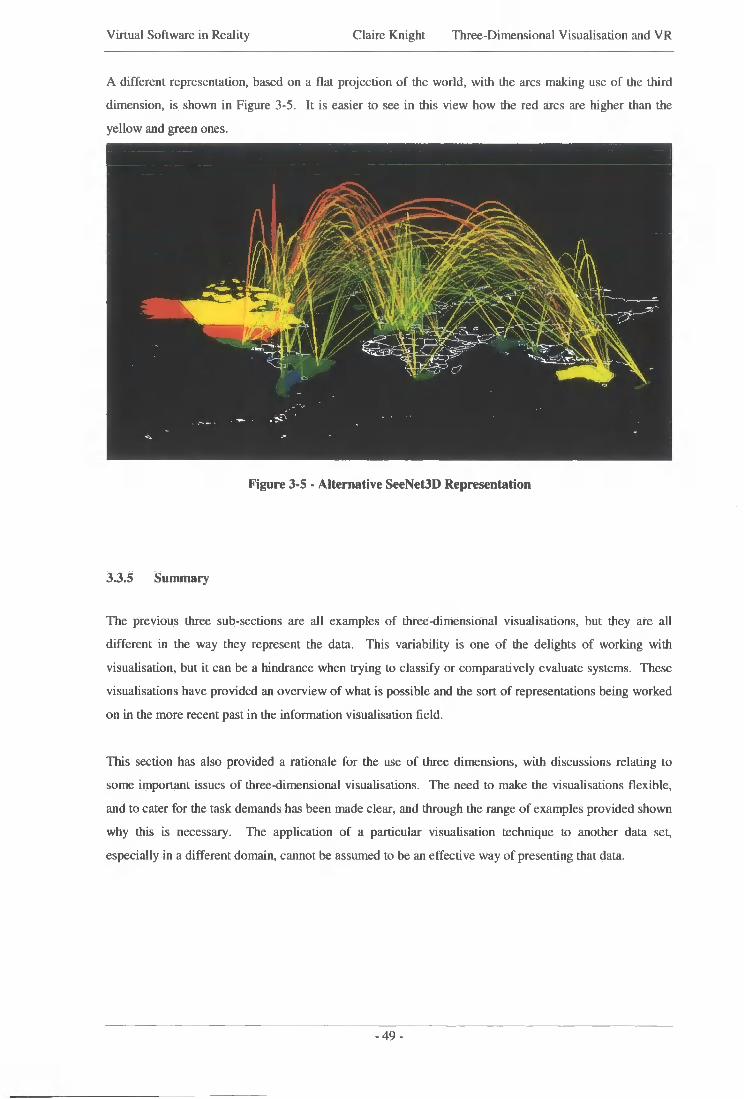
Virtual Software in Reality Claire Knight Three-Dimensional Visualisation and VR
A different representation, based on a flat projection of the world, with the arcs making use of the third
dimension, is shown in Figure 3-5. It is easier to see in this view how the red arcs are higher than the
yellow and green ones.
Figure 3-5 - Alternative SeeNet3D Representation
33.5 Summary
The previous three sub-sections are all examples of three-dimensional visualisations, but they are all
different in the way they represent the data. This variability is one of the delights of working with
visualisation, but it can be a hindrance when trying to classify or comparatively evaluate systems. These
visualisations have provided an overview of what is possible and the sort of representations being worked
on in the more recent past in the information visualisation field.
This section has also provided a rationale for the use of three dimensions, with discussions relating to
some important issues of three-dimensional visualisations. The need to make the visualisations flexible,
and to cater for the task demands has been made clear, and through the range of examples provided shown
why this is necessary. The application of a particular visualisation technique to another data set,
especially in a different domain, cannot be assumed to be an effective way of presenting that data.
- 4 9 -
Virtual Software in Reality Claire Knight Three-Dimensional Visualisation and VR
3.4 Conclusions
This chapter has covered VR environments and three-dimensional visualisation. There is the obvious link
that the former provides an implementation mechanism for the latter. The many issues that affect both of
these areas have also been discussed. The two areas, related as they are, obviously have influences on
each other. The VR issues such as metaphor and navigation are vital components of a successful
visualisation, and likewise the desire to encode tacit knowledge into the visualisation environment has
impacts on the metaphor (for example) from a VR perspective.
A specialised subset of information visualisation is software visualisation. This is covered in detail in the
next chapter. Although this research focuses on three dimensional software visualisation, and this chapter
has provided much information about the three dimensional aspect of the work, the software visualisation
section starts with a brief coverage of two dimensional visualisations before moving back to considering
three dimensions.
- 5 0 -
Virtual Software in Reality
Chapter Four - Software Visualisation
Virtual Software in Reality Claire Knight Software Visualisation
4.1 Introduction
An area of computer science that is often confused with visualisation is that of visual programming.
These are two distinct areas. The use of a visual programming language/tool is to aid the programmer in
the creation of user interfaces (and in some situations, software). Essentially the visual objects are
symbols that represent some item of code that would otherwise have had to be written by hand.
Visualisation on the other hand is something that uses existing (possibly complex) data sets and tries to
make them more understandable.
It could be said that visual programming is just one small area of visualisation. The use of graphics and
imagery is an aid to the programmer albeit in creation rather than understanding the system. But what is
being made more accessible through the images is the programming language. Despite this link visual
programming and program visualisation are not the same thing and the terms are not interchangeable.
Software visualisation can be seen as a specialised subset of information visualisation. This is because
information visualisation is the process of creating a graphical representation of abstract, generally non-
numerical, data. This is exactly what is required when trying to visualise software. The term software
visualisation has many meanings depending on the author. For the purposes of this thesis software
visualisation can be taken to mean any form of program visualisation that is used after the software has
been written as an aid to understanding (i.e. it does not mean visual programming). More formally, based
on the definition of visualisation written in Section 3.3, software visualisation can be defined as [Knig99a]
"Software visualisation is a discipline that makes use of various forms of imagery to provide insight and understanding and to reduce complexity of the existing software system under consideration."
The goal of software visualisation is also included in the above definition. To create a visualisation for no
real purpose would be a pointless exercise. It has long been known that understanding software is a
complex and hard task because of the complexity of the software itself. Therefore techniques that aid the
programmer in his comprehension of an existing software system deserve research focus. Software
visualisation aims to aid the programmer by providing insight and understanding through the graphical
displays and views, and to reduce the perceived complexity through the use of suitable abstractions and
metaphors.
Myers [Myer90] effectively sums up the benefits of using graphics in the presentation of program
information when he writes
"The human visual system and human visual information processing are clearly optimized for multi-dimensional data. Computer programs, however, are conventionally presented in a one-dimensional textual form, not utilizing the full power of the brain."
- 5 2 -
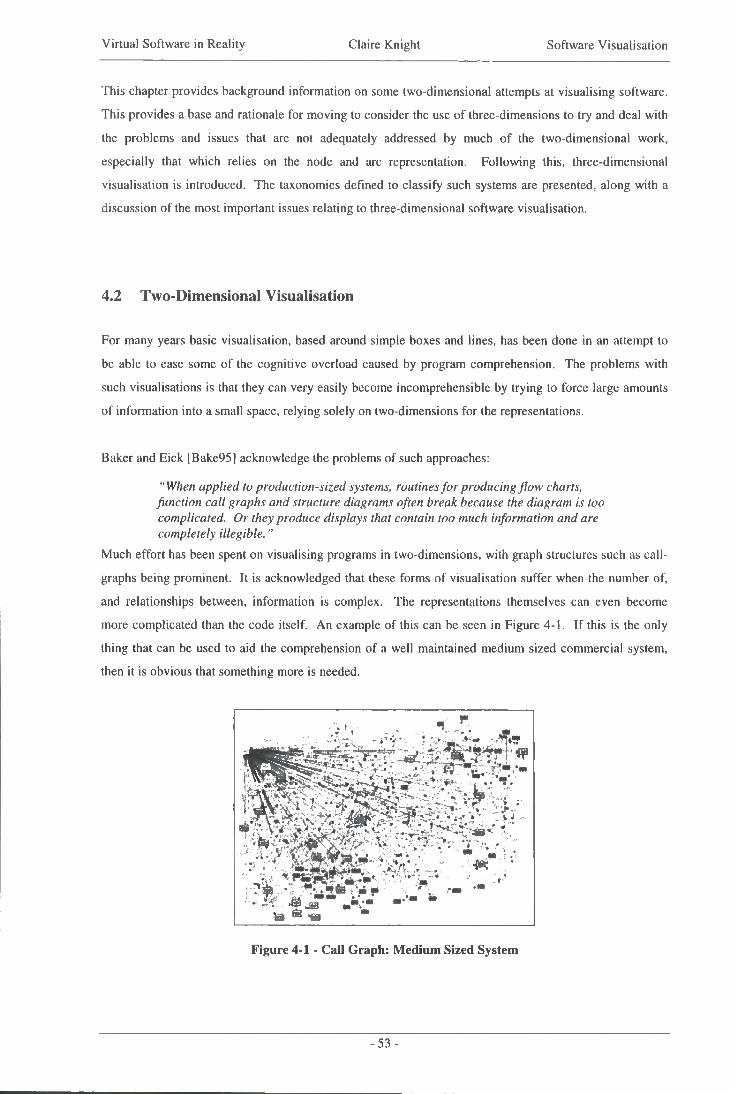
Virtual Software in Reality Claire Knight Software Visualisation
This chapter provides background information on some two-dimensional attempts at visualising software.
This provides a base and rationale for moving to consider the use of three-dimensions to try and deal with
the problems and issues that are not adequately addressed by much of the two-dimensional work,
especially that which relies on the node and arc representation. Following this, three-dimensional
visualisation is introduced. The taxonomies defined to classify such systems are presented, along with a
discussion of the most important issues relating to three-dimensional software visualisation.
4.2 Two-Dimensional Visualisation
For many years basic visualisation, based around simple boxes and lines, has been done in an attempt to
be able to ease some of the cognitive overload caused by program comprehension. The problems with
such visualisations is that they can very easily become incomprehensible by trying to force large amounts
of information into a small space, relying solely on two-dimensions for the representations.
Baker and Eick [Bake95] acknowledge the problems of such approaches:
"When applied to production-sized systems, routines for producing flow charts, function call graphs and structure diagrams often break because the diagram is too complicated. Or they produce displays that contain too much information and are completely illegible."
Much effort has been spent on visualising programs in two-dimensions, with graph structures such as call-
graphs being prominent. It is acknowledged that these forms of visualisation suffer when the number of,
and relationships between, information is complex. The representations themselves can even become
more complicated than the code itself. An example of this can be seen in Figure 4-1. If this is the only
thing that can be used to aid the comprehension of a well maintained medium sized commercial system,
then it is obvious that something more is needed.
•
-4'
- 0 \
i —
Figure 4-1 - Call Graph: Medium Sized System
- 5 3 -
Virtual Software in Reality Claire Knight Software Visualisation
In attempts to address the obvious problems with the existing representations several systems and layout
algorithms have been developed. The next five sections provide more detailed information on a
representative sample of these. Another technique that has been applied, with little success due to the
same problems still being prevalent, is the representation of node and arc structures such as call graphs in
three-dimensions [Hend95a, Hend95b, Feij98]. Much of this work was done without thought or design
being applied to the virtual space in which the graphics were located which destroyed the possible
usefulness of such an environment.
4.2.1 SHriMP
SHriMP (Simple Hierarchical Multi-Perspective) [Stor95] is a visualisation that combines the nodes and
arcs representation so cherished by software visualisers with the fisheye filtering technique. As the name
implies, the fisheye technique emulates the behaviour of a fisheye lens. The information at the centre of
the view is magnified, whilst that at the periphery is reduced in size. SHriMP also incorporates the use of
nested graphs for the display of software structures. The use of these two techniques provides, according
to the authors, the ability to create multiple views at different levels of abstraction and perspective. To be
able to interact with the data in this way is a powerful way of dealing with large amounts of information as
selective filtering and viewing can take place. Such extensions are a step towards being better able to deal
with the large and complex software that is so pervasive today, but the use of two-dimensions and the
standard representation as the basis may limit the applicability and use of such tools.
4.2.2 VIFOR
VIFOR stands for Visual Interactive FORtran and is a software tool that is geared towards maintaining
Fortran 77 code [Raj 190]. This system works by using a database of code detail from the Fortran code and
then allowing it to be viewed and queried in either the textual form of the code or a graph layout based
visualisation. This layout mechanism was developed for the VIFOR tool and attempts to merge the
standard call graph and data dependency graphs that are more commonly used. Early work on a C
maintenance and understanding tool is also documented in this paper; VIC. An extension of this work was
the development of VIFOR 2 [Rajl96]. This improved the browsing system to allow the integration of
incremental recording and retrieval of documentation.
- 5 4 -
Virtual Software in Reality Claire Knight Software Visualisation
4.2.3 CARE
CARE (Computer Aided Re-Engineering) is an understanding tool that works with C source code
[Lino93]. This understanding tool makes use of two-dimensional visualisations in windows and browsers
(as with the previous tools) to show graphs of some of the code relations. As with VIFOR, CARE
displays the data flow and call structure of the program using an extension of the VIFOR layout algorithm.
In order to do this, a repository of the structural and functional dependencies in the code is generated, and
the presentation part of the tool uses this information when displaying the visualisations. The tool also
supports the creation and use of both graphical and textual slices through the information.
As with VIFOR, an extension of the tool was developed to deal with other languages. OOICARE
[Lino94] is an extension of CARE that deals with C++ code, hence the Object Oriented addition to the
name. It is also able to deal with C code because of the syntactical similarities of the language
notwithstanding the object oriented part of C++.
4.2.4 Cross-Referencing
The use of cross-reference information has long been used for debugging and understanding program
code, but the data that it is able to provide is still a useful way of looking at and investigating the system.
Early cross-reference tools relied on textual output which had a tendency to be long and dense and hence
considered to be of little use because the effort involved in using them was too great. An interactive, but
still textual in form, cross-reference tool was produced by Munro and Robson [Munr87]. This solved the
problem of having to read through the massive output files that the previous tools produced but was still
limiting in the manipulation and representation of the data. An example of two-dimensional browsing for
Java code that used browsing windows to query and investigate the data can be found in the work by
Knight [Knig97].
Cross-referencing is often discarded as a means of providing information for understanding tools, and
certainly many two-dimensional tools rely heavily on only the subset of relations presented as part of
VIFOR and CARE; call graphs and data flow diagrams. The amount of data available and the relations
that may become obvious with cross-referenced information to hand is too much of a valuable source to
throw away. Such information can be utilised in many visualisations, in a variety of ways, and even
integrated with other representations.
- 5 5 -
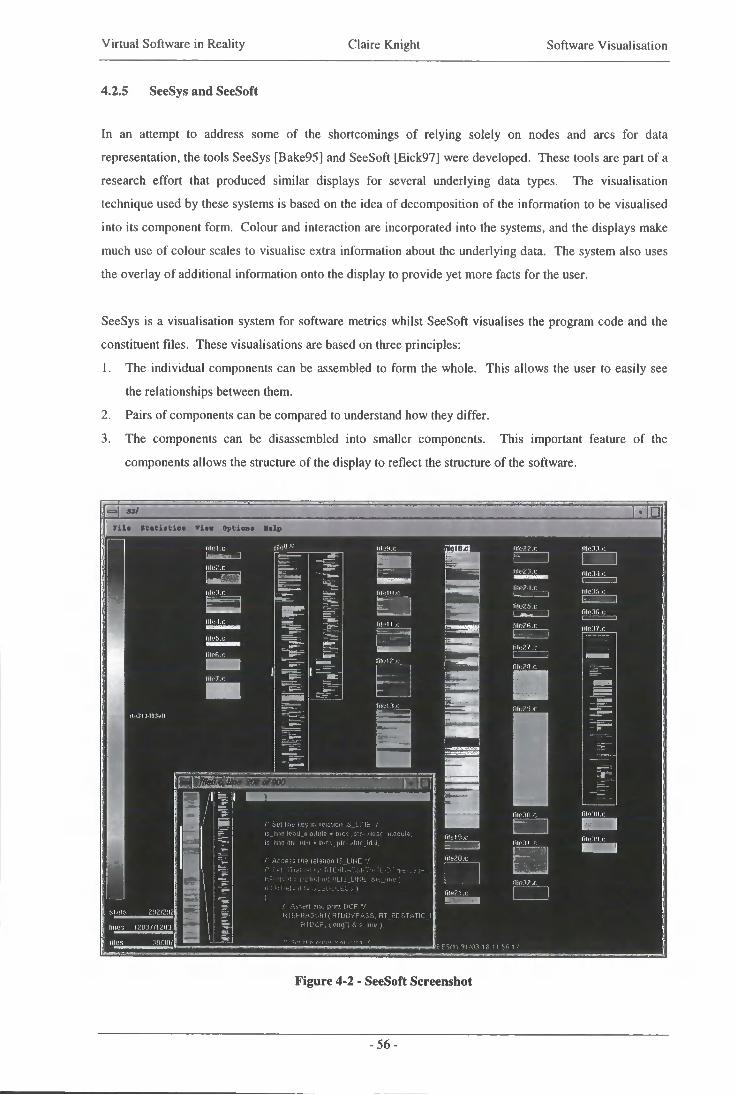
Virtual Software in Reality Claire Knight Software Visualisation
4.2.5 SeeSys and SeeSoft
In an attempt to address some of the shortcomings of relying solely on nodes and arcs for data
representation, the tools SeeSys [Bake95] and SeeSoft [Eick97] were developed. These tools are part of a
research effort that produced similar displays for several underlying data types. The visualisation
technique used by these systems is based on the idea of decomposition of the information to be visualised
into its component form. Colour and interaction are incorporated into the systems, and the displays make
much use of colour scales to visualise extra information about the underlying data. The system also uses
the overlay of additional information onto the display to provide yet more facts for the user.
SeeSys is a visualisation system for software metrics whilst SeeSoft visualises the program code and the
constituent files. These visualisations are based on three principles:
1. The individual components can be assembled to form the whole. This allows the user to easily see
the relationships between them.
2. Pairs of components can be compared to understand how they differ.
3. The components can be disassembled into smaller components. This important feature of the
components allows the structure of the display to reflect the structure of the software.
35m
•
Figure 4-2 - SeeSoft Screenshot
- 5 6 -
Virtual Software in Reality Claire Knight Software Visualisation
An example screenshot from SeeSoft can be seen in Figure 4-2. It can be seen from this image that the
individual components are visible whilst maintaining a view of the whole system. This sort of technique
has also been applied in the Information Mural visualisations of Jerding and Stasko [Jerd95], whilst the
concept of encoding deterioration (and change) as a coloured property of source code was originally
documented by Hil l and Hollan [Hill93].
4.2.6 Summary
In his paper No Silver Bullet [Broo87], Brooks wrote
"Software is invisible and unvisualizable.
. ..software is very difficult to visualize. Whether one diagrams control flow, variable-scope nesting, variable cross-references, dataflow, hierarchical data structures, or whatever, one feels only one dimension of the intricately interlocked software elephant. If one superimposes all the diagrams generated by the many relevant views, it is difficult to extract any global overview."
At the time Brooks wrote this, visualising software meant displaying some information about (or some
aspect of) the software in a graph structure. From what can be seen in Figure 4-1, he has a point. This
need not now be the case with the advances in computer hardware and graphics technology.
Two-dimensional techniques have shortcomings, but this is not to trivialise the issues that still remain with
the nodes and arcs techniques. Layout, for example, is a hard problem and one that is not appreciated by
many [Tama88]. The systems presented in the previous sections provide a representative sample of the
sorts of program comprehension tools that have been developed to aid understanding and are early
attempts at visualisation. The last of these sections, 4.2.5, shows that the reliance on nodes and arcs and
solely investigating layout algorithms and clustering is not necessarily the only way forward, even with
two-dimensions. This work is a stepping stone to moving onto three-dimensional, coloured, and non-arc
reliant representations.
4.3 Three-Dimensional Visualisation
Having seen in the preceding section that the existing two-dimensional visualisation techniques lack the
ability to deal with the commercial systems of today, this section introduces the concept of using three-
dimensions for the visual display of program artefacts for comprehension. Taxonomies developed to try
and classify these newer (and to cover the existing) techniques are introduced, compared and contrasted.
Then several software visualisation issues are presented and discussed. These are all important issues
when the aim is to visualise software with the intention of helping the process of comprehension, and
- 5 7 -
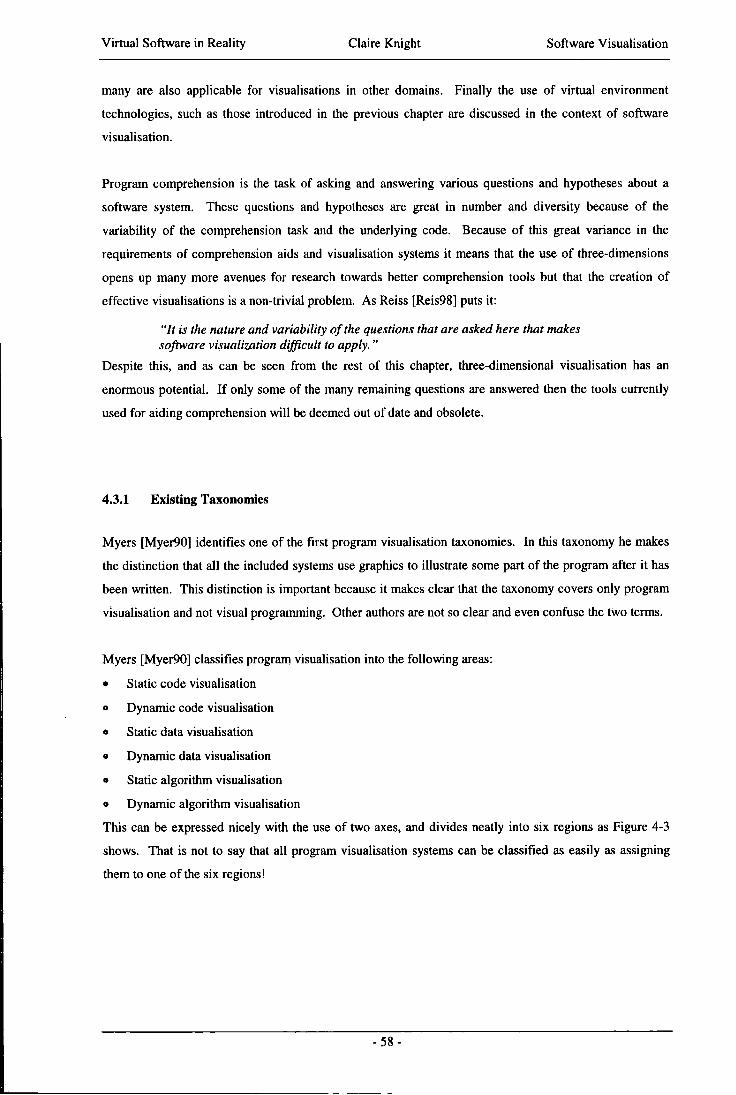
Virtual Software in Reality Claire Knight Software Visualisation
many are also applicable for visualisations in other domains. Finally the use of virtual environment
technologies, such as those introduced in the previous chapter are discussed in the context of software
visualisation.
Program comprehension is the task of asking and answering various questions and hypotheses about a
software system. These questions and hypotheses are great in number and diversity because of the
variability of the comprehension task and the underlying code. Because of this great variance in the
requirements of comprehension aids and visualisation systems it means that the use of three-dimensions
opens up many more avenues for research towards better comprehension tools but that the creation of
effective visualisations is a non-trivial problem. As Reiss [Reis98] puts it:
"It is the nature and variability of the questions that are asked here that makes software visualization difficult to apply."
Despite this, and as can be seen from the rest of this chapter, three-dimensional visualisation has an
enormous potential. I f only some of the many remaining questions are answered then the tools currently
used for aiding comprehension will be deemed out of date and obsolete.
4.3.1 Existing Taxonomies
Myers [Myer90] identifies one of the first program visualisation taxonomies. In this taxonomy he makes
the distinction that all the included systems use graphics to illustrate some part of the program after it has
been written. This distinction is important because it makes clear that the taxonomy covers only program
visualisation and not visual programming. Other authors are not so clear and even confuse the two terms.
Myers [Myer90] classifies program visualisation into the following areas:
• Static code visualisation
» Dynamic code visualisation
• Static data visualisation
• Dynamic data visualisation
• Static algorithm visualisation
» Dynamic algorithm visualisation
This can be expressed nicely with the use of two axes, and divides neatly into six regions as Figure 4-3
shows. That is not to say that all program visualisation systems can be classified as easily as assigning
them to one of the six regions!
- 5 8 -
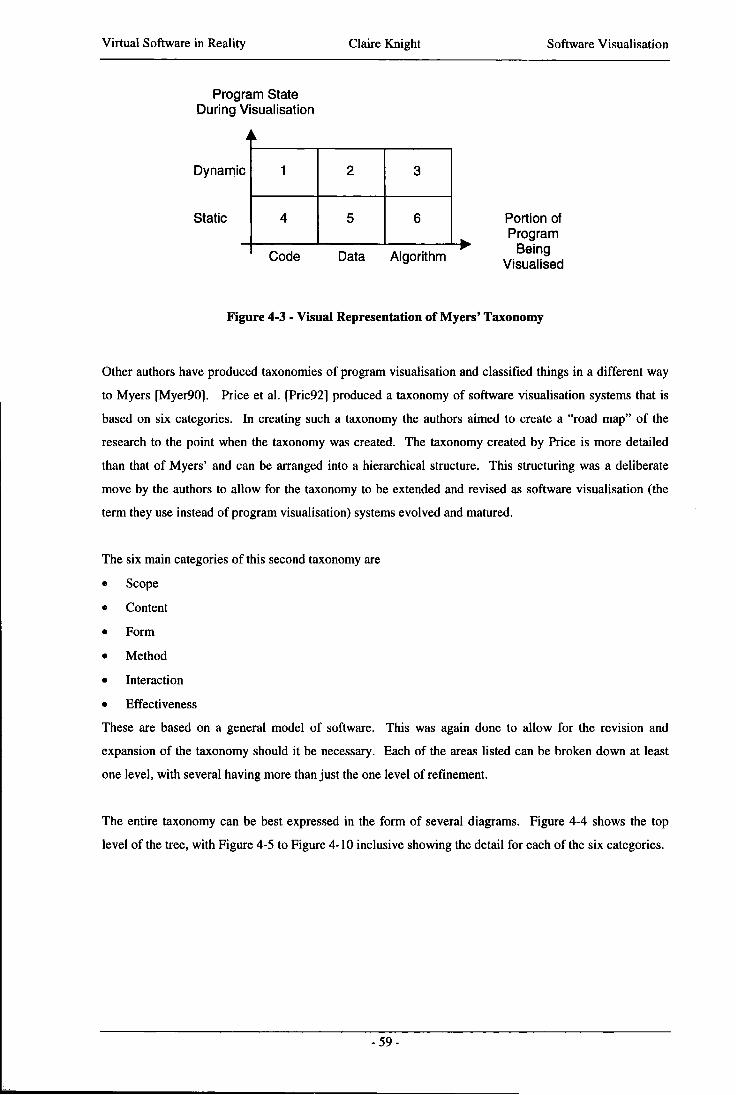
Virtual Software in Reality Claire Knight Software Visualisation
Program State During Visualisation
Dynamic 1 2 3
Static 4 5 6 Portion of Program
Code Data Algorithm Visualised
Figure 4-3 - Visual Representation of Myers' Taxonomy
Other authors have produced taxonomies of program visualisation and classified things in a different way
to Myers [Myer90]. Price et al. [Pric92] produced a taxonomy of software visualisation systems that is
based on six categories. In creating such a taxonomy the authors aimed to create a "road map" of the
research to the point when the taxonomy was created. The taxonomy created by Price is more detailed
than that of Myers' and can be arranged into a hierarchical structure. This structuring was a deliberate
move by the authors to allow for the taxonomy to be extended and revised as software visualisation (the
term they use instead of program visualisation) systems evolved and matured.
The six main categories of this second taxonomy are
• Scope
• Content
• Form
• Method
• Interaction
• Effectiveness
These are based on a general model of software. This was again done to allow for the revision and
expansion of the taxonomy should it be necessary. Each of the areas listed can be broken down at least
one level, with several having more than just the one level of refinement.
The entire taxonomy can be best expressed in the form of several diagrams. Figure 4-4 shows the top
level of the tree, with Figure 4-5 to Figure 4-10 inclusive showing the detail for each of the six categories.
- 5 9 -

Virtual Software in Reality Claire Knight Software Visualisation
Software Visualization
A: Scope
B: Content
C: Form
D: Method
E: Interaction
F: Effectiveness
Figure 4-4 - Top Level of the Price et al. Software Visualisation Taxonomy
The scope category can be summarised as the range of programs that the software visualisation system can
take as input and then visualise. The sub divisions of this category can be seen in Figure 4-5.
A . l Generality
A: Scope
A. 1.1 Hardware
A. 1.2 Operating System
A. 1.3 Language
A. 1.4 Applications
A. 1.3.1 Concurrency
A. 1.4.1 Speciality
A.2 Scalability A.2.1 Program
A.2.2 Data Sets
Figure 4-5 - Detail of the Scope Category of the Taxonomy
The content category can be summarised as the subset of information (of the original software) that the
software visualisation system visualises. The sub divisions of this category can be seen in Figure 4-6.
- 6 0 -
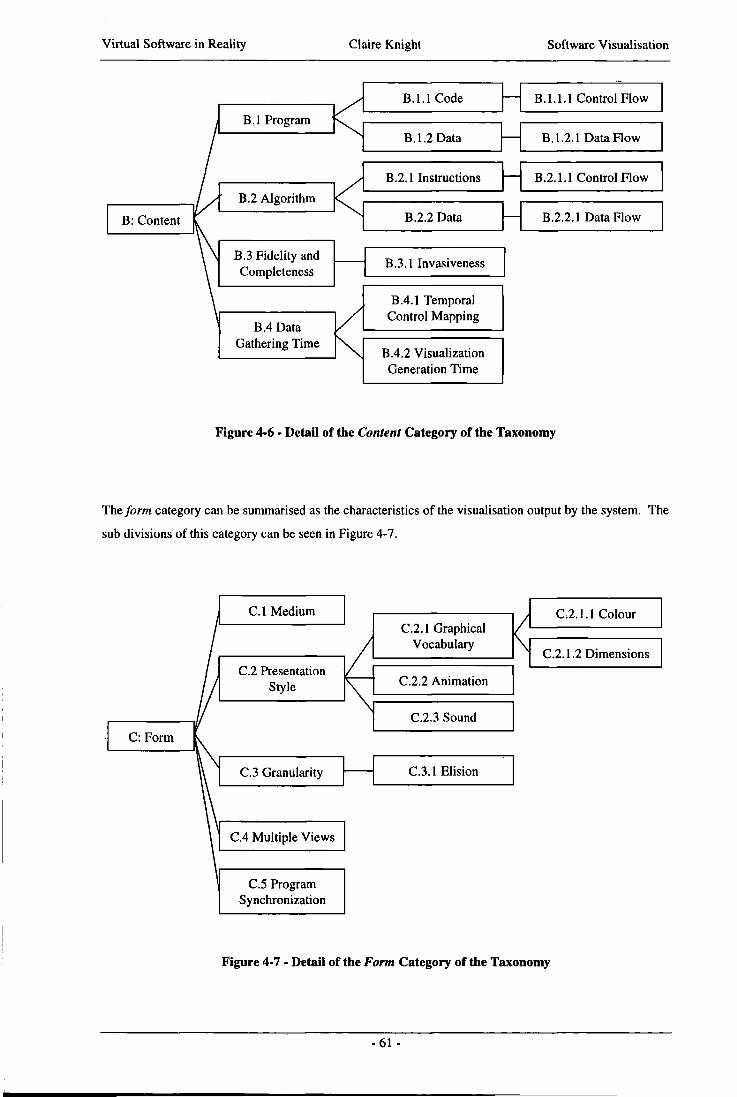
Virtual Software in Reality Claire Knight Software Visualisation
B: Content
B . l Program
B.2 Algorithm
B.3 Fidelity and Completeness
B.4 Data Gathering Time
B . l . l Code
B.l .2 Data
B.2.1 Instructions
B.2.2 Data
B.3.1 Invasiveness
B.4.1 Temporal Control Mapping
B.4.2 Visualization Generation Time
B . l . 1.1 Control Flow
B.l.2.1 Data Flow
B.2.1.1 Control Flow
B.2.2.1 Data Flow
Figure 4-6 - Detail of the Content Category of the Taxonomy
The form category can be summarised as the characteristics of the visualisation output by the system. The
sub divisions of this category can be seen in Figure 4-7.
C: Form
C.l Medium
C.3 Granularity
C.2.1 Graphical Vocabulary
C.2 Presentation Style
/ C.2 Presentation Style
/ C.2.2 Animation C.2 Presentation
Style \ C.2.2 Animation
C.2.3 Sound
C.3.1 Elision
C.2.1.1 Colour
C.2.1.2 Dimensions
C.4 Multiple Views
C.5 Program Synchronization
Figure 4-7 - Detail of the Form Category of the Taxonomy
-61 -
Virtual Software in Reality Claire Knight Software Visualisation
The method category can be summarised as how the visualisation is specified. The sub divisions of this
category can be seen in Figure 4-8.
D: Method
D . l Visualization Specification
Style
D.2 Connection Technique
D . l . l Intelligence
D.1.2Tailorability
D.2.1 Code Ignorance Allowance
D.2.2 System-Code Coupling
D. 1.2.1 Customization Language
Figure 4-8 - Detail of the Method Category of the Taxonomy
The interaction category can be summarised as how does the user of the software visualisation system
interact and control it? The sub divisions of this category can be seen in Figure 4-9
E.l Style
E: Interaction E.2 Navigation
E.2.1 Elision Control
E.2.2 Temporal Control
E.2.2.1 Direction
E.3 Scripting Facilities
E.2.2.2 Speed
Figure 4-9 - Detail of the Interaction Category of the Taxonomy
The effectiveness category can be summarised as: does the software visualisation system provide facilities
for managing the recording and playback of interactions with specific visualisations? The sub divisions of
this category can be seen in Figure 4-10.
- 6 2 -
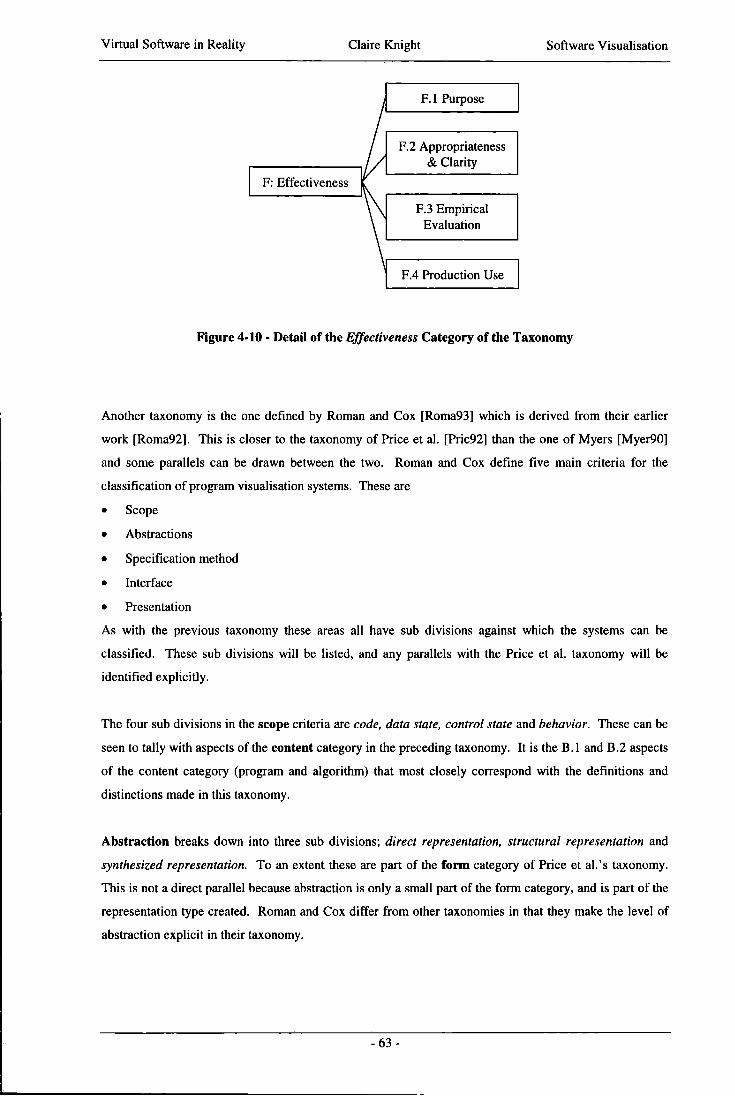
Virtual Software in Reality Claire Knight Software Visualisation
F. l Purpose
F: Effectiveness
F.2 Appropriateness & Clarity
F.3 Empirical Evaluation
F.4 Production Use
Figure 4-10 - Detail of the Effectiveness Category of the Taxonomy
Another taxonomy is the one defined by Roman and Cox [Roma93] which is derived from their earlier
work [Roma92]. This is closer to the taxonomy of Price et al. [Pric92] than the one of Myers [Myer90]
and some parallels can be drawn between the two. Roman and Cox define five main criteria for the
classification of program visualisation systems. These are
• Scope
• Abstractions
• Specification method
• Interface
• Presentation
As with the previous taxonomy these areas all have sub divisions against which the systems can be
classified. These sub divisions will be listed, and any parallels with the Price et al. taxonomy will be
identified explicitly.
The four sub divisions in the scope criteria are code, data state, control state and behavior. These can be
seen to tally with aspects of the content category in the preceding taxonomy. It is the B . l and B.2 aspects
of the content category (program and algorithm) that most closely correspond with the definitions and
distinctions made in this taxonomy.
Abstraction breaks down into three sub divisions; direct representation, structural representation and
synthesized representation. To an extent these are part of the form category of Price et al.'s taxonomy.
This is not a direct parallel because abstraction is only a small part of the form category, and is part of the
representation type created. Roman and Cox differ from other taxonomies in that they make the level of
abstraction explicit in their taxonomy.
- 6 3 -
Virtual Software in Reality Claire Knight Software Visualisation
The specification method has been broken down in four smaller criteria. These are predefinition,
annotation, declaration and manipulation. The specification of the visualisations is dealt with by Price et
al. in their method category, and whilst Roman and Cox specify more detail as to how the visualisation is
explicitly specified Price et al. manage to incorporate more classification criteria.
The fourth of Roman and Cox's criteria is interface. They have only split this into two categories;
graphical vocabulary and interaction. Price et al. cover interaction in their category of the same name,
interaction, whilst graphical vocabulary is dealt with in their form category.
The final criteria, presentation, has four sub divisions; interpretation of graphics, analytical
presentation, explanatory presentation and orchestration. These can all be classed under the
effectiveness category defined by Price et al.
Whilst there are differences between the taxonomies of Roman and Cox and Price et al. there are also very
many similarities. The main differences are generally down at a very low level of detail, and can be
compensated for in the most part by a different part of the opposite taxonomy. Myers' taxonomy does not
bear such a close relation to either of these other two taxonomies, although a criticism levelled at that
taxonomy by Price et al. is that it fails to go into enough depth.
4.3.2 Tangible from Intangible
One of the main problems for software visualisation (and other forms of information visualisation) is of
trying to create a tangible representation of something that has no inherent form. Therefore the aim is to
visualise the intangible in an effective and useful way. Effective and useful here refers to the visualisation
being able to increase the understanding of the user whilst reducing the perceived complexity.
Ball and Eick [Ball96] recognise this problem when they write
"Software is intangible, having no physical shape or size. After it is written, code "disappears" into files kept on disks."
and
"The invisible nature of software hides system complexity, ...."
Walker [Walk95] comments on the software being the intangible part of information systems when he
writes
"Some aspects of an information system are tangible, but a major component is the software which is an abstract and invisible collation of computer instructions."
Chapin and Lau [Chap96] also recognise the intangible nature of software
- 6 4 -
Virtual Software in Reality Claire Knight Software Visualisation
"Furthermore, software is intangible, and it is only the representation of the software which can be communicated between people and between people and computers."
An important point to be drawn from this is the communication aspect. Since software is intangible and
each programmer has his own mental representation then an effective visualisation can also act as a
common frame of reference. In discussing pieces of the software either informally between colleagues or
formally in meetings, i f the participants do not concur over the code being discussed the discussion may as
well not take place. Visualisation of the software can provide not only a graphical representation of the
piece of code under discussion (for clarity over the section being discussed), but also allow the discussion
to take place in the realm of that visualisation. This means that the discussion can be based around the
visualisation and the code it represents rather than the piece of code. In doing this, the visualisation has
provided a starting point for common understanding.
4.3.3 Benefits and Challenges
Walker [Walk95] sums up the benefits of visualisation when he writes (emphasis added)
"The traditional interface of mouse, keyboard and screens of text allows us to work on computers, while techniques such as visualisation will truly enable us to work with computers."
This comment only really holds i f the visualisations are well designed and implemented. Just using
visualisation with no real thought or planning, i.e. not effectively using it, will not lead to the situation
described by Walker. I f the visualisations are usable and effective then the above description is perfect
for showing the benefits that visualisation can bring.
Walker does admit that there are challenges to be overcome in visualisation (information and software).
Walker describes the first of these challenges as
"We therefore conclude that in response to the first Challenge of growing data volume combined with declining information content, there is a key role for visualisation in enabling human exploration, navigation and browsing of complex information environments."
He also comments on the need to have a natural and intuitive user interface so that the natural perceptual
skills of humans can be employed when they are using the visualisations. The second challenge is
identified as
"... the conversion of appropriate data to relevant information."
This relates to the metaphors and abstractions discussed in several previous sections of this thesis.
Another challenge is connected to the intangible nature of software discussed in the preceding section.
Walker describes this as
"... the problems in managing increasingly abstract problems against ever decreasing timescales."
The final challenge can be simply described as
- 6 5 -
Virtual Software in Reality Claire Knight Software Visualisation
"... effectively communicating a vision, such that it is accurately shared and understood by the audience."
In trying to achieve the aim of increased understanding of the software under investigation, Walker
identifies the benefits of visualisation, but also shows the explorative powers that visualisation can afford
to the user.
"Although the visualisation adds nothing to the capability of the underlying models, the increased user involvement offers the potential for faster understanding and more rapid, exhaustive exploration of the model's predictions and limitations."
Visualisations can be of indeterminable value in trying understanding complex information. This is
summed up by Ware et al. [Ware93] as
"There is increasing evidence that it is possible to perceive and understand increasingly complex information systems if they are displayed as graphical objects in a three dimensional space."
They also suggest that the comprehension of complex software systems is one of the most challenging
issues facing the software engineering field. Their research concentrates on the use of three dimensions in
the display of object-oriented software in an attempt to ease the complexity problem.
Walker [Walk95] concludes his paper with this sentence
"Creating a world in which humans and computers are equally at ease in the analysis and interpretation of data will not be easy, but the rewards will be immense."
Visualisation is just one of the many possible ways of trying to achieve this.
4.3.4 IA not AI
Intelligence amplification (IA) is the use of computers to aid and enhance human intelligence rather than
the artificial intelligence (AI) aim of trying to substitute humans with computers. Intelligence
amplification builds on the skills that humans already have, and tries to augment the areas that are lacking
in some way. Frederick Brooks (documented in by Rheingold [Rhei92]) describes his beliefs about
intelligence amplification in the following way
"/ believe the use of computer systems for intelligence amplification is much more powerful today, and will be at any given point in the future, than the use of computers for artificial intelligence (AI). In the AI community, the objective is to replace the human mind by the machine and its program and its data base. In the IA community, the objective is to build systems that amplify the human mind by providing it with computer-based auxiliaries that do the things that the mind has trouble doing."
Brooks identifies three areas in which humans are more skilled than computers. The first is pattern
recognition (aural or visual). The second is in performing evaluations, and the third is the overall sense
- 6 6 -
Virtual Software in Reality Claire Knight Software Visualisation
of context that allows previously unrelated pieces of information to become related and useful in a new
situation.
Walker [Walk95] also touches on the subject of intelligence amplification in his discussion on the
challenges of visualisation.
"A natural and intuitive visual interface can retain the critical contribution from human perceptual skills, ensuring that opportunities for lateral thinking or perhaps an unexpected leap of imagination are not lost. Programming a computer to "look for something interesting " in a database is a major undertaking, but given appropriate tools, it is a task for which humans are well equipped."
The first sentence can be seen to be similar to the third skill identified by Brooks, that of a sense of
context. The second sentence by Walker is essentially talking about the pattern recognition skill specified
by Brooks (in [Rhei92]).
Intelligence amplification is of importance to software visualisation (and any other form of visualisation)
because in representing large and complex data sets graphically the aim is to help the user to get a better
understanding of content of the data sets. By aiding the user in this way visualisation tools are acting also
as intelligence amplification tools. Reading through many thousands of pieces of information and then
summarising them in a finite graphical space would be an immense, complex and possibly tedious task.
For a computer with the right "instructions", it is a simple data processing exercise.
Hubbold et al. [Hubb93] make a similar connection with the field of VR (and therefore visualisations that
make use of VR as an enabling technology). They also identify the pattern recognition and contextual
abilities of humans.
"In our everyday existence we cope with, and filter out, tremendous amounts of information almost effortlessly and with very little conscious thought. Indeed, if the same information, in all its detail, were to be presented in a form that we had to think about consciously, then we would be overwhelmed quite easily. Spatial awareness, pattern recognition, information filtering, coordination of multiple information streams are things we take for granted. Rather than look for a solution in Al, part of the VR thesis is that information presented in a suitable way can be processed far more effectively and directly by people."
The role of a visualisation system as an intelligence amplification tool rather than as a system that tries to
second guess the information the user requires is emphasised by Crossley et al. [Cros97]:
"...the role of the system is not to select documents similar to a user-supplied query but to organise and display information about many documents in such a way as to assist users to select useful documents on their own."
This shows that the important challenges and research issues for visualisations are to be able to handle
such tasks well and provide the necessary support as transparently as possible. Changing the query
mechanism in order to improve performance (for example in the situation above) is not going to help in
another situation or be widely applicable to other visualisations.
- 6 7 -
Virtual Software in Reality Claire Knight Software Visualisation
4.3.5 Abstractions
Abstractions need to be considered when focusing on visualisation for two reasons. The first is that to
represent any form of data (software or otherwise) by visualisation involves abstracting away from the
original data. The second reason is that within the visualisation different levels of abstraction can be
important.
I f program code is considered, it can be seen that it goes through many transformations, and thus levels of
abstraction before any visualisation system displays it graphically. Programs are ways of instructing the
computer to do something. The problem is that computers understand ones and zeros whilst humans find
this very difficult. Third and fourth generation programming languages are now used to create program
code, but this then has to be converted in some way to a form that the computer can act on. It is this
reverse series of transformations that is creating a higher level of abstraction at each point (from the point
of view of humans). By creating a graphical representation of the data the level of abstraction is only
increased by one. This is something that many opponents of software visualisation forget. They suggest
that by abstracting, the original code is lost and hence the visualisations are useless.
Jerding and Stasko [Jerd96] created a visualisation system that reduced a data set into what they termed
an information mural. This display was at an overview level, but from the abstracted view it was still
possible to read the detailed information.
Storey et al. [Stor96] also made use of abstractions in their work on the Rigi system using SHriMP views.
The SHriMP visualisation uses nested graphs with fisheye techniques. It is the nested graphs that provide
the different levels of abstraction, but the visualisation is designed to allow the user to have a sense of
overall context when browsing.
Card et al. [Card91] consider the process of abstraction in their work on the Information Visualizer and
write
"The abstractions produced by the lower-level processing predetermine, to a considerable extent, the patterned structure that the higher-level processing can detect. The higher-level processing, in turn, reduces still further the quantity of information by processing it into yet more abstract and universal forms."
This is true of very many abstractions and abstraction mechanisms.
Abstractions of a visual nature are an effective way of providing an overview. The abstractions allow
more information to be displayed at once, and for information to be displayed in a different form. These
two "extra" insights on the data set can be very useful and can even aid in discovering new information
about the data under consideration.
- 6 8 -
Virtual Software in Reality Claire Knight Software Visualisation
4.3.6 Summary
Knight and Munro [Knig99b, Knig99c] provide a brief argument that traces through the reasons for using
three dimensions for software visualisation. This chapter has provided a much fuller version of that view.
This section (4.3) has introduced and discussed many facets of the three-dimensional research agenda and
provided rationale for the creation of software visualisations that exploit the extra dimension. Software
visualisation is still a hard problem and purely by using the extra dimension the field cannot hope to solve
the identified deficiencies of the two dimensional representations. What this information has tried to show
is that there is a way forward from nodes and arcs, and that the complex software of today is capable of
being (and should be) visualised.
4.4 Conclusions
There are several other important issues connected with software visualisation that have so far been
ignored. The first of these is to do with the scalability of the visualisation. It is all very well for a
visualisation system to work with a small source code sample but unless it works with large systems, with
little human intervention then it is of no use to programmers and maintainers. The visualisation needs to
scale well, and because of this the metaphors and abstractions used should be carefully considered. There
is also a need for automation. I f each facet of the visualisation needs to be created by hand there is little
point in using the visualisation with real systems. Some human intervention can be considered to be
acceptable, but on the whole the visualisation needs to be created with as little as possible. Price et al.
[Pric92] identify the scalability research issues still outstanding.
Another important issue, discussed in part when covering VR, is that of interaction. Not only does the
environment need to adequately support interaction and navigation, but so does the visualisation. I f a user
cannot select a focus of their choosing and then manipulate the visualisation in any way, it becomes
pointless having the visualisation system.
The relation between the concepts to be visualised and the metaphors used is of great importance.
Metaphors were discussed in more detail in section 3.2.6, but they warrant a mention in terms of software
visualisation. Metaphors not only provide a basis for the environment, but for the mapping from the data
to the visualisation. Similar principles apply when visualising with metaphors, such as consistency and
usability.
The driving force behind software visualisation is to ease the cognitive burden of trying to comprehend
existing programs. Myers [Myer90] includes areas for future research at the end of his program
visualisation taxonomy. The first of these relates to the scalability and abstraction issues previously
identified. The large and complex programs used and written today are the ones that can most benefit
- 6 9 -
Virtual Software in Reality Claire Knight Software Visualisation
from visualisation (from the point of view of the programmer). Unfortunately these programs are the ones
that receive the least support. Another previously identified area that Myers suggests is that there needs to
be more research in the automation of the visualisation generation from the source code. He also suggests
that many representations used are not very good. This can be alleviated, at least partly, through the use
of suitable metaphors and abstractions.
Von Mayrhauser et al. [Mayr97] identify several research areas that still need investigation that this
research aims to include. The first of these is using some form of history of browsed location that is
programmer defined, i.e. they decide what and where items are bookmarked, possibly with some
annotation as to the reason that the item has been marked. They also make the point that cross-referencing
related information, even across document types (such as between code and traditional textual documents)
and across abstraction levels is helpful for comprehension. It has long been shown that cross-referencing
of code is useful, so extending this can be seen as the next logical step. Another important item that they
note is the provision of some form of "road map" of the software under consideration.
These areas of research previously identified are still areas of research. These problems have not yet been
solved, although software visualisation systems have the potential to do so. To be able to use graphics
requires some form of mapping metaphor from the software elements to the graphical elements. There is
no obvious mapping because software has no defined shape or colour. In creating visualisations as virtual
environments there seems little point in restricting that world to one user, especially with the level of
system and domain knowledge held by programmers rather than formally documented. Hypertext is also
an important facet for both moving around between distant areas of the virtual world and enabling users to
follow lines of enquiry (during program comprehension) in a natural way rather than being forced to
retrieve that information in predefined ways.
As Myers [Myer90] concludes so succinctly:
"The success of spreadsheets demonstrates that if we find the appropriate paradigms, graphical techniques can revolutionize the way people interact with computers."
Visualisation for the sake of it may well produce pretty pictures but the visualisations developed as part of
this research have two aims; to reduce the complexity of the perceived view of the software and to
increase the user's understanding of the software.
- 7 0 -
Virtual Software in Reality
Chapter Five - Visualising Software
Virtual Software in Reality Claire Knight Visualising Software
5.1 Introduction
Some research has been done to investigate representations that differ from the traditional nodes and arcs
visualisations and the many variations on this theme in an attempt to address the documented shortfalls of
such techniques. Despite this work, it is not enough and the problem of "too little, too late" which is
likely to happen with the increasing size and complexity of software must be avoided by acting now. In
examining related areas of research it can be seen that the information visualisation and Virtual Reality
(VR) fields have made attempts to utilise the newer techniques related to three-dimensional graphics and a
range of prototype systems have been produced.
Basing software visualisation work directly on information visualisations is not always acceptable, or even
desirable, but using the lessons learnt and influences from this area provides an excellent basis from which
the software visualisation field can move forward. The domain-specific issues that would not necessarily
be a factor in an information visualisation can then be explored to see what implications, i f any, they have.
This chapter presents a discussion of the current state of software visualisation and where it should be
heading to be able to even begin to address such issues as scale and complexity when visually presenting
software. In order to avoid confusion several terms and then some metaphor issues are provided. This is
then followed by detail on the current state of the art as part of the semi-formalisation of software
visualisation. This semi-formal presentation is based around a series of relationships that are explained in
turn to conclude with respect to future research directions.
Metaphors are an integral part of any software visualisation because of the need to provide a logical
framework in which the mapping between code artefacts and visual representations can be made. There
are situations where the bending of metaphors is appropriate, but for cognitive appreciation of the
representation these tend to be few and far between and used only in situations where usability is
enhanced.
Three-dimensional visualisations enable a whole new world of visualisation styles and representations to
be explored, and the use of an extra dimension can provide (but does not guarantee) powerful
visualisations. It could be said that there is a lack of empirical evidence as to the benefits of these types of
visualisation. Whilst such evidence is in short supply in the various areas of software engineering where
such techniques are used there is much psychological evidence to be found and reused from studies
relating to graphics, colours, navigation and information visualisation.
Software visualisation is a powerful way of viewing the many and varied artefacts that composed together
form a computer system. It also has much power and use in the representations of the complex
interrelationships between these artefacts. Software visualisation is very much concerned with the visual
representation of not only the data items, but also the relationships between them that can be large in
- 7 2 -
Virtual Software in Reality Claire Knight Visualising Software
number, variety and complexity. To add to this problem, each is different in their importance depending
on the task that the visualisation is being used for. This is very much a metaphor and representational
issue, especially when considering three-dimensions and as yet (if there ever will be) there is no "recipe
book" set of steps that can be followed to lead to the creation of appropriate visualisations.
There is a standard form that exists for two-dimensions and has been applied numerous times with slightly
different permutations to many areas of software engineering; node and arcs. These have been used in one
form or another for over twenty years. It is useful to note that a form has such wide ranging applicability
and is used to its potential but the prominence of such displays has hardened the minds of those in
software engineering to accept no other visual form. Is the research issue then, to be able to find some
"node and arc" equivalent in three-dimensions that is capable of being used in many situations?
Abstracting out the common elements of different software visualisations may make it possible to achieve
this and to provide an extensible base for visualisation designers to work from. Whilst this endeavour is a
worthy one, the focus of this work is more concerned with starting to move the software visualisation field
into the present.
5.2 Terms
It is important to make clear the meanings of the terms used. The main terms to consider are abstraction,
metaphor, mapping, representation and visualisation.
Abstraction - Any graphical representation is an abstraction because it is not the original data. The
abstraction level of any visualisation can also be related to the level of the metaphor used, for example,
atlas type maps being used to represent the entire system ranging down to buildings representing methods
and their attributes. Abstractions are more common than is often appreciated; formal symbol systems
right through to graphical user interface editors are all abstractions in their own way.
Metaphor - A logical framework that provides a constrained way of thinking about the graphical subject
matter, whereby assumptions made within the metaphor are still valid for the data that it abstracts from.
The metaphor provides a high level, understandable and identifiable, description of the possible
representation set. An example metaphor is the urbanised development concepts that are used in cityscape
style visualisations.
Representation - Detail of how the various constituents of the software system are shown graphically.
The set of possible representations for any visualisation depends on the metaphor basis of that
visualisation and the number of dimensions available for visual display. The metaphor guides the
representations chosen, for example in a cityscape choosing buildings to represent methods rather than
using a sphere resting on an upturned pyramid. The representations have to be embodiments of something
that occurs normally within the metaphor description.
- 7 3 -
Virtual Software in Reality Claire Knight Visualising Software
Mapping - This describes the relationship between the software constituents to be visualised and their
representation. The logical framework of the metaphor provides the boundaries in which this mapping
relationship needs to operate. I f this restriction is not adhered to, it may well be the case that the
visualisation is no longer considered useful because of the high cognitive overhead that the broken
mapping and/or metaphor impose on the user. An example mapping is the use of Software World
descriptions to describe the visual environment in which the software is being viewed.
Visualisation - The complete view of the data being visualised; the implementation of the metaphor,
mapping and representations into an entire graphical system regardless of the abstraction level currently
being used to view the data. An example of this is an entire visualisation application that is run to
facilitate working with the representations and abstractions created of the software under consideration.
Some of these distinctions may seem obvious, but it is important that some clarification is made in order
to be able to describe, use, and argue about visualisations, and in particular when creating program
comprehension tools.
5.3 Relationships
To illustrate the current position of software visualisation, and then to examine where it ought to be, a
series of relationships will be used. The starting point of this is where the fields of program
comprehension and software maintenance perceive that software visualisation is and, following on from
this, is where this and other very recent research has taken software visualisation. From these positions it
can be shown where the future of the field has to lie to be able to produce usable and powerful software
visualisations that can deal with such issues as scaling to large amounts of information and the evolution
of the underlying data.
Without intending to state the obvious, there are other levels of dimension before the third; one-
dimensional text and two-dimensional flat graphics. Three dimensions can be seen as a flat graphic, so the
definition used here is that three-dimensional is the illusion of reality. In addition to the terms defined
above, each of these levels has various attributes to a greater or lesser degree:
• Navigation, Interaction, and Orientation
• Scalability
• Evolution
• Automation
which, whilst not necessarily directly represented in the relationships to be presented, are influential
factors and must be considered when looking at (software) visualisation.
- 7 4 -
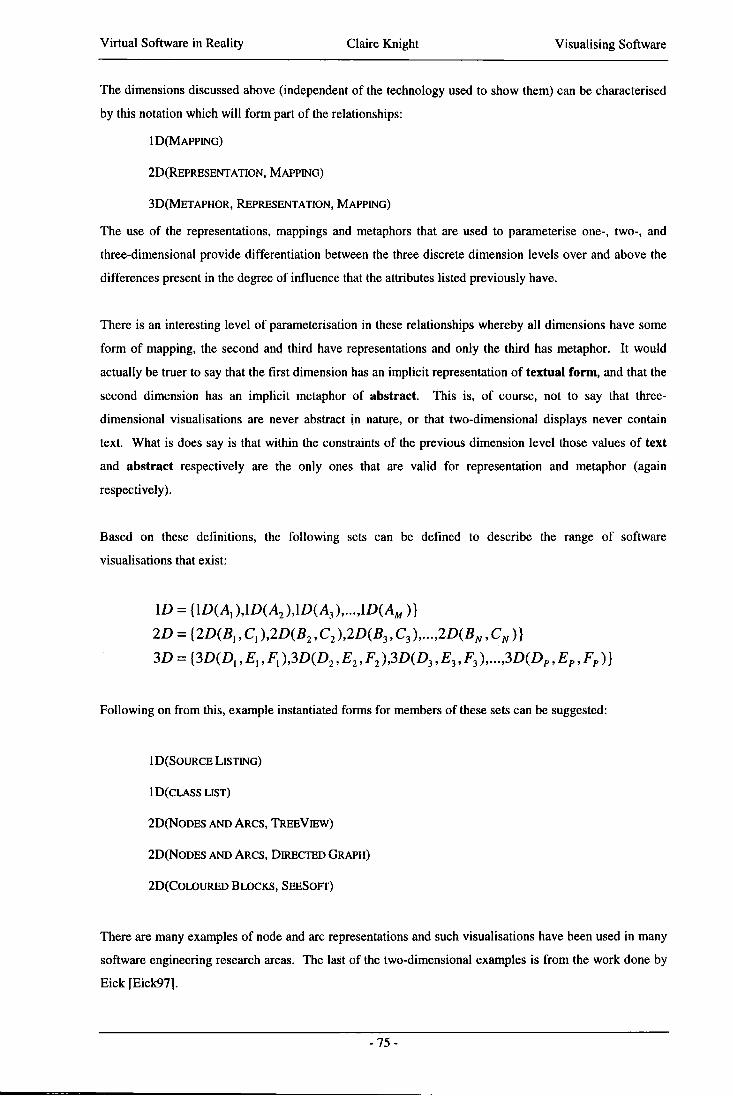
Virtual Software in Reality Claire Knight Visualising Software
The dimensions discussed above (independent of the technology used to show them) can be characterised
by this notation which wil l form part of the relationships:
I D ( M A P P I N G )
2D(REPRESENTATION, MAPPING)
3D(METAPHOR, REPRESENTATION, MAPPING)
The use of the representations, mappings and metaphors that are used to parameterise one-, two-, and
three-dimensional provide differentiation between the three discrete dimension levels over and above the
differences present in the degree of influence that the attributes listed previously have.
There is an interesting level of parameterisation in these relationships whereby all dimensions have some
form of mapping, the second and third have representations and only the third has metaphor. It would
actually be truer to say that the first dimension has an implicit representation of textual form, and that the
second dimension has an implicit metaphor of abstract. This is, of course, not to say that three-
dimensional visualisations are never abstract in nature, or that two-dimensional displays never contain
text. What is does say is that within the constraints of the previous dimension level those values of text
and abstract respectively are the only ones that are valid for representation and metaphor (again
respectively).
Based on these definitions, the following sets can be defined to describe the range of software
visualisations that exist:
ID = {\D(Ai),W(A2),\D(A?l),...,\D(AM)} 2D = {2D(Bl, C, ),2D(B2, C2 ),2D(B3, C3 ),...,2D{BN ,CN)} 3D = {3D(Dl ,El,Fl ),3D(D2 ,E2,F2 ),3D{D, ,E3,F, ),...,3D(DP ,EP,FP)}
Following on from this, example instantiated forms for members of these sets can be suggested:
1D(SOURCE LISTING)
ID(CLASSLIST)
2D(NODES A N D ARCS, TREE V I E W )
2D(NODES A N D ARCS, DIRECTED GRAPH)
2D(COLOURED BLOCKS, SEESOFT)
There are many examples of node and arc representations and such visualisations have been used in many
software engineering research areas. The last of the two-dimensional examples is from the work done by
Eick [Eick97].
- 7 5 -
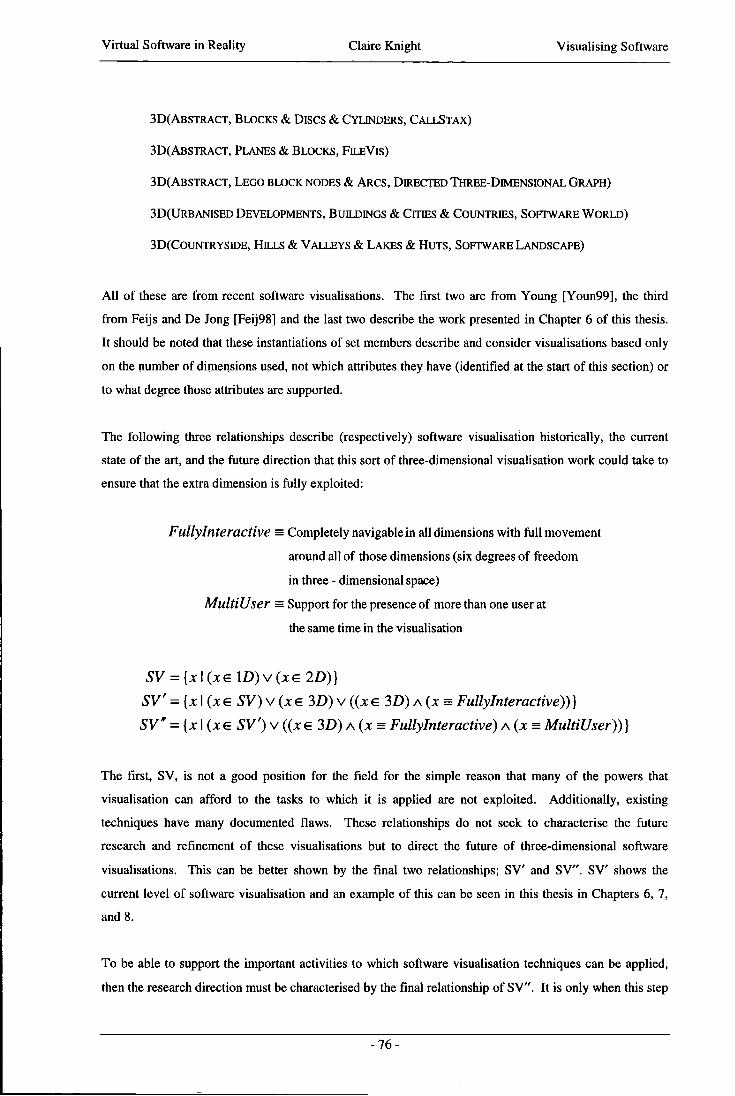
Virtual Software in Reality Claire Knight Visualising Software
3D(ABSTRACT, BLOCKS & Discs & CYLINDERS, CALLSTAX)
3D(ABSTRACT, PLANES & BLOCKS, FILEVIS)
3D(ABSTRACT, LEGO BLOCK NODES & ARCS, DIRECTED THREE-DIMENSIONAL GRAPH)
3D(URBANISED DEVELOPMENTS, BUILDINGS & CITIES & COUNTRIES, SOFTWARE W O R L D )
3D(COUNTRYSIDE, HILLS & VALLEYS & LAKES & HUTS, SOFTWARE LANDSCAPE)
A l l of these are from recent software visualisations. The first two are from Young [Youn99], the third
from Feijs and De Jong [Feij98] and the last two describe the work presented in Chapter 6 of this thesis.
It should be noted that these instantiations of set members describe and consider visualisations based only
on the number of dimensions used, not which attributes they have (identified at the start of this section) or
to what degree those attributes are supported.
The following three relationships describe (respectively) software visualisation historically, the current
state of the art, and the future direction that this sort of three-dimensional visualisation work could take to
ensure that the extra dimension is fully exploited:
Fullylnteractive = Completely navigable in all dimensions with ful l movement
around all of those dimensions (six degrees of freedom
in three - dimensional space)
MultiUser = Support for the presence of more than one user at
the same time in the visualisation
SV = {x\(xe W)v(xe ID)} SV' = {x I (x 6 SV) v (x e 3D) v ((* e 3D) A (X = Fullylnteractive))} SV* = {x\(xe SV') v ((x G 3D) A (X = Fullylnteractive) A(X = Multiuser))}
The first, SV, is not a good position for the field for the simple reason that many of the powers that
visualisation can afford to the tasks to which it is applied are not exploited. Additionally, existing
techniques have many documented flaws. These relationships do not seek to characterise the future
research and refinement of these visualisations but to direct the future of three-dimensional software
visualisations. This can be better shown by the final two relationships; SV' and SV". S V shows the
current level of software visualisation and an example of this can be seen in this thesis in Chapters 6, 7,
and 8.
To be able to support the important activities to which software visualisation techniques can be applied,
then the research direction must be characterised by the final relationship of SV". It is only when this step
- 7 6 -
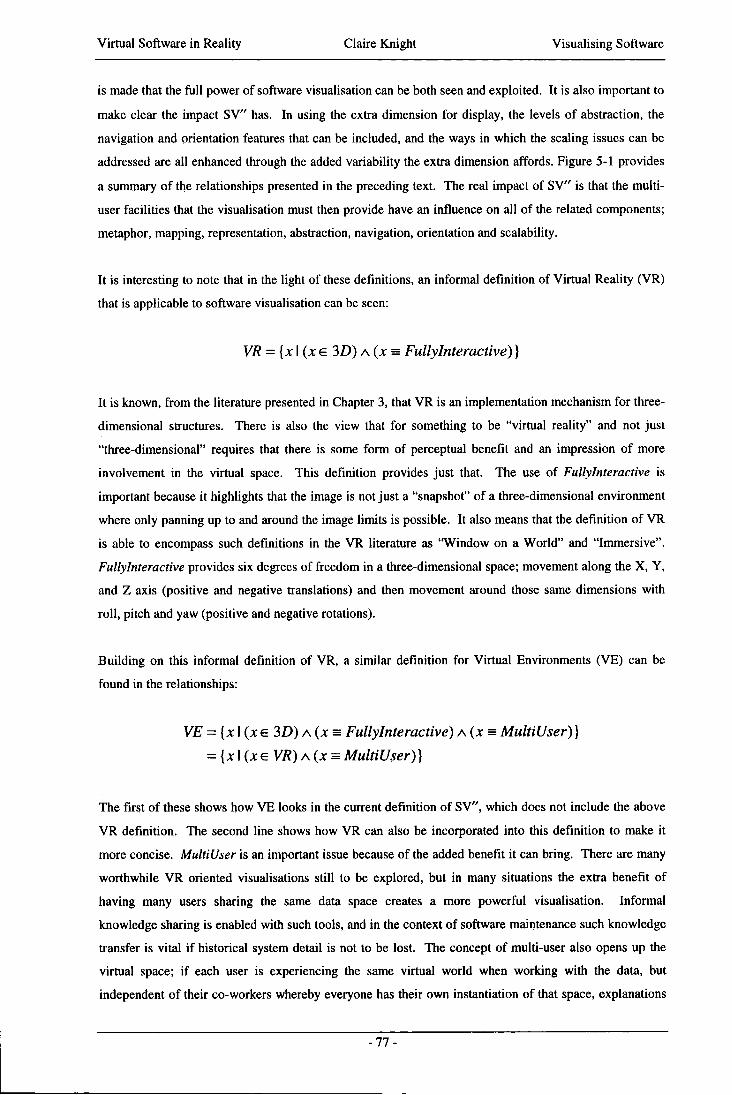
Virtual Software in Reality Claire Knight Visualising Software
is made that the ful l power of software visualisation can be both seen and exploited. It is also important to
make clear the impact SV" has. In using the extra dimension for display, the levels of abstraction, the
navigation and orientation features that can be included, and the ways in which the scaling issues can be
addressed are all enhanced through the added variability the extra dimension affords. Figure 5-1 provides
a summary of the relationships presented in the preceding text. The real impact of SV" is that the multi
user facilities that the visualisation must then provide have an influence on all of the related components;
metaphor, mapping, representation, abstraction, navigation, orientation and scalability.
It is interesting to note that in the light of these definitions, an informal definition of Virtual Reality (VR)
that is applicable to software visualisation can be seen:
VR = {x I (xs 3D) A(X = Fullylnteractive)}
It is known, from the literature presented in Chapter 3, that VR is an implementation mechanism for three-
dimensional structures. There is also the view that for something to be "virtual reality" and not just
"three-dimensional" requires that there is some form of perceptual benefit and an impression of more
involvement in the virtual space. This definition provides just that. The use of Fullylnteractive is
important because it highlights that the image is not just a "snapshot" of a three-dimensional environment
where only panning up to and around the image limits is possible. It also means that the definition of VR
is able to encompass such definitions in the VR literature as "Window on a World" and "Immersive".
Fullylnteractive provides six degrees of freedom in a three-dimensional space; movement along the X, Y,
and Z axis (positive and negative translations) and then movement around those same dimensions with
roll, pitch and yaw (positive and negative rotations).
Building on this informal definition of VR, a similar definition for Virtual Environments (VE) can be
found in the relationships:
VE = {x\(xe 3D) A (X = Fullylnteractive) A (JC = Multiuser)} = {x I (jce VR) A(X = Multiuser)}
The first of these shows how VE looks in the current definition of SV", which does not include the above
VR definition. The second line shows how VR can also be incorporated into this definition to make it
more concise. Multiuser is an important issue because of the added benefit it can bring. There are many
worthwhile VR oriented visualisations still to be explored, but in many situations the extra benefit of
having many users sharing the same data space creates a more powerful visualisation. Informal
knowledge sharing is enabled with such tools, and in the context of software maintenance such knowledge
transfer is vital i f historical system detail is not to be lost. The concept of multi-user also opens up the
virtual space; i f each user is experiencing the same virtual world when working with the data, but
independent of their co-workers whereby everyone has their own instantiation of that space, explanations
- 7 7 -
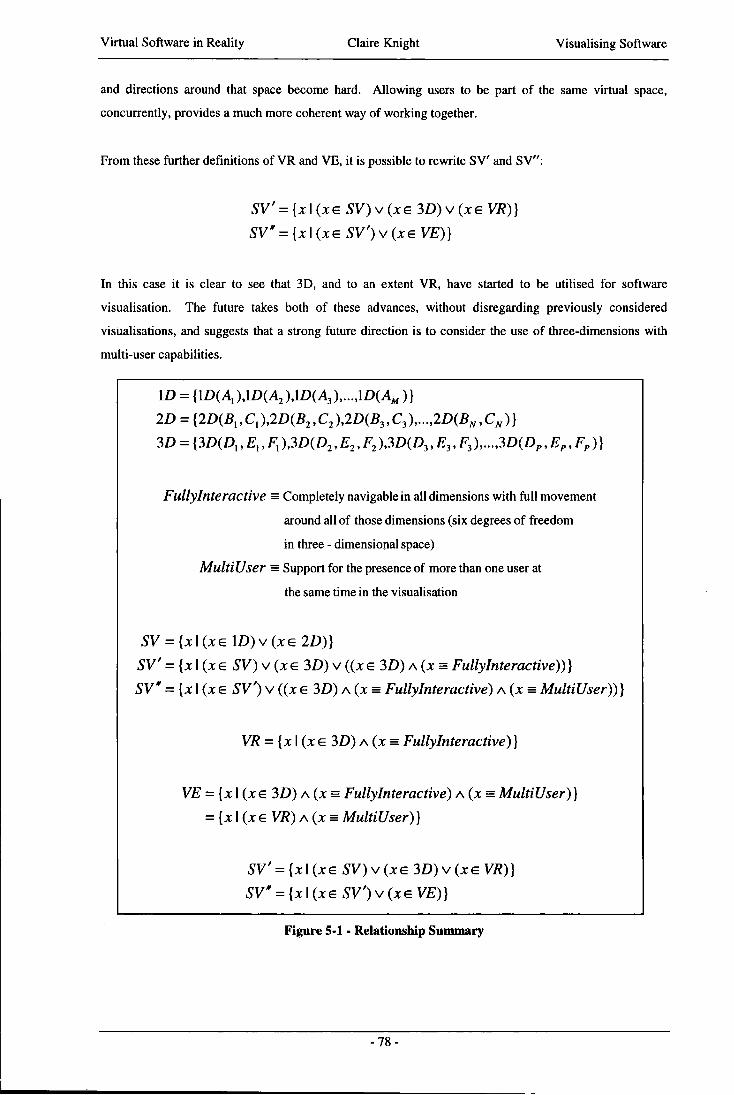
Virtual Software in Reality Claire Knight Visualising Software
and directions around that space become hard. Allowing users to be part of the same virtual space,
concurrently, provides a much more coherent way of working together.
From these further definitions of VR and VE, it is possible to rewrite S V and SV":
SV' = {x I (JC e SV) v (JC e 3D) v (JC e VR)} SV" = {x\(xe SV')v(xe VE)}
In this case it is clear to see that 3D, and to an extent VR, have started to be utilised for software
visualisation. The future takes both of these advances, without disregarding previously considered
visualisations, and suggests that a strong future direction is to consider the use of three-dimensions with
multi-user capabilities.
ID = {W(Al),lD(A2),lD(A3),...,lD(AM)} 2D = {2D{BX, C, \2D{B2, C2 ),2D(B3, C3 ),...,2D(BN ,CN)} 3D = {3D(D,, , F, ),3D(D2 ,E2,F2 ),3D(D3 ,E3,F} ),...,3D(DP ,EP,FP)}
Fullylnteractive = Completely navigable in all dimensions with ful l movement
around all of those dimensions (six degrees of freedom
in three - dimensional space)
MultiUser = Support for the presence of more than one user at
the same time in the visualisation
SV = {^l( jce W)v(xe ID)} SV' = {x 1 (x e SV) v (x e 3D) v ((x e 3D) A (JC = Fullylnteractive))} SV" = {x 1 (x e SV') v ((JC e 3D) A(X = Fullylnteractive) A(X = Multiuser))}
VR = {x 1 (JCe 3D) A (x = Fullylnteractive)}
VE - {JC 1 (JCS 3D) A (JC = Fullylnteractive) A (JC = Multiuser)} = { JC 1 (x e VR) A(X = Multiuser)}
SV' = {JC 1 (JC e SV) v (JC e 3D) v (JC e VR)} SV" = {x\(xeSV')v(xeVE)}
Figure 5-1 - Relationship Summary
- 7 8 -
Virtual Software in Reality Claire Knight Visualising Software
This is an area where much research is still to be done but it is one of the main ways forward for three-
dimensional software visualisation. It is only through the power and intelligence amplification enhancing
features that such visualisations provide that software visualisation can be used to address many of the
current shortfalls with existing visualisation systems.
5.4 Relationship Issues
The future benefits of three-dimensional visualisations stem from further development and research that
needs to be carried out in this area. There are several key areas, some of which can be addressed by the
Software World visualisation, which will be presented in Chapter 6, Section 6.2. The real problem is that
many systems based around graphics and visualisations (regardless of the number of dimensions) fail to
consider these points and hence they are still very much open research questions. Feijs and De Jong
[Feij98] addressed the use of visualisation techniques in three-dimensions for viewing software
architectures and relationships. Whilst this paper acknowledged that they have more research to do, the
work does not seem to address many of the issues and limitations of the use of three-dimensions. The
creation of their visualisations relies on nodes and arcs, but using an extra dimension. This does provide a
greater degree of flexibility than the two-dimensional form of such structures, but again does not scale or
evolve well; two very important issues. Some isolated research projects have considered a few of the
issues but they are still very new to program comprehension systems that purport to make use of effective
visual displays.
5.4.1 Evolution
The only effective judge as to whether a visualisation can deal with evolution is to evolve the code and
update the visualisation to reflect the code changes. Evolution is an important issue with visualisations of
program code, since software systems are known to change in a variety of ways and for a variety of
reasons. Once a visualisation has been generated it is useful for that visualisation to evolve as the
underlying data evolves and to reflect the changes visually. Implementation issues of this aside, it is
important for the visualisation representations and metaphor to be able to support this; i f it cannot happen
logically within the constrained framework that the metaphor provides, it might as well not happen at all.
This is because the changes involved visually would cause too great a cognitive effort on the part of the
user to be beneficial. In these cases (a) it would be better to generate the visualisation from scratch and
(b) question whether the visualisation tool is of use for the work tasks of the user. It may be that the
answer to (b) is that yes it is useful, even with a complete regeneration, since there is adequate relearning
time but this cannot be assumed.
- 7 9 -
Virtual Software in Reality Claire Knight Visualising Software
5.4.2 Scalability
Scalability of visualisations is related to the ability of a visualisation to evolve. Again, the only way to
answer the question of how scalable a visualisation is requires it to be tested with varying amounts of
source data. Scaling could be considered to be an evolution of the visualisation, but since it depends each
time on the base code of the system, it is more of an issue with whether an initial development algorithm
can handle a wide range of data sizes. A hard problem for designers of visualisations is that, on the
whole, visualisations must be created to accommodate a very wide range of data. Essentially the
visualisation has to be able to deal with one to an infinite number of items. Keeping this in mind during
the development of the visualisations should enable them to scale better. It may be that some smaller
visualisations developed for a very specific need, where the data is known to be limited, do not have to
consider such scaling issues and this is quite acceptable. Just as long as when designing visualisations that
can be applied to data that is known to vary in size and content this fact is borne in mind.
5.4.3 Navigation and Interaction
Navigation is important because it affects the usability of the visualisation. The visualisation should be
designed and structured with navigation in mind. I f navigational features are added as an afterthought it
wil l then be hard to add the necessary paths and beacons. As Young and Munro [Youn98] write
"Well structured data terrain should also result in a more understandable layout and easier navigation ".
There are also guidelines for navigation and orientation that can be taken from city planning textbooks
which indicate ways in which humans orient themselves in three-dimensional space.
Tied into navigation issues is the way in which any user of the visualisation is able to interact with it; to
move around the landscape and to find the information they require must be as intuitive as possible to
make people view visualisations as useful tools. Unfortunately for designers of visualisations all users
have different wants and needs where interaction with computers is concerned. For this reason the more
flexibility the system offers, the better. The ability for the user to have a degree of configuration is also
likely to lead to the acceptance and use of the visualisation system.
5.4.4 Automation
The visualisation should be able to be generated from the source files with minimal intervention. A
configuration file of preferences is acceptable because the graphics are still created in a fully automatic
- 8 0 -
Virtual Software in Reality Claire Knight Visualising Software
manner. User generation of visualisations may allow tweaking for that user but the resulting visualisation
is then only really suitable for that person. The visualisation is then not really applicable to any
visualisation aiming for consistent appearances between versions (releases of the code). It also prevents a
visualisation system being used as a common frame of reference for discussion. In the creation of multi
user visualisation environments the freedom for users to create their own landscapes would also
completely destroy the notion of having a shared workspace - all users would have their own
environments and each one (apart from their own) would be unfamiliar to everyone else
5.5 General Issues
In addition to the key areas identified above and then addressed by the Software World visualisation
(Chapter 6, Section 6.2) there are also some more general issues. These relate more closely to the
development of three-dimensional visualisation products in a wider sense and tend to be heavily
dependent on the purpose to which the visualisation will be put. These are also open research issues and
although are new to program comprehension systems in the context of three-dimensions, they are areas
that have been considered to some extent when using two-dimensional visual displays for program
comprehension.
5.5.1 Correlation
Correlation of information can, in part, be done by the visualisation. Cross-referencing and relating
visualisation components to the original source code or documentation file is only a data processing task.
Hypertext is a good way of achieving this linkage of information (integration). This correlation of
information within the visualisation to the various external data sources (which may have been used in the
construction of the visualisation) is important because it allows the user to access the required data at a
level of abstraction suited to their current needs. Being able to view the actual source code of a method
(for example) will ultimately be necessary for implementing changes, and being able to correlate the
visual cues with the underlying code is important.
5.5.2 Visual Complexity
Visual complexity is an issue that can be considered to be heavily subjective, although it is often
discussed. An example is the often quoted 7±2 boxes in a nodes and arcs style diagram. The situation in
a three-dimensional virtual environment is a slightly different issue, especially i f the representations used
are based on a real world metaphor of some description. In "natural" scenes the brain and visual
-81 -
Virtual Software in Reality Claire Knight Visualising Software
processing of humans is very good at filtering extraneous information, whilst providing overall scene
information and the detail of the item being focused on.
The issue of low visual complexity (in three-dimensions) being a trade off against the complexity of the
representations used is a case of simplification where it is hard, i f not impossible, to make such a
simplification. There are several questions that remain unanswered in such discussions. It is important to
ask at what level the trade off is made. It can be suggested that it depends on the scoping, level of
abstraction and the "zoom" level of the visualisation. It is also important to consider what is meant by low
visual complexity in three-dimensions. This can be very user dependent, but certainly all humans have the
power of visual filtering. Without it they would be immediately overwhelmed with information the
moment they opened their eyes. I f the data demands (apparently) complex representations for ease of
long range and also close identification and for comparison then surely this must be considered more
important. Or it could suggest that the metaphor used to guide the representations is either not powerful
enough or not adequate for the task in hand.
There are also several factors that uniquely relate to how a user or evaluator judges whether a scene is of
low visual complexity.
1. Whether or not three-dimensional visualisations are considered acceptable forms of visualisation.
2. Visual tolerance.
3. Experience - knowledge base built up through every experience that has happened to that user.
4. Possible prejudices (in this case relating to colour, imagery and metaphor) instilled by parents, friends
and experiences. Prejudices can help shape the "knowledge base".
It may actually be the case that the scene requires visual complexity (from a design and construction
viewpoint) in order to appear ordinary and non-complex to the user. Since humans filter everyday
information then a scene missing this information becomes unusual, more visually complex and hence
requires a greater effort to understand and navigate in.
5.5.3 Metaphor
A l l software visualisation systems make use, in some way or another, of a metaphor that acts as a mapping
between the visual components used in the realisation of the visualisation and the underlying code. The
design of this metaphor can greatly influence the usability of the visualisation. It is also true that the code
being represented (or the data for information visualisation) can influence the metaphor; it may be that
only certain metaphors are appropriate for certain data sets.
An example of this is in the visualisation of Java source code. Java code (by the design of the language)
can be classified in a strict hierarchy of packages, classes and methods. Should a metaphor be found that
- 8 2 -
Virtual Software in Reality Claire Knight Visualising Software
is suitable for this language it cannot immediately be classified as suitable for all (for example) object
oriented languages. C++ provides an immediate counter example in that code in a C++ system can be
outside of any class thus breaking the hierarchical arrangement.
Not only does the data set being visualised influence the visualisation based on whether or not there are
already tangible representations of this data in the real world, but the form and classification of that data
can also affect it. With source code the visualisation is trying to represent something that is inherently
intangible so that many metaphors are appropriate. Whilst this free reign with representations exists, the
underlying structure of the data, and the purpose to which the visualisation will be used, both affect what
could be considered as suitable solutions to the visualisation of that data.
5.6 Summary
This chapter places the context of this thesis and has provided a glimpse of the future of research in
software visualisation. It has also indicated areas where research should be focused. One of the most
important issues relates to size. Software is large and complex; therefore any visualisation must be able to
deal with this in a comprehensible way, and reducing the data to one pixel in size only works for overview
and summary. It is important to consider the range of views required when trying to confront the scaling
issue. The hardest problem in visualising anything is that, theoretically, the visualisation has to be able to
deal with the range of items from one to infinity. This massive range means that automatic generation and
layout algorithms (both for two and three-dimensional visualisations) are hard problems. It also means
that the visualisations need to be defined with this in mind; or to provide ways of dealing with very large
numbers of items and indicating this fact to the user.
This problem of scalability is not the only question that faces those working with visualisations. Another
that is of great importance for software maintenance is that of software evolution. The code underlying
any software system goes through various revisions over time and i f it is to remain useful and used the
visualisation must move with the code. This then brings in a host of issues relating to how the
visualisation changes over time or is regenerated, and how it shows this to the user of the system.
The direct research issues to move the software visualisation field forward, to be able to successfully cope
with the increased demands of today's software, have been introduced and presented together with a series
of relationships that can be used to characterise the research. The ability to enhance a users own cognition
is a powerful notion, and one that can lead to the creation and exploitation of influential tools. This in
turn can benefit the work being carried out with the tool and should this be applied to software
visualisation tools the field then has the capacity to create something which becomes an integral part of
the software process.
- 8 3 -
Virtual Software in Reality
Chapter Six - Reality; Mappings and Metaphors
Virtual Software in Reality Claire Knight Reality; Mappings and Metaphors
6.1 Introduction
This chapter presents two visualisations that attempt to address some of the research issues identified in
the previous chapter. Complete descriptions of these visualisations and their mappings are presented
along with discussion and example views to justify and illustrate various facets of the metaphors. The two
metaphors presented are based on real-world metaphors rather than abstract geometric shapes. The
reasoning behind this is the desire to create a virtual visualisation environment. A first step towards
achieving this requires that the environment is suitably "normal" for acceptance. As technology and an
awareness of what this enables and permits becomes more prevalent then a greater number of virtual
environments will be considered acceptable and usable. This in turn wil l provide much more freedom of
choice in this aspect for designers and creators of such environments. To present a usable and cognitively
coherent interface to the user prompted the selection of the metaphors that will be introduced in the two
visualisations later in this chapter.
The selection and use of metaphors is not without controversy, not least because the considered suitability
of any metaphor is a very subjective issue. These two metaphors have been chosen (the mappings will be
justified where they are presented) because they are general and represent environments of which most
westernised humans wil l be familiar with, at least to some degree. As with all representations and
interfaces, the level of familiarity often affects how much at ease the user is with them. This obviously
means that for any visualisation and hence metaphor and mapping, there is a period of time whilst that
mapping is learnt and understood but after that time the nuances and even irregularities of the metaphor
become as common to the user as any other interface they use.
This chapter first presents some language issues, which provides a context for some of the mapping
decisions that follow in the two visualisations. Then the Software World visualisation is presented.
Following this the Software Landscape visualisation is described. A discussion of some of the features of
this particular mapping is presented, to alleviate the problem of a perceived higher level of domain
knowledge. A summary of all of this ties together the important issues at the end of the chapter. For both
visualisations, general issues of scaling and automation are discussed where appropriate in the mapping
and in sections immediately following the mappings.
6.1.1 Language Issues
These visualisations can theoretically be used to visualise any modern object-oriented or procedural high
level language although in practise this does not work due to differences in the structure of languages such
as C and C++. This work will focus on the visualisation of Java code (release 1.2, known as Java 2). The
items of interest in this language are:
• files
- 8 5 -
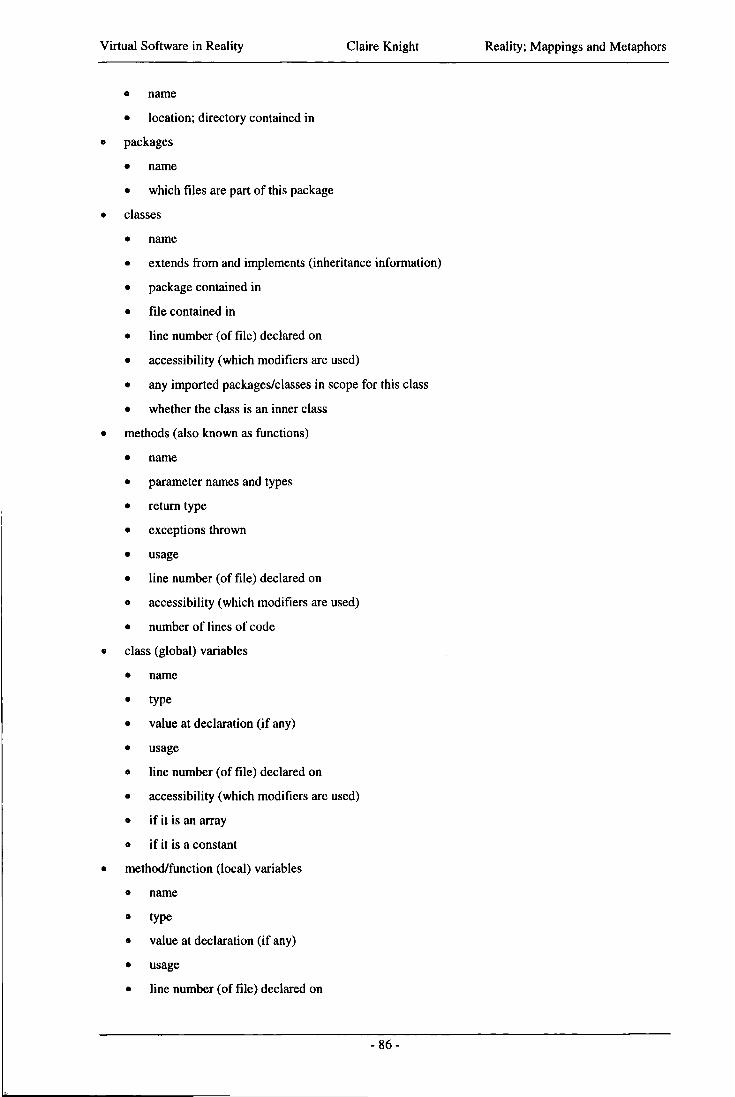
Virtual Software in Reality Claire Knight Reality; Mappings and Metaphors
• name
• location; directory contained in
» packages
• name
• which files are part of this package
• classes
• name
• extends from and implements (inheritance information)
• package contained in
• file contained in
• line number (of file) declared on
• accessibility (which modifiers are used)
• any imported packages/classes in scope for this class
• whether the class is an inner class
• methods (also known as functions)
• name
• parameter names and types
• return type
• exceptions thrown
» usage
• line number (of file) declared on
• accessibility (which modifiers are used)
• number of lines of code
• class (global) variables
• name
• type
• value at declaration (if any)
• usage
• line number (of file) declared on
• accessibility (which modifiers are used)
• i f it is an array
• i f it is a constant
• method/function (local) variables
• name
• type
• value at declaration (if any)
• usage
• line number (of file) declared on
-86 -
Virtual Software in Reality Claire Knight Reality; Mappings and Metaphors
• accessibility (which modifiers are used)
• i f it is an array
• i f it is a constant
• scope within the method/function
These items of interest then form the basis of the artefacts and relations that will be visualised. There is
also a hierarchy implicitly imposed on this information because of the design of the Java language. It is
not possible to write code outside of packages or classes (code with no designated package becomes part
of what Java knows as the default package) so a complete ordering of information exists. Packages
contain classes and classes contain methods - code has to exist within this structure rather than as any
independent entity.
This information is essentially a cross reference database and to provide easier navigation, information
retrieval and ultimately understanding, these relations may be shown in the visualisation as a form of
hypertext link, although not as a piece of underlined text as is common in many two dimensional browsing
tools. A l l of the items of interest can be obtained from a static analysis of the source code. The aim is to
get a coherent visualisation system using static facts and then extending and expanding to incorporate any
dynamic information felt necessary to support the comprehension tasks carried out within the
visualisations.
6.2 Software World
This section describes the principles and mappings of the city and world metaphor (known as Software
World) for visualising software. The abstraction levels and representations used are also discussed. Many
of the ideas and concepts used will be familiar to those who have worked with Virtual Reality (VR) and
advanced human-computer interfaces. The work also draws on science fiction ideas and on the facilities
offered in the ever-increasing range of three-dimensional games available for the home PC market.
The information presented here is the ideal, theoretical, visualisation. The implementation of this system
as one complete, automatic and fully functioning entity is not considered. This visualisation work is
carried out with the aim of representing Java 2 source code as an aid to program comprehension.
-87-
Virtual Software in Reality Claire Knight Reality; Mappings and Metaphors
6.2.1 Overview Description
For ease of implementation (and user navigation) the world will be considered to be based on a flat plain
rather than a sphere. This also allows the use of Euclidean Geometry, an accepted standard for
architectural (andVR) purposes.
The world has different levels, which can be briefly described as
• World; flattened, overview picture, atlas style, not necessarily countries as would be known in
standard geography but shows different elements of the visualisation at a very high level and the
relationships between those elements.
• Country; each element shown in the world view is a country. It provides a way of splitting the items
in the world down one level without the detail that is provided by the next level down.
• City; shown within countries, as the next level of granularity. These cities are composed of sub-areas
but try to ease the navigation burden through the use of standard urban navigational aids (covered in
more detail below).
• Districts; there can be several of these in a city, the number depending on the information to be
represented in the visualisation. They group together related aspects of the software and provide
groupings to be used when moving from a higher level of abstraction to a more detailed level.
• Streets/Buildings/Gardens/Monuments; these show the detail of the visualisation and provide the next
level of abstraction down from the districts. They also act as legibility features and landmarks of the
city.
• Inside Buildings/Gardens; this is the finest level of detail, where detailed direct mappings from the
code to the visualisation can be made.
Evolution of the software (and hence the visualisation) is supported through the use of the real-world city
views. When an area of the visualisation is removed it is retained for a number of future software releases
in the visualisation. This is done for continuity, and in case it is reinstated at any close future point. This
is shown in the cities through the use of graphics such as "Demolition work", and the buildings can be
degraded in graphics quality to emphasise the point. The opposite, addition of components, is also
supported. For the first release the new part of the visualisation can be shown with scaffolding or new
signs around the buildings. After an appropriate number of releases the visualisation is updated to show a
standard building (for new pieces of code) or the buildings are removed (deleted pieces of code). These
cut-off points can be configured at the visualisation generation time, or later, although i f changed later
deleted items cannot be recovered i f they should still be shown as being demolished. Lower level
evolution of the code is also important and needs to be considered from a graphics viewpoint.
-88-
Virtual Software in Reality Claire Knight Reality; Mappings and Metaphors
6.2.2 Features of the Visualisation
To create the visualisation like a real world, having to arrange and catch aeroplanes between world
elements for example would be unfeasible from a usability viewpoint. For this reason several "magic"
features are included in the visualisation.
The first of these is teleport, which is where a user immediately moves from one place to another within
the visualisation and is not able to see the route taken. This sort of thing is useful from the world view to
a country where the relationship can be seen from the atlas-type display. It is also useful when a user
chooses to visit an area of the visualisation previously visited, and hence already has an idea of the
relationship of that piece to the rest of the visualisation. This sort of travel, known collectively as zero
time loss travel, is useful in the situations mentioned but the one drawback is that there is a loss of
orientation and landscape features during travel. Whilst this may not be necessary most of the time, when
trying to orient themselves in an environment the user may need to see this extra information, although
building up a model of the environment based on teleport "jumps" is quite feasible.
Ways of travelling through the visualisation environment can be classed as "magic" features because of
their use in comparison to the real world environment of countries and cities. Walking is the standard
mechanism for moving from place to place in the buildings and streets (for short distances) and this is not
a "magic" feature. This is because to travel down a level from a first floor room, out into the street, cross
the road, and enter the foyer of another building would require the user to "experience" such sensory
(audio and visual) input. Magic features are those features where reality differs from the experience in the
virtual world. There are transport mechanisms provided in the virtual world that allow easy travelling
between countries and areas. A subway rail system links areas, and this can be configured to "jump" from
one area to the next without the user having to "travel" through the countryside in between. To travel
logically larger distances (such as from country to country from cities) then aeroplanes are used. Again
these exhibit magic features in not making the user wait for eight hours for the journey to complete! An
additional benefit of these methods of transport is that the terminals where they can be "boarded" provide
another area where other users may be, and this supports unplanned interaction between users. Very often
it is in these situations that the most useful information exchanges take place.
The use of aeroplanes and trains allows the user to move between abstraction levels transparently, because
at the destination they will be at the same level as when they started their journey. It is possible to move
between abstraction levels and to then remain at the new abstraction level. In order to maintain
consistency in the metaphor this is done through the use of maps, ranging from atlas level to city maps
showing districts, and primary streets/landmarks.
The use of the maps not only provides a visual indication of the proximity of one entity to another, but
also a way to travel from one to another. For example, at an airport, the use of the atlas view to choose
the destination. This is done by selecting another country and then using a more detailed map to select the
-89 -
Virtual Software in Reality Claire Knight Reality; Mappings and Metaphors
destination city. The choice of using a two dimensional display of a potentially infinite landscape has
been made for two reasons. The first is that this is a familiar method of navigation and orientation for
humans. The second is that (apart from the world view) the maps only show a limited amount of
information, taking the centre of the map to be where the user is and then drawing the immediate area
around them. For longer travel the city to city (or country to country) travel is done at a higher level and
then locating the precise building required can be done with a partial map.
User movement within buildings can be easily done through lifts alone - since there are no fire regulations
about alternative exits being available! The benefit of using lifts is that the user does not have to walk up
and down many flights of stairs to get to where they want to be. They can enter a l if t and have quicker
access to other floors, especially i f those floors are supposed to be twenty away from their current floor.
An additional benefit of lifts is that they can be used to prevent access to particular floors i f the particular
visualisation dictates this. This can be necessary for several reasons, such as the code has been removed
or that the user does not have authorisation to examine that code.
6.2.3 Additional Information Display in the Visualisation
A common problem in three-dimensional environments is the display of information that has no
meaningful form in three-dimensions such as text or two-dimensional imagery. The visualisation system
gets around this through the use of a piece of paper that the user carries with them. This piece of paper
has the ability to display many pieces of information based on context and/or the users' requests. It solves
the display problem because the paper surface is used to display the necessary information, rather than
leave it "hanging" in space.
An implementation feature should be to be able to make the focus entirely the paper. This allows
(mentally as well as in the implementation) for the paper to rotate to face full on to the camera rather than
being held by the user in the virtual environment. Once this rotation has taken place, then the interaction
can move to being exclusively with the paper and its contents until such time as the user chooses to move
their focus back to the virtual environment. Some suitable representation above or around the user's
representation in the virtual environment is necessary here so that other users of the visualisation are
aware that the user is not concerned at the moment with the visualisation environment as a virtual space.
There is some use of magic features with the paper. In reality it is not possible to run an animation (for
example) on a single piece of paper, but again for usability reasons this is permissible with this sheet of
paper. It is also the case that "real" paper doesn't have icons that can be used to force it to behave in
some way or to interact with its contents but both of there are vital to the use of this mechanism in the
visualisation environment.
-90-
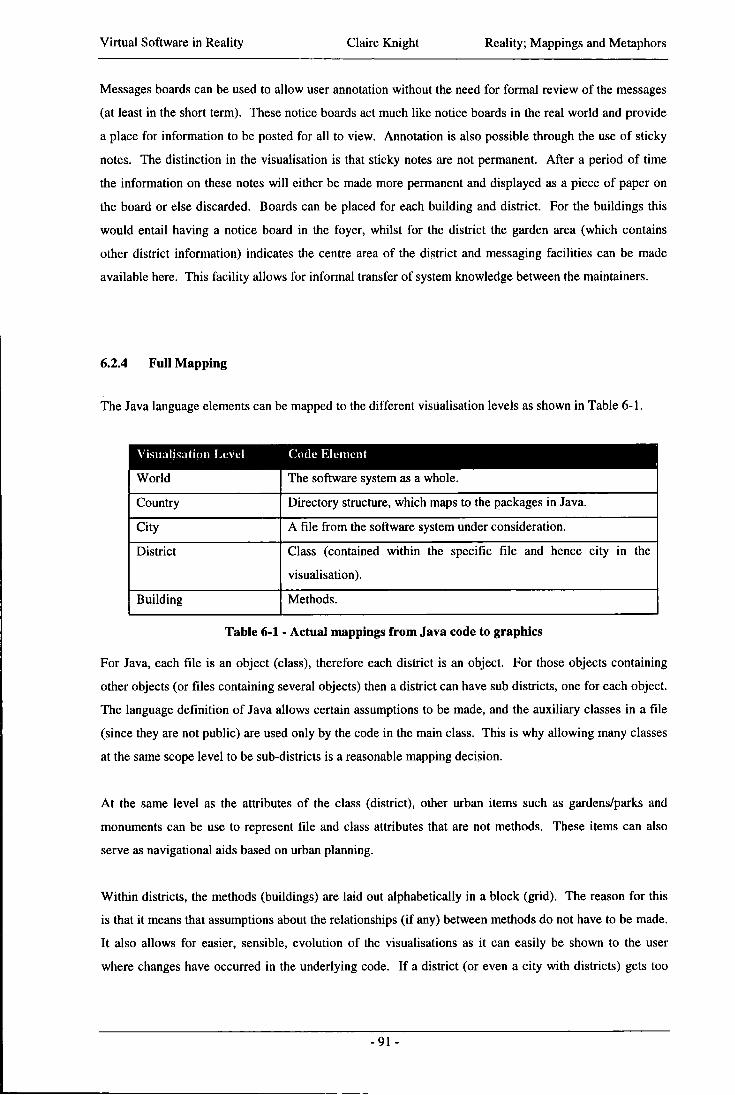
Virtual Software in Reality Claire Knight Reality; Mappings and Metaphors
Messages boards can be used to allow user annotation without the need for formal review of the messages
(at least in the short term). These notice boards act much like notice boards in the real world and provide
a place for information to be posted for all to view. Annotation is also possible through the use of sticky
notes. The distinction in the visualisation is that sticky notes are not permanent. After a period of time
the information on these notes will either be made more permanent and displayed as a piece of paper on
the board or else discarded. Boards can be placed for each building and district. For the buildings this
would entail having a notice board in the foyer, whilst for the district the garden area (which contains
other district information) indicates the centre area of the district and messaging facilities can be made
available here. This facility allows for informal transfer of system knowledge between the maintainers.
6.2.4 Full Mapping
The Java language elements can be mapped to the different visualisation levels as shown in Table 6-1.
Visualisation Level Code Element
World The software system as a whole.
Country Directory structure, which maps to the packages in Java.
City A file from the software system under consideration.
District Class (contained within the specific file and hence city in the
visualisation).
Building Methods.
Table 6-1 - Actual mappings from Java code to graphics
For Java, each file is an object (class), therefore each district is an object. For those objects containing
other objects (or files containing several objects) then a district can have sub districts, one for each object.
The language definition of Java allows certain assumptions to be made, and the auxiliary classes in a file
(since they are not public) are used only by the code in the main class. This is why allowing many classes
at the same scope level to be sub-districts is a reasonable mapping decision.
At the same level as the attributes of the class (district), other urban items such as gardens/parks and
monuments can be use to represent file and class attributes that are not methods. These items can also
serve as navigational aids based on urban planning.
Within districts, the methods (buildings) are laid out alphabetically in a block (grid). The reason for this
is that it means that assumptions about the relationships (if any) between methods do not have to be made.
It also allows for easier, sensible, evolution of the visualisations as it can easily be shown to the user
where changes have occurred in the underlying code. I f a district (or even a city with districts) gets too
-91 -
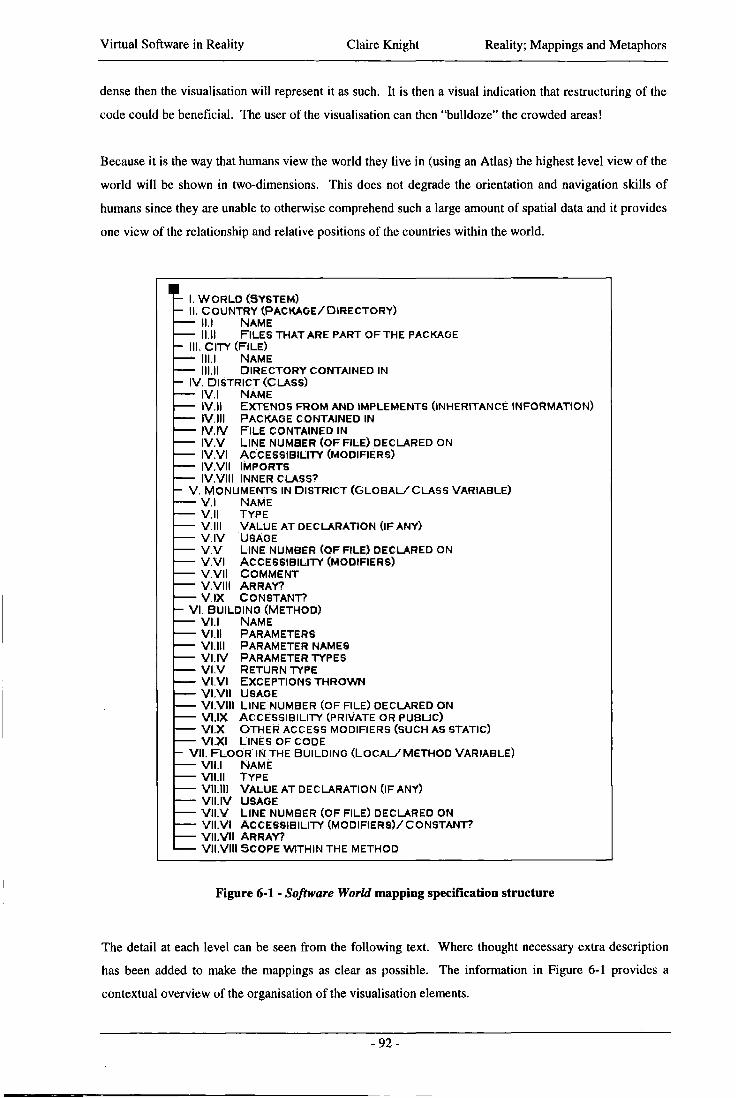
Virtual Software in Reality Claire Knight Reality; Mappings and Metaphors
dense then the visualisation will represent it as such. It is then a visual indication that restructuring of the
code could be beneficial. The user of the visualisation can then "bulldoze" the crowded areas!
Because it is the way that humans view the world they live in (using an Atlas) the highest level view of the
world will be shown in two-dimensions. This does not degrade the orientation and navigation skills of
humans since they are unable to otherwise comprehend such a large amount of spatial data and it provides
one view of the relationship and relative positions of the countries within the world.
• - 1. W O R L D (SYSTEM) - I I . C O U N T R Y ( P A C K A G E / D I R E C T O R Y )
Il l N A M E - — ll.ll F I L E S THAT ARE PART O F T H E PACKAGE - III. CITY (FILE) — - lll.l N A M E
III.II DIRECTORY CONTAINED IN - IV. DISTRICT (CLASS) — IV.I N A M E
I V . I I EXTENDS FROM AND IMPLEMENTS (INHERITANCE INFORMATION) IV. I I I PACKAGE CONTAINED IN I V . I V F I L E CONTAINED IN I V . V L I N E NUMBER ( O F FILE) DECLARED ON I V . V I ACCESSIBILITY (MODIFIERS) I V . V I I IMPORTS I V . V I I I INNER CLASS?
- V . MONUMENTS IN DISTRICT ( G L O B A L / C L A S S VARIABLE) V . I N A M E V.ll TYPE V.lll V A L U E AT DECLARATION ( IF ANY) V . I V USAGE V . V LINE NUMBER (OF FILE) DECLARED ON V . V I ACCESSIBILITY (MODIFIERS) V . V I I C O M M E N T V . V I I I ARRAY? V I X CONSTANT?
- V I . BUILDING (METHOD) Vl.l N A M E V I . I I PARAMETERS VI.Ill PARAMETER NAMES V I . I V PARAM ETE R TYP E S
— vi.v RETURN TYPE V I . V I EXCEPTIONS T H R O W N V I . V I I USAGE V I . V I I I L INE NUMBER (OF FILE) DECLARED ON VI. IX ACCESSIBILITY (PRIVATE OR PUBLIC) V I . X O T H E R ACCESS MODIFIERS (SUCH AS STATIC) V I . X I LINES O F CODE
- V I I . F L O O R IN THE BUILDING ( L O C A L / M E T H O D VARIABLE) V I I I N A M E Vll.ll TYPE Vll.lll V A L U E AT DECLARATION ( IF ANY) V I I . I V USAGE V I I . V LINE NUMBER ( O F FILE) DECLARED O N V I I . V I ACCESSIBILITY (MODIFIERS) /CONSTANT? V I I . V I I ARRAY?
1 V I I . V I I I SCOPE W I T H I N THE METHOD
Figure 6-1 - Software World mapping specification structure
The detail at each level can be seen from the following text. Where thought necessary extra description
has been added to make the mappings as clear as possible. The information in Figure 6-1 provides a
contextual overview of the organisation of the visualisation elements.
- 9 2 -
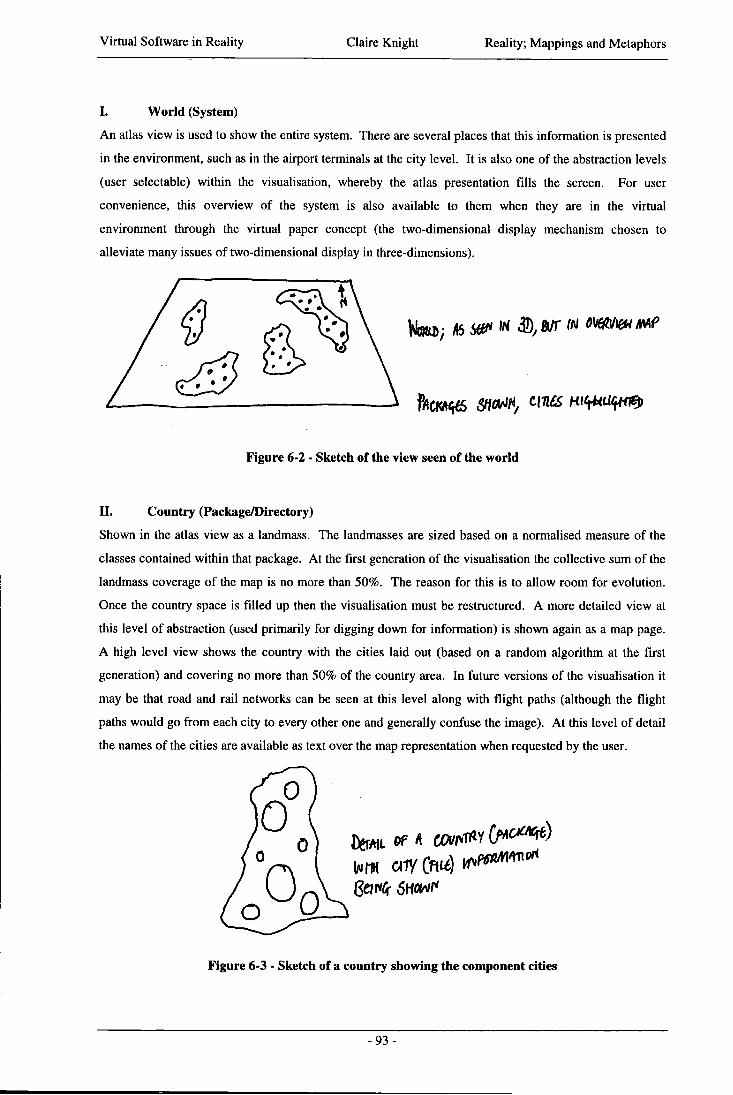
Virtual Software in Reality Claire Knight Reality; Mappings and Metaphors
I . World (System)
An atlas view is used to show the entire system. There are several places that this information is presented
in the environment, such as in the airport terminals at the city level. It is also one of the abstraction levels
(user selectable) within the visualisation, whereby the atlas presentation fills the screen. For user
convenience, this overview of the system is also available to them when they are in the virtual
environment through the virtual paper concept (the two-dimensional display mechanism chosen to
alleviate many issues of two-dimensional display in three-dimensions).
Shown in the atlas view as a landmass. The landmasses are sized based on a normalised measure of the
classes contained within that package. At the first generation of the visualisation the collective sum of the
landmass coverage of the map is no more than 50%. The reason for this is to allow room for evolution.
Once the country space is filled up then the visualisation must be restructured. A more detailed view at
this level of abstraction (used primarily for digging down for information) is shown again as a map page.
A high level view shows the country with the cities laid out (based on a random algorithm at the first
generation) and covering no more than 50% of the country area. In future versions of the visualisation it
may be that road and rail networks can be seen at this level along with flight paths (although the flight
paths would go from each city to every other one and generally confuse the image). At this level of detail
the names of the cities are available as text over the map representation when requested by the user.
4 ^3
WClWtfS Start, t\W H K f f c i / ^
Figure 6-2 - Sketch of the view seen of the world
n. Country (Package/Directory)
0 0 0
0
Figure 6-3 - Sketch of a country showing the component cities
- 9 3 -
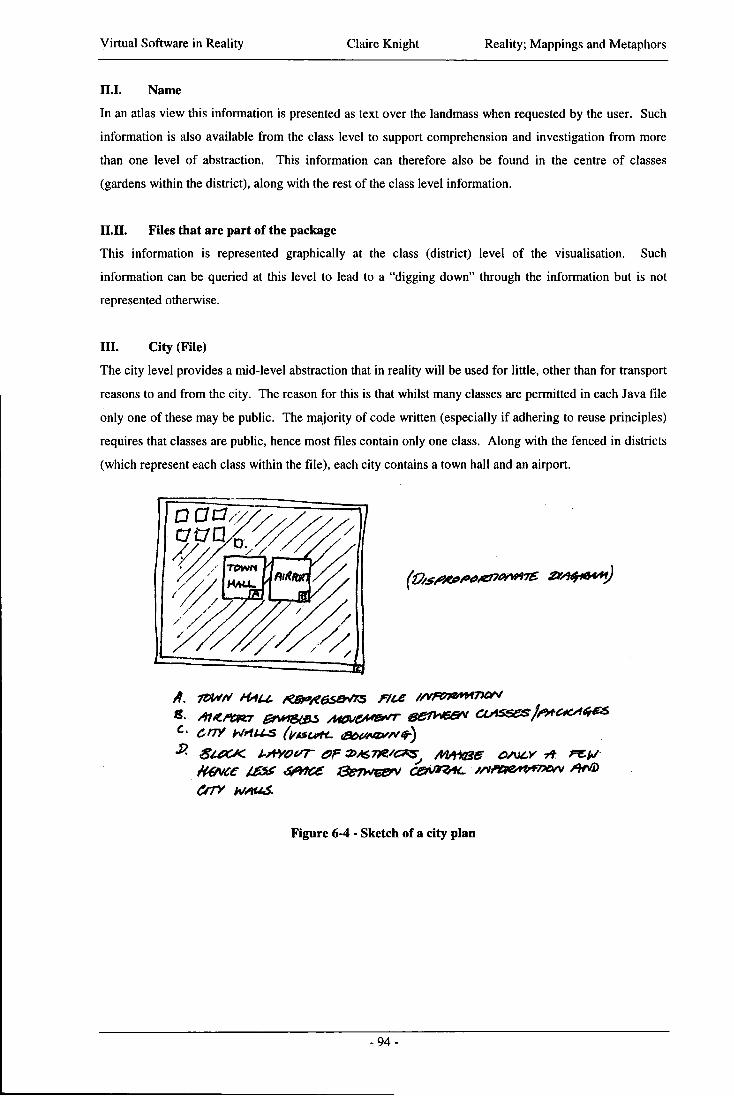
Virtual Software in Reality Claire Knight Reality; Mappings and Metaphors
II . I . Name
In an atlas view this information is presented as text over the landmass when requested by the user. Such
information is also available from the class level to support comprehension and investigation from more
than one level of abstraction. This information can therefore also be found in the centre of classes
(gardens within the district), along with the rest of the class level information.
I I . I I . Files that are part of the package
This information is represented graphically at the class (district) level of the visualisation. Such
information can be queried at this level to lead to a "digging down" through the information but is not
represented otherwise.
I I I . City (File)
The city level provides a mid-level abstraction that in reality will be used for little, other than for transport
reasons to and from the city. The reason for this is that whilst many classes are permitted in each Java file
only one of these may be public. The majority of code written (especially i f adhering to reuse principles)
requires that classes are public, hence most files contain only one class. Along with the fenced in districts
(which represent each class within the file), each city contains a town hall and an airport.
V /
HMJL
/
CfTY h/AUS.
Figure 6-4 - Sketch of a city plan
- 9 4 -
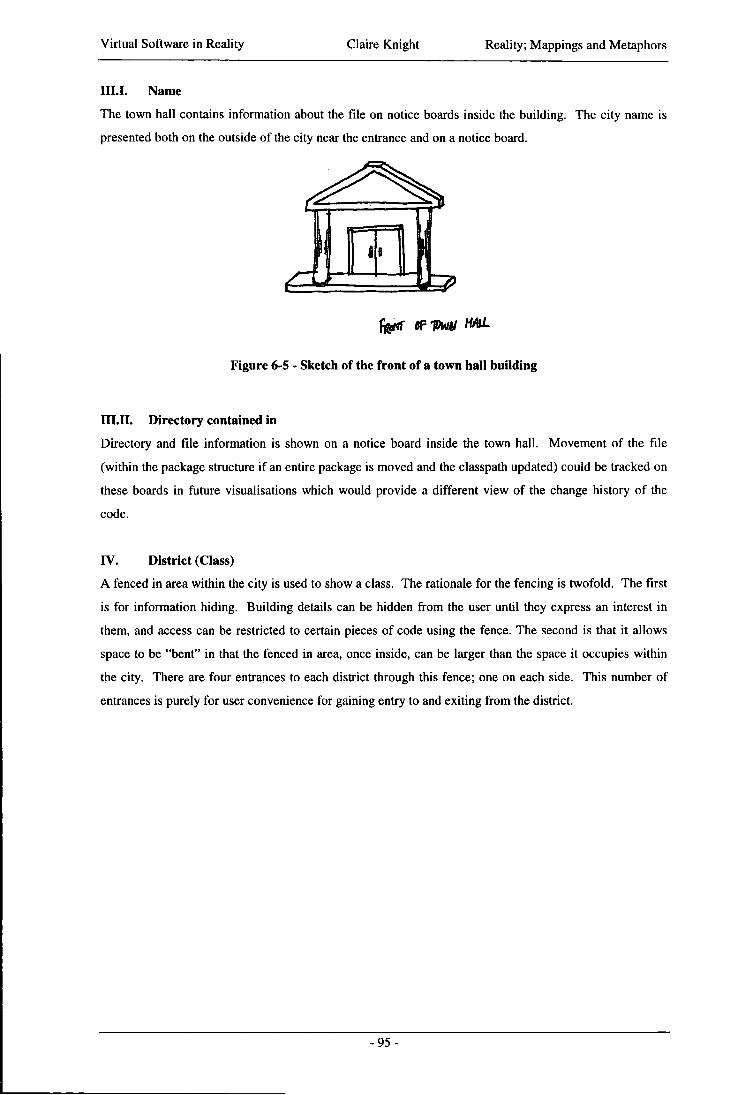
Virtual Software in Reality Claire Knight Reality; Mappings and Metaphors
III . I . Name
The town hall contains information about the file on notice boards inside the building. The city name is
presented both on the outside of the city near the entrance and on a notice board.
Figure 6-5 - Sketch of the front of a town hall building
in.II. Directory contained in
Directory and file information is shown on a notice board inside the town hall. Movement of the file
(within the package structure i f an entire package is moved and the classpath updated) could be tracked on
these boards in future visualisations which would provide a different view of the change history of the
code.
IV. District (Class)
A fenced in area within the city is used to show a class. The rationale for the fencing is twofold. The first
is for information hiding. Building details can be hidden from the user until they express an interest in
them, and access can be restricted to certain pieces of code using the fence. The second is that it allows
space to be "bent" in that the fenced in area, once inside, can be larger than the space it occupies within
the city. There are four entrances to each district through this fence; one on each side. This number of
entrances is purely for user convenience for gaining entry to and exiting from the district.
- 9 5 -
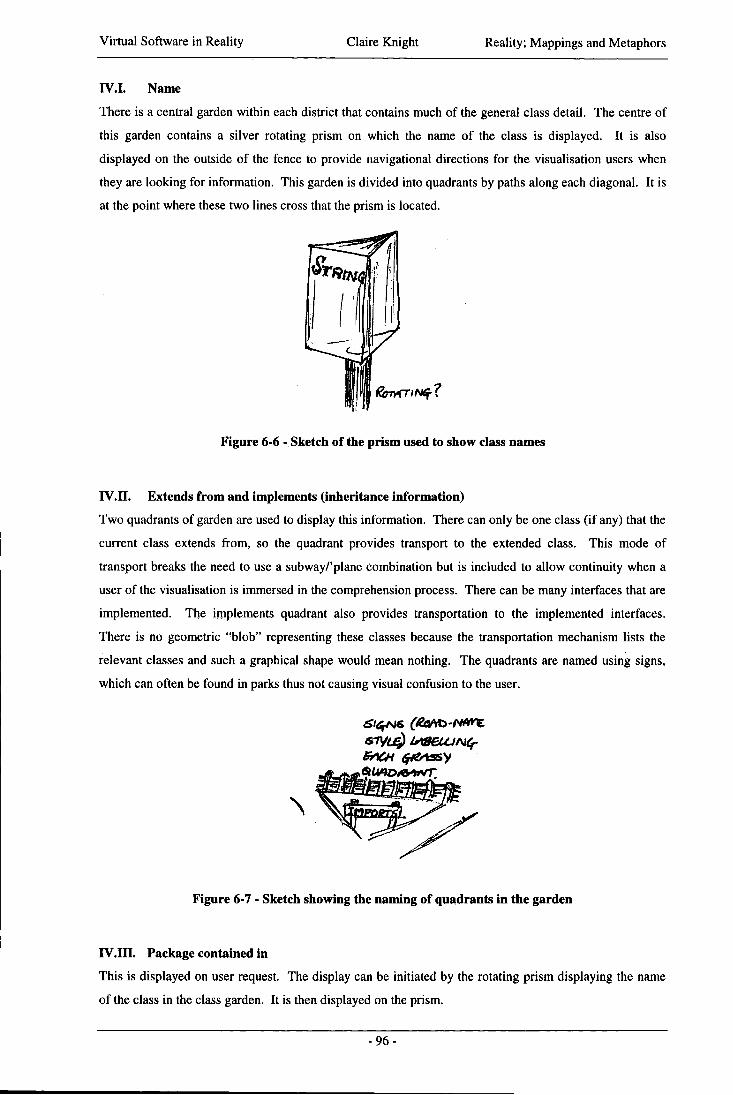
Virtual Software in Reality Claire Knight Reality; Mappings and Metaphors
IV . I . Name
There is a central garden within each district that contains much of the general class detail. The centre of
this garden contains a silver rotating prism on which the name of the class is displayed. It is also
displayed on the outside of the fence to provide navigational directions for the visualisation users when
they are looking for information. This garden is divided into quadrants by paths along each diagonal. It is
at the point where these two lines cross that the prism is located.
ROTATING-?
Figure 6-6 - Sketch of the prism used to show class names
rV.II. Extends from and implements (inheritance information)
Two quadrants of garden are used to display this information. There can only be one class (if any) that the
current class extends from, so the quadrant provides transport to the extended class. This mode of
transport breaks the need to use a subway/' plane combination but is included to allow continuity when a
user of the visualisation is immersed in the comprehension process. There can be many interfaces that are
implemented. The implements quadrant also provides transportation to the implemented interfaces.
There is no geometric "blob" representing these classes because the transportation mechanism lists the
relevant classes and such a graphical shape would mean nothing. The quadrants are named using signs,
which can often be found in parks thus not causing visual confusion to the user.
BACH &e*s&y
\
Figure 6-7 - Sketch showing the naming of quadrants in the garden
IV. I I I . Package contained in
This is displayed on user request. The display can be initiated by the rotating prism displaying the name
of the class in the class garden. It is then displayed on the prism.
- 9 6 -
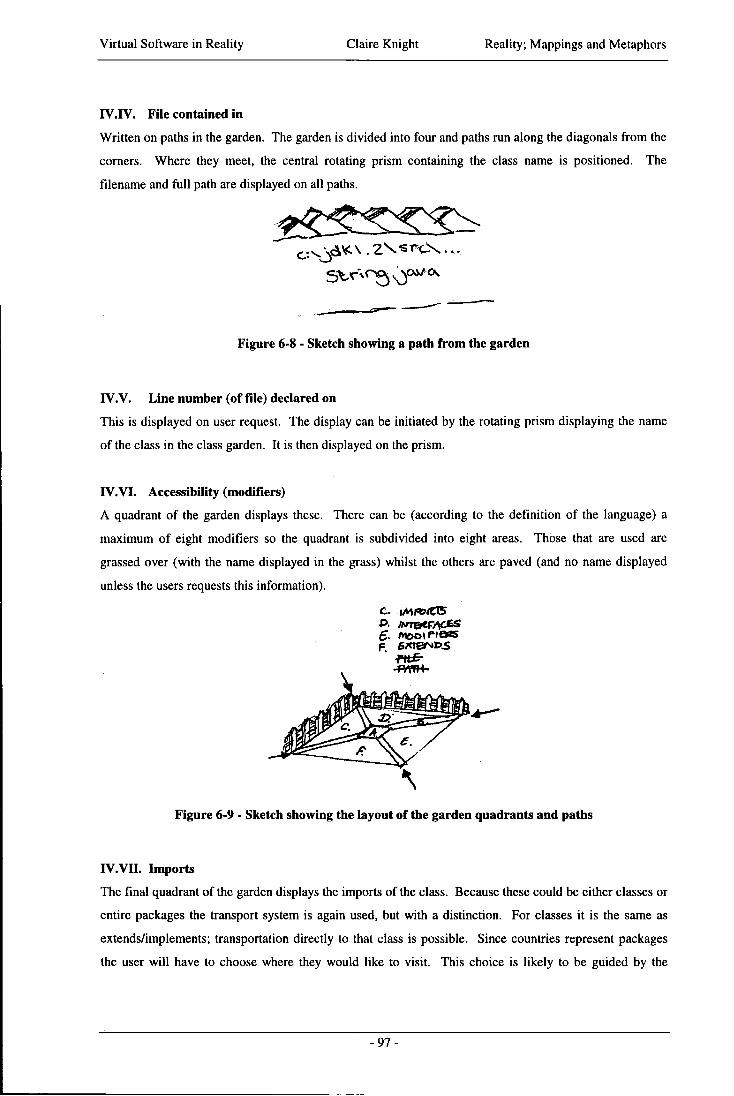
Virtual Software in Reality Claire Knight Reality; Mappings and Metaphors
IV.IV. File contained in
Written on paths in the garden. The garden is divided into four and paths run along the diagonals from the
corners. Where they meet, the central rotating prism containing the class name is positioned. The
filename and ful l path are displayed on all paths.
Figure 6-8 - Sketch showing a path from the garden
IV.V. Line number (of file) declared on
This is displayed on user request. The display can be initiated by the rotating prism displaying the name
of the class in the class garden. It is then displayed on the prism.
IV.VI . Accessibility (modifiers)
A quadrant of the garden displays these. There can be (according to the definition of the language) a
maximum of eight modifiers so the quadrant is subdivided into eight areas. Those that are used are
grassed over (with the name displayed in the grass) whilst the others are paved (and no name displayed
unless the users requests this information).
C. iMrt><CT5 P. /NraeFACJBS
' I M i l l "
\ Figure 6-9 - Sketch showing the layout of the garden quadrants and paths
IV.VII . Imports
The final quadrant of the garden displays the imports of the class. Because these could be either classes or
entire packages the transport system is again used, but with a distinction. For classes it is the same as
extends/implements; transportation directly to that class is possible. Since countries represent packages
the user will have to choose where they would like to visit. This choice is likely to be guided by the
- 9 7 -
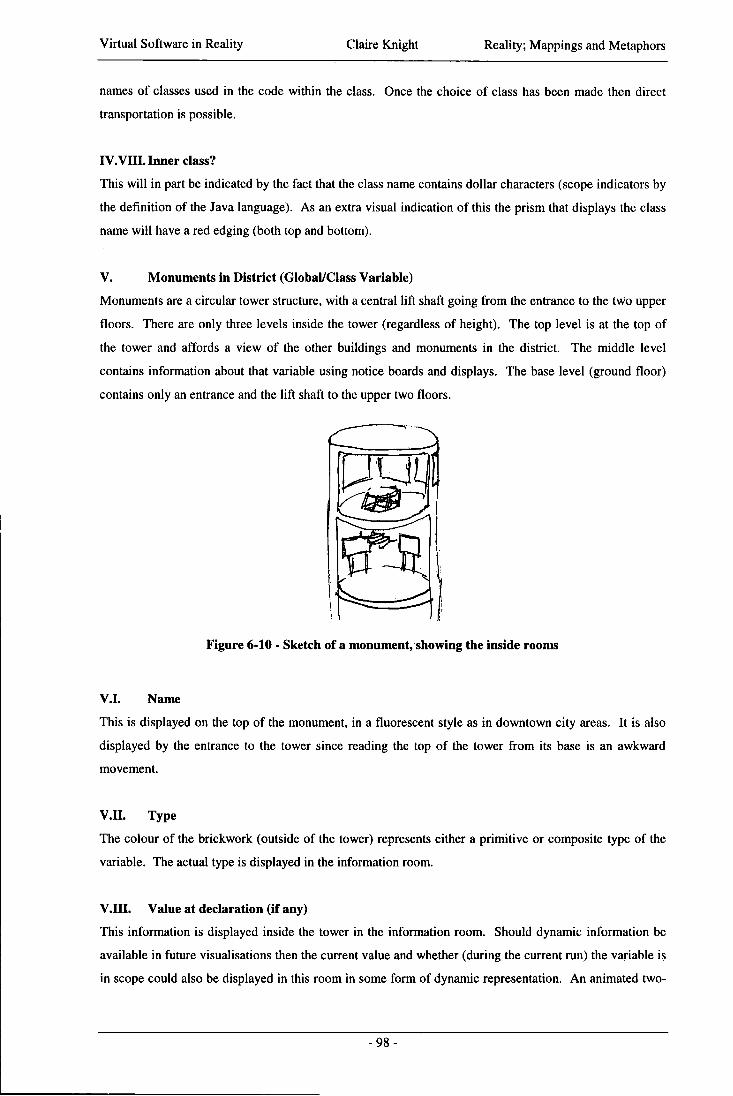
Virtual Software in Reality Claire Knight Reality; Mappings and Metaphors
names of classes used in the code within the class. Once the choice of class has been made then direct
transportation is possible.
IV. VII I . Inner class?
This will in part be indicated by the fact that the class name contains dollar characters (scope indicators by
the definition of the Java language). As an extra visual indication of this the prism that displays the class
name will have a red edging (both top and bottom).
V. Monuments in District (Global/Class Variable)
Monuments are a circular tower structure, with a central l if t shaft going from the entrance to the two upper
floors. There are only three levels inside the tower (regardless of height). The top level is at the top of
the tower and affords a view of the other buildings and monuments in the district. The middle level
contains information about that variable using notice boards and displays. The base level (ground floor)
contains only an entrance and the lif t shaft to the upper two floors.
V.I . Name
This is displayed on the top of the monument, in a fluorescent style as in downtown city areas. It is also
displayed by the entrance to the tower since reading the top of the tower from its base is an awkward
movement.
V.H. Type
The colour of the brickwork (outside of the tower) represents either a primitive or composite type of the
variable. The actual type is displayed in the information room.
V.III . Value at declaration (if any)
This information is displayed inside the tower in the information room. Should dynamic information be
available in future visualisations then the current value and whether (during the current run) the variable is
in scope could also be displayed in this room in some form of dynamic representation. An animated two-
3
Figure 6-10 - Sketch of a monument, showing the inside rooms
- 9 8 -
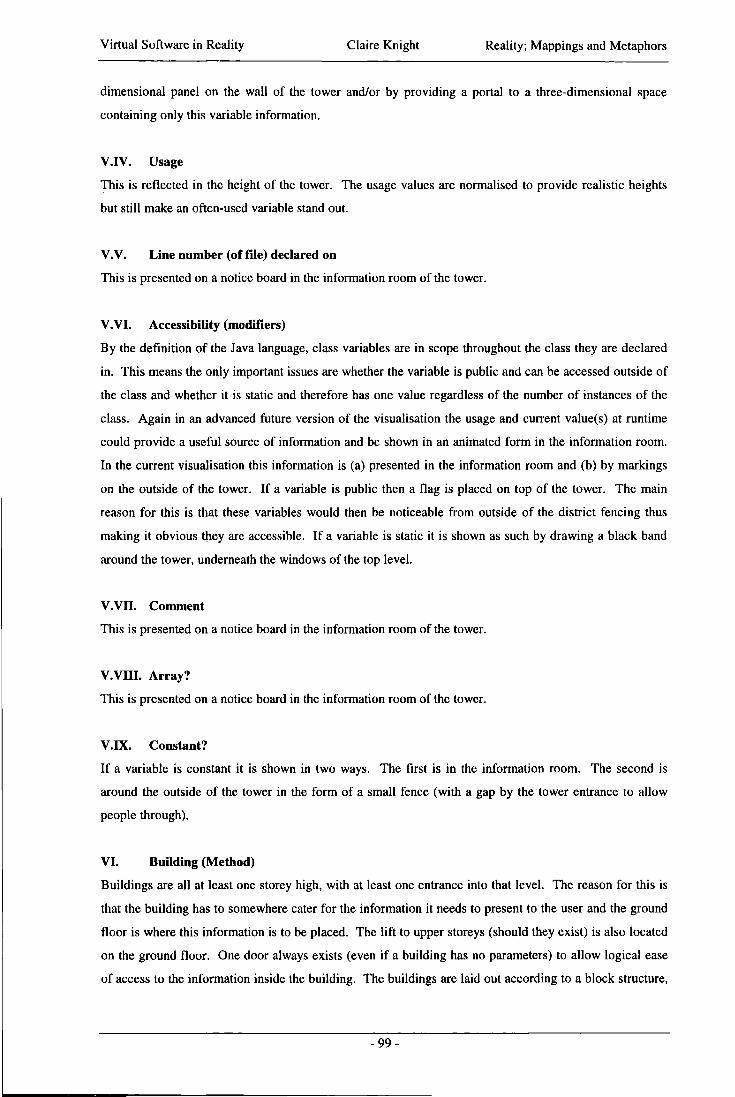
Virtual Software in Reality Claire Knight Reality; Mappings and Metaphors
dimensional panel on the wall of the tower and/or by providing a portal to a three-dimensional space
containing only this variable information.
V.rV. Usage
This is reflected in the height of the tower. The usage values are normalised to provide realistic heights
but still make an often-used variable stand out.
V.V. Line number (of file) declared on
This is presented on a notice board in the information room of the tower.
V.VI. Accessibility (modifiers)
By the definition of the Java language, class variables are in scope throughout the class they are declared
in. This means the only important issues are whether the variable is public and can be accessed outside of
the class and whether it is static and therefore has one value regardless of the number of instances of the
class. Again in an advanced future version of the visualisation the usage and current value(s) at runtime
could provide a useful source of information and be shown in an animated form in the information room.
In the current visualisation this information is (a) presented in the information room and (b) by markings
on the outside of the tower. I f a variable is public then a flag is placed on top of the tower. The main
reason for this is that these variables would then be noticeable from outside of the district fencing thus
making it obvious they are accessible. I f a variable is static it is shown as such by drawing a black band
around the tower, underneath the windows of the top level.
V.VII. Comment
This is presented on a notice board in the information room of the tower.
V.Vni. Array? This is presented on a notice board in the information room of the tower.
V. IX. Constant?
I f a variable is constant it is shown in two ways. The first is in the information room. The second is
around the outside of the tower in the form of a small fence (with a gap by the tower entrance to allow
people through).
VI. Building (Method)
Buildings are all at least one storey high, with at least one entrance into that level. The reason for this is
that the building has to somewhere cater for the information it needs to present to the user and the ground
floor is where this information is to be placed. The l i f t to upper storeys (should they exist) is also located
on the ground floor. One door always exists (even i f a building has no parameters) to allow logical ease
of access to the information inside the building. The buildings are laid out according to a block structure,
- 9 9 -
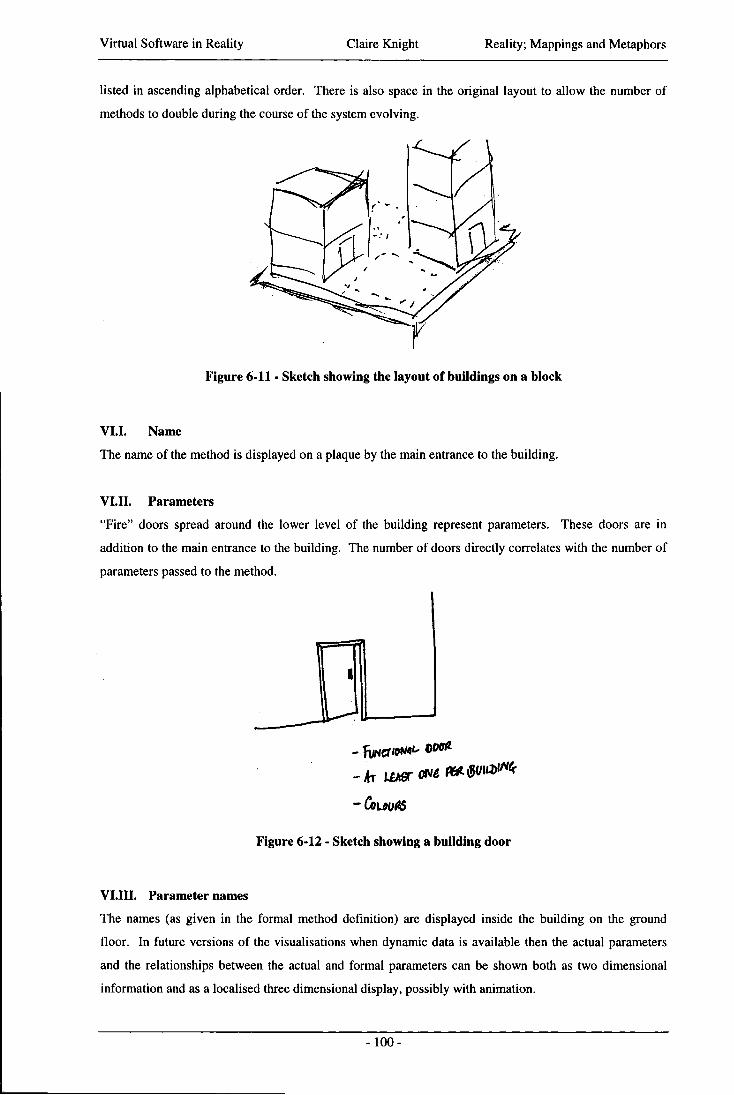
Virtual Software in Reality Claire Knight Reality; Mappings and Metaphors
listed in ascending alphabetical order. There is also space in the original layout to allow the number of
methods to double during the course of the system evolving.
< ? 1
Figure 6-11 - Sketch showing the layout of buildings on a block
VI . I . Name
The name of the method is displayed on a plaque by the main entrance to the building.
VI. I I . Parameters
"Fire" doors spread around the lower level of the building represent parameters. These doors are in
addition to the main entrance to the building. The number of doors directly correlates with the number of
parameters passed to the method.
1
- CouijAS
Figure 6-12 - Sketch showing a building door
VI . I I I . Parameter names
The names (as given in the formal method definition) are displayed inside the building on the ground
floor. In future versions of the visualisations when dynamic data is available then the actual parameters
and the relationships between the actual and formal parameters can be shown both as two dimensional
information and as a localised three dimensional display, possibly with animation.
- 100-
Virtual Software in Reality Claire Knight Reality; Mappings and Metaphors
VI.IV. Parameter types
Composite or primitive type distinctions are shown by the colour of the parameter door. Detailed type
information is presented in the building foyer on a notice board. I f a type is primitive the door is yellow,
and i f it is composite the door is green.
VI.V. Return type
This information is shown inside the building on a notice board.
VI.VI. Exceptions thrown
These are shown as outside lights on the building. Upon activation (the user investigating the method and
exceptions) they act as i f switched on and cast a light down on to the pavement. The name of the
exception thrown is shown on the pavement in the beam of light. In future visualisations the catching
level of code (with dynamic information) can be traced and even animated.
VI.Vn. Usage
This information is not currently collected because absolute knowledge of which method is called and
used in an object-oriented language cannot be determined until runtime due to overloading and
inheritance.
VI.VIII. Line number (of file) declared on
This information is shown inside the building on a notice board.
VI.IX. Accessibility (private or public)
The colour of the building illustrates the accessibility of the method (at least for private and public). In
addition these modifiers are listed inside the building. The brickwork is grey for public methods and
brown for private methods.
VI.X. Other access modifiers (such as static)
A l l modifiers are listed inside the building on notice boards.
VI. XI. Lines of code
The height of the building represents the number of lines of code in the method. These figures are
normalised to prevent randomly sized buildings but enough of an indication of the lines of code is given.
V I I . Floor in the Building (Local/Method Variable)
Since there could be many local variables in the code each can be presented to the user on a floor of their
own. This having more floors than presented when viewing the building from the exterior is another
example of bending the virtual space. The local variable floors are accessed via the l if t . Each floor is
essentially a small office. The variable information is presented using a desk and various standard desk
Virtual Software in Reality Claire Knight Reality; Mappings and Metaphors
"objects". In using this sub-metaphor, notes and annotations about the variable, it's usage, intended
function etc. can be documented for use by other users of the visualisation. In future systems that also
have dynamic information included, two-dimensional wall displays and the remainder of the room can be
utilised for further visual impact.
V I I . I . Name
This is displayed inside the l i f t so that the correct floor can be selected. It is also displayed on the desk, as
a nameplate would appear i f the desk belonged to a person.
V I I . I I . Type
A desklamp is used to represent the type. Again the distinction is made between primitive and composite
types. A primitive type is a basic desktop spotlight whilst a composite type is an executive/bankers lamp.
The light cast down by the lamp shows the actual name of the type.
V I I . I I I . Value at declaration (if any)
There is an I N tray on the desk with the top sheet used to present information to the user of the
visualisation. The value of the variable at declaration (if there is one) is displayed on this piece of paper
as text. The reason for not trying to display this information visually is essentially that the entire metaphor
may need to be shown (albeit smaller) since almost anything, included new class definitions can be used
according to the definition of the Java language.
VII . IV . Usage
The usage data for the variable is presented in the form of a book. In this way each usage can be
displayed as an entity in it's own right (on a single page of the book) along with any annotations and with
links to the relevant piece of code. It is also possible to view the usage data as a whole in the overview
part of the book such as the table of contents. The table of contents provides a list of all usage without
having to go to the appropriate place in the book.
VII . V. Line number (of file) declared on
The line number that the variable was declared on is presented to the user as a one-day-at-a-time tear off
calendar with the obvious restriction that visualisation users cannot tear any values off to change the
declaration line without the underlying code changing!
VII .VI . Accessibility (modifiers)/Constant?
The only possible modifier that can be used here is final. I f the variable is declared as final then "Final
Version" is stamped across the sheet on top of the I N tray.
V I I . V I I . Array?
Should the variable be an array, there is then a stack of trays (of which the top one is always the I N tray)
on the desk. The height of these trays (say three) is independent of the actual size of the array, basically to
-102-
Virtual Software in Reality Claire Knight Reality; Mappings and Metaphors
counteract trying to visualise multi-dimensional arrays beyond a size of three. The actual information as
to how the array is structured is provided on the top piece of paper in the I N tray along with any initial
value and whether the variable is final.
VII.Vin. Scope within the method
These are "pathed" using forward slash as the root for the top level of the method. After that, a name,
followed by an instance number of the type of block, is used (with a forward slash again) for each block
level entered. This information can be presented in a stacking structure on the desk in the form of an
executive toy something akin to the Towers of Hanoi. The path (of the block structure) can be
represented as blocks or rings on a single pole. In advanced versions of the visualisations (when dynamic
information is incorporated) the current block can be shown on a separate pole of the toy. The user can
also manipulate the run-time position and investigate the variables this way during a debugging
investigation.
There are a number of issues that are described in the above text as part of the mapping specification, but
also have a wider impact on the visualisation. The following four sections address these important issues;
navigation, scalability, automation and evolution.
6.2.5 Navigation
Navigation and orientation within Software World are built into the mapping and representation decisions
made in the context of the metaphor of urbanised developments, and at the higher level of abstraction,
cartographic principles. Independent of the implementation software used (and therefore the control
mechanisms available to the user for moving around the virtual environment) Software World caters for
navigation in its use of features that have been identified as beneficial to navigation and orientation.
These include paths and roads, landmarks (for example, monuments), districts, nodes (mini landmarks,
such as the town hall in the city), and finally edges, such as the fencing around district areas.
6.2.6 Scalability
Scalability issues are described in the mapping specification above. These relate to the range of classes,
packages and files that can be used in a software system. The mapping takes this into account by
providing mechanisms that not only act as abstraction levels but also allow a sensible breakdown of
visualised components. This allows for each level to accommodate a wide range of underlying data items.
This is obvious at the file and class level; since a file can contain many classes, then a city is used to
represent the file, thereby leaving the opportunity for many classes to be represented as districts within the
city. The same is true of the class and method level; the size of the district (once inside that part of the
- 103-
Virtual Software in Reality Claire Knight Reality; Mappings and Metaphors
landscape) is dependent on the number of methods in the source code and the block layout of the streets is
adjusted accordingly.
6.2.7 Automation
To automate such a visualisation requires that the representations chosen are available in some way in a
library of visual objects. These can then be used with various layouts and the actual data in order to create
the virtual environment automatically. The expectation of having such representations available is not an
unreasonable one since even the most basic of geometric objects need to be described in such terms for
most VR software that is capable of this degree of automation. Obviously, with the standardisation of
such geometric objects, these are usually defined as a library to save users time and effort, but the
principle is the same for the Software World objects. Once they have been defined, then they can be used
at wil l in any generation.
6.2.8 Evolution
The following provides a presentation and description of the Software World in the context of evolution.
The evolution in question is the changing of the underlying code (i.e. the software system that the graphics
are representing). The various attributes of the changes that could possibly be collated and analysed are
presented with some suitable representations for these data items.
6.2.8.1 Overview Description
Evolution of the software (and hence the visualisation) is supported through the use of the real-world city
views. When an area of the visualisation is removed it is retained for a number of future software releases
in the visualisation. This is done for continuity, and in case it is reinstated at any close future point. This
is shown in the cities through the use of graphics such as "Demolition work", and the buildings can be
degraded in graphics quality to emphasise the point. The opposite, addition of components, is also
supported. For the first release the new part of the visualisation can be shown with scaffolding or new
signs around the buildings. After an appropriate number of releases the visualisation is updated to show a
standard building (for new pieces of code) or the buildings are removed (deleted pieces of code). These
cut-off points can be configured at the visualisation generation time, or later, although i f changed later,
deleted items cannot be recovered if they should still be shown as being demolished.
Lower level evolution of the code is also important from a graphical viewpoint, although ways of showing
this through overview views of the world is also important. Whilst the detail of the code at this level is
- 104-
Virtual Software in Reality Claire Knight Reality; Mappings and Metaphors
shown inside the buildings some indication that this change has occurred without the user having to enter
the building is useful. The amount of change a method has undergone during its "life" is also important.
Such information would be presented at the building level (for changes to code within a method) so
visualisation of this needs to complement the other visual representations used for the standard method
attributes.
VR portals can be useful in many situations but they cannot be relied upon to address the evolution issue
in isolation. I f an area needs to contain only three pieces of data, then later it needs to accommodate
3,000 instead of the visualisation existing, for example behind a door, a sub-VR-world can be started as
the door is opened. Splitting and regenerating visualisations to cope with evolution is easy but it destroys
the existing structure in a haphazard way. This can very easily lead to disorientation, confusion and loss
of data items for users of the system.
The initial visualisation generation of the Software World is done with evolution (and hence space for it)
in mind. The grid layout accommodates the inclusion of extra methods (at the buildings inside a district
level) and the inclusion of inner or local classes (districts into a city). It even allows for the inclusion of
files (adding cities to countries) using this layout mechanism. Once the spacing has been used up, then the
visualisation and/or code needs restructuring and the graphics need to display this to the user. It may be
the case that the visualisation has simply been exceeded or it may indicate that the actual code needs to be
restructured and there are problems with the system beyond the visual representation.
6.2.8.2 Representational Issues
There are many statistics and areas of measurement that can be used as a representation of the evolution
process of code. Primitive measurements such as changes in the size of the source files can be used to
provide an indication of possible change, but more sophisticated measures based on which methods have
changed, movement of positions in files, and changes in complexity figures can also be used. Subtle
information can also be found, although at this stage only by human analysis, such as whether methods
have changed name - automation analysis would mark such a change by one addition and one deletion to
the methods in the source code file.
- 105 -
Virtual Software in Reality Claire Knight Reality; Mappings and Metaphors
Items considered to be of interest and possible use for the purposes of the Software World visualisation
representing evolution are:
• (Average) File complexity
• (Average) Class complexity
• (Average) Method complexity
• Number of files involved in the system
• Average LOC/File for all files in the system
• Average LOC/Class for all classes in the system
• Number of classes involved in the system (coded)
• Number of classes involved in the system (library/API)
• Overall number of classes involved in the system
• New files
• Renamed files
o Changed files
• Removed files
• Number of lines in the file
- 106-
Virtual Software in Reality Claire Knight Reality; Mappings and Metaphors
• New classes
» Renamed classes
» Changed classes
• Removed classes
» Number of methods in the system
o Average LOC/Method for a source file
o New methods
» Renamed methods
» Changed methods
• Removed methods
These numbers can all be used for graphical representations in the visualisations, and also, comparisons
made in each release to the figures previously obtained. This then provides, for each release, two possible
visible indications of any evolution that has taken place.
Some way of merging and then "opening up" clusters of items is useful. A representation can be used to
indicate a graphical object has such behaviour - it is then possible to replace existing visual items with
this i f an area outgrows its space. The user could then choose to activate such an object and the
visualisation would be expanded (in some way) to show the detail. This maps well to the higher level
(cartographic) maps of the world, countries and cities. Bending space is also possible in a VR
environment because the view of a building from the outside and then the space it has inside do not have
to match as they do in the real world. Effectively not only is the outside landscape infinite, each building
has an infinite amount of space available inside. This allows for both expansion during evolution, but also
being able to utilise space in the best way for the visualisation without having to cramp that information
together.
The attributes identified above all need to work with the graphical mappings of attributes previously
defined in the complete mapping of the Software World metaphor. The following specification (with
numberings to match that previously used, shows how such evolution considerations can be employed in
the context of Software World.
I. World (System)
Since this level of information is displayed solely as an atlas view in the context of the metaphor there is
very little evolution to deal with that is not dealt with by the lower level graphical mappings. At the first
generation of the visualisation the collective sum of the landmass coverage of the world map is no more
than 50%. The reason for this is to allow room for evolution. Once the country space is filled up then the
visualisation must be restructured.
- 107-
Virtual Software in Reality Claire Knight Reality; Mappings and Metaphors
I I . Country (Package/Directory)
A more detailed view shows the country with the cities laid out (based on a random algorithm at the first
generation) and covering no more than 50% of the country area. In future versions of the visualisation it
may be that road and rail networks can be seen at this level along with flight paths (although the flight
paths would go from each city to every other one and generally confuse the image). Changes to any sub
component of a country are shown purely by indicating that something in the country has changed. This
can be seen by the colour of the landmass. The brighter green the land the most recently changes have
occurred, therefore for each release the brightest country will be the one with the most changes. For
visual comparison the border of the country (a thick border for colour identification, not just a pixel
wide!) will be coloured the green of the landmass in the previous release of the visualisation. This allows
not only a comparison of changes across a system for each release but also relative changes within the
package that the country represents.
HI. City (File)
The city level provides a mid-level abstraction that in reality will be used for little, other than for transport
reasons to and from the city. Changes to any part of a file (i.e. any class in that file or method within the
class(es)) can be seen by the colour of the fence around the city, and then within the city for each class
that has changes. The colour of the fence in the previous visualisation release would also be shown for
comparison to aid the user in judgements about how much change may have taken place. The original
colour of the fence is of a mid-brown wood, and should recent changes have taken place then the colour is
lightened. The corner panels are coloured the previous version colour, so i f there is no change over two
releases the fence would be a uniform colour.
Within the boundaries of the city, changes to the file (such as the addition or deletion of that file in the
context of the whole system) are represented through the use of scaffolding around the town hall and
indications as to whether it is construction or demolition in progress. This representation maintains
consistency with the images used for buildings and means the user has less of a range of representations to
remember to make effective use of the system.
The number of lines of code and complexity measures changing are a factor of the file and the code
contained within it. The changes throughout releases are shown inside the town hall. This allows the user
to explore these values through interacting with the display and also allows for a range of display
mechanisms to be used.
I I I . I. Name
The city name is presented both on the outside of the city near the entrance and on a notice board. Should
a file have been renamed then this "change history" of the naming is represented on the notice board and
the complete set of names in chronological order is available to users of the system. The names for each
version are stored, and should the name have changed then it is highlighted to indicate this within the city
boundary.
- 108-
Virtual Software in Reality Claire Knight Reality; Mappings and Metaphors
ni.II. Directory contained in
Directory and file information is shown on a notice board inside the town hall. Movement of the file
(within the package structure i f an entire package is moved and the classpath updated) could be tracked on
these boards as long as some recognition algorithm was used to reconcile the information within the
database. Making the assumption that this information was available in some way then tree mechanisms
can be used to represent changes in the location of the file on the disk and for moves of the files (and
hence classes) within the package structure. There are many documented methods for representing trees
as nodes and arcs with collapsible branches (for example the file manager displays in windowing
environments) and these would make a logical representation for the current layout. They could also
sensibly be adapted to show change through the use of duplicated, hyperlinked nodes with dashed lines
and shading of the older position of the file.
IV. District (Class)
The same coloured fencing system is used to indicate changes to specific classes as is used for the file
level fencing (described above, in III) . A l l other changes are illustrated closer to the affected area, such
as at the buildings level for any method code changes.
IV. I . Name
There is a central garden within each district that contains much of the general class detail. The centre of
this garden contains a silver rotating prism on which the name of the class is displayed. Should the class
have been renamed (and suitable knowledge and evidence exists to show it is renaming not addition and
deletion) then this is shown on the prism through the use of a neon like effect of lighting up the name
displayed. The system can also provide the history of names of the class at each release should such
information be required.
V. Monuments in District (Global/Class Variable)
For the addition and deletion of these, scaffolding is used around the monument with appropriate
construction or demolition signs. Again scaffolding is used to provide a level of familiarity with the
representations used for users.
VI . Building (Method)
For the addition and deletion of these, scaffolding is used around the monument with appropriate
construction or demolition signs. Again scaffolding is used to provide a level of familiarity with the
representations used for users. Should a building have been renamed then this wil l be displayed by a
highlighting of the name on the plaque.
Any methods that have undergone a change also have a flag flying from the roof of the building to provide
an indication of activity within that part of the code.
- 109-

Virtual Software in Reality Claire Knight Reality; Mappings and Metaphors
VI . I . Name
Should a building have been renamed then this will be displayed by a highlighting of the name on the
plaque.
VI. I I . Parameters
I f doors are added or removed (i.e. the addition and removal of parameters) then this is shown graphically.
The doorframe of new doors is coloured red to make the door stand out from the others on the building
and hence draw the user's attention to the fact that a change has occurred. For doors that have been
removed then the door is boarded over for the same number of releases that demolished buildings have a
presence in the visualisation. This then renders the door unusable but shows where something once
existed.
VI.XI . Lines of code
The height of the building represents the number of lines of code in the method. These figures are
normalised to prevent randomly sized buildings but enough of an indication of the lines of code is given.
I f the number of lines of code (still as a normalised value) changes significantly to require the addition or
removal of a storey, always leaving the base storey, the change is shown through boarding up or
scaffolding. I f a level is removed then all windows on that level are boarded up for several future releases
(based on the parameter that governs the existence of demolished doors, buildings, districts and cities).
The reverse, an addition, is shown through scaffolding at that level alone with only basic lower level
supports. This differs from building scaffolding which cover all levels with more scaffolding structure.
There are still some of the above identified items that are not covered by the additions to the definition of
the Software World mapping specification, primarily because the items re-listed below are numerical and
work best with plots or bars showing the changes in values through the releases.
• (Average) File complexity
• (Average) Class complexity
« (Average) Method complexity
• Number of files involved in the system
• Average LOC/File for all files in the system
• Average LOC/Class for all classes in the system
• Number of classes involved in the system (coded)
• Number of classes involved in the system (library/API)
• Overall number of classes involved in the system
• Number of methods in the system
• Average LOC/Method for a source file
- 110-
Virtual Software in Reality Claire Knight Reality; Mappings and Metaphors
Since these provide summaries that are of most use when combined with similar figures then they should
be available as graphs from the within the visualisation system. These figures can then be interrogated,
aggregated, manipulated, viewed and presented as any other numerical data over time, but have the added
advantage of being in the context of the software to which they relate.
6.2.8.3 Use of and for an Evolving Visualisation
It may be argued that an evolving visualisation is not necessary and that focus should be on the graphical
representations used for each, distinct, release of the software. This view is considered to be true for
certain tasks and visualisations, but that the very nature of software dictates that i f it is to remain useful
and used it needs to change so that it continually meets the needs of those who use it. Because software
changes and releases can occur frequently those maintaining (and hence needing to comprehend the code)
need visualisation tools that help maintain and upgrade their knowledge through the different releases of
the software.
Apart from the knowledge and mental model maintenance considered necessary when using the
visualisations for various comprehension tasks there is also the trail that the evolution process can leave.
Graphics can be changed to in real time in the form of a "run-through" to indicate the changes that have
taken place in that area of the district or city over the releases of the software. The user annotations (via
the noticeboard mechanism) can also be rolled through time allowing a person using the system now to
see what was written several releases ago as this may provide pointers towards the solution of a
maintenance problem encountered at the current time. By combining this with the structures that the area
was composed of at that time and then being able to view the intervening ones, a very powerful knowledge
and intelligence amplification tool can be created.
Certain visualisation metaphors and styles (apart from the Software World) may lend themselves well to
this process of evolution. This is through both the slowly changing graphics over time, and the faster
paced animations when playing back areas of the visualisation, but would be of no use for knowledge
engineering and as a mental model creation aid. Both must be considered to create the best tool and
designing the metaphor to encompass these evolutions from the start is important. It may be the case that
for a specific, narrow, task sacrificing certain navigation and orientation properties for display oriented
ones is the right choice but the evaluation used for the Software World and the purpose for which it was
designed consider wider issues.
6.2.8.4 Remarks
This section presented the Software World visualisation metaphor from an evolution perspective. It is
intended to demonstrate that by providing a logical and explainable framework for the visualisation at the
- I l l -
Virtual Software in Reality Claire Knight Reality; Mappings and Metaphors
outset, changes to the underlying code, and hence the visualisation, can be understood and managed
(mentally) by users of the system without completely destroying the knowledge built up previously.
6.2.9 Concluding Remarks
This part of the thesis has presented the Software World visualisation metaphor in its entirety. It is
intended to demonstrate that by providing a logical and explainable framework for the visualisation at the
outset, both the usability and any changes to the underlying code and hence the visualisation can be
understood and managed (mentally) by users of the system. This comprehension and maintenance of the
existing mental model provides a powerful way of enhancing such tasks as program comprehension, as
with each code release the existing knowledge that has already been built up provides a basis for the new
comprehension required. The greater the level of knowledge, the stronger (according to program
comprehension literature) the mental model and hence the more information used for decisions over any
changes to the code. This visualisation has also been designed to demonstrate the feasibility of using
something other than (a) two-dimensional representations and (b) using geometric three-dimensional
representations.
6.3 Software Landscape
This section describes the principles and mappings of the landscape metaphor (known as Software
Landscape) for visualising software. The abstraction levels and representations used are also discussed.
The information presented here is the ideal, theoretical, visualisation. The implementation of this system
as one complete, automatic and fully functioning entity is not considered. This visualisation work is
carried out with the aim of representing Java 2 source code as an aid to program comprehension.
6.3.1 Overview Description
The Software Landscape visualisation is based on, for all intents and purposes, countryside and mountain
terrain and does not consider urban conurbation. The aim is to represent program code using features of
this sort of terrain although from an evolution point of view, natural evolution (such as erosion and
shifting landmass) would not necessarily map to the evolution of the code that underlies the graphics.
Geographical features of interest can be used to represent the code, although this may well create
landscapes that would be possible at no place on the earth!
- 112-
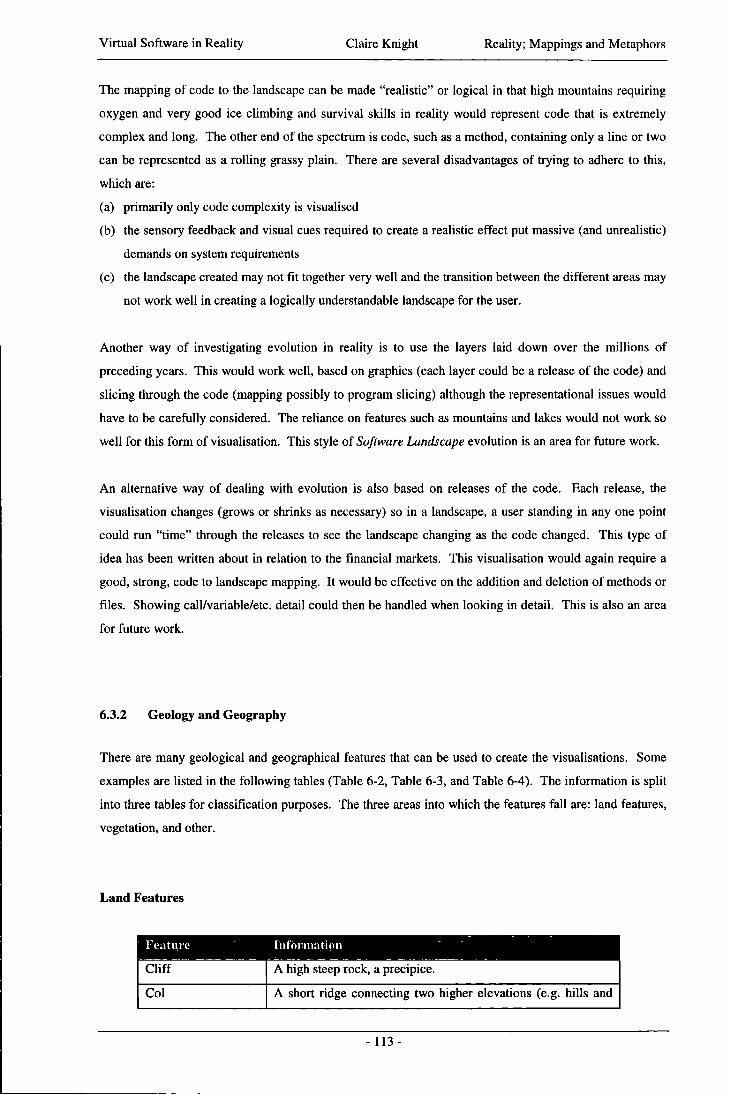
Virtual Software in Reality Claire Knight Reality; Mappings and Metaphors
The mapping of code to the landscape can be made "realistic" or logical in that high mountains requiring
oxygen and very good ice climbing and survival skills in reality would represent code that is extremely
complex and long. The other end of the spectrum is code, such as a method, containing only a line or two
can be represented as a rolling grassy plain. There are several disadvantages of trying to adhere to this,
which are:
(a) primarily only code complexity is visualised
(b) the sensory feedback and visual cues required to create a realistic effect put massive (and unrealistic)
demands on system requirements
(c) the landscape created may not f i t together very well and the transition between the different areas may
not work well in creating a logically understandable landscape for the user.
Another way of investigating evolution in reality is to use the layers laid down over the millions of
preceding years. This would work well, based on graphics (each layer could be a release of the code) and
slicing through the code (mapping possibly to program slicing) although the representational issues would
have to be carefully considered. The reliance on features such as mountains and lakes would not work so
well for this form of visualisation. This style of Software Landscape evolution is an area for future work.
An alternative way of dealing with evolution is also based on releases of the code. Each release, the
visualisation changes (grows or shrinks as necessary) so in a landscape, a user standing in any one point
could run "time" through the releases to see the landscape changing as the code changed. This type of
idea has been written about in relation to the financial markets. This visualisation would again require a
good, strong, code to landscape mapping. It would be effective on the addition and deletion of methods or
files. Showing call/variable/etc. detail could then be handled when looking in detail. This is also an area
for future work.
6.3.2 Geology and Geography
There are many geological and geographical features that can be used to create the visualisations. Some
examples are listed in the following tables (Table 6-2, Table 6-3, and Table 6-4). The information is split
into three tables for classification purposes. The three areas into which the features fall are: land features,
vegetation, and other.
Land Features
Feature Information
Cl i f f A high steep rock, a precipice.
Col A short ridge connecting two higher elevations (e.g. hills and
- 113-
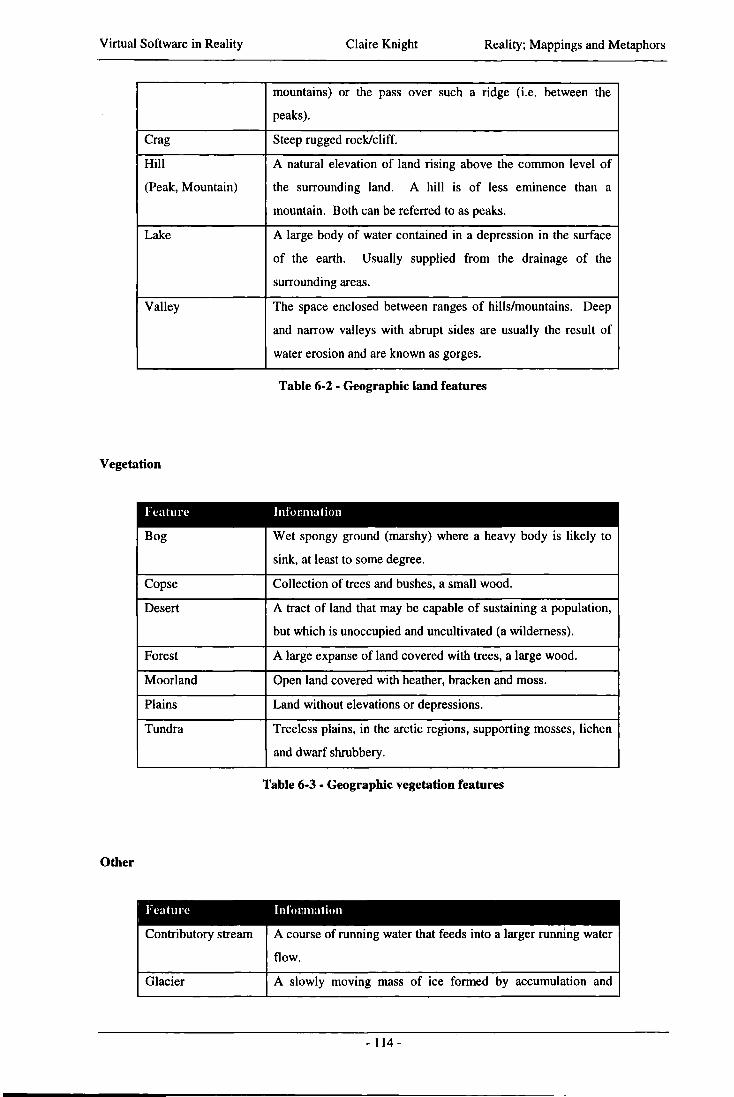
Virtual Software in Reality Claire Knight Reality; Mappings and Metaphors
mountains) or the pass over such a ridge (i.e. between the
peaks).
Crag Steep rugged rock/cliff.
Hi l l
(Peak, Mountain)
A natural elevation of land rising above the common level of
the surrounding land. A hill is of less eminence than a
mountain. Both can be referred to as peaks.
Lake A large body of water contained in a depression in the surface
of the earth. Usually supplied from the drainage of the
surrounding areas.
Valley The space enclosed between ranges of hills/mountains. Deep
and narrow valleys with abrupt sides are usually the result of
water erosion and are known as gorges.
Table 6-2 - Geographic land features
Vegetation
Feature Information
Bog Wet spongy ground (marshy) where a heavy body is likely to
sink, at least to some degree.
Copse Collection of trees and bushes, a small wood.
Desert A tract of land that may be capable of sustaining a population,
but which is unoccupied and uncultivated (a wilderness).
Forest A large expanse of land covered with trees, a large wood.
Moorland Open land covered with heather, bracken and moss.
Plains Land without elevations or depressions.
Tundra Treeless plains, in the arctic regions, supporting mosses, lichen
and dwarf shrubbery.
Table 6-3 - Geographic vegetation features
Other
Feature Information t
Contributory stream A course of running water that feeds into a larger running water
flow.
Glacier A slowly moving mass of ice formed by accumulation and
-114-

Virtual Software in Reality Claire Knight Reality; Mappings and Metaphors
compaction of snow on higher ground.
Moraine Accumulation of earth and stones deposited by a glacier.
Path An established track.
River A large stream of water flowing in a bed/channel and emptying
into another water source.
Scree A heap of stones or rocky debris, often at the base of cliffs.
Table 6-4 - General geographic features
Geographically several of these features can be linked. For example:
• Hills and valleys
• Valleys and lakes
• Forests and copses
• Cliffs and crags
• Hills and cols
• Rivers, contributory streams and lakes
This list of features is for information only and not all of them may be included in the ful l visualisation for
reasons of metaphor consistency, visual simplification or other related limiting factors. In addition
underlying geological information, such as strata and volcanic intrusions in the rock, are not listed and
may be made use of (in a non-geological sense!).
It is important to consider what is meant by the term Landscape for the purposes of this visualisation.
There are also two ways of looking at the landscape; agents that created the landscape (such as glacial and
plate movement) and underlying structure of the landscape (the geological strata). It could be said that
the geography is the visual representation of the system and that the geology is the underlying code on
which the visualisation is based. It is this view that will be taken when the term landscape is used
throughout this section and for the representational issues related to the visualisation.
6.3.3 Visualisation Details
A high level mapping of the code to the visualisation can be shown as:
System Landmass
Package Region
Class Valley and surrounding highpoints
Method Peaks
- 115-
Virtual Software in Reality Claire Knight Reality; Mappings and Metaphors
The idea of hierarchically visualising properties has been used because it mirrors the way in which the
Java source code is organised. This makes the point the metaphors may very well be dependent on the
underlying language being visualised. Since Java can be organised into a clean hierarchical structure then
the metaphor needs to reflect this. The same cannot be said of all object-oriented languages, for example
C++. It is also not true of non object-oriented languages, and there may well be other features that need to
be shown visually that this metaphor does not consider.
A visualisation of any data source has many uses, indeed it may be the case that a visualisation should be
able to cope with any demand a user throws at it. Moving into reality for a moment, it can still be that a
visualisation serves a well-defined range of roles, with several others a user can force it to, but that the
visualisation may need to be defined with specific roles in mind. At the very least a range of roles for
which the visualisation is actually able to fu l f i l , or the activities to which it is well suited, should be
specified after the creation of that visualisation.
Because of this, the Software Landscape metaphor tends towards using the visualisation environment as
both a means for discussion, but more importantly (from a user perspective) as a land in which they are
explorers. Whilst there is some guidance on where to search for information (which paths to take for
certain pieces of information for example) the details are left until the user discovers them. In the same
vein, the use of fog/low cloud over the landscape to hinder vision between landscape regions/areas can, on
the whole, hide unnecessary information. But, during directed exploration, it may be that views from the
top of a peak show more clearly several other peaks that are considered to be of interest to the user for that
exploration. Another extension of the use of fog is to hinder views of code where the user (programmer)
does not have permission to explore and use that code.
This method of interaction allows users to explore and piece together both their knowledge of the
visualisation terrain, and the underlying data, in the way they find easiest. Whilst doing this, it is also
providing starting points and routes to follow (for example, paths of execution, routes a piece of data may
take (for a specific instance of that data), amongst others) to direct the information gathering process.
These "routes" may also be organised to provide a user with several direction choices along the way. Not
only can routes starting from one location lead to different parts of the visualisation, but for a given point
in the terrain it may be possible to map all routes to and from that point to aid the investigation and
exploration.
Related to the use of paths is the scarring and eroding of landscapes. A problem in reality is that popular
outdoor areas can, i f not managed to some degree (or the visitors managed!), become badly eroded
beyond that which would be expected from the weather and some usage over time. This issue can be
exploited to enhance a collaborative facet of the landscape. It is also a technique that has been employed
with some success in other data mining visualisation systems. The most used routes to information are
highlighted in theses systems to indicate to other users that this has been profitable in some way to a
previous user. The more uses a route or path has the more it is made to stand out from the paths around it.
- 116-
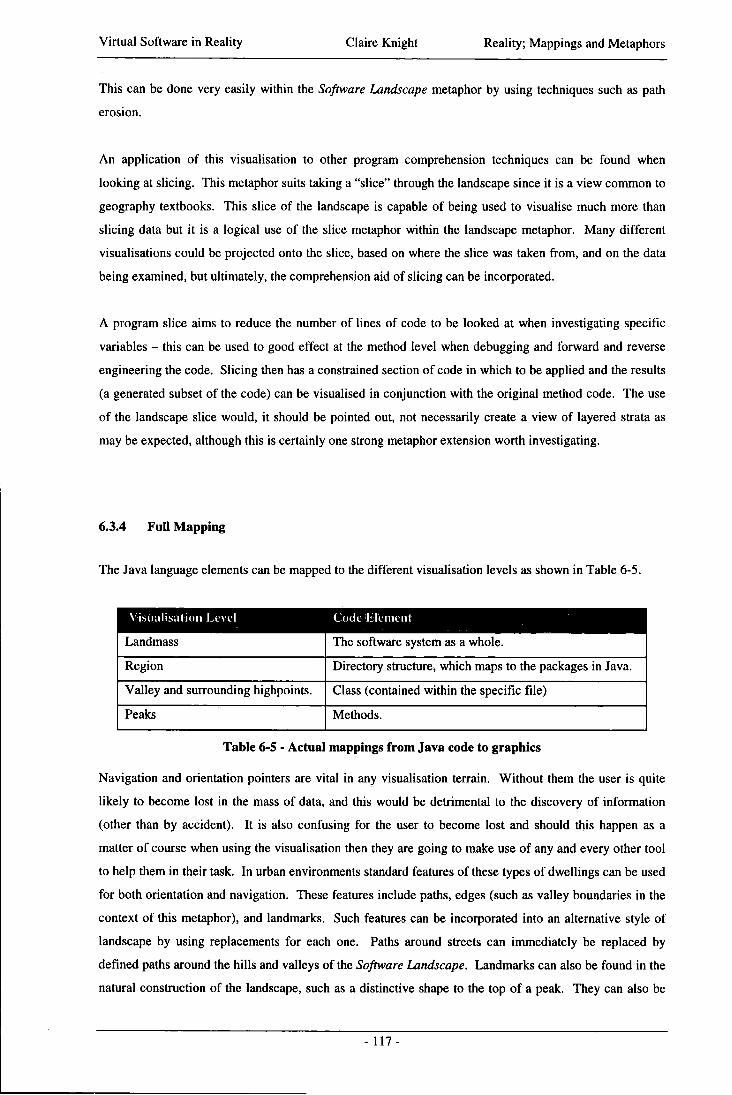
Virtual Software in Reality Claire Knight Reality; Mappings and Metaphors
This can be done very easily within the Software Landscape metaphor by using techniques such as path
erosion.
A n application o f this visualisation to other program comprehension techniques can be found when
looking at slicing. This metaphor suits taking a "slice" through the landscape since i t is a view common to
geography textbooks. This slice of the landscape is capable o f being used to visualise much more than
slicing data but i t is a logical use o f the slice metaphor within the landscape metaphor. Many different
visualisations could be projected onto the slice, based on where the slice was taken f rom, and on the data
being examined, but ultimately, the comprehension aid o f slicing can be incorporated.
A program slice aims to reduce the number o f lines o f code to be looked at when investigating specific
variables - this can be used to good effect at the method level when debugging and forward and reverse
engineering the code. Slicing then has a constrained section o f code in which to be applied and the results
(a generated subset o f the code) can be visualised in conjunction with the original method code. The use
o f the landscape slice would, i t should be pointed out, not necessarily create a view of layered strata as
may be expected, although this is certainly one strong metaphor extension worth investigating.
6.3.4 Fu l l Mapping
The Java language elements can be mapped to the different visualisation levels as shown in Table 6-5.
Visualisation. Level Code II I erne nt
Landmass The software system as a whole.
Region Directory structure, which maps to the packages in Java.
Valley and surrounding highpoints. Class (contained within the specific file)
Peaks Methods.
Table 6-5 - Actual mappings from Java code to graphics
Navigation and orientation pointers are vital in any visualisation terrain. Without them the user is quite
l ikely to become lost in the mass o f data, and this would be detrimental to the discovery o f information
(other than by accident). I t is also confusing for the user to become lost and should this happen as a
matter o f course when using the visualisation then they are going to make use o f any and every other tool
to help them in their task. In urban environments standard features o f these types o f dwellings can be used
for both orientation and navigation. These features include paths, edges (such as valley boundaries in the
context o f this metaphor), and landmarks. Such features can be incorporated into an alternative style of
landscape by using replacements for each one. Paths around streets can immediately be replaced by
defined paths around the hills and valleys o f the Software Landscape. Landmarks can also be found in the
natural construction o f the landscape, such as a distinctive shape to the top o f a peak. They can also be
- 117-

Virtual Software in Reality Claire Knight Reality; Mappings and Metaphors
found in man-made features such as cairns. Constructions such as cairns are also used fo r wayfinding
when visibi l i ty in these outdoor landscapes is poor (as long as the route being fol lowed has been marked
with them!).
Layout wi th in an environment that tries to model nature is a d i f f i cu l t proposition. I t may be that the best
way of creating such a space (virtually) is to use genetic (adaptive) algorithms that are given a partially
defined landscape as a starting point. This could be done using random generations o f landmass size,
shape, and peak location and then letting the algorithm (as long as suitable encoding could be used)
"evolve" the initial visualisation layout f r om this.
• - 1. LANDMASS (SYSTEM) - II . REGION ( P A C K A G E / D I R E C T O R Y ) — Il . l N A M E
11.11 F ILES T H A T ARE PART O F THE PACKAGE - III. V A L L E Y (CLASS) — I l l . l N A M E
III.II EXTENDS FROM AND IMPLEMENTS (INHERITANCE INFORMATION) - III.Ill PACKAGE CONTAINED IN
I I I . IV F I L E CONTAINED IN I I I V D I R E C T O R Y CONTAINED IN II I .VI LINE NUMBER ( O F FILE) DECLARED O N
— — III .VII ACCESSIBILITY (MODIFIERS) III .VIII IMPORTS
- — I I I .VIX INNER CLASS? - I V . L A K E ( G L O B A L / C L A S S V A R I A B L E )
I V . 1 N A M E IV. I I TYPE IV.I I I V A L U E A T DECLARATION (IF ANY) I V . I V USAGE I V : V LINE NUMBER ( O F FILE) DECLARED O N I V . V I ACCESSIBILITY (MODIFIERS)
— I V . V I 1 C O M M E N T I V . V I I I A R R A Y ? I V . IX C O N S T A N T ?
- V . P E A K ( M E T H O D ) — V . I N A M E
V . l l PARAMETERS V . l l l PARAMETER NAMES V . I V PARAMETERTYPES V . V R E T U R N TYPE V . V I EXCEPTIONS T H R O W N V . V I I USAGE V . V I I I LINE NUMBER ( O F FILE) DECLARED ON V . I X ACCESSIBILITY (PRIVATE OR PUBLIC) V . X O T H E R ACCESS MODIFIERS (SUCH AS STATIC) V . X I LINES O F CODE
- V I . S L I C E O F PEAK ( L O C A L / M E T H O D V A R I A B L E ) V I I N A M E V l . l l TYPE
—— V l . l l l V A L U E A T DECLARATION (IF ANY) V I . I V USAGE V I . V LINE NUMBER ( O F FILE) DECLARED ON V I V I ACCESSIBILITY ( M O D I F I E R S ) / C O N S T A N T ? V I V I I A R R A Y ?
1 V I V I I I SCOPE WITHIN T H E METHOD
Figure 6-13 - Software Landscape mapping specification structure
Since natural landscape evolution does not map well to the sort o f evolution that would be necessary to
model program code then an alternative needs to be found. One o f the ways of doing this is to use the
same generation mechanism for each visualisation version and then let the user ro l l time (forward and
backwards) as necessary. The landscape would then morph beneath their feet! This could be achieved
- 118-
Vir tua l Software in Reality Claire Knight Reality; Mappings and Metaphors
wi th a degree o f familiari ty between versions by imposing limitations on the movement a peak (for
example) could have f r o m its initial placement; any one (or more) o f the three-dimensional co-ordinates
can be constrained in this way.
Some way of merging and then "opening up" clusters o f items is useful. A representation can be used to
indicate a graphical object has such behaviour - i t is then possible to replace existing visual items wi th
this i f an area outgrows its space. The user could then choose to activate such an object and the
visualisation would be expanded ( in some way) to show the detail. This maps well to the higher level
(cartographic) maps o f the country, areas and peaks.
As previously discussed (Section 6.2.8.2), the bending o f space in V R environments is possible. In the
context o f the Software Landscape the bending o f space may not be obvious since buildings are generally
not involved in the visualisation. I t can be exploited across regions, where views within a region cover a
larger expanse o f land than the higher level map would indicate. Space can also be bent at the edges o f
regions. A small amount o f the neighbouring regions w i l l be visible f rom peak tops (as would be
expected) but whilst this w i l l be the edge of the next region the edges may not j o i n (because o f the internal
bending o f space). To overcome this, the outer regions edges' can be bent around so that the landscapes
at least partially match.
Because humans regularly view the world they live in with a map, the highest level view o f the country
w i l l be shown in two-dimensions. This does not degrade the orientation and navigation skills o f humans
since they are unable to otherwise comprehend such a large amount o f spatial data and i t provides one
view of the relationship and relative positions o f the areas and peaks within the country.
The detail at each level can be seen f rom the fo l lowing text. Where thought necessary extra description
has been added to make the mappings as clear as possible. The information in Figure 6-13 provides a
contextual overview of the organisation o f the visualisation elements.
I . Landmass (System)
The entire system is viewed as a map at this level o f abstraction. I t corresponds wi th the view of a country
seen in an atlas wi th squares marking the pages where a detailed view is to be found. These squares can
be located over the areas o f the country containing the next level o f detail.
The shape of the country can be calculated f r o m a variety o f factors:
• Number o f packages in the system
• Number o f classes in the system
• Number o f methods in the system
• Mutations on a circular shape - factors of the above (or others such as the number o f files) cause the
mutations in shape.
- 119-
Vir tua l Software in Reality Claire Knight Reality; Mappings and Metaphors
This view can also be displayed as an "active" poster in the various display areas in this visualisation, and
on the piece o f paper carried in the virtual environment for the display o f two-dimensional information.
I I . Region (Package/Directory)
Shown in the map view as a hi l ly area. The size o f the region in this view is as a normalised measure o f
the number o f classes contained in the area. For the first generation o f the visualisation there is no more
than 50% of the country covered in these hi l ly areas to allow room for evolution. Once the country is
filled wi th such hi l ly areas then the visualisation needs to be restructured.
The shape of the various hi l ly areas can be generated by calculating the landscape f o r m based on code
properties. The average height is determined by the number o f lines o f code divided by the number o f
classes (this is normalised across all regions and values at the initial visualisation generation). There is
then some statistical variation o f this number to create the rol l ing landscape view rather than a f la t plain.
The number o f classes also influences "dips" in the overall landscape to provide visual contextual
information. Since each class is represented as a valley (more information below in I I I ) then an
appropriate number o f lower areas need to be provided in the landscape generation.
I L L Name
In the map view this information is presented as text over the relevant part o f the landmass when requested
by the user. This information is also available lower down the visualisation hierarchy to support
comprehension and investigation f r o m several levels o f abstraction.
I I . I I . Files that are part of the package
This information is represented as an attribute o f the classes visualised; i.e. which file contains the class
source code. Queries can be initiated f r o m this level and the appropriate area can be highlighted to allow
for "digging down" o f information f rom various contexts thus supporting several ways o f comprehending
the underlying code.
I I I . Valley (Class)
This use o f sub-areas within regions is because (a) i t maps to reality in breaking up a large area into more
manageable cognitive and visual chunks and (b) because i t allows classes to be distinct areas within the
main h i l ly area. I n this way i t provides a small degree o f information hiding by keeping any class detail
contained. Whi ls t views o f the other classes are available (due to vision in an open landscape) detail
cannot be ascertained f rom the distances involved. "Space bending" can also occur in that the view in the
map can be smaller then shown in detail as long as the main areas and peaks correspond so as not to
destroy cognitive clarity.
The landscape formation o f the packages dictates the shape of the overall scene, but since it is possible for
there to be more than one class in each package, the class information is represented as a valley. The
valley shape is generally glacial with space and shaping to accommodate a lake (used to represent
- 120-
Virtual Software in Reality Claire Knight Reality; Mappings and Metaphors
variables, more information below in I V ) . The overall structure o f the peaks surrounding the lake is
determined by the landscape shape as formed for the package, but there needs to be a peak (at this level o f
detail) for each method.
I I I . I . Name
To provide information on, amongst other things, paths to the required code detail, and the location o f
various pieces o f information, the equivalent o f a National Trust and/or Tourist Off ice exists in each area.
This shows the name o f the sub-area (class) on the outside o f the building, and on data the user can get
f r o m the off ice that can be displayed on the piece o f paper their virtual representation carried around for
the viewing o f two-dimensional information within the environment.
I I I . I I . Extends from and implements (inheritance information)
This information is presented in the office located within the class. I t is shown as a map (overview level
since the extends and implements hierarchy may extend beyond the package structure) which the user can
then use to facilitate navigation and orientation between the two locations. This mechanism allows users
to work up through the class hierarchy, and conversely i f in a location which is subclassed, to then move
to the location o f that subclass.
I I I . I I I . Package contained in
Signs around the offices show this, since i t is displayed underneath the class name as the park authority
name. I t is also displayed on signs around the boundaries o f the area, thus denoting the extents and
limitations o f the package within the landscape.
I I I . I V . File contained in
This is presented as an attribute o f the class within the off ice. There is a board within the of f ice that
displays "local information". The file the class is contained in is one o f the pieces o f information that is
classed as local information.
I I I . V . Directory contained in
The "local information" board in the off ice displays this data, and the latter part o f the directory name
(assuming the code does not belong to the default package) also provides an indication o f the package
name.
I I I . V I . L ine number (of file) declared on
The line number o f the class declaration is presented to the user on the "local information" notice board.
I I I . V I I . Accessibility (modifiers)
The range o f modifiers that apply to this class are shown on the "local information" board. I f the class is
public then the off ice has a flagpole rising f rom the centre o f the roof, f ly ing a f lag to indicate that this
- 121 -
Virtual Software in Reality Claire Knight Reality; Mappings and Metaphors
class is accessible. The use o f the f lag makes i t clear f r om above (by air) and f r o m the nearby peaks that
this class is accessible to all who import the package.
I I I . V I I I . Imports
A n y classes and/or packages that a class imports are shown on the "local information" notice board.
I I I . I X . Inner class?
This w i l l in part be indicated by the fact that the class name contains dollar characters (scope indicators by
the definit ion o f the Java language).
I V . L a k e (Global/Class Variable)
I t could be that the number o f class variables far outweighs the number o f methods in that class (and hence
prevent such a construction based on geography). This visualisation w i l l deal wi th the problem by creating
a single lake in which landing stages are used to represent class variables. The number o f these variables
therefore influences the size o f the lake. As a second visual indication the relative size o f the lake to the
peaks when viewed f r o m the surrounding landscape provides an idea o f the number o f these variables.
For each variable there w i l l be at least one (array variables requiring more, see below fo r more detail)
landing stage representing various attributes o f the variable.
I V . I . Name
The name o f the variable is shown on a display board to the side o f the landing stage close to where access
to the landing stage can be found.
I V . I L Type
The type o f wood used in the landing stage (more so the colour o f the wood therefore removing the need
for users to be experts) reflects the type o f the variable. Dark wood shows primitive types whilst pale
wood is used for composite types. The actual type is available to the user on demand in one o f two ways.
As with all class variable information, when on a landing stage the users two-dimensional virtual sheet
displays a textual summary o f the graphical information with facilities for viewing the code. In addition
they can request the type which w i l l appear floating over the landing stage for a short time.
I V . I I I . Value at declaration (if any)
I f there is an init ial value (at declaration time only, not the first value assigned to the variable) then this
w i l l be displayed visually through a boat, moored at the appropriate landing stage. The actual ini t ial value
w i l l then be visible when the user examines the boat.
I V . I V . Usage
This information is available on demand on the display board at the entrance to the landing stage. It is
also shown through paths that lead o f f in the direction o f peaks (methods) that make use o f the variable
(for local usage). These paths lead o f f towards the peaks as much as is feasible within the landscape and
- 122-

Virtual Software in Reality Claire Knight Reality; Mappings and Metaphors
for navigation they are accompanied by signposts showing the peaks that can be reached by fo l lowing
(and sticking to) the paths. The wider the path, the more uses i t makes of the various variables.
IV.V. L ine number (of file) declared on
This is displayed on the display board along with the name of the variable.
IV.VI. Accessibility (modifiers)
By the defini t ion o f the Java language class variables are in scope throughout the class they are declared
in . This means the only important issues are whether the variable is public and can be accessed outside o f
the class and whether i t is static and therefore has one value regardless o f the number o f instances o f the
class.
A l l landing stages have a gate for gaining access to the landing stage. For public variables this gate does
not exist, indicating that i t is publicly available. This means for other modifiers the gate must be used.
Static variables are indicated visually though the use o f flags on the landing stage; these indicate to the
user that the variable is different, and that the alteration o f the value o f the variable can occur f r o m many
instances o f the class. The actual need for such visualisation differences is reduced in the current static
visualisation, but should the visualisation be extended to dynamic information then it becomes much more
important.
rV.VII. Comment
This is shown on the display board along with the name of the variable. The display containing the
comment is scrollable; an instance o f where a magic feature o f the implementation technology overrides
what would happen in reality. The reason for this choice is that the comment text may be large and this
solves the problem o f displaying i t in a f ixed size. This information equates wi th the river information and
local history that is l ikely to be found on signs in real landscapes.
IV.Vm. A r r a y ?
I f the variable is an array (of any dimension) then i t is represented visually by the use o f another two
landing stages thus creating three landing stages very close together to represent the one variable. The
visual attributes o f the different landing stages are exactly the same, and the same information is available
by querying any o f the three.
IV. IX. Constant?
I f the variable is constant then it should have an init ial value at declaration time and therefore a boat w i l l
be moored at the landing stage. To indicate that the value is fixed, the mooring point is chained and
padlocked to indicate that it cannot be "altered", i.e. another boat cannot be moored there!
V. Peak (Method)
- 123-
Vir tua l Software in Reality Claire Knight Reality; Mappings and Metaphors
The intention is to try and cluster peaks that use global variables closer to the lake (as much as is
possible). A t the initial generation there would be dummy spaces, lower level cols that over time could be
formed into new peaks to enable the landscape to evolve to some degree to account for changes to the
underlying code.
The shape of the peak is determined by various attributes o f the method. The basic shape is a cone, and i t
is then deformed using various factors. The height o f the peak is determined by whether the method is
public, private or not specified. The public methods w i l l have a height o f x, private ones o f x - y and
unspecified ones as x - z. The radius o f the base (before deformations to merge the peak into the
landscape contours) is a normalised value o f the number o f lines o f code in the method.
V . I . Name
The name o f the method is displayed on signs in several places around the peak. I t is shown on each path
that leads up to the summit o f the peak at the lowest point the path is on the peak. I t is also displayed on
the summit. Each peak also has a path around its base (or as near the base as the landscape generation
allows) to enable users to reach other paths and explore other nearby peaks.
V . I I . Parameters
Each parameter is represented as a path to the summit o f a peak. These are arranged in a radial pattern
around the peak, making complete use o f the 360° space. The lower the number o f parameters, the more
gaps between them.
V . I I I . Parameter names
The parameter names are displayed on the paths used to represent that parameter on the peak.
V . I V . Parameter types
These are again split into representing primitive or composite types. Primitive types cause the path to be
represented as gravel whilst composite types have a more grassy path (although still distinct f r o m any
surrounding grass on the side o f the peak). Detail o f this information (for example the type name exactly)
is available along with all other method information on the two-dimensional sheet that users have
available to them in the environment.
V . V . Return type
The return type is shown on the signs used to display the name of the method.
V . V I . Exceptions thrown
For each exception thrown by the method, a tree exists on the lower slopes o f the peak. Information about
the exception (i.e. which one) is available when the user examines the tree.
V . V H . Usage
- 124-
Vir tua l Software in Reality Claire Knight Reality; Mappings and Metaphors
This information is not currently collected because absolute knowledge o f which method is called and
used in an object-oriented language cannot be determined until runtime due to overloading and
inheritance.
V . V H I . L ine number (of file) declared on
This is displayed on the sign with the method name and return type, and for clarity the f i l e name is also
displayed. As wi th all information it is available on the two-dimensional sheet which displays information
in a context sensitive manner unless the user requests further information.
V . I X . Accessibility (private or public)
Whether a peak is public or private is used to guide the height o f the peak. Because the ability to judge
size is dependent on location, distance away f rom the item of interest and the sizing o f nearby objects
(which are used as visual frames o f reference) an extra indication the type o f vegetation the peaks are
covered by. Private methods are covered in moorland whilst public methods are grassy.
V . X . Other access modifiers (such as static)
This information is displayed on the two-dimensional sheet o f information. In addition, static peaks are
represented visually through the use of boulders strewn across (primarily) the lower slopes.
V . X I . Lines of code
This value is used to create the shape of the peak and is available on the two-dimensional sheet o f
information but it is otherwise not listed explicitly.
V I . Slice of Peak (Local/Method Variable)
A slice o f the peak displays local variable information pertinent to that method. This is displayed in an
adaptation o f a strata diagram where the layers displayed by the slice are used to represent scoping levels
throughout the method. The variable detail is then displayed within this structure, in a quite abstract way
as crystals o f information throughout the strata. This representation is able to show not only the number
and level o f scopes, but how they change throughout the code of a method. I t also provides a convenient
way of representing the number o f lines o f code involved, the creation and usage of local variables and
also class variable usage in the context o f the local scoping o f the method.
V I . I . Name
This is displayed (on demand) floating over the crystal in the slice that represents its declaration.
VI.n . Type
Whether the type is composite or primitive is reflected in the crystal used to represent the variable.
Variables that are o f a primitive type are shown as a crystal composed o f triangular prisms whilst
composite type variables are square prism based leading to more cuboid prisms. Detail about the type is
- 125-
Virtual Software in Reality Claire Knight Reality; Mappings and Metaphors
available on the two-dimensional sheet o f information and can also be accessed by clicking on (or
querying in some way) the crystal.
V I . I I I . Value at declaration (if any)
Should the variable have an initial value, the fact is shown visually by having a sphere embedded in the
crystal. These crystals are translucent to allow any inner information to be visible. Again detail (such as
the exact init ial value) can be found on the two-dimensional shape and by querying the sphere in the
crystal.
V L I V . Usage
Marks exist wi thin the strata to indicate when each variable is used (for any operation). These marks are
in line with the variable in the strata so i t is clear which variable is being used.
V I . V . Line number (of file) declared on
This is shown by the position in the slice. The lines o f code increase f r o m lef t to right, from the start o f
the method to its end.
V I . V I . Accessibility (modifiers)/Constant?
I f the variable is constant then a red wireframe cube is drawn around the crystal.
VI.Vn. A r r a y ?
Should the variable be an array then the crystal icon used at declaration time is copied twice to give a
collection o f three identical crystals.
V I . V I I I . Scope within the method
These are "pathed" using forward slash as the root for the top level o f the method. Af ter that a name
fol lowed by an instance number o f the type o f block is used (with a forward slash again) for each block
level entered. This information is shown graphically through the use o f the strata in the slice.
As with the Software World mapping, there are a number o f issues that are described in the above text as
part o f the Software Landscape mapping specification, but also have a wider impact on the visualisation.
The fo l lowing four sections address these important issues; navigation, scalability, automation and
evolution.
6.3.5 Navigation
As wi th Software World, navigation and orientation within Software Landscape are buil t into the mapping
and representation decisions made in the context o f the metaphor o f countryside, and at the higher level o f
abstraction, cartographic principles. Again, as for Software World, independent o f the implementation
- 126-

Vir tua l Software in Reality Claire Knight Reality; Mappings and Metaphors
software used (and therefore the control mechanisms available to the user for moving around the virtual
environment) Software Landscape caters for navigation in its use o f features that have been identified as
beneficial to navigation and orientation. These include paths, landmarks, districts, nodes (mini
landmarks), and edges. These are not necessarily as obvious in the countryside landscape as they are in
the urban landscape of Software World, but they have been integrated where possible. Examples include
the paths around the landscape, the splitting up o f the landscape into valleys and peaks (districts) and the
use o f huts to both contain information possibly required by the user and also to act as orientation
placements for the user (landmarks and nodes). There is also the use o f delimiting markers around the
landscape area that represents a package (edges).
6.3.6 Scalability
Software Landscape was designed wi th the same principles in mind as for Software World. Because of
this the scalability issues are similar relate to the range of classes, packages and files that can be used in a
software system. The mapping takes this into account by providing mechanisms that not only act as
abstraction levels but also allow a sensible breakdown of visualised components. This allows for each
level to accommodate a wide range of underlying data items. This is obvious at the package and class
level; since a package can and does contain many classes, then a region is used to represent the package,
thereby leaving the opportunity for many classes to be represented as peaks within the region. The same
is true o f the class and method level; the size o f the peak (once inside that part o f the landscape) is
dependent on the number o f methods in the source code and the layout and shape of the landscape around
the peaks is adjusted accordingly.
6.3.7 Automation
T o automate such the landscape visualisation requires that the representations chosen are available in
some way in a library o f visual objects and then amalgamated with algorithms used to generate terrain.
These can then be used with various layouts and the actual data in order to create the virtual environment
automatically. Software Landscape and Software World are the same in their expectation that such
representations are available. Once they have been defined, then they can be used at w i l l in any
generation.
- 127-
Vir tua l Software in Reality Claire Knight Reality; Mappings and Metaphors
6.3.8 Evolution
The fo l lowing provides a description o f the Software Landscape in the context of evolution. The
evolution in question is the underlying code (i.e. the software system that the graphics are representing)
changing.
The initial generation o f the Software Landscape is done with evolution (and hence space for i t ) in mind.
The spacing o f the regions throughout the country is done to allow space for regions to change and more
to be added over time. Obviously once the extra space has been used, the visualisation w i l l st i l l need
restructuring, but should the code change that much it is highly l ikely that many areas of the visualisation
w i l l be suffering f rom poor layout and clustering o f representations anyway.
There is an issue with this particular mapping and metaphor, in that natural evolution is not going to
necessarily be a good way of showing the evolution o f the data. Landscapes evolve in fa i r ly wel l
understood ways and adhere to certain principles as they do so whereas code evolution can be very
disorganised and even disruptive to existing code on a frequent basis.
The amount o f change a method has undergone during its " l i f e " is an important characteristic o f that code.
Such information would be presented at the peak level (for changes to code within a method) so
visualisation o f this needs to complement the other visual representations used for the standard method
attributes. This is one area in which the real l i fe evolution issues can work wi th code change. Since the
visual display is about showing the amount o f change rather than what exactly has changed, then such
representations as erosion and the creation o f new paths by users of the environment can be used on the
peak. These show that the underlying method has existed for some time and during that time has changed.
6.3.9 Concluding Remarks
This visualisation is similar to Software World because o f its use o f real world items and relationships to
present the code, but i t differs in the views and representations employed at the various levels o f
abstraction. I t is appreciated that the slice o f a peak (viewing information inside a method) has moved
towards part abstract visualisation, but it is suitable for the information being presented. This is
something visualisation designers should bear in mind; information being drawn very often drives the
presentation metaphor and style. Again, some o f the evolution considerations have been included in the
main mapping o f this visualisation metaphor to illustrate that this is another issue that visualisation
designers need to consider f r o m the outset i f they wish to make the use of such a visualisation coherent
when the underlying data changes.
- 128-
Virtual Software in Reality Claire Knight Reality; Mappings and Metaphors
6.4 Summary
The two visualisations presented show two ways, albeit wi th similar ways o f dealing with certain issues
and both targeted at the visual representation o f Java source code, o f creating three dimensional
visualisations that can be implemented and used in virtual environments. Both visualisations demonstrate
that by providing a logical and explainable framework for the visualisation at the outset, both the usability
and any changes to the underlying code and hence the visualisation can be understood and managed
(mentally) by users o f the system. This comprehension and maintenance o f the existing mental model
provides a powerful way of enhancing such tasks as program comprehension as wi th each code release the
existing knowledge that has already been built up provides a basis for the new comprehension required.
The greater the level o f knowledge the stronger (according to program comprehension literature) the
mental model and hence the more information the decisions over any changes to the code.
These visualisations are novel not only through their use o f three dimensions, but because they have a
predominantly real world bias in the representations used and the interactions permitted. This may only
be suitable for certain underlying information sources, or for certain tasks (such as the Java language
dictating certain mapping decisions) but to disregard such techniques without application and
investigation w i l l not enhance the software visualisation capabilities. Neither w i l l i t lead to the creation o f
better and more powerful program comprehension aids. Both o f these are desirable, and therefore these
visualisations provide a glimpse through the still partially closed door o f that area o f program
comprehension tools and software visualisation.
- 129-
Virtual Software in Reality
Chapter Seven - Implementation

Virtual Software in Reality Claire Knight Implementation
7.1 Introduction
This chapter provides an overview of the implementation o f a prototype and associated tools that
demonstrate the Software World visualisation presented and discussed in the previous chapter. The V R
system used for the visualisation is introduced, and this is then fol lowed by a discussion o f the limitations
o f using such technologies. These limitations are not just down to particular choice o f implementation
mechanism, but are true o f almost all V R engines available at the moment. Following this, more detailed
automation issues are presented to show the limits and the technological demands o f such a process.
Whils t Vi r tua l Reality (VR) technology has moved forward rapidly in the last few years i t is st i l l not at a
level which enables al l desirable features o f the visualisations designed for this work to be either (a)
implemented at all or (b) implemented via automatic generation processes. I t is also the case that the
research being done focuses on the visualisations and not the implementing V R technology for the simple
reason that there are several research groups o f many people working on the V R technologies. A l l o f
these groups have spent many years on V R technology, have more experience in this field and they are
making good inroads into solving the current limitations.
7.2 Visualisation Implementation
For the purposes o f this work the V R engine known as M A V E R D C 1 [Hubb96] has been adopted as a
suitable mid-level implementation system. I t allows a good degree o f sophistication to be built into the
virtual environments but also the C code required to describe the world can be automated wi th success.
This has been shown by the creation of a toolset that takes the specified Java source code and generates
district visualisations f r o m them by creating the C source code necessary for the environment.
7.2.1 Introduction to Maverik
M A V E R D C is actually derived f r o m MAnchester Vir tual EnviRonment Interface Kernel. I t is a C toolkit
for constructing single user V R applications. I t is a mid-level virtual environment creation tool because it
allows the creator great freedom over what can be created and managed but it does not require them to
write routines to deal wi th the intricacies o f drawing three-dimensional graphics.
M A V E R I K provides an infrastructure in which a (complex) virtual environment can be created, managed,
viewed, interacted wi th and navigated around but does not make any further assumptions about the
Developed at the University o f Manchester, U K . For more information see http://aig.cs.man.ac.uk/.
- 131 -
Vir tua l Software in Reality Claire Knight Implementation
environment or its uses. Since it is provided as programming level toolki t (C code) then there are no
virtual environment issues forced upon the world being created, although through the use o f C code i t has
the ability to deal directly with an environments' data structures and algorithms. This is only i f the creator
makes the M A V E R I K wor ld aware o f them in the initialisation code!
There are several services that M A V E R D X offers applications that use its code:
• A framework for managing the display and interaction requirements o f that application
• A spatial management system of the objects in the three-dimensional environment
o High performance culling, navigation and collision detection algorithms
• A set o f default primitive objects with which more complex objects can easily be created
• Support fo r different V R input and output devices
• Both two and three-dimensional navigation techniques, using amongst other things two-dimensional
and three-dimensional mice and a keyboard.
M A V E R D C applications (as long as they are compiled for the target platform) can be run on several
platforms using the appropriate OpenGL libraries:
• SGI I r ix
• Solaris/SunOS
• Linux
• Windows 98 & N T
On PC based operating systems M A V E R K is also able to take advantage o f the hardware acceleration
available on some graphics cards (primarily the 3 D f x Voodoo chipset).
7.3 Virtual Environment Technology Issues
The implementation o f a f u l l y featured and complete multi-user Software World visualisation is not, at this
moment in time, a feasible proposition for several reasons. The main one being the limitations o f the
virtual environment software available.
There are many specialised virtual environment systems and packages, but bearing in mind that the aim of
these visualisations is as an aid to program comprehension, then realistically the virtual environment
system has to be able to run on a desktop computer. I f it requires too much specialised hardware then it
becomes a luxury that businesses cannot and (quite rightly so) won' t adopt. W i t h i n the l imitation o f being
able to run on a desktop, there are also limitations as to what is (a) achievable in terms o f creating virtual
environments and (b) the degree to which the creation can be automated. Unfortunately there is usually a
trade-off between (a) and (b). This means that the more sophisticated visualisations that can be created,
the less automatable control over them.
- 132-
Virtual Software in Reality Claire Knight Implementation
Automation is also an important driving factor for acceptance by business users, and even other
researchers. To have to spend many hours painstakingly creating a virtual environment before it can even
begin to be used for the purpose it is intended is going to deter all but the most keen. Technology, given
enough time, resources and skilled programmers, is capable of creating the visualisations with all the
usability features described in the previous chapter but the time and resource demands are not feasible for
almost all situations.
7.3.1 Limitations of Maverik
Whilst M A V E R I K is a good compromise between flexibility and automation, while still allowing the
creation of complex environments it is not without its limitations. These can be subdivided into
limitations due to the technology constraints imposed by M A V E R I K and then the limitations imposed by
the design decision of placing automation above the type of worlds that can be created. The next two
sections provide some example areas where such limitations exist.
7.3.1.1 Limitations Due to Implementation Issues
At the moment the M A V E R I K system is only capable of creating and managing single user virtual
environments. A complementary system (Deva) is also being developed by the same research group to
support networked multi-user environments but at the present time is not released for general usage. Deva
works as another layer on top of M A V E R I K SO implementation work done now will still be valuable for
multi-user environments.
The use of the word "created" here is used to mean either implementation or automation of the
implementation (hence rendering the visualisation too time and effort consuming to be of any real use).
Currently these areas of the Software World cannot be created:
• Communication between users. There are technologies around (such as ICQ) that enable messages to
be sent between users on a network but these are not currently integrated with VR technology.
« Linking PC applications (such as a mail reader, word processor, code editor, etc.) into the VR
environment - as for the user's virtual office space - is difficult. Much of the VR software available
does not run on PCs and whilst there is code available for emulating PCs on, for example, Linux, it is
time consuming and complicated. A recent move as part of the ongoing development and refinement
of M A V E R I K has led to it being possible to compile and run environments in Windows. Whilst this is
still very much experimental, it will make it easier to realise the linking of other applications into the
virtual environment.
- 133-
Virtual Software in Reality Claire Knight Implementation
» The transportation mechanisms described (other than walking), whilst technically possible within
virtual environments (e.g. in games such as Quake), require specific coding in the technology being
used for this work. The map (virtual world) creation facilities of Quake 2 allowed teleport positions
to be represented graphically and then the engine read the map file and created the "jump" points
semi-automatically but this is not available in all V R systems.
• To create a fully functional message board system would require the ful l integration of a repository
with whiteboard style features. This is not technically impossible, but is not integrated into the V R
software systems. There are text based systems that could be tied in more easily, but the idea is to
create a visually consistent environment. Since there has already been proof of concept over the use
of messages, to implement a partial solution is a backwards step.
• An extension of the visualisations to show animated two-dimensional images or three-dimensional
worlds on what could be considered a screen in the environment is classed as a future extension
because of the technological implications of integrating a V R world display within a V R world.
• Automation of many of the designed features is also a problem at the moment - because of the way
the V R environments are created in the various systems available. M A V E R I K at least allows building
blocks of AC3D models to be incorporated, although the drawback of this system is the generation of
C code then requires a second compilation step. Another problem that this then brings is of visual
and rendering efficiency. M A V E R K seems much more able to deal with models built up in it's own
primitives rather than dealing with imported polygon models. Other V R systems make it very
difficult to generate complex scenes automatically and whilst graphical creation of worlds is very
useful for one off creations, for software visualisations it is not feasible.
7.3.1.2 Limitations Due to Automation Issues
Many of the automation problems can be related back to the current state of the art with V R technology.
I f the technology was better able to deal with the visual representations or desired interaction then the
necessary code could much more easily be integrated into an automatable process.
An example of this is the virtual paper concept that users of the visualisation system have to be able to
view and interact with two-dimensional information. To create a smaller virtual space of limited
dimensions (i.e. two not three) and limited interaction is feasible. To then embed this in another
environment is also probably achievable with current technology. What is not, without much dedicated
coding, is the creating of the entire virtual paper concept with its ability to store and retrieve information
from elsewhere and to act as a way of moving around the virtual environment. Since such a concept
requires a large amount of coding it is not, at this moment in time, a suitable addition to an automated
software visualisation.
- 134-
Virtual Software in Reality Claire Knight Implementation
The fully featured visualisations also move between two-dimensional maps (albeit displayed in three-
dimensional space) where the user is focusing purely on either query or interaction with the map through
to fu l l three-dimensional environments. At the moment, to be able to achieve this would require creative
use of graphics to display certain parts of the information and certainly the transitions between views.
Again, this is probably achievable in a technology sense but requires a large amount of code specific to
the current application which rules out the use of such techniques in the automated software visualisations
presented in this thesis.
7.4 Automation Issues
The automation of the generation of the Software World visualisation from the repository of Java source
code information is a non-trivial problem to solve. The input to M A V E R I K is a C source file that is then
compiled using the MAVERDC libraries. This requires suitable C code to be generated to create the
requisite visualisations. The outcome of this is that there are three issues to deal with;
1. the generation of a complex visualisation metaphor realisation automatically
2. the generation of C code that is both syntactically and semantically correct
3. a combination of the visualisation realisation with the C code.
The first of these problems requires that the visualisation components be broken down (graphically) into
smaller units that can be combined to create the required larger images. The second relies on knowing the
functions and necessary code required by M A V E R I K to realise the visualisation images successfully. The
third is merely a joining of the two in the automation process so that the M A V E R I K functions add the
appropriate visual components into the correct places in the complete scene.
7.4.1 Overview of Process
There are several steps to the automation process, each of which is listed in overview here:
1. Parse the source file (information added to repository).
2. Extract the information from the repository.
3. Create M A V E R I K source files (C code).
The final step is then:
4. Compile and execute...
These steps all involved different levels of work and involvement, both in underlying coding effort and in
the view the user has. For example, the first task required both a lexer and parser to be written for the
entire Java 2 (JDK 1.2) language specification. Whilst many of the compiling intricacies can be ignored
- 135 -

Virtual Software in Reality Claire Knight Implementation
keeping track of all the "syntactic sugar" for storing in the repository and hence for visualisation purposes
adds several different overheads.
The second step is based on user input so that the desired visualisations are created rather than any having
to generate from only a certain subset of available source files. The user needs to provide enough
information for the required components to be extracted uniquely from the repository (or some form of
choice supplied i f more that one high level match is found). This can be done both interactively and from
a stored specification file; the two methods are provided as a user convenience and because the first is just
a front end to an automatically generated specification file. Once the information has been selected then
all the related pieces of data can be extracted from the repository ready for the final step of creating the C
source files.
The generation of the M A V E R I K source requires that the co-ordinates (in three-dimensional space) for all
the graphical components have been calculated and also that the appropriate graphical components have
been selected. Once this has been done, gaps in a template form of the C code can be correctly filled in to
generate the ful l C file.
The final step has to be done in the operating environment of the visualisation so that the appropriate
M A V E R I K links (especially relating to the graphics hardware being used) are compiled into the program.
Each executable visualisation is therefore dependent on the environment in which it was compiled,
although such environments can be recreated across machines with the same graphics hardware.
7.4.2 Automation in Detail
This section details the actual work being done to create the visualisations and is presented step by step
since both logically and in reality the process is split at these points. It is also possible to carry out the
earlier steps without proceeding to any visualisation generation.
7.4.2.1 Parsing the Source Code
The source code that is read by the parser is assumed to be syntactically correct and able to be parsed by
the Java 2 compiler produced by Sun. There are a few isolated areas in which this tool provides a slightly
looser parse than Sun's compiler but this partially relates to semantic issues and is not of any concern for
the visualisation process. Should the source contain syntactic errors or the parser fail then an exception is
thrown. Any front end utilising the parser should deal with this exception in a "graceful" manner; the
command line version of the parser outputs the exception text and stops. The graphical front end that is
-136-
Virtual Software in Reality Claire Knight Implementation
used for the generation of MAVERIK source files is able to capture the exception and displays the error
message to the user in the status window and is able to carry on running.
The parser deals with each file in turn and stores any completed and unambiguous information directly in
the repository. There is an auxiliary tool that can be run to try and resolve any symbol usage currently
unresolved (these symbols are generated by each file parsed for those outside of the current file). This is
best done when visualising as a last step, as all undefined references to symbols which can then be
resolved will be possible after all source files needed (for the visualisation) have been parsed.
At the command line the tool can be executed by typing:
java ck .xre f . JavaParser <filename>.java <full_path>
The reference resolution tool can be executed by typing:
java ck.xref.ResolveSymbols
This does assume that the classpath, binary directory of the Java installation, and the ODBC data
destination location have been suitably set.
7.4.2.2 Extracting Information
The information that is extracted from the repository is based on the visualisation that the user wants
generated. This means that the class (for a district), file (for a city), package (country) and system (world)
wil l be known. Based on the information required and what is known, a series of queries are used to
interrogate the repository. The results of these queries are then amalgamated into the necessary
information for the generation of the source code. Once the data is known, the placement and co-ordinate
generation can be done. Currently, the information is extracted on a file by file basis.
7.4.2.3 Generating MAVERIK Source
A l l MAVERIK source files have a basic format:
o M A V E R K initialisation
• Definition of objects in the virtual world
o Definition of application behaviour (i.e. responding to interaction, navigation etc.)
• MAVERIK rendering and interaction loop - this loop runs the virtual environment and is only exited
when the application finishes.
• Each loop cycle reacts to events and renders a frame of the environment
- 137-
Virtual Software in Reality Claire Knight Implementation
This format maps well to the structure of the C code needed. The main(int argc, char* argv[]) function
calls the initialisation code, functions to create the necessary objects, and then code that contains the
rendering loop. The application rendering and interaction are dealt with by the code inside the loop
structure.
From the intermediate information extracted from the repository the MAVERUX source code files can be
created by adding in co-ordinates and building up visual entities from the smaller building block models.
These smaller building block models have already been created in M A V E R I K through the coding of a
library of base objects for the Software World visualisation. Once the library has been declared, and the
header file included in user source files the objects defined can be used in C code as would any of the
standard M A V E R I K objects. Once the objects have been used, then M A V E R I K interacts with them in the
same way it would any of it's own objects due to the callback nature of the implementation. The coding
of this library is a once only task for the visualisation and so once a metaphor and visualisation design has
been accepted only a small amount of initial investment is necessary.
7.5 Summary
This chapter has provided a summary of the implementation process with M A V E R I K and discussed the
related issues of automation and technology limitations. The implementation overview provides enough
detail of the salient issues to see how such a technique is applicable to all software visualisations of this
nature, rather than just the prototype of Software World. The automation and limitation issues have been
included here because of the direct impact they have on decisions made about implementation.
It can be seen that many of the arguments of avoiding three dimensions because of implementation and
automation are invalid. Three dimensional environment technologies may not yet be the state of the art
despite public perception, but it is mature enough to show the benefits of software visualisation and the
automation of the graphical environment.
- 138-
Virtual Software in Reality
Chapter Eight - Evaluation; Framework and Scenarios
Virtual Software in Reality Claire Knight Evaluation; Framework and Scenarios
8.1 Introduction
This chapter presents not only an evaluation of the metaphors and representations considered for the
creation of software visualisation environments for program comprehension, but also an evaluation
framework. This framework was developed because of the limitations of existing frameworks when
applied to three-dimensional software visualisation. Taxonomies of visualisation for software
(engineering) exist, as do scientific visualisation and program comprehension tool guidelines but in their
current form provide a poor way of evaluating and thus carrying out comparative evaluation of software
visualisation environments.
The evaluation framework is presented with the rationale used for its creation and justification. After this,
the evaluation framework is applied to the two visualisations presented in Chapter 6; Software World and
Software Landscape. As a further justification for this type of software visualisation, several usage
scenarios are presented and then answered using the Software World visualisation.
8.2 Evaluation Framework
This part of the thesis discusses the evaluation of software visualisation systems, and the development of
criteria to use for such evaluations. Such criteria can also be used as guidelines for the future
development of visualisation systems. The rationale and a discussion of this are presented, and then
followed by the existing guidelines that have influenced this work. The framework is then presented with
an explanation and discussion of it.
8.2.1 Introduction
There are several taxonomies that relate to software visualisation to provide ways of grouping and
classifying existing systems, and to provide design aims for future systems. Other authors have also
written of design guidelines that should be borne in mind for (software) visualisation.
This chapter suggests that the existing taxonomies and guidelines are open to misinterpretation due to the
subjective nature of the classification process. It could very well be the case that one man's representation
is another's visualisation, and vice-versa and the current taxonomies and guidelines seek to categorise
visualisations. The view of this work is that, obviously for comparative purposes, some form of structure
in which to make judgements is useful, but to either numerical or otherwise classify a visualisation based
on a restricted set of criteria is not always a good thing. There is also the issue of three-dimensions; some
- 140-
Virtual Software in Reality Claire Knight Evaluation; Framework and Scenarios
of the issues with three-dimensions differ from those in two-dimensions and the existing taxonomies do
not make this distinction clear.
Is it not better to judge a visualisation on how well it fits the purpose it was designed for? Theoretically
this is the best evaluation to make as it avoids the subjective judgement related to aesthetics. But it is also
a subjective judgement because of the likes and dislikes of the person or persons making the decision.
Another problem is that all tasks, domains, users and any combination of these differ. This means that a
comparative evaluation framework relying heavily on subjective judgements is meaningless, unless each
visualisation system is evaluated for the same task in the same domain by the same user (good
experimental strategy but not a method that is always followed).
Since it is not possible to move completely away from the subjective nature of all evaluations, due to both
human nature and the nature of evaluation, then the evaluation criteria, and hence framework, should be
designed with this in mind. This means that criteria should be based on the visualisation, and also aim to
ask questions with Yes/No/NA answers rather than asking questions such as "to what level does it help
with the task in hand?", "the degree to which..." and "ease of . . . " .
For the purposes of this discussion, the following definitions of visualisation and software visualisation
will be used.
"Visualisation is a discipline that makes use of various forms of imagery to provide insight and understanding and to reduce complexity of the phenomena under consideration."
"Software visualisation is a discipline that makes use of various forms of imagery to provide insight and understanding and to reduce complexity of the existing software system under consideration."
Roman and Cox [Roma93], Price et al. [Pric92] and Myers [Myer90] all define software visualisation
taxonomies as presented in Section 4.3.1. The taxonomies are not considered to be suitable for the
evaluation and indeed the categorisation of visualisations such as those presented in this thesis. A l l of
them do not explicitly consider three-dimensions, and this impacts on some of the other categories that are
used to classify visualisations. In missing such information, the considerations made based on the
outcomes of the classifications could be erroneous.
Young and Munro [Youn98] define some evaluation criteria for software visualisation systems. These,
along with program comprehension criteria defined by Storey et al. [Stor97] (which can be seen in Section
2.6), and visualisation guidelines produced by Globus [Glob94], provide a basis for the definition of this
evaluation framework. None of these existing criteria cover all of the issues that are important for three-
dimensional software visualisations. In response to this various facets of all of these have been used to
develop this evaluation framework.
- 141 -
Virtual Software in Reality Claire Knight Evaluation; Framework and Scenarios
8.2.2 Metaphor Features
All software visualisation systems make use, in one way or another, of a metaphor that acts as a mapping
between the visual components used in the realisation of the visualisation and the underlying code. The
design of this metaphor can greatly influence the usability of the visualisation. It is also true that the code
being represented (or the information for information visualisation) can influence the metaphor; it may be
that only certain metaphors are appropriate for certain data sets.
An example of this is in the visualisation of Java source code. Java code (by the design of the language)
can be classified in a strict hierarchy of packages, classes and methods. Should a metaphor be found that
is suitable for this language it cannot immediately be classified as suitable for all (for example) object
oriented languages. C++ provides an immediate counter-example in that code in a C++ system can be
outside of any class thus breaking the hierarchical arrangement.
Not only does the data set being visualised influence the visualisation based on whether or not there are
already tangible representations of this data in the real world, but the form and classification of that data
can also affect it. With source code the visualisation is trying to represent something that is inherently
intangible so that many metaphors are appropriate. Whilst this free reign with representations exists, the
underlying structure of the data, and the purpose to which the visualisation wil l be used, both affect what
could be considered as suitable solutions to the visualisation of that data.
8.2.3 Software Visualisation Evaluation System
At least one author (Young [Youn99]) has suggested evaluation of software systems based on judging
representations and visualisations as separate concerns. Why should there be this split, with different
desirable properties? It is true that representations are individual graphical mappings (although metaphor
dependent) but is it reajly possible to de-couple desirable properties of representations and visualisations
since there is a strong inter-dependence between the two. Without representations (and the related issues)
there would be no visualisations, and a "random" collection of graphically represented items in no way
constitutes a visualisation.
Based on the information presented above, the program comprehension tool criteria, some of the features
identified in work by Young [Youn98, Youn99] and an article on things to avoid in visualisations this
evaluation framework is presented as an alternative.
For clarity the criteria against which the system can be judged has been broken into three; visualisation
features, comprehension features and features applicable to both. It is therefore easier to make
- 142-
Virtual Software in Reality Claire Knight Evaluation; Framework and Scenarios
judgements within a category and keeping the concerns apart should, in theory, allow the criteria to be
evaluated on their own merit. The reason for the use of the terms visualisation and metaphor is that the
visualisation is the implementation of the interface metaphor and in some cases it makes more sense to ask
the question about the implementation (or future implementation) whilst in others the theoretical metaphor
is of more importance.
8.2.3. J The Framework
The proposed evaluation framework is in three sections; visualisation features, comprehension features
and features that are applicable to both. This separation of the framework was to make clear the possible
separation of concerns when evaluating visualisations.
Visualisation Features
1. Does the level of visual complexity reflect the visualisation metaphor being used?
2. Is the visualisation able to scale to accommodate varying amounts of data?
3. In the first instance can the visualisation be generated automatically?
4. Can the visualisation evolve in a meaningful way (i.e. within the constraints of the metaphor) as the
underlying data changes?
5. Does the visualisation interface (underlying metaphor as well as the implementation) facilitate easy
interaction?
6. Is the representation used (for the visualisation, and hence the metaphor detail) fully and completely
documented in some way?
7. Is annotated information, over and above the graphics, available to the user of the visualisation in
some way?
8. Does the visualisation display extreme data (i.e. possible anomalies) with no problem?
9. Can the visualisation be viewed as both an environment and as still views (even i f the still views exist
within the environment), under user direction?
10. Can the visualisation be viewed from more than one angle, at user discretion?
Comprehension Features
11. Is the visualisation capable of indicating syntactic and semantic relations between data objects?
12. Does the visualisation provide different abstraction mechanisms in some way (this may be through the
metaphor)?
13. Does the visualisation support goal-directed, as needed, hypothesis driven comprehension?
14. Does the visualisation provide an adequate overview of the data architecture and structure ( if one
exists) at various levels of abstraction?
15. Does the visualisation support the construction of multiple mental models (domain, situation, and
program) by enabling information and knowledge gathering in different ways?
- 143-
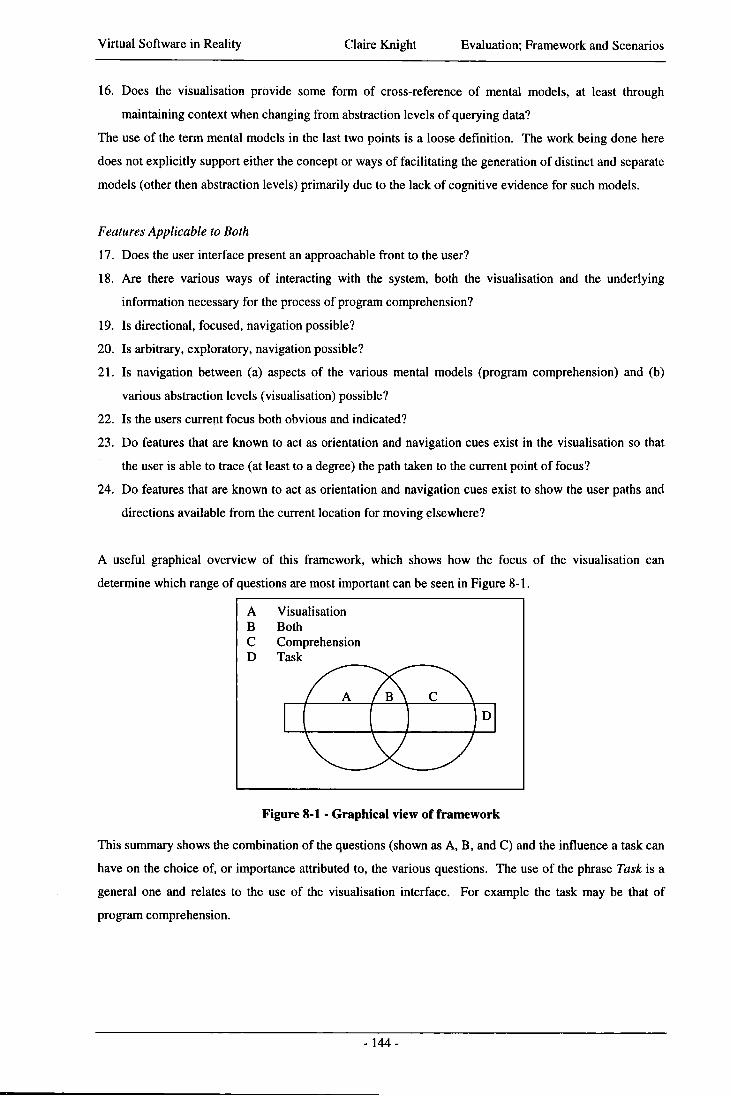
Virtual Software in Reality Claire Knight Evaluation; Framework and Scenarios
16. Does the visualisation provide some form of cross-reference of mental models, at least through
maintaining context when changing from abstraction levels of querying data?
The use of the term mental models in the last two points is a loose definition. The work being done here
does not explicitly support either the concept or ways of facilitating the generation of distinct and separate
models (other then abstraction levels) primarily due to the lack of cognitive evidence for such models.
Features Applicable to Both
17. Does the user interface present an approachable front to the user?
18. Are there various ways of interacting with the system, both the visualisation and the underlying
information necessary for the process of program comprehension?
19. Is directional, focused, navigation possible?
20. Is arbitrary, exploratory, navigation possible?
21. Is navigation between (a) aspects of the various mental models (program comprehension) and (b)
various abstraction levels (visualisation) possible?
22. Is the users current focus both obvious and indicated?
23. Do features that are known to act as orientation and navigation cues exist in the visualisation so that
the user is able to trace (at least to a degree) the path taken to the current point of focus?
24. Do features that are known to act as orientation and navigation cues exist to show the user paths and
directions available from the current location for moving elsewhere?
A useful graphical overview of this framework, which shows how the focus of the visualisation can
determine which range of questions are most important can be seen in Figure 8-1.
This summary shows the combination of the questions (shown as A, B, and C) and the influence a task can
have on the choice of, or importance attributed to, the various questions. The use of the phrase Task is a
general one and relates to the use of the visualisation interface. For example the task may be that of
program comprehension.
A Visualisation B Both C Comprehension D Task
B D
Figure 8-1 - Graphical view of framework
- 144-
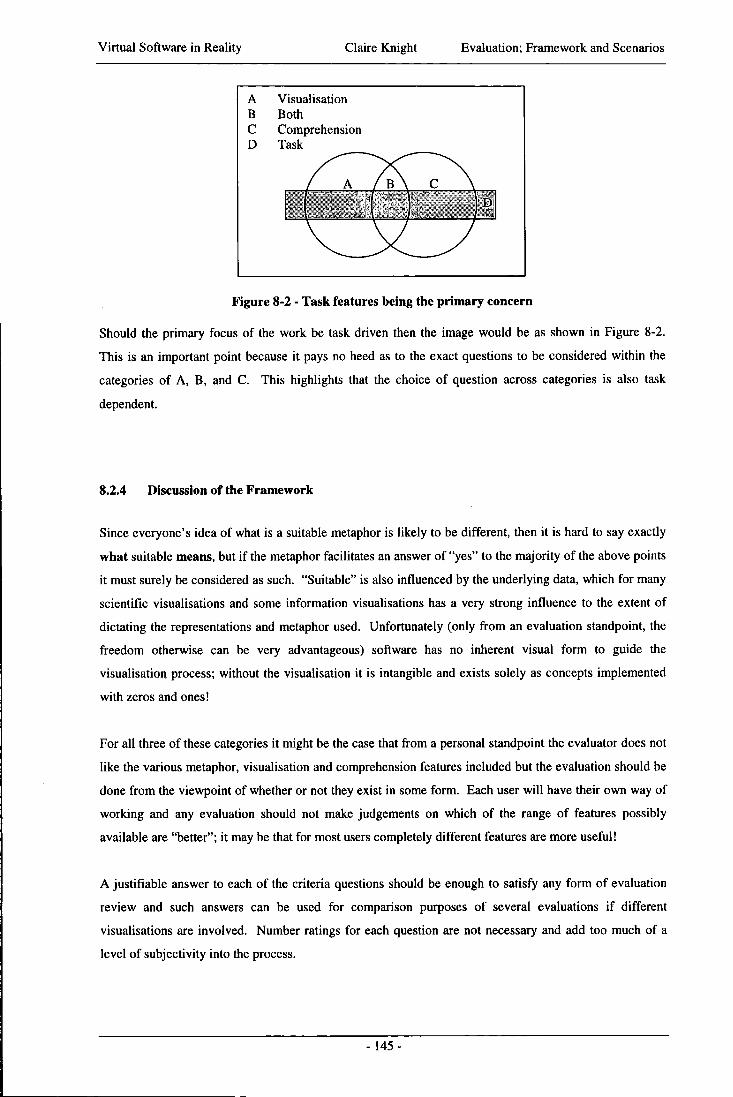
Virtual Software in Reality Claire Knight Evaluation; Framework and Scenarios
A Visualisation B Both C Comprehension D Task
B D
Figure 8-2 - Task features being the primary concern
Should the primary focus of the work be task driven then the image would be as shown in Figure 8-2.
This is an important point because it pays no heed as to the exact questions to be considered within the
categories of A, B, and C. This highlights that the choice of question across categories is also task
dependent.
8.2.4 Discussion of the Framework
Since everyone's idea of what is a suitable metaphor is likely to be different, then it is hard to say exactly
what suitable means, but i f the metaphor facilitates an answer of "yes" to the majority of the above points
it must surely be considered as such. "Suitable" is also influenced by the underlying data, which for many
scientific visualisations and some information visualisations has a very strong influence to the extent of
dictating the representations and metaphor used. Unfortunately (only from an evaluation standpoint, the
freedom otherwise can be very advantageous) software has no inherent visual form to guide the
visualisation process; without the visualisation it is intangible and exists solely as concepts implemented
with zeros and ones!
For all three of these categories it might be the case that from a personal standpoint the evaluator does not
like the various metaphor, visualisation and comprehension features included but the evaluation should be
done from the viewpoint of whether or not they exist in some form. Each user wil l have their own way of
working and any evaluation should not make judgements on which of the range of features possibly
available are "better"; it may be that for most users completely different features are more useful!
A justifiable answer to each of the criteria questions should be enough to satisfy any form of evaluation
review and such answers can be used for comparison purposes of several evaluations i f different
visualisations are involved. Number ratings for each question are not necessary and add too much of a
level of subjectivity into the process.
- 145 -
Virtual Software in Reality Claire Knight Evaluation; Framework and Scenarios
These criteria have been designed for three-dimensional visualisation interface metaphors, although that is
not to say they cannot be used for other interfaces or visualisations. It may the case that for these other
sorts of interfaces or visualisations the questions need tailoring slightly, such as for two-dimensional
visualisations rewording the navigation and view criteria to ask whether they are selectable. This is for
the very simple reason that in these other visualisations the navigation and exploration available to users
in three-dimensional space are not an option!
8.3 Evaluation of the Evaluation (Justification for the Framework)
This section of the thesis examines the Software World and Software Landscape metaphors in the context
of the evaluation framework proposed for (primarily) software visualisation systems. Each metaphor is
considered against the questions posed by the framework, and appropriately justified answers are provided
for each. The theoretical aspects of the metaphors are considered rather than the limited functionality
existing in prototype and proof of concept implementations.
8.3.1 Application of the Framework to Software World
Visualisation Features
1. Does the level of visual complexity reflect the visualisation metaphor being used?
Yes.
Some scenes have the possibility of being visually complex, but without the level of graphics used to
represent the city the metaphor would lose meaning and completeness. The only use of, for want of a
better term, fancy graphics is to illustrate the various facets of the world and city to make them
visually recognisable to users.
2. Is the visualisation able to scale to accommodate varying amounts of data?
Yes.
The use of the various levels of abstraction in the metaphor allows logical breaks to be made in the
software code being presented to the user. In breaking the artefacts up in this hierarchical manner
(which is supported due to the design of the Java language) each level has scope for expansion from
an evolution perspective. Each is also able to deal with a range of data at the initial visualisation
generation.
3. In the first instance can the visualisation be generated automatically?
Yes.
Various tools exist to enable this process. One is able to parse the Java code (up to and including
version 1.2 of the language) and place facts about the code in a repository. Another then extract facts
from this repository (at user direction to choose the facets to be visualised) and produces C code for
- 146-
Virtual Software in Reality Claire Knight Evaluation; Framework and Scenarios
compilation with the M A V E R I K libraries to create an executable visualisation system. The second tool
is also capable of running the first on the necessary source code for the visualisations required.
4. Can the visualisation evolve in a meaningful way (i.e. within the constraints of the metaphor) as the
underlying data changes?
Yes.
Along with the full and complete description of Software World and the mappings used to create it, a
description of the effects of the evolution of the underlying code and the mappings used for this is
provided. The use of buildings and other real world items in the visualisation enables the evolutions
to be modelled in ways recognised to represent change in reality. An example of this is the use of
scaffolding around structures undergoing change.
5. Does the visualisation interface (underlying metaphor as well as the implementation) facilitate easy
interaction?
Yes
This is true from a theoretical and logical viewpoint although no experiments have been carried out
with different users. The abstraction levels and methods of moving between them are designed for
both ease of visualisation (mappings) and for ease of use. There is a logical and explainable
progression between them. As far as the actual interaction mechanisms are concerned, this is down to
the ways in which M A V E R I K supports user interaction, although the prototype visualisations have both
keyboard and two-dimensional mouse control enabled.
6. Is the representation used (for the visualisation, and hence the metaphor detail) fully and completely
documented in some way?
Yes.
The complete mappings are documented. For clarity the evolution issues are documented separately
(apart from being mentioned in the main mapping document) but all mappings that exist are written
down and where considered necessary, justified.
7. Is annotated information, over and above the graphics, available to the user of the visualisation in
some way?
Yes.
This is available to the user via (conceptually) a piece of paper that they carry with them in the virtual
environment. This paper is then used for the display of various two-dimensional information based
on the users current context in the visualisation system. The reason for the piece of paper is to
alleviate many of the problems of displaying two-dimensional information in a three-dimensional
space.
8. Does the visualisation display extreme data (i.e. possible anomalies) with no problem?
Yes.
As far as the visualisation is designed it certainly does. In practice it has also proved to be so with
some method code that was particularly large. The visualisation made it clear that this code was
unusual, but the buildings (whilst being impossible architecturally in reality due to the height to base
ratio!) were still drawn correctly.
- 147-
Virtual Software in Reality Claire Knight Evaluation; Framework and Scenarios
9. Can the visualisation be viewed as both an environment and as still views (even if the still views exist
within the environment), under user direction?
Yes.
Since the movement and exploration is completely under user control within this metaphor they can
view the visualisation as they move through it and by stopping to look at information in more detail.
There are no pre-programmed paths though the information that would pull users though without their
control hence the issue of not being able to view stills is not a large problem.
10. Can the visualisation be viewed from more than one angle, at user discretion?
Yes.
As for the previous answer, the user control and lack of pre-programmed automatic routes through the
information enables this. The user is free to navigate and view the visualisation components from any
aspect they wish.
Comprehension Features
11. Is the visualisation capable of indicating syntactic and semantic relations between data objects?
No.
The structure of the visualisation was designed to reflect the relationships between the data objects, at
least from a syntactic point of view. Semantic information is presented at a local level although the
possible semantic links at higher levels, such as between classes, is only partly available through any
usage information (such as the inheritance hierarchy).
12. Does the visualisation provide different abstraction mechanisms in some way (this may be through
the metaphor)?
Yes.
This is done through the breakdown of the visualisation into hierarchical levels based on the
containership that the Java language provides through packages and classes. This enables the system
to be viewed at several different, discrete, abstraction levels in the metaphor.
13. Does the visualisation support goal-directed, as needed, hypothesis driven comprehension?
Yes.
The exploration facilities afforded by the visualisation allow the user to drive the comprehension
process as they see fit for the various tasks they need to carry out.
14. Does the visualisation provide an adequate overview of the data architecture and structure (if one
exists) at various levels of abstraction?
No.
The structure, at least in terms of the packages, files and classes that compose the entire system can
be seen at the different levels of abstraction, although the data architecture is not explicitly visualised
or processed from the source code driving the visualisation.
15. Does the visualisation support the construction of multiple mental models (domain, situation, and
program) by enabling information and knowledge gathering in different ways?
No.
- 148-
Virtual Software in Reality Claire Knight Evaluation; Framework and Scenarios
Information and knowledge gathering in supported in as many forms as the user wishes to use the
visualisation. To say that it supports domain, situation and program mental model creation would be
wrong, not least because of the lack of empirical evidence for any such claim, and the lack of suitable
tests for the separation of these concerns. The user is free to explore and gather information in any
way that they see f i t within the virtual environment. They can make use of the three-dimensional
space of the visualisation, the two-dimensional textual information provided and any annotations
made by previous users on the noticeboards.
16. Does the visualisation provide some form of cross-reference of mental models, at least through
maintaining context when changing from abstraction levels of querying data?
Yes.
Context is maintained through queries by the availability of information in both directions of the
hierarchical arrangement of the data used for the visualisation.
Features Applicable to Both
17. Does the user interface present an approachable front to the user?
Yes.
The user is presented with the atlas view of the entire software system with options for moving to
anywhere in the visualisation system through the use of (primarily) mouse navigation. Textual
information can be gathered through the use of the office concept. The mouse can be used to
interrogate graphical artefacts.
18. Are there various ways of interacting with the system, both the visualisation and the underlying
information necessary for the process of program comprehension?
Yes.
Textual and graphical information is available to the user of the visualisation, with coherent
mechanisms for moving between the two.
19. Is directional, focused, navigation possible?
Yes.
The querying process provides such facilities.
20. Is arbitrary, exploratory, navigation possible?
Yes.
The exploratory nature of the virtual environment in which the visualisation is located enables such
navigation to take place.
21. Is navigation between (a) aspects of the various mental models (program comprehension) and (b)
various abstraction levels (visualisation) possible?
Yes.
This is possible through a combination of queries, three-dimensional spatial navigation and the
location of information in the office structure.
- 149-
Virtual Software in Reality Claire Knight Evaluation; Framework and Scenarios
22. Is the users current focus both obvious and indicated?
No.
The user knows what they are looking at, but nothing is highlighted to indicate to watchers. It is also
not considered from a multiple user perspective since that is future work.
23. Do features that are know to act as orientation and navigation cues exist in the visualisation so that
the user is able to trace (at least to a degree) the path taken to the current point of focus?
Yes.
The paths, boundaries and landmark concepts used in the process of city planning and layout are used
in the mapping process from software items to graphical artefacts and the metaphor has been designed
to accommodate these features naturally. The information presented in each district and then each
city also aids this process in that the use can trace back the country (for example) in which they are
currently located.
24. Do features that are known to act as orientation and navigation cues exist to show the user paths and
directions available from the current location for moving elsewhere?
Yes.
Primarily at the district and city levels, routes to related areas (such as through inheritance) are
provided and the rationale for the "jump" is from the relationship between the data items.
8.3.2 Application of the Framework to Software Landscape
Visualisation Features
1. Does the level of visual complexity reflect the visualisation metaphor being used?
Yes.
Much of the visual complexity will be at the level of texture mappings onto a graphical representation
of a terrain to distinguish different areas of that terrain. This may sound trivial but without such
features the visualisation would not appear natural and hence the metaphor would be ruined.
2. Is the visualisation able to scale to accommodate varying amounts of data?
Yes.
The size and number of valleys and peaks can cover a wide range of acceptable values and the overall
landscape would then be formed in response to the required data values.
3. In the first instance can the visualisation be generated automatically?
Yes.
Although this answer is only a theoretical one, terrain generation algorithms exist and these would
require suitable parameterisation to create the desired hills and valleys.
4. Can the visualisation evolve in a meaningful way (i.e. within the constraints of the metaphor) as the
underlying data changes?
No.
- 150-
Virtual Software in Reality Claire Knight Evaluation; Framework and Scenarios
Natural evolution does not map exactly to the evolution of code that would be required to be shown in
the visualisation. There are some areas where, for example, erosion can be used to show information
in the visualisation environment. On the whole the mapping is not completely robust; there may be
situations where a peak needs to be taller or have a wider surface area whilst maintaining the same
height.
5. Does the visualisation interface (underlying metaphor as well as the implementation) facilitate easy
interaction?
Yes.
Logically and theoretically at least this is true. The abstraction levels and methods of moving
between them are designed for both ease of visualisation (mappings) and for ease of use. There is a
logical and explainable progression between them. As far as the actual interaction mechanisms are
concerned, this is down to the ways in which MAVERDC supports user interaction, although the
prototype visualisations have both keyboard and two-dimensional mouse control enabled.
6. Is the representation used (for the visualisation, and hence the metaphor detail) fully and completely
documented in some way?
Yes.
Al l mappings that exist are written down and where considered necessary, justified and the mappings
are complete for all identified facets of the Java programming language.
7. Is annotated information, over and above the graphics, available to the user of the visualisation in
some way?
Yes.
This is available to the user via (conceptually) a piece of paper that they carry with them in the virtual
environment. This paper is then used for the display of various two-dimensional information based
on the users current context in the visualisation system. The reason for the piece of paper is to
alleviate many of the problems of displaying two-dimensional information in a three-dimensional
space.
8. Does the visualisation display extreme data (i.e. possible anomalies) with no problem?
Yes.
As far as the visualisation is designed it does.
9. Can the visualisation be viewed as both an environment and as still views (even if the still views exist
within the environment), under user direction?
Yes.
Since the movement and exploration is completely under user control within this metaphor they can
view the visualisation as they move through it and by stopping to look at information in more detail.
There are no pre-programmed paths though the information that would pull users though without their
control hence the issue of not being able to view stills is not a large problem.
10. Can the visualisation be viewed from more than one angle, at user discretion?
Yes.
- 151 -
Virtual Software in Reality Claire Knight Evaluation; Framework and Scenarios
As for the previous answer, the user control and lack of pre-programmed automatic routes through the
information enables this. The user is free to navigate and view the visualisation components from any
aspect they wish.
Comprehension Features
11. Is the visualisation capable of indicating syntactic and semantic relations between data objects?
No.
The structure of the visualisation was designed to reflect the relationships between the data objects, at
least from a syntactic point of view. Semantic information is presented at a local level although the
possible semantic links at higher levels, such as between classes, is only partly available through any
usage information (such as the inheritance hierarchy).
12. Does the visualisation provide different abstraction mechanisms in some way (this may be through
the metaphor)?
Yes.
This is done through the breakdown of the visualisation into hierarchical levels based on the
containership that the Java language provides through packages and classes. This enables the system
to be viewed at several different, discrete, abstraction levels in the metaphor.
13. Does the visualisation support goal-directed, as needed, hypothesis driven comprehension?
Yes.
The exploration facilities afforded by the visualisation allow the user to drive the comprehension
process as they see f i t for the various tasks they need to carry out.
14. Does the visualisation provide an adequate overview of the data architecture and structure (if one
exists) at various levels of abstraction?
No.
The structure, at least in terms of the packages, files and classes that compose the entire system can
be seen at the different levels of abstraction, although the data architecture is not explicitly visualised
or processed from the source code driving the visualisation.
75. Does the visualisation support the construction of multiple mental models (domain, situation, and
program) by enabling information and knowledge gathering in different ways?
No.
Information and knowledge gathering in supported in as many forms as the user wishes to use the
visualisation. To say that it supports domain, situation and program mental model creation would be
wrong, not least because of the lack of empirical evidence for any such claim, and the lack of suitable
tests for the separation of these concerns. The user is free to explore and gather information in any
way that they see fit within the virtual environment. They can make use of the three-dimensional
space of the visualisation, the two-dimensional textual information provided and any annotations
made by previous users.
16. Does the visualisation provide some form of cross-reference of mental models, at least through
maintaining context when changing from abstraction levels of querying data?
Yes.
- 152-
Virtual Software in Reality Claire Knight Evaluation; Framework and Scenarios
Context is maintained through queries by the availability of information in both directions of the
hierarchical arrangement of the data used for the visualisation.
Features Applicable to Both
17. Does the user interface present an approachable front to the user?
Yes.
The user is presented with the atlas view of the entire software system with options for moving to
anywhere in the visualisation system through the use of (primarily) mouse navigation. Textual
information can be gathered throughout the landscape and the mouse can be used to interrogate
graphical artefacts.
18. Are there various ways of interacting with the system, both the visualisation and the underlying
information necessary for the process of program comprehension?
Yes.
Textual and graphical information is available to the user of the visualisation, with coherent
mechanisms for moving between the two.
19. Is directional, focused, navigation possible?
Yes.
The querying process provides such facilities.
20. Is arbitrary, exploratory, navigation possible?
Yes.
The exploratory nature of the virtual environment in which the visualisation is located enables such
navigation to take place.
21. Is navigation between (a) aspects of the various mental models (program comprehension) and (b)
various abstraction levels (visualisation) possible?
Yes.
This is possible through a combination of queries and three-dimensional spatial navigation.
22. Is the users current focus both obvious and indicated?
No.
The user knows what they are looking at, but nothing is highlighted to indicate to watchers. It is also
not considered from a multiple user perspective since that is future work.
23. Do features that are know to act as orientation and navigation cues exist in the visualisation so that
the user is able to trace (at least to a degree) the path taken to the current point of focus?
Yes.
The hills and valleys act as boundary delimiters for areas of information, along with other visual
entities such as the use of boundary signs at the edges of packages and paths around the landscape.
These identified orientation cues can help the user to navigate and know where they have just
navigated from.
24. Do features that are known to act as orientation and navigation cues exist to show the user paths and
directions available from the current location for moving elsewhere?
Yes.
- 153-
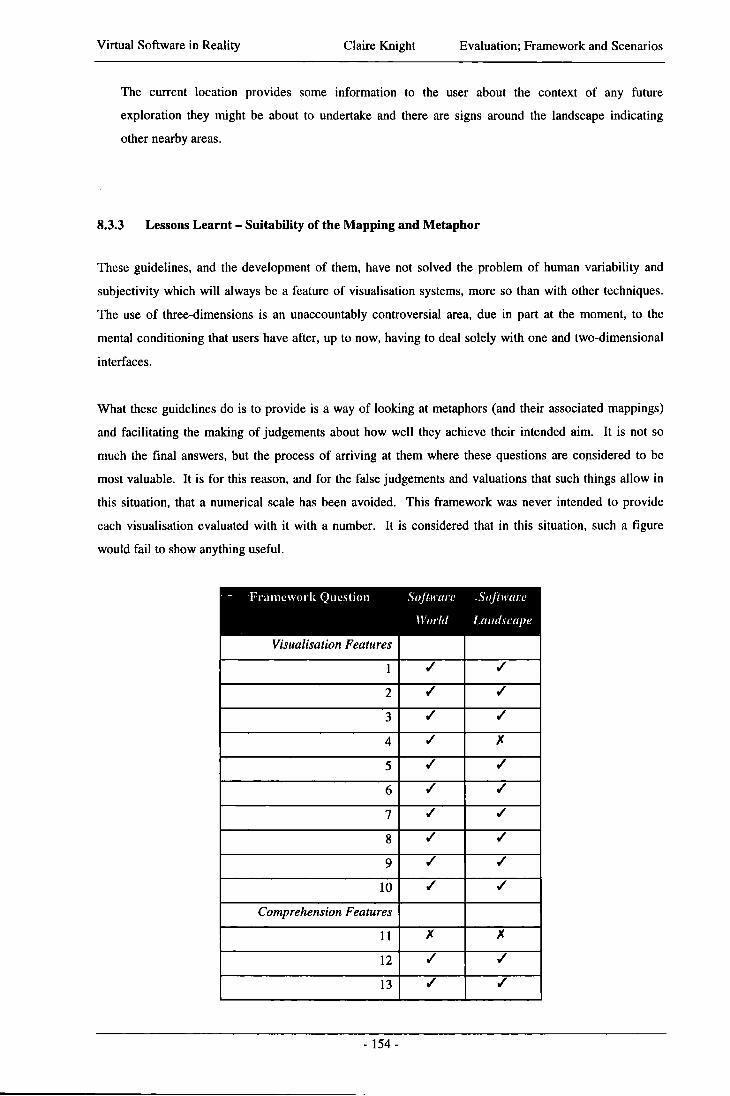
Virtual Software in Reality Claire Knight Evaluation; Framework and Scenarios
The current location provides some information to the user about the context of any future
exploration they might be about to undertake and there are signs around the landscape indicating
other nearby areas.
8.3.3 Lessons Learnt - Suitability of the Mapping and Metaphor
These guidelines, and the development of them, have not solved the problem of human variability and
subjectivity which will always be a feature of visualisation systems, more so than with other techniques.
The use of three-dimensions is an unaccountably controversial area, due in part at the moment, to the
mental conditioning that users have after, up to now, having to deal solely with one and two-dimensional
interfaces.
What these guidelines do is to provide is a way of looking at metaphors (and their associated mappings)
and facilitating the making of judgements about how well they achieve their intended aim. It is not so
much the final answers, but the process of arriving at them where these questions are considered to be
most valuable. It is for this reason, and for the false judgements and valuations that such things allow in
this situation, that a numerical scale has been avoided. This framework was never intended to provide
each visualisation evaluated with it with a number. It is considered that in this situation, such a figure
would fail to show anything useful.
Framework Question Software Software
World Landscape
Visualisation Features
1 / /
2 / /
3 / /
4 / X
5 / /
6 / /
7 / /
8 / •
9 / /
10 / /
Comprehension Features
11 X X
12 / •
13 / •
- 154-
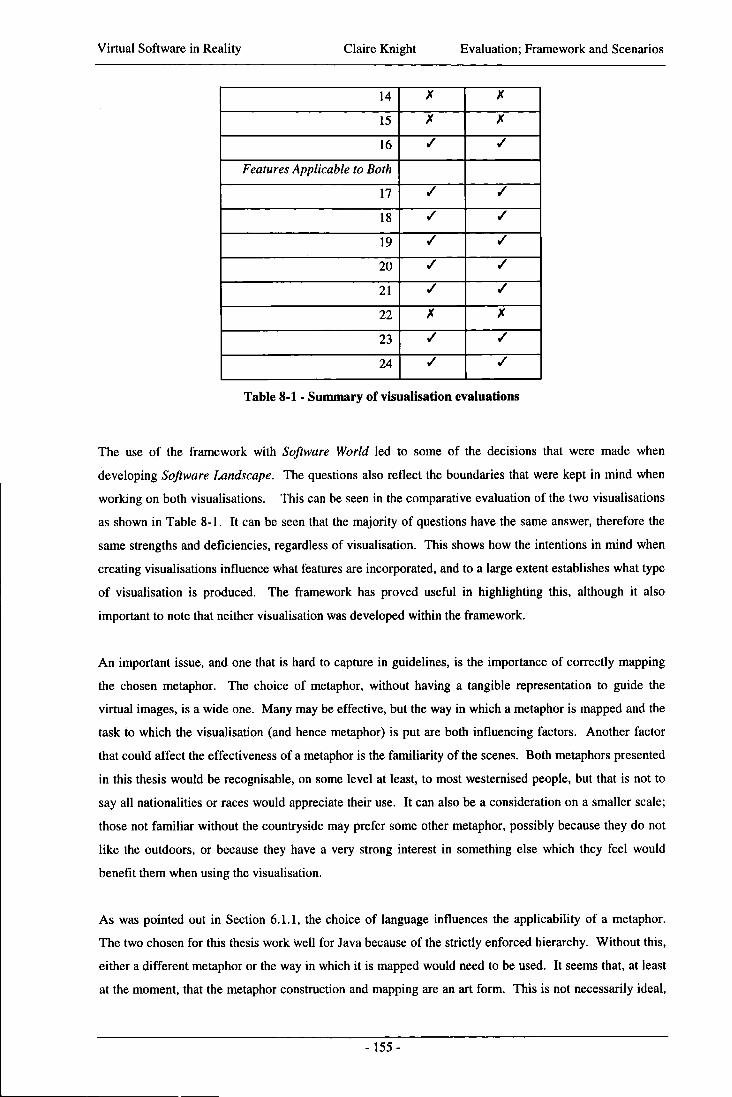
Virtual Software in Reality Claire Knight Evaluation; Framework and Scenarios
14 X X
15 X X
16 / /
Features Applicable to Both
17 / /
18 / /
19 / /
20 / /
21 / /
22 X X
23 / /
24 / /
Table 8-1 - Summary of visualisation evaluations
The use of the framework with Software World led to some of the decisions that were made when
developing Software Landscape. The questions also reflect the boundaries that were kept in mind when
working on both visualisations. This can be seen in the comparative evaluation of the two visualisations
as shown in Table 8-1. It can be seen that the majority of questions have the same answer, therefore the
same strengths and deficiencies, regardless of visualisation. This shows how the intentions in mind when
creating visualisations influence what features are incorporated, and to a large extent establishes what type
of visualisation is produced. The framework has proved useful in highlighting this, although it also
important to note that neither visualisation was developed within the framework.
An important issue, and one that is hard to capture in guidelines, is the importance of correctly mapping
the chosen metaphor. The choice of metaphor, without having a tangible representation to guide the
virtual images, is a wide one. Many may be effective, but the way in which a metaphor is mapped and the
task to which the visualisation (and hence metaphor) is put are both influencing factors. Another factor
that could affect the effectiveness of a metaphor is the familiarity of the scenes. Both metaphors presented
in this thesis would be recognisable, on some level at least, to most westernised people, but that is not to
say all nationalities or races would appreciate their use. It can also be a consideration on a smaller scale;
those not familiar without the countryside may prefer some other metaphor, possibly because they do not
like the outdoors, or because they have a very strong interest in something else which they feel would
benefit them when using the visualisation.
As was pointed out in Section 6.1.1, the choice of language influences the applicability of a metaphor.
The two chosen for this thesis work well for Java because of the strictly enforced hierarchy. Without this,
either a different metaphor or the way in which it is mapped would need to be used. It seems that, at least
at the moment, that the metaphor construction and mapping are an art form. This is not necessarily ideal,
- 155-
Virtual Software in Reality Claire Knight Evaluation; Framework and Scenarios
but by using guidelines to guide the process towards using ones that deal with contextual visualisations,
navigation and orientation, different levels of abstraction and a structure suited to the data, then the poorer
representations and metaphors will be weeded out at an earlier stage.
8.3.4 Conclusions
This section has presented a comparative evaluation framework that takes the form of a series of
questions. These can also be used to guide the design and/or refinement of visualisations. The
visualisations presented earlier in the thesis have been evaluated using this framework. This serves two
purposes; it shows the framework in action and it evaluates the proposed visualisations. The use of the
framework also produced some interesting issues relating especially to the choice and use of metaphor.
8.4 Scenarios
In order to demonstrate the uses and usefulness of visualisation tools when using them to aid the program
comprehension process several scenarios have been developed. These aim to show different aspects of
the visualisation system (using Software World for illustrative purposes), and different ways of
discovering information within the visualisation environment. There are four scenarios and are described
in a two-stage process for clarity. A description of the problem along with information that is considered
useful for the resolution of the problem is provided first. This provides more of a program comprehension
perspective of the visualisations. Secondly, the actual process of discovering the information in the
context of the visualisation is then described in detail, with recourse to explanatory images of the scenes
seen in Software World where considered necessary.
With all of these scenarios it has been assumed that all necessary source code files have been parsed and
where possible references have been resolved at least within the context of the application code. The only
exception to this is any of the Java standard API libraries that are called as the source for these may not be
available and it is not under direct comprehension or maintenance.
The first of the two sections for each scenario describes the problems or tasks that the visualisation tool
can be used for in a general way, without describing the steps that need to be taken by the user to actually
achieve the task goal or problem solution. The reason for this is that it provides a context for the activity
and allows scope for describing the information that is likely to be required for a similar task without the
restriction that certain views and ways of locating the data would impose. The second section provides
more information about the use of the visualisation when carrying out the sort of tasks that these scenarios
- 156-
Virtual Software in Reality Claire Knight Evaluation; Framework and Scenarios
provide. A list of actions with description of where this leaves the user in the visualisation environment is
provided.
The actual process of comprehension and the use of auxiliary comprehension tools are not covered as it is
assumed that the reader can make judgements about the extra information (if any) they need to complete
the task. It is also because people differ in their approach to this sort of task and to dictate a way of
working would drastically reduce the overall effectiveness of the tool in a wider view. The visualisation is
there to support the process of comprehension in any way the user sees as beneficial to them, their way of
working and the task in hand.
8.4.1 Scenario One - Impact
It is important to consider impact when making any change to the code. It is highly unlikely that the
change will be completely isolated, especially i f it requires change to data items (variables and data
structures). Impact analysis is something that is a major consideration when doing any form of program
comprehension and having tool support in this area, even i f a human needs to make the final judgements,
is supportive to that process.
8.4.1.1 Problem
An example task that falls into the category of impact analysis is when a change involves altering the type
of a class variable. Such a task may impact any code contained within that class, and should the variable
be static (regardless of whether or not the class is static) it could have much wider impact throughout a
system. A l l known usage of this variable needs to be examined to see how the change may affect the rest
of the code. This is turn may require restructuring of other areas of code but for the moment this wil l not
be considered for the scenario.
8.4.1.2 Solution
Assessing the possible impact that altering the type of a class variable would cause;
• There is an assumption that the class is known in this case and that the start of the process is to search
for that class using the class and package name. From this the class is highlighted in both the world
and country views. The class can then be selected and the outside of the district within the city
boundary is shown.
• The user can then go into the district and find the monument that represents the variable being
considered for change. This monument would then provide information about the current type and
-157-
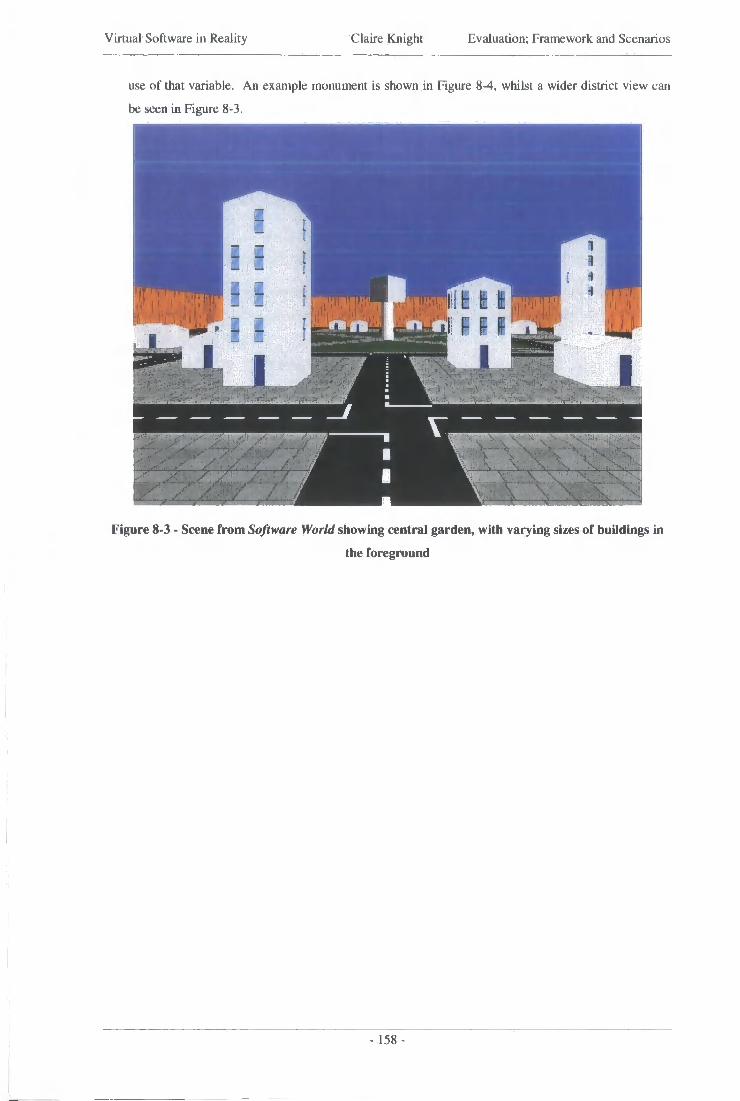
Virtual Software in Reality Claire Knight Evaluation; Framework and Scenarios
use of that variable. An example monument is shown in Figure 8-4, whilst a wider district view can
be seen in Figure 8-3.
: H
lit I It
I •
Figure 8-3 - Scene from Software World showing central garden, with varying sizes of buildings in
the foreground
- 158-
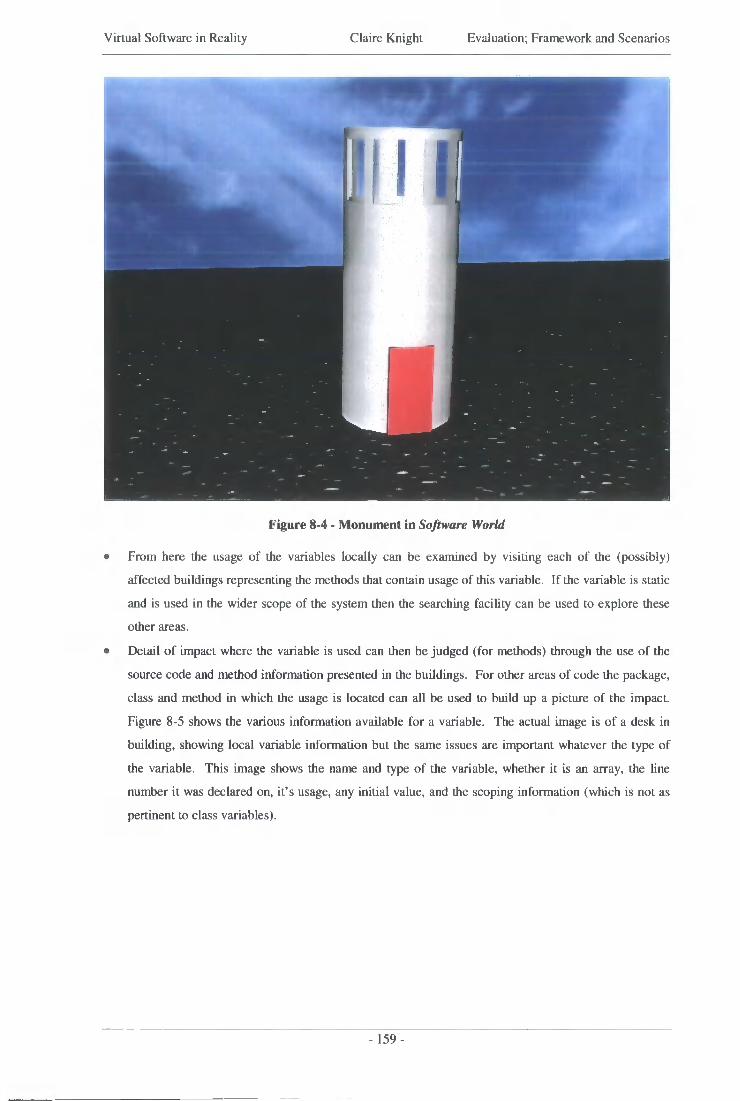
Virtual Software in Reality Claire Knight Evaluation; Framework and Scenarios
Figure 8-4 - Monument in Software World
From here the usage of the variables locally can be examined by visiting each of the (possibly)
affected buildings representing the methods that contain usage of this variable. I f the variable is static
and is used in the wider scope of the system then the searching facility can be used to explore these
other areas.
Detail of impact where the variable is used can then be judged (for methods) through the use of the
source code and method information presented in the buildings. For other areas of code the package,
class and method in which the usage is located can all be used to build up a picture of the impact.
Figure 8-5 shows the various information available for a variable. The actual image is of a desk in
building, showing local variable information but the same issues are important whatever the type of
the variable. This image shows the name and type of the variable, whether it is an array, the line
number it was declared on, it's usage, any initial value, and the scoping information (which is not as
pertinent to class variables).
- 159-

Virtual Software in Reality Claire Knight Evaluation; Framework and Scenarios
Figure 8-5 - Variable information available
This solution uses several features that were explicitly identified in the evaluation framework. As can be
seen in the summary of the evaluations in Table 8-1 and in Section 8.3.1 there are various identified facets
that Software World has. This scenario provides an illustration of the goal directed investigation (question
13) that the visualisation supports. It also shows how it is difficult in the graphical context of this
mapping to explicitly show the syntactic and semantic relations between data items (question 11); this
would perhaps make the tracing of class variable usage easier. The scenario solution description also
provides an indication of the various interaction mechanisms that the visualisation supports (question 18).
8.4.2 Scenario Two - Structural Condition
The condition of any piece of source code can affect the effort required for future comprehension and
maintenance activities. There are many measures that can be utilised to provide a forecast (based on
calculations) of the condition of many aspects of the source code in numerical form and these may be used
to justify a preventative maintenance process taking place. It is also useful in these situations, especially if
the numbers that come out of the measured analysis of the code are averaged, to be able to "see" possible
problem areas of the code and to know where to direct efforts.
- 160-
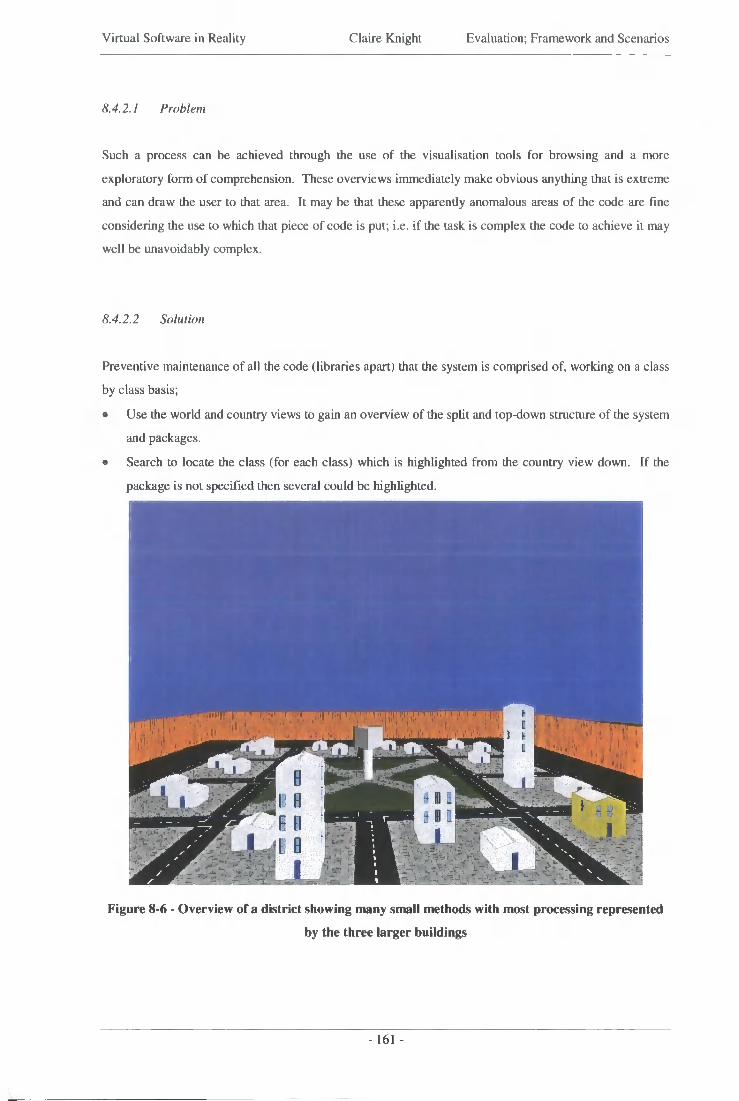
Virtual Software in Reality Claire Knight Evaluation; Framework and Scenarios
8.4.2.1 Problem
Such a process can be achieved through the use of the visualisation tools for browsing and a more
exploratory form of comprehension. These overviews immediately make obvious anything that is extreme
and can draw the user to that area. It may be that these apparently anomalous areas of the code are fine
considering the use to which that piece of code is put; i.e. i f the task is complex the code to achieve it may
well be unavoidably complex.
8.4.2.2 Solution
Preventive maintenance of all the code (libraries apart) that the system is comprised of, working on a class
by class basis;
• Use the world and country views to gain an overview of the split and top-down structure of the system
and packages.
• Search to locate the class (for each class) which is highlighted from the country view down. I f the
package is not specified then several could be highlighted.
i i .1
Ml , ' * 1 I i
III F I I A 0 i .
i.
Figure 8-6 - Overview of a district showing many small methods with most processing represented
by the three larger buildings
- 161 -
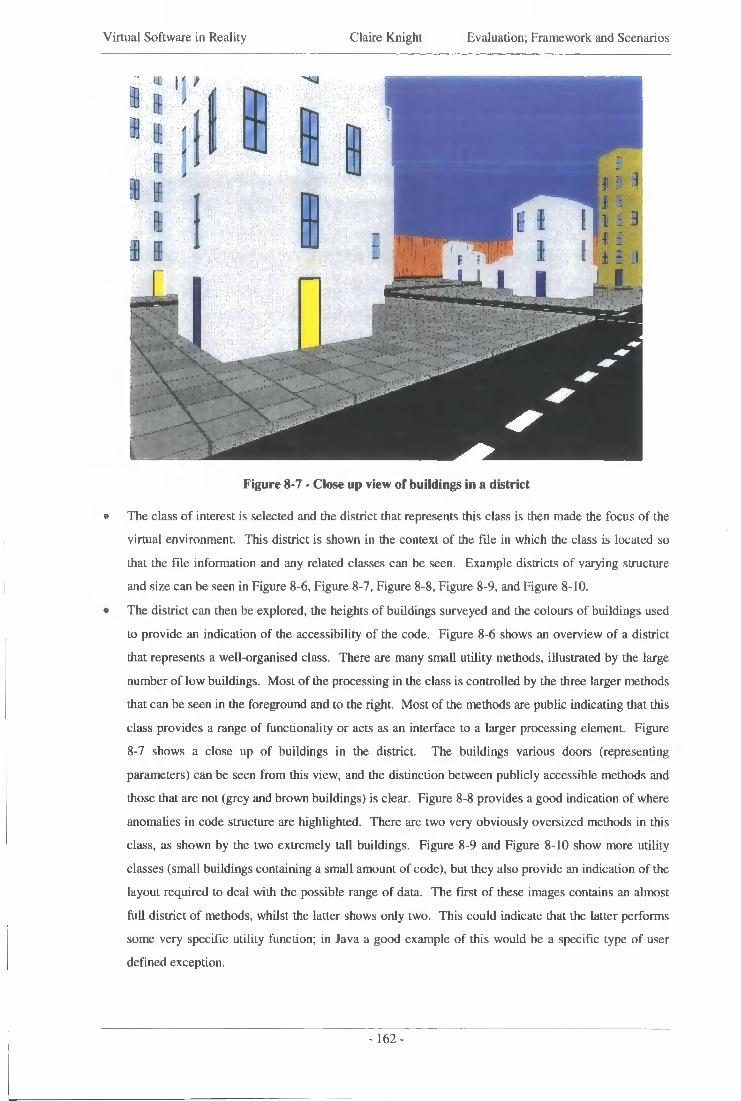
Virtual Software in Reality Claire Knight Evaluation; Framework and Scenarios
i \ r - i tn J If
Ft ;
1? f
ft
I i i I L I
Figure 8-7 - Close up view of buildings in a district
• The class of interest is selected and the district that represents this class is then made the focus of the
virtual environment. This district is shown in the context of the file in which the class is located so
that the file information and any related classes can be seen. Example districts of varying structure
and size can be seen in Figure 8-6, Figure 8-7, Figure 8-8, Figure 8-9, and Figure 8-10.
• The district can then be explored, the heights of buildings surveyed and the colours of buildings used
to provide an indication of the accessibility of the code. Figure 8-6 shows an overview of a district
that represents a well-organised class. There are many small utility methods, illustrated by the large
number of low buildings. Most of the processing in the class is controlled by the three larger methods
that can be seen in the foreground and to the right. Most of the methods are public indicating that this
class provides a range of functionality or acts as an interface to a larger processing element. Figure
8-7 shows a close up of buildings in the district. The buildings various doors (representing
parameters) can be seen from this view, and the distinction between publicly accessible methods and
those that are not (grey and brown buildings) is clear. Figure 8-8 provides a good indication of where
anomalies in code structure are highlighted. There are two very obviously oversized methods in this
class, as shown by the two extremely tall buildings. Figure 8-9 and Figure 8-10 show more utility
classes (small buildings containing a small amount of code), but they also provide an indication of the
layout required to deal with the possible range of data. The first of these images contains an almost
ful l district of methods, whilst the latter shows only two. This could indicate that the latter performs
some very specific utility function; in Java a good example of this would be a specific type of user
defined exception.
- 162-
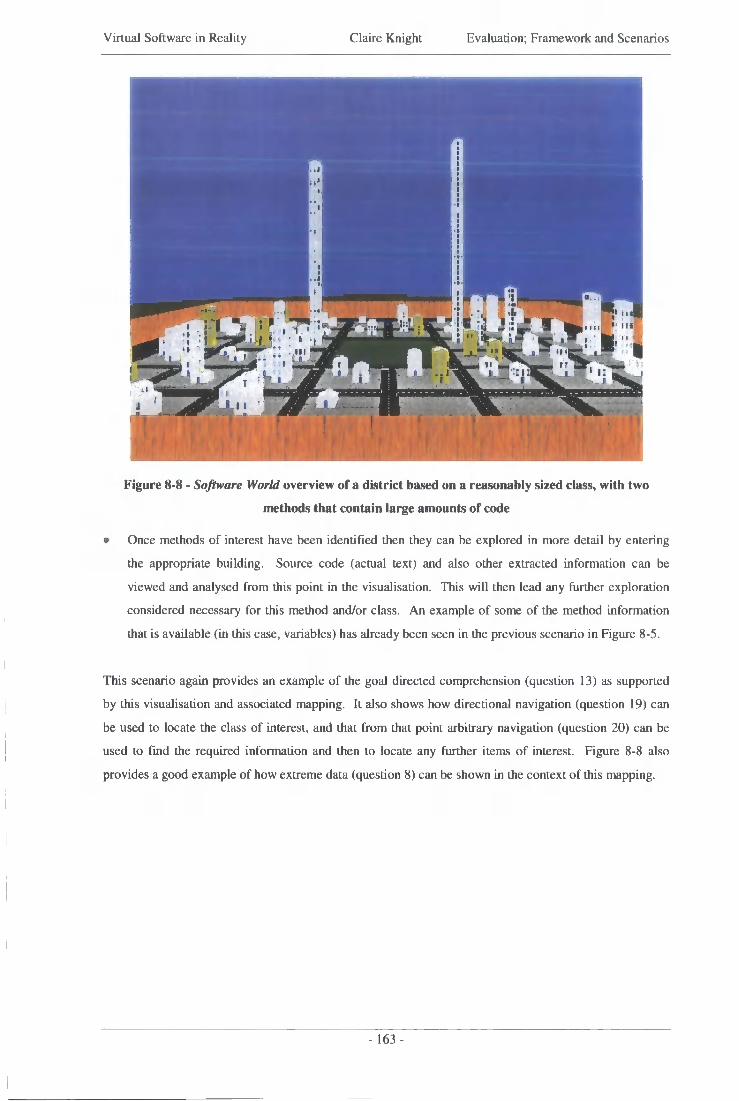
Virtual Software in Reality Claire Knight Evaluation; Framework and Scenarios
•
it
-I i - if m l
11 •
i
Figure 8-8 - Software World overview of a district based on a reasonably sized class, with two
methods that contain large amounts of code
• Once methods of interest have been identified then they can be explored in more detail by entering
the appropriate building. Source code (actual text) and also other extracted information can be
viewed and analysed from this point in the visualisation. This wil l then lead any further exploration
considered necessary for this method and/or class. An example of some of the method information
that is available (in this case, variables) has already been seen in the previous scenario in Figure 8-5.
This scenario again provides an example of the goal directed comprehension (question 13) as supported
by this visualisation and associated mapping. It also shows how directional navigation (question 19) can
be used to locate the class of interest, and that from that point arbitrary navigation (question 20) can be
used to find the required information and then to locate any further items of interest. Figure 8-8 also
provides a good example of how extreme data (question 8) can be shown in the context of this mapping.
- 163-
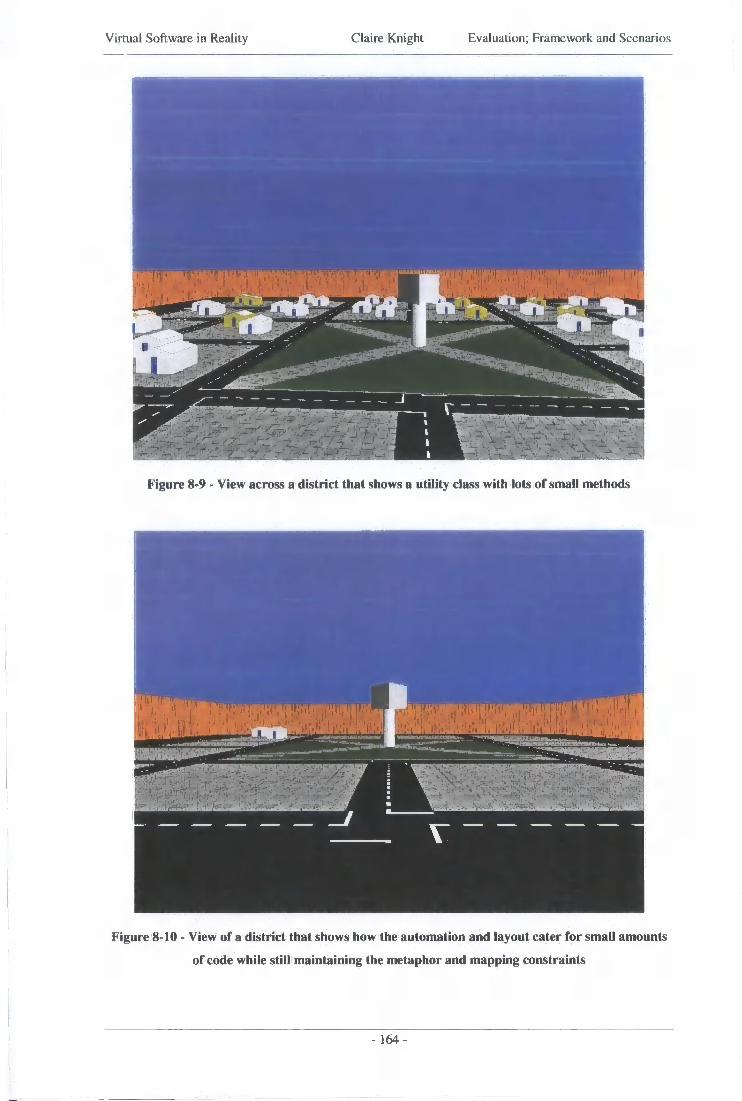
Virtual Software in Reality Claire Knight Evaluation; Framework and Scenarios
i m i, i
J
Figure 8-9 - View across a district that shows a utility class with lots of small methods
1'
Figure 8-10 - View of a district that shows how the automation and layout cater for small amounts
of code while still maintaining the metaphor and mapping constraints
- 1 6 4 -

Virtual Software in Reality Claire Knight Evaluation; Framework and Scenarios
8.4.3 Scenario Three - System Structure
The structure of the application is important for many reasons, but not least because mentally it provides a
high level conceptual framework which can then be used to hang other knowledge off. The structure can
also be used to guide other exploration.
8.4.3.1 Problem
From an object-oriented perspective, the structure of the class relations is important because of the
principles of inheritance and dynamic binding. This information is needed both statically and dynamically
and a static view of these connections can be found through the visualisation, although the process is the
reverse of how such information is usually presented. It is often the case that from any class, the location
of subclasses can be found and the hierarchy traversed in this manner. Software World provides such
functionality by allowing any class to be the basis of this investigation; simulating looking out from any
particular point of the structure. This has the benefit of allowing users to create sub-parts of the object
hierarchy of the system as their work requires such knowledge. By allowing the structure to be built
(mentally) under user control, the cognitive familiarity of the sub part of the object hierarchy wil l be
stronger (based on program comprehension research).
8.4.3.2 Solution
For a specific class in the system there is a need to know where it fits into the hierarchy of other classes in
the system, to get an idea of the local structure affecting this class and to incorporate that into a wider
class structure context. There may be several different inheritance trees spread throughout the system
code i f the base class of Object (part of the definition of the Java language) is disregarded. This
exploration from any point " J C " in the code wil l only discover the structure "y" that surrounds that class.
To create a complete structure diagram this process would have to be done for each class (or at least for
every one that has not yet been visited when looking at structure).
• There is an assumption that the class " J C " is known in this case and that the start of the process is to
query for that class using the class and package name. From this the class is highlighted in both the
world and country views. The class can then be selected and the outside of the district within the city
boundary is shown.
• Once here the file level information in the town hall can be used to obtain information about other
classes in scope for all classes in the file by examining import statements.
• For the class of interest, the user can enter the district and go to the central garden where class
information is available and some presented visually. It is in two of the four quadrants of the garden
that the implements and extends (the two ways of specifying inheritance information) for that class
can be found. The user can also examine the class information for any classes known to implement or
- 165-

Virtual Software in Reality Claire Knight Evaluation; Framework and Scenarios
extend V (the class of interest). Gardens can be seen in Figure 8-11 and Figure 8-12, and have also
been seen in some of the earlier images, for example Figure 8-9. Figure 8-12 provides a good view of
the central garden. The four quadrants are identifiable, and the central prism providing the name of
the class is at the centre of the image. Various buildings can be seen in the background, but the two
that are behind the prism are brown which indicates that they are not publicly accessible. Their size
would indicate that these methods do a lot of hidden processing in this class.
E I i
:J - i . . : - • I •
H : 1 0 i d I L I I W
Figure 8-11 - View along a street (between blocks) towards the central garden area
- 166-
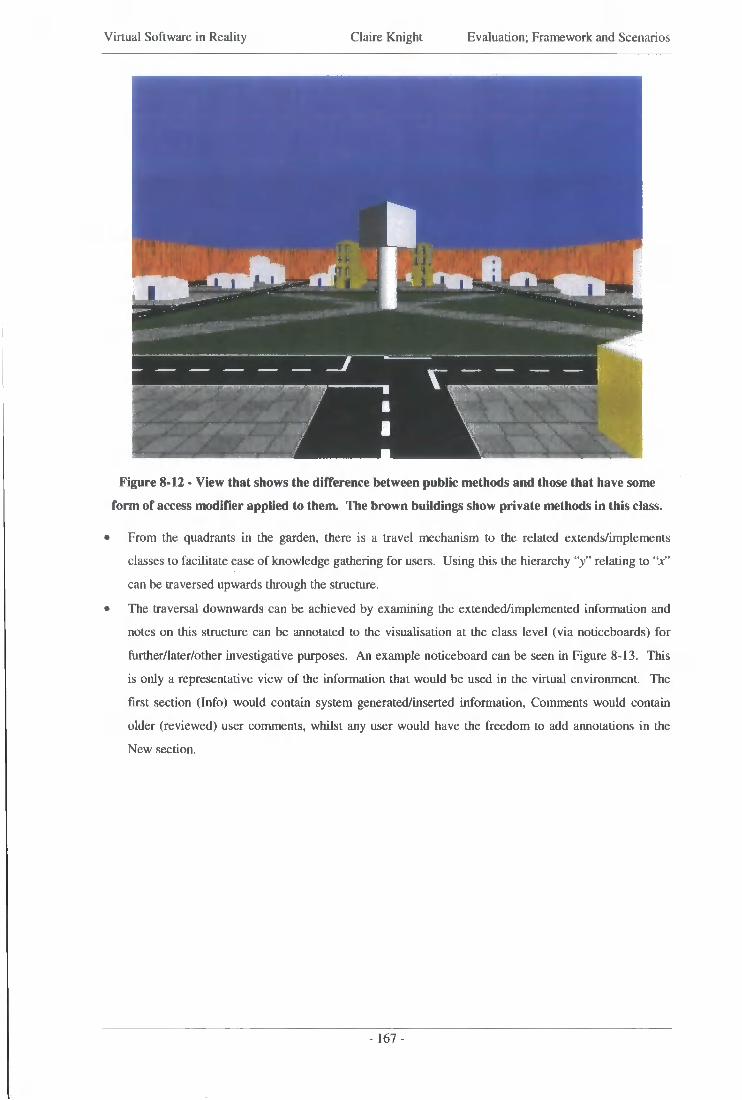
Virtual Software in Reality Claire Knight Evaluation; Framework and Scenarios
M
Figure 8-12 - View that shows the difference between public methods and those that have some
form of access modifier applied to them. The brown buildings show private methods in this class.
• From the quadrants in the garden, there is a travel mechanism to the related extends/implements
classes to facilitate ease of knowledge gathering for users. Using this the hierarchy "y" relating to V
can be traversed upwards through the structure.
• The traversal downwards can be achieved by examining the extended/implemented information and
notes on this structure can be annotated to the visualisation at the class level (via noticeboards) for
further/later/other investigative purposes. An example noticeboard can be seen in Figure 8-13. This
is only a representative view of the information that would be used in the virtual environment. The
first section (Info) would contain system generated/inserted information, Comments would contain
older (reviewed) user comments, whilst any user would have the freedom to add annotations in the
New section.
- 167-
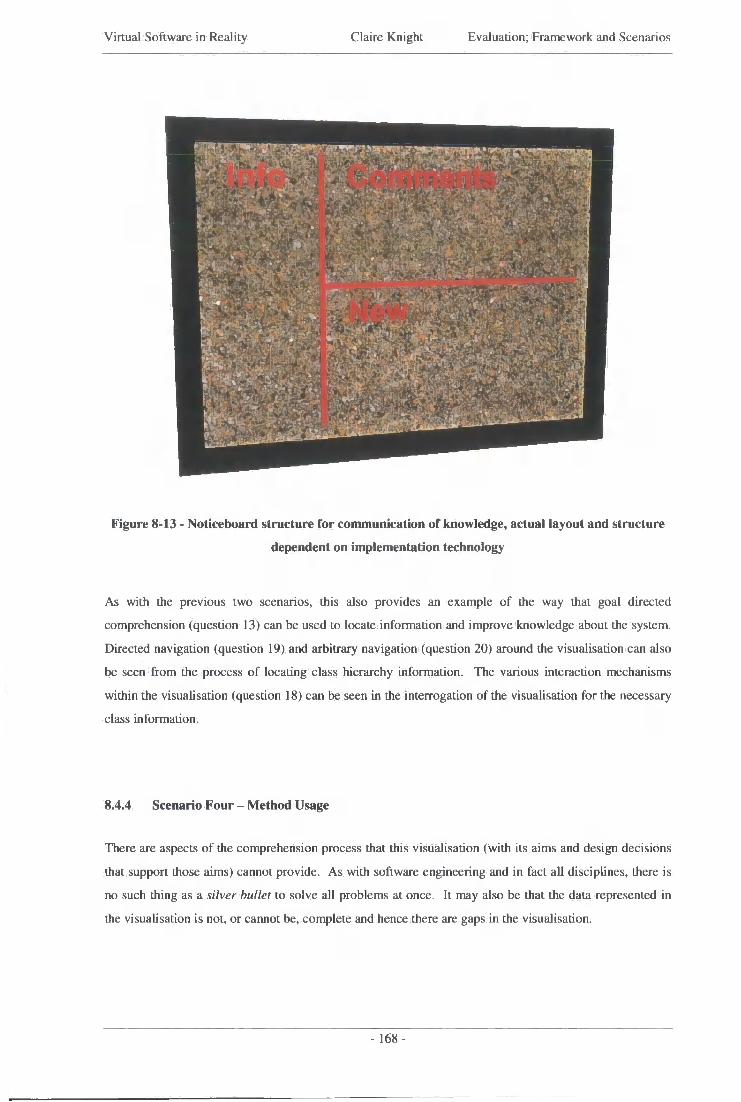
Virtual Software in Reality Claire Knight Evaluation; Framework and Scenarios
Figure 8-13 - Noticeboard structure for communication of knowledge, actual layout and structure
dependent on implementation technology
As with the previous two scenarios, this also provides an example of the way that goal directed
comprehension (question 13) can be used to locate information and improve knowledge about the system.
Directed navigation (question 19) and arbitrary navigation (question 20) around the visualisation can also
be seen from the process of locating class hierarchy information. The various interaction mechanisms
within the visualisation (question 18) can be seen in the interrogation of the visualisation for the necessary
class information.
8.4.4 Scenario Four - Method Usage
There are aspects of the comprehension process that this visualisation (with its aims and design decisions
that support those aims) cannot provide. As with software engineering and in fact all disciplines, there is
no such thing as a silver bullet to solve all problems at once. It may also be that the data represented in
the visualisation is not, or cannot be, complete and hence there are gaps in the visualisation.
- 168-

Virtual Software in Reality Claire Knight Evaluation; Framework and Scenarios
8.4.4.1 Problem
A particular piece of information that is often used when comprehending code (especially non object-
oriented) is the usage of methods. In procedural code the calling structure (usage) of functions (method is
used to refer to object-oriented functions) is often represented as a call graph. This visualisation does not
(a) have this information available and (b) would not necessarily be able to graphically display it because
of the dynamic binding principle. For this reason, the only certainty about which method will be used i f
the class is part of an inheritance hierarchy is at run time.
The usage of a particular method based on method calls throughout the system code is an often sought out
piece of information, especially with procedural languages such as C. It is the basis of a particularly
favourite two-dimensional visualisation technique; call graphs. There is a problem in obtaining this
information with a static analysis of Java code because of the dynamic binding and inheritance issues that
object-oriented languages have.
8.4.4.2 A Solution
The process would be to locate a method, either by query or exploration from another type of query, and
from the information available here all method usage would be listed. Moving through the graph of calls
would work in the same way as for the class inheritance structure by exploring the graph structure from a
node outward. Unfortunately this cannot be achieved due to the information available from a static
analysis of the source code, which is what the visualisation is built upon. Whilst pattern matching, with
scope resolution can provide an idea of which methods may be used, it has been considered that the
provision of possibly misleading information is worse than not providing it at all. It is only at runtime for
a particular execution of the program that this information can be known for sure.
This scenario shows one of the ways in which not supporting semantic and syntactic relationships
(question 11) explicitly, has created a weakness in the visualisation. This is due to the nature of object
oriented source code and static analysis. This scenario situation does show how the visualisation provides
different abstraction mechanisms (question 12). It may not be in the form required to replicate call graphs
(as a common existing representation) should the data support such relationships between items from a
static analysis, but having a range of abstractions for comprehension is an important feature.
-169-
Virtual Software in Reality Claire Knight Evaluation; Framework and Scenarios
8.4.5 Scenario Conclusions
These scenarios have shown several ways in which the visualisation tool can be used to aid the process of
program comprehension. They also show a limitation of the visualisation in its current form and highlight
the reasons why such a limitation exists.
The use of scenarios has provided examples of use to show areas where the visualisation can be of benefit
in helping users by acting as an intelligence amplification tool. In conjunction with an evaluation of the
features of the visualisation, which allows important attributes to be focused on or compared with other
visualisation evaluations, it justifies why such visualisations and tools are of use in the program
comprehension, software maintenance and software engineering fields.
8.5 Summary
The evaluation framework has shown that there needs to be a way of providing guidance and
(comparative) evaluation of software visualisations. It has also highlighted that these visualisations,
developed for the very specific needs of program comprehension, may not be evaluated well using
existing taxonomies that are intended for more general visualisations. The framework presented here is an
attempt to address that particular problem.
Several scenarios have been presented to show the way in which the Software World visualisation can be
used for the process of program comprehension. The last of these has also illustrated a limitation of
Software World in its current form and highlighted why this limitation is partly due to the data used to
create the visualisation. Framework questions that were pertinent to the scenario problems and in
particular the solutions have been identified at the end of each scenario. This provides a link between the
framework evaluation and the actual prototype visualisation.
This chapter has justified the use of three-dimensional software visualisations for program comprehension
through the use of an evaluation framework and scenario usage. The framework allows important
attributes to be focused on or compared with other visualisation evaluations. The scenarios have provided
examples of use to show the visualisation can be of benefit in helping users by acting as an intelligence
amplification tool.
-170-
Virtual Software in Reality
Chapter Nine - Conclusions

Virtual Software in Reality Claire Knight Conclusions
9.1 Introduction
The main focus of this thesis is the real world based visualisation of software for comprehension. These
visualisations require suitable mappings to be effective and usable. Therefore the investigation and
automation of these is a main component of the thesis. The work on the metaphors also provides an
impetus to design the visualisations to be as flexible as possible whilst offering (within the metaphor)
ways of dealing with large amounts of changing data. Visualisations and metaphors are not simple
problems and there are many possible, and even feasible, answers. It is the development and refinement
of one of these possible answers that is the main work presented in this thesis.
The use of three-dimensions for the visualisation brings in several issues related to navigation and
orientation. Whilst the issue of navigation (and to an extent orientation) also needs to be considered in a
two-dimensional display they are vital in three-dimensions. The visualisations therefore have to be
designed to accommodate these issues and to make both as natural and easy as possible.
There are several ways in which the visualisations could be extended or implemented beyond the current
theories but these are limited to discussion only because of the current technology. The technology is
either not available or it is at a stage where the ease of integration with the visualisation (and automation
of the visualisation process) makes it unfeasible.
Virtual Reality (VR) technology, whilst in some aspects not meeting the needs of the visualisation theory,
is an area not consider a primary part of the research. The effort needed to create/improve VR libraries
would far exceed the possible benefits from a visualisation and comprehension perspective. Such research
is being carried out elsewhere and the development of a good system takes many skilled people over many
years.
Dynamic program visualisation is not shown in the visualisations because the focus of the data extracted
from the programs, and hence the metaphor design, focuses on facts that can be extracted statically. This
constraint is so that the visualisations can be the primary research area. Full visualisation coverage from
both static and dynamic program information can be considered once something feasible has been done
with the data already available.
As this thesis shows, dynamic information presentation and VR technology are not researched but three-
dimensional visualisation of static program information for comprehension, along with metaphors,
navigation and orientation are all covered. These areas are covered because it is considered that they are
the most important for achieving the aim of creating intelligence amplifying real world software
visualisations for aiding program comprehension.
-172-

Virtual Software in Reality Claire Knight Conclusions
9.2 Summary of Research
This thesis has presented several pertinent pieces of research in the pursuit of intelligence amplifying
program comprehension visualisations. The primary contributions can be summarised as:
• Defining two real world metaphors and mappings for software visualisation; Software World and
Software Landscape.
• Investigating the effects of evolution, scalability, navigation and automation on the design of software
visualisations, and hence the metaphors and representations used.
• Defining evaluation criteria for three-dimensional software visualisations that takes into account both
visualisation principles and key features of program comprehension tools.
• Defining the current state of the art of software visualisation and providing a rationalised direction for
this field to move along.
The first of these contributions can be seen in Chapter 6, the second in Chapters 5, 6, and to an extent 7,
the third in Chapter 8, and finally the last one in Chapter 5. Each of these research areas are linked, and
the first provides a foundation for the second, which combined, determined some of the important issues
considered in the last two.
The two metaphors, Software World and Software Landscape (Chapter 6), were defined to demonstrate
the use of real world metaphors for software visualisation. They illustrate how such real world metaphors
can be used as the metaphor framework in which to make representation decisions for software
visualisations. The real world context provides a familiar mechanism in which to think about the software
under consideration; the structure of the real world metaphor matches that of the underlying data. This
brings out the important point that such visualisations require designing so that the metaphor is allied as
closely as possible with the expected structure and organisation of the data. I f this is not done, any benefit
of using such metaphors is lost because of the mental confusion caused by expectations being broken.
It is important to consider the effects of evolution, scalability, navigation and automation because of the
impact that they have on the choice of metaphor, mapping and representation used, and on the uses to
which the visualisation can be put. These areas were introduced in Chapter 5 and were also addressed in
Chapter 6 in relation to the two metaphors described. There is a discussion about these factors in Chapter
5, and their importance to any visualisation is addressed. Chapter 7 also addresses some of the
automation issues when dealing with real world software visualisations.
These issues are vital considerations because of the very nature of software visualisation. When creating
visual representations of any data set it is important that the underlying source is accurately and reliably
represented in the images. This becomes much more of an issue when the amount of data and speed of
change of that data are both varying characteristics; as is the case with any software. This is the reason,
therefore, that software visualisations need to take into account evolution, scalability and automation.
Navigation is an issue from the perspective of usability; without considering this when designing the
- 173-
Virtual Software in Reality Claire Knight Conclusions
metaphors and representations then the resultant visualisation will be either unusable, unused or even
both.
The evaluation criteria presented as the Evaluation Framework in Chapter 8 were created to exclusively
address three-dimensional software visualisations. Criteria exist for visualisation evaluation, for program
comprehension tools and even for software visualisation but they fail to meet the specific evaluation needs
when trying to compare three-dimensional software visualisations. There are areas and issues that are
pertinent to the use of three dimensions that the existing frameworks and classifications are not capable of
dealing with.
The framework in this thesis addresses this shortcoming by including criteria that not only considers
program comprehension (and hence software visualisation) but also virtual realities where navigation and
orientation are areas which require special attention. However good the source code presentation in the
context of program comprehension tools, i f the user is unable to navigate around that information, orient it
and themselves in the overall context of the system and in the local context of other information, then the
visualisation is of limited use.
In the light of this research, the original criteria for success as presented in Chapter 1 can be revisited to
review what has been achieved.
9.3 Criteria for Success
Several criteria for success were identified at the start of this thesis (Section 1.3, page 7) and they can now
be examined in the context of the research presented in the preceding chapters of this thesis. In order to
examine whether the criteria have been met, each will be examined in turn and a discussion presented as
to whether the identified goal has been achieved.
A. Demonstrating the viability of using three-dimensions for software visualisation.
This thesis has succeeded in showing that the use of three-dimensions for software visualisation is a viable
technique. This has been demonstrated by the definition of appropriate mappings and metaphors, and the
prototypical automated implementation of one of these metaphors.
B. Defining real world metaphors for software visualisation.
Two examples of real world metaphors (and the associated mappings and representations) are presented in
this thesis. These demonstrate how real world metaphors can be used as the logical framework from
which representative visual objects can be selected, and by providing a context in which the mappings
from code to visual entity are made. To provide some validation of these metaphors, they are evaluated in
-174-
Virtual Software in Reality Claire Knight Conclusions
a comparative framework. One of the metaphors, Software World, has been prototypically implemented
and used for scenario demonstrations to illustrate how it would be useful in practice.
C. Assessing the suitability of real world metaphors for representing intangible data sources.
The application of one of the real world metaphors identified in this thesis has shown that such
representations and mappings can be used when the data source being visualised is inherently intangible.
This provides evidence that such techniques can be successfully used, but it does not provide a
guarantee that just by using a real world metaphor (and associated mappings and representations) a
visualisation will be a success. There are many caveats relating to the use of metaphors; not least the fact
that by violating the logical framework which it provides is very likely to cause cognitive disorientation
for the user, destroying their usage and reasoning expectations and thus rendering the use of such
techniques invalid.
D. Examining the ability of a visualisation to be able to scale to deal with increased size and complexity.
The metaphors presented in this thesis have been designed to accommodate varying sizes of underlying
data sets. This has been demonstrated in the theory of the metaphors, where the mapping suggests certain
restrictions based on data source size. It has also been investigated with the automated prototype. This
prototype has been tested on a wide range of source code files of differing sizes (with respect to all
visualisable attributes) and is able to generate differing images based on current and expected sizings.
E. Demonstrating the automatability of three-dimensional visualisations.
It has been shown, through the prototype implementation of one of the metaphors, that it is possible to
automatically generate three-dimensional visualisations without human intervention. This generation is
also able to deal with different sizes of source information and to tailor the initial visualisation around the
current size of the data. It has also been shown that the use of real world metaphors for visualisation
should not be disregarded because of any added complexity in automatically generating that visualisation.
The prototype created for this research creates scenes based on Software World which is a real world
based visualisation. The overhead of real world representations is no greater than for any automatic
generation of three-dimensional worlds, because ultimately polygons are used to represent everything in
computer generated space.
F. Identifying the impact that issues such as evolution, navigation and correlation of information have on
software visualisation.
These issues have been discussed in several places throughout this thesis as they have a large impact on
the metaphors, mappings and representations used for software visualisation. It is therefore important that
they are considered as high priorities for software visualisation. It needs to be stressed that they have a
major impact on the success of such visualisations. These features are first addressed in Chapter 5, where
each is discussed as an important issue. They are then addressed in relation to the two metaphors in
Chapter 6, where the ability of the metaphor to deal with such issues is examined and discussed. Chapter
- 175-
Virtual Software in Reality Claire Knight Conclusions
7 provides some practical issues relating to automation. Finally the same issues are borne in mind in the
evaluation carried out in Chapter 8.
G. The development of a framework as a way of being able to judge whether a virtual environment based
software visualisation is able to meet the visual and comprehension demands that wil l be placed upon
it.
Such a framework has been presented in Chapter 8 of this thesis. It aims to provide a comparative
framework for assessing which of the identified features a visualisation has. These features are an
amalgamation of program comprehension and visualisation guidelines that have been brought together in
an effort to address the shortcomings of existing frameworks when considering three-dimensional software
visualisation.
This thesis has investigated a constrained type of metaphor for software visualisation for the simple reason
that whilst an examination of the use of real world metaphors was important, it was also considered
important to understand the effects of such issues as evolution, navigation, scalability and automation.
These particular issues are important for all visualisations, but the lack of research into real world
metaphor visualisations meant that these issues could have rendered them unusable, representation and
mapping issues aside. This is not considered to be a failing because the overall focus and intention of the
research (as indicated in the criteria for success) was to achieve a wider range of objectives. It has been
shown, with reference to the appropriate parts of this thesis, that this research has succeeded in achieving
the identified aims and criteria for success.
9.4 Future Work
The relationships in Chapter 5 suggest that the future research agenda should focus on three-dimensional
virtual environment visualisations. This applies equally well to all the identified areas of future work, but
it is also important to note that these relationships do not discredit the existing techniques. The
relationships provide a direction for moving on from this research, but the existing representations and
methods have their place with respect to solving certain problems. These earlier advances, for example
certain graph layout techniques, can be exploited where appropriate in this new work but the advancement
of three-dimensional visualisation has much more to offer and will continue to do so whilst there are such
further rich areas as identified in this section.
There are many directions in which this research could progress, not least because of the wide variety of
applications and enhancements to which this work would act as a basis. Some of this future work centres
around the refinement of this research for the purposes of making such techniques more widely available
to industrial users. Without some form of affordable mechanism (such as a tool suite) with which to
- 176-
Virtual Software in Reality Claire Knight Conclusions
implement the new ideas, industry has neither the time nor the inclination to take up new concepts. There
are also wider issues, which are more research-focused extensions of this research.
1. Consideration of other programming languages and alternative analysis
In conjunction with the idea of creating robust tool suites, there is the application of these ideas to a wider
range of (and therefore attributes of) software and systems. This work has concentrated on the
visualisation of static Java source code, which forms only a small part of the whole arena of software
visualisation. There are other languages to consider, different programming paradigms (thus affecting the
language used and the structure of the source code solution), the dynamic properties of the program, and
to scale the ideas up to encompass wider attributes of the overall system.
2. Collaborative and knowledge sharing environments
Moving away from the advancements of the technique as it stands there are also many issues relating to
virtual environments. The concept of collaboration in real and virtual places with computer systems is
one that has wide application. There is an entire research area concerned solely with the concept of multi
user Collaborative Virtual Environments (CVE) where the issues of representation of users,
communication mechanisms, awareness of environment, self and others and the means of interaction with
all elements of the environment (including users) are under investigation.
The environments created in Software World and Software Landscape could be enhanced and adapted to
enable a much greater amount of user communication and collaboration. This is one area that could prove
very valuable to many industrial companies; a primary source of system information is contained within
the minds of those who maintain that system. This information is rarely documented and when the
maintainer leaves, the information is lost. By providing virtual spaces directly representative of the
system which is being maintained, in which fellow maintainers can communicate, provides one way for
this information to at least be passed between colleagues.
3. Data mining; visualising the results and using the visualisation to facilitate automated
information retrieval
A technique that has been suggested for integration with virtual environments is data mining. There is
already a body of visualisation literature that deals with the visual representation and display of the results
of mining large data sources, such as visual query environments. The use of virtual environments to
represent the data and then having some part of that system guide the user based on data mining
algorithms is an alternative area that could prove fruitful. The use of data visualisation based
environments provides the user with a consistent environment each time the system is used, provides them
with an awareness of the data set and provides them with a frame of reference for the data they are
currently investigating. This cognitive familiarity should then be an aid to the user, in conjunction with
the mining algorithms, when the underlying data needs to be understood in a variety of situations for
possibly differing tasks.
- 177-
Virtual Software in Reality Claire Knight Conclusions
A particular technology that could be used to achieve this guidance through the virtual world is the use of
an agent that is able to "inhabit" the virtual space and learn about it as it moves through it. By knowing
the environment, the agent can then aid the user in locating the information they require. There is also the
alternative use of agent technology whereby it is used to search the environment for the information and to
present it to the user who is in a different location in the environment. Both of these mechanisms can help
to create a visualisation environment that is capable of being an intelligence amplifying tool.
4. Component oriented approach to metaphors and mappings
An area of further investigation that may prove fruitful is the use of a central visualisation application,
with a well defined interface, which permits the use of representations, mappings, and metaphors to be
used as desired. In conforming to the interface, the representation, mapping, and metaphor component
should provide detail about which of the code items each visual artefact is meant to represent, how the
layout and composition of the visual images are constructed and algorithms to handle any specific
interactions. This approach would also require that the format of the underlying data be considered. The
component based visual representation and mapping would still need to know and appreciate the structure
of the data. It would be for this reason that the component basis would work well in providing different
visualisations (based on alternative representations, mappings, and metaphors) whilst the central
application dealt with the data. The reverse of this would be hard to deal with and much transformation
and coercion of the data would be required to fit to the structure of one central visualisation. Such an
approach should be considered poor because of the flaws it would create in the metaphor reasoning model
of the user. This component oriented approach also has potential in providing user configurable interfaces
to the data; representation and metaphor can be user and task dependent in their effectiveness and this
allows a visualisation to support a range of visual displays.
9.5 Conclusion
This research has shown the viability of using three-dimensional real world software visualisations. The
important issues of navigation, evolution, scalability and automation have been presented and discussed,
and their relationship to real world metaphors examined. This has been done in conjunction with an
investigation into the use of such real world metaphors for software visualisation. The research as a whole
has provided an important examination of many of the issues related to these sorts of visualisation in the
context as software and is therefore a valuable basis for future work in this area.
- 178-
Virtual Software in Reality
References
Virtual Software in Reality Claire Knight References
References
[Andr97] K. Andrews, J . Wolte, and M. Pichler, Information Pyramids™: A New Approach to Visualising Large Hierarchies, Late Breaking Hot Topics, Proceedings of IEEE Visualisation 97, pp49-52, October 1997.
[Auks92] S. Aukstakalnis and D. Blatner, Silicon Mirage: The Art and Science of Virtual Reality, Peach Pit Press, 1992.
[Bake95] M. J . Baker and S. G. Eick, Space Filling Software Visualization, Journal of Visual Languages and Computing, Vol. 6, pp 119-133, 1995.
[Ball96] T. Ball and S. G. Eick, Software Visualization in the Large, IEEE Computer, pp33-43, April 1996.
[Benf95] S. Benford, J , Bowers, L . E . Fahlen, C. Greenhalgh, and D. Snowden, User Embodiment in Collaborative Virtual Environments, Proceedings of SIGCHI 95, ACM, May 7-11, 1995.
[Benf96] S. Benford, C. Brown, G. Reynard, and C. Greenhalgh, Shared Spaces: Transportation, Artificiality and Spatiality, Proceedings of the 1996 ACM Conference on CSCW, pp77-85, November 16-20, 1996.
[Benf97] S. Benford, C. Greenhalgh, D. Snowdon, and A. Bullock, Staging a Public Poetry Performance in a Collaborative Virtual Environment, Proceedings of the 5 t h European Conference on CSCW 97, ppl25-140, Kluwer Academic Publishers, 1997.
[Benn94] K. H. Bennett and M. P. Ward, Theory and Practice of Middle-Out Programming to Support Program Understanding, 3 r d IEEE Workshop on Program Comprehension, ppl68-175, November 14-15, 1994.
[Bigg94] T. J . Biggerstaff, B. G. Mitbander, and D. E . Webster, Program Understanding and the Concept Assignment Problem, Communications of the ACM, Vol. 37, No. 5, pp72-82, May 1994.
[Blac96] A. F . Blackwell, Metaphor or Analogy: How Should We See Programming Abstractions?, Proceedings of the 8 t h Annual Workshop of the Psychology of Programming Interest Group, pp 105-113, 1996.
[Bola94] M. T. Bolas, Human Factors in the Design of an Immersive Display, IEEE Computer Graphics and Applications, pp55-59, January 1994.
[Bowe96] J . Bowers, J . O'Brien, and J . Pycock, Practically Accomplishing Immersion: Cooperation in and for Virtual Environments, Proceedings of the 1996 ACM Conference on CSCW, pp380-389, November 16-20, 1996.
[Bray96] T. Bray, Measuring the Web, 5* International World Wide Web Conference, May 6-10 th 1996. Conference web site at http://www5conf.inria.fr/
[Broo83] R. Brooks, Toward a Theory of Comprehension of Computer Programs, International Journal of Man-Machine Studies, Vol. 18, No. 6, pp542-554, 1983.
[Broo87] F . P. Brooks, No Silver Bullet, IEEE Computer, pplO-19, April 1987.
- 180-

Virtual Software in Reality Claire Knight References
[Burd96] E . L . Burd, P. S. Chan, I . M. M. Duncan, M. Munro, and P. Young, Improving Visual Representations of Code, University of Durham, Computer Science Technical Report 10/96,1996.
[Card91] S. K . Card, G. G. Robertson, and J . D. Mackinlay, The Information Visualizer: An Information Workspace, Xerox Palo Alto Research Centre, Palo Alto, California 94304, 1991.
[Cast97] J . Castellanos, Postulates and Proofs, On-line document available from http://riceinfo.rice.edu/projects/NonEuclid/proof.html.
[Chal95] M. Chalmers, Design Perspectives in Visualising Complex Information, Proceedings IFIP 3 r d Visual Databases Conference, March 1995. http://www.ubs.com/info/ubilab/print versions/ps/cha95.ps.gz.
[Chan97] P. S. Chan and M. Munro, PUI: A Tool to Support Program Understanding, Proceedings of the IEEE 5 t h International Workshop on Program Comprehension, ppl92-198, May 28-30, 1997.
[Chap96] N. Chapin and T. S. Lau, Effective Size: An Example of Use from Legacy Systems, Journal of Software Maintenance: Research and Practice, Vol. 8, pplOl-116, 1996.
[Chen99] C . Chen and J . Davies, Integrating Spatial, Semantic, and Social Structures for Knowledge Management, Proceedings of 32 n d Annual Hawaii International Conference on Systems Sciences (HICSS-99), January 5-8, 1999.
[Corb89] T. A. Corbi, Program Understanding: Challenge for the 1990s, IBM Systems Journal, Vol. 28, No. 2, pp294-306, 1989.
[Chri95] C. Christou and A. Parker, Visual Realism and Virtual Reality: A Psychological Perspective, In Simulated and Virtual Realities - Elements of Perception, Taylor and Francis Publishers, 1995.
[Cros97] M. Crossley, N. J . Davies, R. J . Taylor-Hendry, and A. J . McGrath, Three-dimensional Internet Developments, BT Technology Journal, Vol. 15, No. 2, ppl79-193, April 1997.
[Cros99] M. Crossley, N. J . Davies, A. J . McGrath, and M. A. Z. Rejman-Greene, The Knowledge Garden, BT Technology Journal, Vol. 17, No. 1, pp76-84, January 1999.
[Dame96] B. Darner and A. Bruckman (Moderators), PANEL: Peopled Online Virtual Worlds: A New Home for Cooperating Communities, a New Frontier for Interaction Design, Proceedings of the 1996 ACM Conference on CSCW, pp441-442, November 16-20, 1996.
[Davi95] S. Davis, A Guessing Measure of Program Comprehension, International Journal of Human-Computer Studies, Vol. 42, pp245-263, 1995.
[Dieb93a] A. Dieberger, The Information City - A Step Towards Merging of Hypertext and Virtual Reality, Poster at Hypertext 1993.
[Dieb93b] A. Dieberger, The Information City - A Metaphor for Navigating Hypertexts, Presented at BCS-HCI 93, September 1993.
[Dieb93c] A. Dieberger and J . G. Tromp, The Information City Project - A Virtual Reality User Interface for Navigation in Information Spaces, Was to appear in Proceedings of the Symposium Virtual Reality Vienna, December 1-3, 1993 but was never printed.
- 181 -
Virtual Software in Reality Claire Knight References
[Dieb94] A. Dieberger, Navigation in Textual Virtual Environments using a City Metaphor, PhD thesis, Vienna University of Technology, Faculty of Technology and Sciences, November 1994.
[Dieb95a] A. Dieberger, Providing spatial navigation for the World Wide Web, Spatial Information Theory, Proceedings of Cosit 95, pp93-106, September 1995.
[Dieb95b] A. Dieberger, On Magic Features in (Spatial) Metaphors, SigLink Newsletter, Vol. 4, No. 3, December 1995.
[Dieb96] A. Dieberger, Browsing the WWW by Interacting with a Textual Virtual Environment -A Framework for Experimenting with Navigational Metaphors, Proceedings of ACM Hypertext 96, ppl70-179, March 1996.
[Dieb97] A. Dieberger, Navigation Metaphors and Social Navigation in Information Spaces, Position Paper for the CHI 97 workshop on Navigation in Information Spaces, 1997.
[Dutt99] R. T. Dutton, J. C. Foster, and M. A. Jack, Please Mind the Doors - Do interface metaphors improve the usability of voice response services?, BT Technology Journal, Vol. 17, No. 1, ppl72-177, January 1999.
[Eick96] S. G. Eick, Aspects of Network Visualization, Special Report, Computer Graphics and Visualization in the Global Information Infrastructure, Computer Graphics and Applications, Vol. 16, No. 2, March 1996.
[Eick97] S. G. Eick, Engineering Perceptually Effective Visualizations for Abstract Data, In Scientific Visualization Overviews, Methodologies and Techniques, IEEE Computer Science Press, ppl91-210, February 1997.
[E1H94] S. R. Ellis, What Are Virtual Environments?, IEEE Computer Graphics and Applications, ppl7-22, January 1994.
[Feij98] L . Feijs and R. de Jong, 3D Visualization of Software Architectures. Communications of the ACM, Vol. 41, No. 12, pp72-78, December 1998.
[Find95] J . M. Findlay and F . N. Newell, Perceptual cues and object recognition, In Simulated and Virtual Realities: Elements of perception, Taylor & Francis Publishers, ppl 13-130 1994.
[Fitz96] G. Fitzpatrick, S. Kaplan, and T. Mansfield, Physical Spaces, Virtual Places and Social Worlds: A study of work in the virtual, Proceedings of the 1996 ACM Conference on CSCW, pp 334-343, November 16-20, 1996.
[Flet88] N. T. Fletton and M. Munro, Redocumenting Software Systems using Hypertext Technology, IEEE Conference on Software Maintenance, pp54-59, 1988.
[Fost87] J . R. Foster and M. Munro, A Documentation Method Based on Cross-Referencing, Proceedings of the IEEE Conference on Software Maintenance, ppl81-185, 1987.
[Frie91] R. M. Friedhoff and W. Benzon, Visualization: The Second Computer Revolution, W. H. Freeman and Company, 1991.
[Gard93] B. R. Gardner, The Creator's Toolbox, In Virtual Reality: Applications and Explorations, Academic Press Professional, Cambridge, MA, pp91-121, 1993.
[Gele98] D. Gelernter, The Aesthetics of Computing, Weidenfeld & Nicolson, 1998.
[Glob94] A. Globus and E . Raible, Fourteen Ways to Say Nothing With Scientific Visualization, IEEE Computer, pp86-88, July 1994.
- 182-
Virtual Software in Reality Claire Knight References
[Hans94] A. J . Hanson, T. Munzner, and G. Francis, Interactive Methods for Visualizable Geometry, IEEE Computer, pp73-83, July 1994.
[Harm96] R. Harmon, W. Patterson, W. Ribarsky, and J . Bolter, The Virtual Annotation System, Technial Report GIT-GVU-96-01, Proceedings of VRAIS 96, pp239-245, 1996.
[Hemm94] M. Hemmje, C. Kunkel, and A. Willett, LyberWorld - A Visualization User Interface Supporting Fulltext Retrieval, Proc. of SIGIR 94,1994.
[Hend95a] B. Hendley and N. Drew, Visualisation of complex systems, University of Birmingham (UK) School of Computer Science, 1995.
[Hend95b] R. J . Hendley, N. S. Drew, A. M. Wood, and R. Beale, Narcissus: Visualising Information, University of Birmingham, Advanced Interaction Group Technical Report, 1995.
[HU193] W. C. Hill and J . D. Hollan, History-Enriched Source Code, Computer Graphics and Interactive Media Research Group, Bell Communications Research, Submitted to ACM UIST 93, 1993.
[Hodg95] L . F . Hodges, R. Kooper, T. C. Meyer, B. O. Rothbaum, D. Opdyke, J . J . de Graaff, J . S. Williford, and M. M. North, Virtual Environments for Treating the Fear of Heights, IEEE Computer, pp27-33, July 1995.
[Hubb93] R. Hubbold, A. Murta, A. West, and T. Howard, Design Issues for Virtual Reality Systems Presented at the First Eurographics Workshop on Virtual Environments, 7 September 1993.
[Hubb96] R. J . Hubbold, X. Dongbo, and S. Gibson, MA VERIK - the Manchester Virtual Environment Interface Kernel, Proceedings of the 3 r d Eurographics Workshop on Virtual Environments, February 1996.
[IdSoftware] Id Software homepage can be found online at http://www.idsoftware.com/.
[Ingr95] R. Ingram and S. Benford, Legibility Enhancement for Information Visualisation, Proceedings of IEEE Visualization '95, October 30 - November 3 1995.
[Isda93] J . Isdale, What is Virtual Reality?, On-line document available from http://www.cms.dmu.ac.uk/~cph/VR/whatisvr.html.
[Jerd95] D. F . Jerding and J . T. Stasko, Using Information Murals in Visualization Applications, Proceedings of UIST '95 (ACM), November 14-17, 1995.
[Jerd96] D. F . Jerding and J . T. Stasko, The Information Mural (DRAFT), Available online from http://www.cc.gatech.edu/gvu/softviz/infoviz/information mural.html.
[John94] A. Johnson and F . Fotouhi, The SANDBOX: a Virtual Reality Interface to Scientific Databases, Proceedings of the 7 t h International Working Conference on Scientific & Statistical Database Management, pp 12-21, September 1994.
[John95] A. Johnson and F . Fotouhi, Data Retrieval Through Virtual Experimentation, Computer Graphics: Developments in Virtual Environments - Proceedings of Computer Graphics International, pp393-409, June 1995.
[Juhn98] J . Jiihne, A. T. Jensen, and K. Grtfnbrek, Ariadne: a Java-based guided tour systems for the World Wide Web, 7 t h International World Wide Web Conference, 14-18 April 1998. Conference web site at http://www7.conf.au/.
- 183
Virtual Software in Reality Claire Knight References
[Kala99] R. S. Kalawsky, S. T. Bee, and S. P. Nee, Human Factors Evaluation Techniques to Aid Understanding of Virtual Interfaces, BT Technology Journal, Vol. 17, No. 1, ppl28-141, January 1999.
[Kenn96] J . B. Kennedy, K. J . Mitchell, and P. J . Barclay, A Framework for Information Visualisation, ACM SIGMOD Record, special issue on Information Visualisation, Vol. 24, No. 4, 1996.
[Keny95] R. V. Kenyon, T. A. DeFanti, and D. J . Sandin, Visual Requirements for Virtual Environment Generation, Society of Information Display International Symposium (SID 95), Vol. 26, pp357-360, 1995
[Knig97] C. Knight, Understanding Java, BSc. Dissertation (1997), Department of Computer Science, University of Durham, UK.
[Knig99a] C. Knight and M.Munro, Comprehension withfin] Virtual Environment Visualisations, Proceedings of the IEEE 7 t h International Workshop on Program Comprehension, pp4-l 1, May 5-7, 1999. http://www.dur.ac.uk/~dcslcrk/workfiles/documents/knight-iwpc99.ps.gz
[Knig99b] C. Knight and M. Munro, Visualising Software - A Key Research Area, University of Durham, Computer Science Technical Report 8/99. http://www.dur.ac.uk/-dcslcrk/workfiles/documents/tech-report-5-99.ps.gz
[Knig99c] C. Knight and M. Munro, Visualising Software - A Key Research Area, Proceedings of the IEEE International Conference on Software Maintenance, August 30 - September 3, 1999. (Short paper.) http://www.dur.ac.uk/~dcslcrk/workfiles/documents/knight-icsm99.ps.gz
[Land88] L . D. Landis, P. M. Hyland, A. L . Gilbert, and A. J . Fine, Documentation in a Software Maintenance Environment, Proceedings of the IEEE Conference on Software Maintenance, pp66-73, 1988.
[Leig96] J . Leigh and A. E . Johnson, Supporting Transcontinental Collaborative Work in Persistent Virtual Environments, IEEE Computer Graphics & Applications, Vol. 16, No. 4, pp47-51, July 1996.
[Leig98] J . Leigh, P. J . Rajlich, R. J . Stein, A. E . Johnson, and T. A. DeFanti, UMBO/VTK: A Tool for Rapid Tele-Immersive Visualization, Proceedings of IEEE Visualization '98, October 18-23, 1998.
[Leig99] J . Leigh, Tele-Immersion supports global collaboration, Scientific Computing World, ppl9-20, April/May 1999.
[Leto87] S. Letovsky, Cognitive Processes in Program Comprehension, Journal of Systems and Software, Vol. 7, pp325-339,1987.
[Levi95] S. Levialdi, A. Massari, and L . Saladini, Visual Metaphors for Database Exploration, A position paper relating the Virgilio system, available on-line from http://www.darmstadt.gmd.de/~hemmie/Activities/Virgilio/Publications/virgilio.ps.
[Lien80] B. P. Lientz and E . B. Swanson, Software Maintenance Management, Addison-Wesley, 1980.
[Lino93] P. Linos, P. Aubet,. Dumas, Y . Helleboid, P. Lejeune, and P. Tulula, Facilitating the Comprehension of C Programs: An Experimental Study, Proceedings of the 2 n d IEEE Workshop on Program Comprehension, pp55-63, July 8-9, 1993.
- 184-
Virtual Software in Reality Claire Knight References
[Lino94] P. K. Linos and V. Courtois, A Tool for Understanding Object-Oriented Program Dependencies, Proceedings of the 3 r d IEEE Workshop on Program Comprehension, pp20-27, November 14-15, 1994.
[Litt86] D. C. Littman, J . Pinto, S. Letovsky, and E . Soloway, Mental Models and Software Maintenance, Empirical Studies of Programmers, Ed. E. Soloway and S. Lyengar, pp80-98, 1986.
[Liva93] P. E . Livados and S. D. Alden, A Toolset for Program Understanding, Proceedings of the 2 n d IEEE Workshop on Program Comprehension, ppl 10-118, July 8-9, 1993.
[Lumb95] M. Lumbreras and G. Rossi, A Metaphor for the Visually Impaired: Browsing Information in a 3D Auditory Environment, Proceedings of CHI 95 Short Papers (CHI Companion 95), pp216-217, May 7-11 1995.
[Mach94] C . Machover and S. E . Tice, Virtual Reality, IEEE Computer Graphics and Applications, ppl5-16, January 1994.
[Madh95] T. M. Madhyastha and D. A. Reed, Data Sonification: Do You See What I Hear?, IEEE Software, pp45-56, March 1995.
[Mayr95] A. Von Mayrhauser and A. M. Vans, Program Comprehension During Software Maintenance and Evolution, IEEE Computer, pp44-55, August 1995.
[Mayr97] A. Von Mayrhauser, A. M. Vans, and A. E . Howe, Program Understanding Behaviour during Enhancement of Large-scale Software, Journal of Software Maintenance: Research and Practice, Vol. 9, pp299-327, 1997.
[Moni94] N. Monin and D. J . Monin, Personification of the Computer: A Pathological Metaphor in IS, Proceedings of SIGCPR 94, ACM Press.
[Munr87] M. Munro and D. J . Robson, An Interactive Cross Reference Tool For Use in Software Maintenance, Proceedings of the 20 t h Annual Hawaii International Conference on System Sciences, pp64-70, 1987.
[Myer90] B. A. Myers, Taxonomies of Visual Programming and Program Visualization, Journal of Visual Languages and Computing, Vol. 1, pp97-123, 1990.
[Naka96] H. Nakanishi, C . Yoshida, T. Nishimura, and T. Ishida, FreeWalk: Supporting Casual Meetings in a Network, Proceedings of the 1996 ACM Conference on CSCW, pp308-314, November 16-20, 1996.
[Ogan94] R. M. Ogando, S. S. Yau, S. S. Liu, and N. Wilde, An Object Finder for Program Structure Understanding in Software Maintenance, Journal of Software Maintenance: Resarch and Practice, Vol. 6, pp261-283, 1994.
[Oman90a] P. W. Oman and C . R. Cook, Typographic Style is More than Cosmetic, Communications of the ACM, Vol. 33, No. 5, pp506-520, May 1990.
[Oman90b] P. Oman, Maintenance Tools, IEEE Software, pp59-65, May 1990.
[Penn87] N. Pennington, Stimulus Structures and Mental Representations in Expert Comprehension of Computer Programs, Cognitive Psychology, Vol. 19, No. 3, pp295-341, July 1987.
[Pesc93] M. D. Pesce, Final Amputation: Pathogenic Ontology in Cyberspace, Presented at the Third International Conference on Cyberspace, University of Texas, May 1993.
- 185-
Virtual Software in Reality Claire Knight References
[Pett96] S. R. Pettifer, Beyond the Metaphysics of Virtual Reality, M . Sc. Thesis, Department of Computer Science, University of Manchester, UK. January 1996.
[Pett97a] S. Pettifer and A. West, Deva: A coherent operating environment for large scale VR applications, Presented at the first Virtual Reality Universe conference, April 1997.
[Pett97b] S. Pettifer and A. West, Worlds within Worlds: on the topology of virtual space, Presented at Cyberconf, Oslo (http://www.cyberconf.org). June 1997.
[Pott93] C . Potts, Software Engineering Research Revisited, IEEE Software, ppl9-28, September 1993
[Pric92] B. A. Price, R, M . Baecker, and I . S. Small, A Principled Taxonomy of Software Visualization, Journal of Visual Languages and Computing, Vol. 4, No. 3, pp211-266, 1992.
[Rajl90] V. Rajlich, N . Damaskinos, and P. Linos, VIFOR: A Tool for Software Maintenance, Software Practice and Experience, Vol. 20, No. 1, pp67-77, January 1990.
[Rajl96] V. Rajlich and S. R. Adnapally, VIFOR 2: A Tool for Browsing and Documentation, IEEE International Conference of Software Maintenance, pp 296-300, 1996.
[Rhei92] H. Rheingold, Virtual Reality, Mandarin Science, 1992.
[Rich88] C . Rich and R. C. Waters, The Programmer's Apprentice: A Research Overview, Computer, Vol. 21, No. 11, ppl0-25, November 1988.
[Robs91] D. J . Robson, K. H. Bennett, B. J . Cornelius, and M. Munro, Approaches to Program Comprehension, Journal of Systems and Software 14, pp79-84, 1991.
[Roma92] G-C Roman and K . C. Cox, Program Visualization: The Art of Mapping Programs to Pictures, Proceedings of the 14 th International Conference on Software Engineering, pp412-420, May 1992.
[Roma93] G. C . Roman and K. C. Cox, A Taxonomy of Program Visualization Systems, IEEE Computer, ppll-24, December 1993.
[Roy95] T. M. Roy and T. A. DeFanti, Interactive Visualization in a High Performance Computing Virtual Environment, Proceedings of the 1995 Simulation Multiconference, The Society for Computer Simulation, pp471-476, 1995.
[Salz99] M. C. Salzman, C. Dede, and R. Bowen Loftin, VR's Frames of Reference: A Visualization Technique for Mastering Abstract Multidimensional Information, Proceedings of CHI'99, 15-20 May, 1999.
[Shne96] B. Shneiderman, 77ie Eyes Have It: A Task by Data Type Taxonomy for Information Visualisations, University of Maryland, Computer Science Technical Report CS-TR-3665, July 996.
[Solo84] E . Soloway and K. Ehrlich, Empirical Studies of Programming Knowledge, IEEE Transactions on Software Engineering, Vol. SE10, No. 5, pp 595-609, September 1984.
[Stac95] W. Stacy and J . MacMillian, Cognitive Bias in Software Engineering, Communications of the ACM, Vol. 38, No. 6, pp57-63, June 1995.
[Stas92] J . T. Stasko, Three-Dimensional Computation Visualization, Georgia Institute of Technology, Technical Report GIT-GVU-92-20, 1992.
- 186-

Virtual Software in Reality Claire Knight References
[Stor95] M-A. D. Storey and H. A. Miiller, Manipulating and Documenting Software Structures Using SHriMP Views, Proceedings of ICSM 95, pp 275-284, October 17 -20, 1995.
[Stor96] M.-A. D. Storey, H. A Miiller, and K. Wong, Manipulating and Documenting Software Structures, In Software Visualization, World Scientific Publishing Co., pp244-263, November 1996.
[Stor97] M.-A. D. Storey, F . D. Fracchia, and H. A. Miiller, Cognitive Design Elements to Support the Construction of a Mental Model During Software Visualization, Proceedings of the 5 t h IEEE International Workshop on Program Comprehension, ppl7-28, May 28-30, 1997.
[Tama88] R. Tamassia, G. D. Battista, and C. Battini, Automatic Graph Drawing and Readability of Diagrams, IEEE Transactions on Systems, Man, and Cybernetics, 18(1), pp61-79, January/February 1988.
[Teas94] B. E . Teasey, The Effects of Naming Style and Expertise in Program Comprehension, International Journal of Human-Computer Studies, Vol. 40, pp757-770, 1994.
[Thur95] M. Thuring, J . Hannemann, and J . M. Haake, Hypermedia and Cognition: Designing for Comprehension, Communications of the ACM, Vol. 38, No. 8, pp57-66, August 1995.
[Unreal] The official Unreal web site can be found at http://www.unreal.com/.
[Vaan93] K. Vaananen, Multimedia Environments: Supporting Authors and Users with Real-World Metaphors, Proceedings of the Conference on Human Factors in Computing Systems (INTERACT 93), pp99-100, 1993.
[Vaan94] K . Vaananen and J . Schmidt, User Interfaces for Hypermedia: How to Find Good Metaphors?, Proceedings of CHI 94 Short Papers (CHI Companion 94), pp263-264, April 24-28, 1994.
[Walk95] G. Walker, Challenges in Information Visualisation, British Telecommunications Engineering Journal, Vol. 14, ppl7-25, April 1995.
[Walk96] G. Walker, J . Morphett, M. Fauth, and P. Rea, Interactive Visualisation and Virtual Environments on the Internet, British Telecommunications Engineering, Vol. 15, pp91-99, April 1996.
[Ware93] C . Ware, D. Hui, and G. Franck, Visualizing Object Oriented Software in Three Dimensions, CASCON 93 (IBM Centre for Advanced Studies), Conference Proceedings, pp 612-620, October 1993.
[Wied91] S. Wiedenbeck, The Initial Stage of Program Comprehension, International Journal of Man-Machine Studies, Vol. 35, pp517-540, 1991.
[Wiss98] U. Wiss and D. Carr, A Cognitive Classification Framework for 3-Dimensional Information Visualization, Research report LTU-TR--1998/4--SE, Lulea University of Technology, 1998.
[Youn96] P. Young, Three Dimensional Information Visualisation, University of Durham, Computer Science Technical Report 12/96, 1996.
[Youn97] P. Young and M. Munro, A New View of Call Graphs for Visualising Code Structures, University of Durham, Computer Science Technical Report 03/97, April 1997.
- 187 -
Virtual Software in Reality Claire Knight References
[Youn98] P. Young and M. Munro, Visualising Software in Virtual Reality, Proceedings of the IEEE 6 t h International Workshop on Program Comprehension, pp 19-26, June 24-26, 1998.
[Youn99] P. Young, Visualising Software in Cyberspace, PhD Thesis, University of Durham, October 1999.
- 188-
Virtual Software in Reality
Bibliography
Virtual Software in Reality Claire Knight Bibliography
Bibliography
[Anti96] J . M. Antis, S. G. Eick, and J . D. Pyrce, Visualizing the Structure of Large Relational Databases, Feature article, IEEE Software, Vol. 13, No. 1, pp72-79, January 1996.
[Arab92] M. Arab, Enhancing Program Comprehension: FORMATTING and DOCUMENTING, ACM SIGPLAN Notices, Vol. 27, No. 2, pp37-46, February 1992.
[Basi86] V. R. Basili, R. W. Selby, and D. H. Hutchens, Experimentation in Software Engineering, IEEE Transactions on Software Engineering, Vol. SE-12, No. 7, pp733-743, July 1986.
[Benf93] S. Benford and L . Fahlen, A Spatial Model of Interaction in Large Virtual Environments, Proceedings of the 3rd European Conference on CSCW, ppl09-124, 1993.
[Benf97] S. Benford and C . Greenhalgh, Introducing Third Party Objects into the Spatial Model of Interaction, Proceedings of the 5 t h European Conference on CSCW 97, Kluwer Academic Publishers, ppl89-204, 1997.
[Bent93] R. Bentley, T. Rodden, P. Sawyer, and I . Sommerville, Architectural Support for Cooperative Multi-User Interfaces, Research Report CSCW/11/93, Centre for Research in CSCW, Lancaster University, 1993.
[Bian93] N . Bianchi, P. Bottoni, P. Mussio, and M. Protti, Cooperative Visual Environments for the Design of Effective Visual Systems, Journal of Visual Languages and Computing, Vol. 4, pp357-381, 1993.
[Bieb95] M. Bieber and C . Kacmar, Designing Hypertext Support for Computational Applications, Communications of the ACM, Vol. 38, No. 8, pp99-107, August 1995.
[Brys96] S. Bryson, Virtual Reality in Scientific Visualization, Communications of the ACM, Vol. 39, No. 5, pp62-71, May 1996.
[Chur98] E . F . Churchill and D. Snowdon, Collaborative Virtual Environments: An Introductory Review of Issues & Systems, Virtual Reality, Vol. 3, No. 1, pp3-15, 1998.
[Csin92] A. Csinger, The Psychology of Visualization, Department of Computer Science, University of British Columbia, November 1992.
[Duma95] J . Dumas and P. Parsons, Discovering the Way Programmers Think: New Programming Environments, Communications of the ACM, Vol. 38, No. 6, pp45-56, June 1995.
[Enca94] J . Encarnacao, M. Gobel, and L . Rosenblum, European Activities in Virtual Reality, IEEE Computer Graphics and Applications, pp66-74, January 1994.
[Gers95] N . Gershon and S. G. Eick, Visualization's New Tack: making sense of information, IEEE Spectrum, Vol. 32, No. 11, pp38-56, November 1995.
[Gibs84] W. Gibson, Neuromancer, Voyager, an imprint of HarperCollins Publishers, 1995.
[Glas94] R. L . Glass, The Software Research Crisis, IEEE Software, pp 42-47, November 1994.
- 190-
Virtual Software in Reality Claire Knight Bibliography
[Gobl95] J . C . Goble, K. Hinckley, R. Pausch, J . W. Snell, and N. F . Kassell, Two-Handed Spatial Interface Tools for Neurosurgical Planning. IEEE Computer, pp20-26, July 1995.
[Hibb94] W. L . Hibbard, B. E . Paul, D. A. Santek, C. R. Dyer, and M-F. Voidrot-Martinez, Interactive Visualization of Earth and Space Science Computations, IEEE Computer, pp65-72, July 1994.
[Isak95] T. Isakowitz, E . A. Stohr, and P. Balasubramanian, RMM: A Methodology for Structured Hypermedia Design, Communications of the ACM, Vol. 38, No. 8, pp34-44, August 1995.
[Issa96] E . A. Issacs, J . C . Tang, and T. Morris, Piazza: A Desktop Environment Supporting Impromptu and Planned Interaction, Proceedings of the 1996 ACM Conference on CSCW, pp315-324, November 16-20, 1996.
[Jerd94] D. F . Jerding and J . T. Stasko, Using Visualization to Foster Object-Oriented Program Understanding, Georgia Institute of Technology Technical Report GIT-GVU-94-33, July 1994.
[Kitc95] B. Kitchenham, L . Pickard, and S. L . Pfleeger, Case Studies for Method and Tool Evaluation, IEEE Software, pp52-62, July 1995
[Kroh96] U. Krohn, Visualization for Retrieval of Scientific and Technical Information, Doctoral Thesis (PhD), Fakultat fur Bergbau, Hiittenwesen und Maschinenwesen der Technischen Universitat Clausthal, April 1996.
[Kuhl95] J . Kuhl, D. Evans, Y. Papelis, R. Romano, and G. Watson, The Iowa Driving Simulator: An Immersive Research Environment, IEEE Computer, pp35-41, July 1995.
[Lehm80] M. M. Lehman, On Understanding Laws, Evolution and Conservation in the Large-Program Life Cycle, The Journal of Systems and Software, pp213-221, 1980.
[Lien81 ] B. P. Lientz and E . B. Swanson, Problems in Application Software Maintenance, Communications of the ACM, Vol. 24, No. 11, pp763-769, November 1981.
[Lohs94] G. L . Lohse, K. Biolsi, N. Walker, and H. H. Rueter, A Classification of Visual Representations, Communications of the ACM, Vol. 37, No. 12, pp36-49, December 1994.
[MASSIVE 1 ] MASSIVE-1 online pages available from http://www.crg.cs.nott.ac.uk/research/systems/MASSIVE/.
[MASSIVE2] MASSIVE-2 (also known as CVE) online pages available from http://www.crg.cs.nott.ac.uk/research/svstems/MASSiVE-2/.
[Mast95] T. W. Mastaglio and R. Callahan, A Large-Scale Complex Virtual Environment for Team Training, IEEE Computer, pp49-56, July 1995.
[Miar83] R. J . Miara, J . A. Musselman, J . A. Navarro, and B. Shneiderman, Program Indentation and Comprehensibility, Communications of the ACM, Vol. 26, No. 11, pp861-867, November 1983.
[Petr95] M. Petre, Why Looking Isn't Always Seeing: Readership Skills and Graphical Programming, Communications of the ACM, Vol. 38, No. 6, pp 33-44, June 1995.
[Petr99] M. Petre and A. F . Blackwell, Mental imagery in program design and visual programming, International Journal of Human-Computer Studies, No. 51, pp7-30, 1999.
- 191 -
Virtual Software in Reality Claire Knight Bibliography
[Pfle95a] S. L . Pfleeger, Experimental Design and Analysis in Software Engineering. Part 2: How to Set Up an Experiment, Software Engineering Notes, Vol. 20, No. 1, pp22-26, January 1995.
[Pfle95b] S. L . Pfleeger, Experimental Design and Analysis in Software Engineering. Part 3: Types of Experimental Design, Software Engineering Notes, Vol. 20, No. 2, ppl4-16, April 1995.
[Riba94a] W. Ribarsky, J . Bolter, A Op den Bosch, and R. van Teylingen, Visualization and Analysis Using Virtual Reality, IEEE Computer Graphics and Applications, pplO-12, January 1994.
[Riba94b] W. Ribarsky, E . Ayers, J . Eble, and S. Mukherjea, Glyphmaker: Creating Customized Visualizations of Complex Data, IEEE Computer, pp57-64, July 1994.
[Samt94] R. Samtaney, D. Silver, N. Zabusky, and J . Cao, Visualizing Features and Tracking Their Evolution, IEEE Computer, pp20-27, July 1994.
[Sand97] O. Sandor, C . Bogdan, and J . Bowers, Aether: An Awareness Engine for CSCW, Proceedings of the 5 t h European Conference on CSCW 97, Kluwer Academic Publishers, pp221-236, 1997.
[Schn87] N. F . Schneidewind, The State of Software Maintenance, IEEE Transactions on Software Engineering, Vol. SE 13, No. 3, pp303-310, March 1987.
[Smit96] G. Smith, Cooperative Virtual Environments: lessons from ID multi user interfaces, Proceedings of the 1996 ACM Conference on CSCW, pp390-397, November 16-20, 1996.
[S0I086] E . Soloway, Learning to Program = Learning to Construct Mechanisms and Explanations, Communications of the ACM, Vol. 29, No. 9, pp850-858, September 1986.
[Step92] N. Stephenson, Snow Crash, Paperback edition published by ROC (Penguin Group) 1993.
[Styt97] M. R. Stytz, T. Adams, B. Garcia, S. M. Sheasby, and B. Zurita, Rapid Prototyping for Distributed Virtual Environments, IEEE Software, pp83-92, Sep/Oct 1997.
[Tapp94] R. Tapp and R. Kazman, Determining the Usefulness of Colour and Fonts in a Programming Task, Proceedings of the 3 r d IEEE Workshop on Program Comprehension, pp 154-161, November 14-15, 1994.
[VRVIBE] VR-VIBE online pages available from http://www.crg.cs.nott.ac.uk/research/technologies/visualisation/vrvibe/.
[Vile97] P. R. S. Vilela, J . C . Maldonado, and M. Jino, Program Graph Visualization, Software Practice and Experience, Vol. 27, No. 11, ppl247-1262, November 1997.
[Ware95] C . Ware, Dynamic Stereo Displays, Proceedings of SIGCHI "95, ACM, May 7-11, 1995. Available at http://www.acm.org/sigchi/chi95/proceedings/papers/cw bdv.htm.
- 192-