u s natural gas: why where how u.s. natural gas: … s natural gas: why where how ... gas combined...
TRANSCRIPT

U S Natural Gas: Why Where How
Randy A. Foutch
U.S. Natural Gas: Why, Where, How
Chairman and CEO
G W B h I tit t d th M i E I tit tGeorge W. Bush Institute and the Maguire Energy InstituteNatural Gas Nation
Southern Methodist University, DallasyMarch 25, 2010
U S Natural GasU.S. Natural GasWHYWHYis natural gas important to the future of the United States?
WHEREdo we explore for and produce natural gas?
HOWdo we utilize this abundant resource within our borders?
2
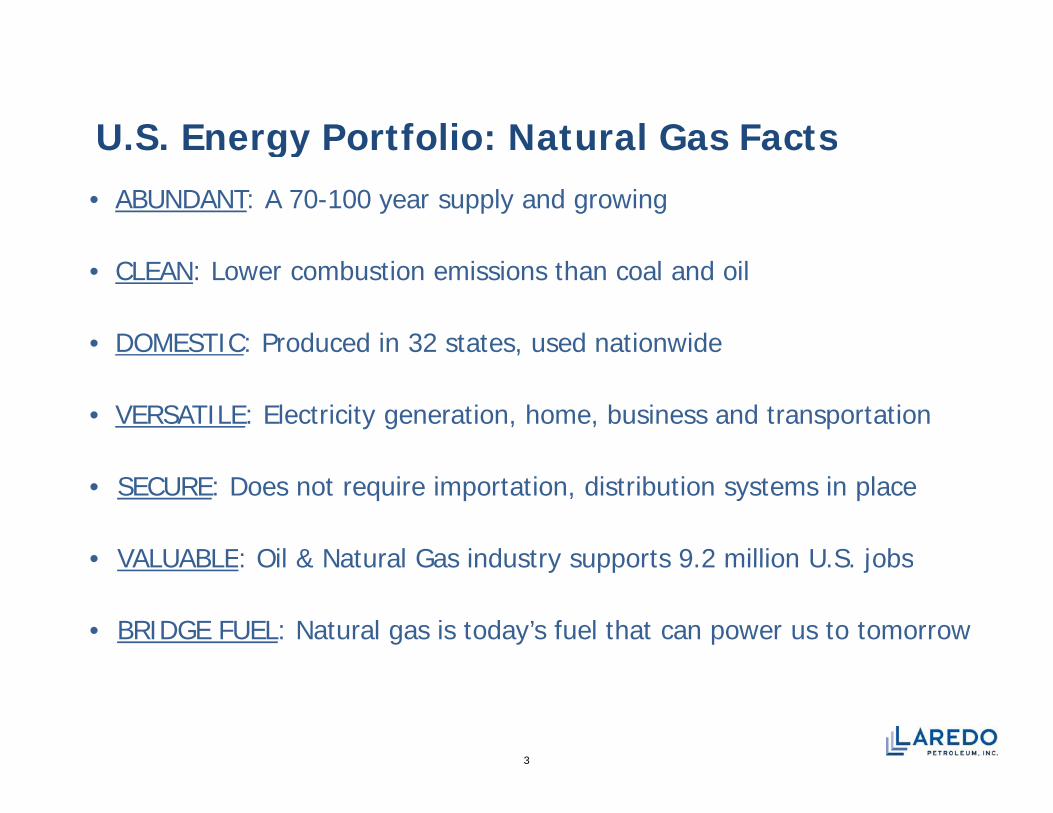
U.S. Energy Portfolio: Natural Gas FactsU S e gy o t o o atu a Gas acts• ABUNDANT: A 70-100 year supply and growing
• CLEAN: Lower combustion emissions than coal and oil
• DOMESTIC: Produced in 32 states, used nationwide,
• VERSATILE: Electricity generation, home, business and transportation
• SECURE: Does not require importation, distribution systems in place
• VALUABLE: Oil & Natural Gas industry supports 9 2 million U S jobs• VALUABLE: Oil & Natural Gas industry supports 9.2 million U.S. jobs
• BRIDGE FUEL: Natural gas is today’s fuel that can power us to tomorrow
3
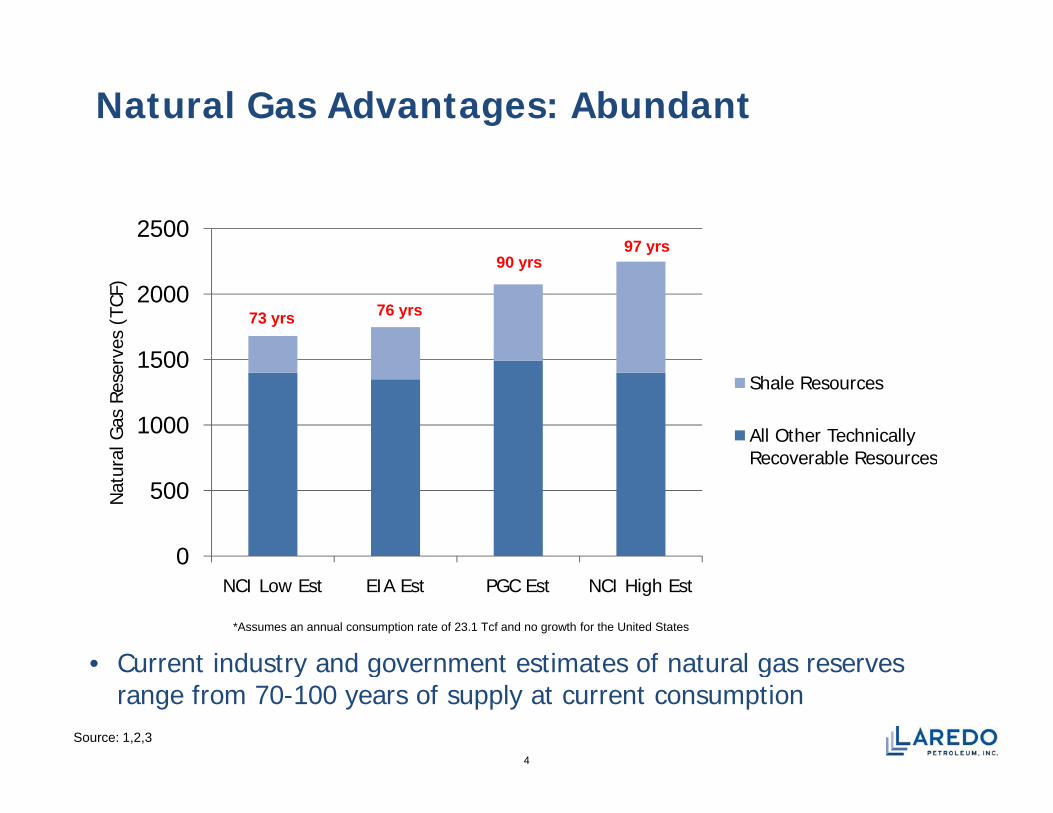
Natural Gas Advantages: Abundant
250097 yrs
1500
2000
ves
(TCF
)
73 yrs 76 yrs
90 yrsy
1000
1500
al G
as R
eser
v
Shale Resources
All Other Technically Recoverable Resources
0
500Nat
ura Recoverable Resources
• Current industry and government estimates of natural gas reserves
0NCI Low Est EIA Est PGC Est NCI High Est
*Assumes an annual consumption rate of 23.1 Tcf and no growth for the United States
• Current industry and government estimates of natural gas reserves range from 70-100 years of supply at current consumption
4
Source: 1,2,3
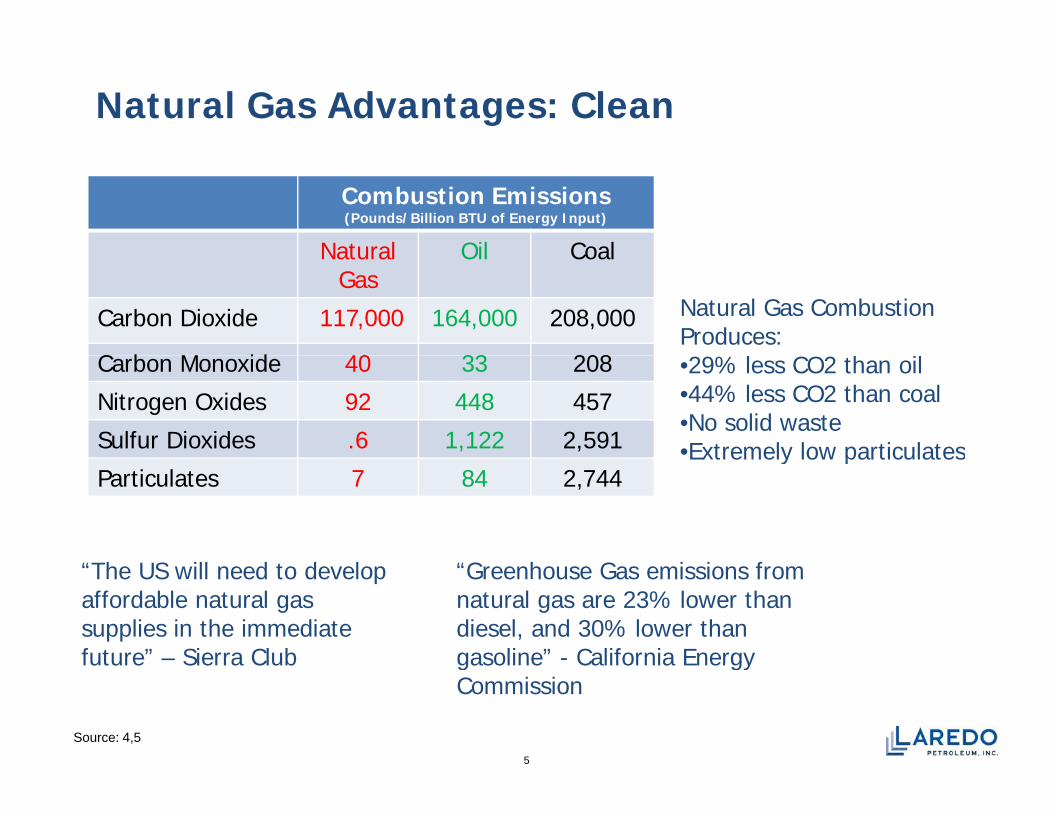
Natural Gas Advantages: Clean
Combustion Emissions(Pounds/Billion BTU of Energy Input)
Natural Oil CoalNatural Gas
Oil Coal
Carbon Dioxide 117,000 164,000 208,000
C b M id 40 33 208
Natural Gas Combustion Produces:
l h lCarbon Monoxide 40 33 208
Nitrogen Oxides 92 448 457
Sulfur Dioxides .6 1,122 2,591
•29% less CO2 than oil•44% less CO2 than coal•No solid waste•Extremely low particulates
Particulates 7 84 2,744Extremely low particulates
“The US will need to develop affordable natural gas supplies in the immediate future” – Sierra Club
“Greenhouse Gas emissions from natural gas are 23% lower than diesel, and 30% lower than gasoline” - California Energy
5
future Sierra Club gasoline California Energy Commission
Source: 4,5

Natural Gas Advantages: Versatile
• Natural Gas is used in most sectors of the economy
Residential20.5%
Vehicle Fuel0.1%
Pipeline Fuel2.7%
Oil and Gas Operations
5.2%
Heats/cools overHeats/cools over
A small but growing fuel for transportation
A small but growing fuel for transportation
Electric Power29 7%
Heats/cools over 50% of US homes, over 65 million residential
Heats/cools over 50% of US homes, over 65 million residential
Industrial28.7%
29.7% customerscustomers
The clean way to generate electricityThe clean way to generate electricity
Commercial13.1%
generate electricity that is also used as a backup source for wind/solar generation
generate electricity that is also used as a backup source for wind/solar generation
Clean fuel to power industry, manufacture fertilizer for food, and many other specialty uses
Clean fuel to power industry, manufacture fertilizer for food, and many other specialty uses
6
many other specialty uses and productsmany other specialty uses and products
Source: 2
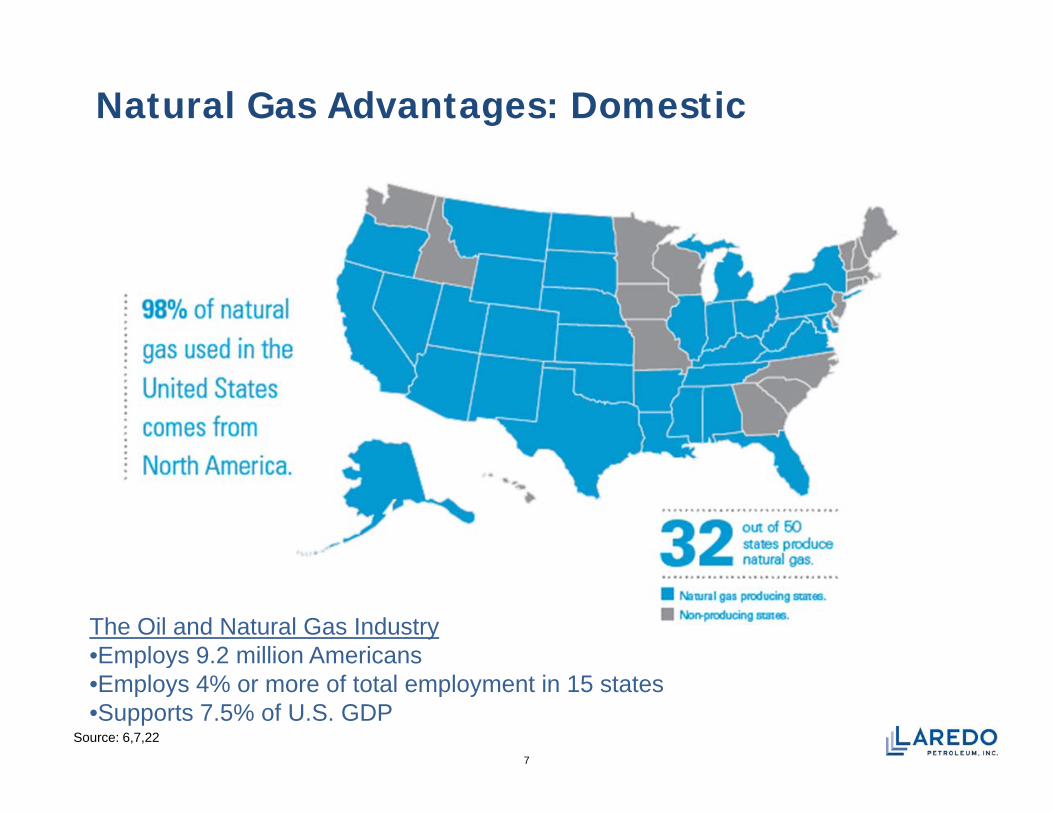
Natural Gas Advantages: Domestic
The Oil and Natural Gas Industry •Employs 9.2 million Americans
7
Employs 9.2 million Americans•Employs 4% or more of total employment in 15 states•Supports 7.5% of U.S. GDP
Source: 6,7,22

Natural Gas Advantages: Secure Infrastructure
8
Shale Basins indicated in greenSource: 8
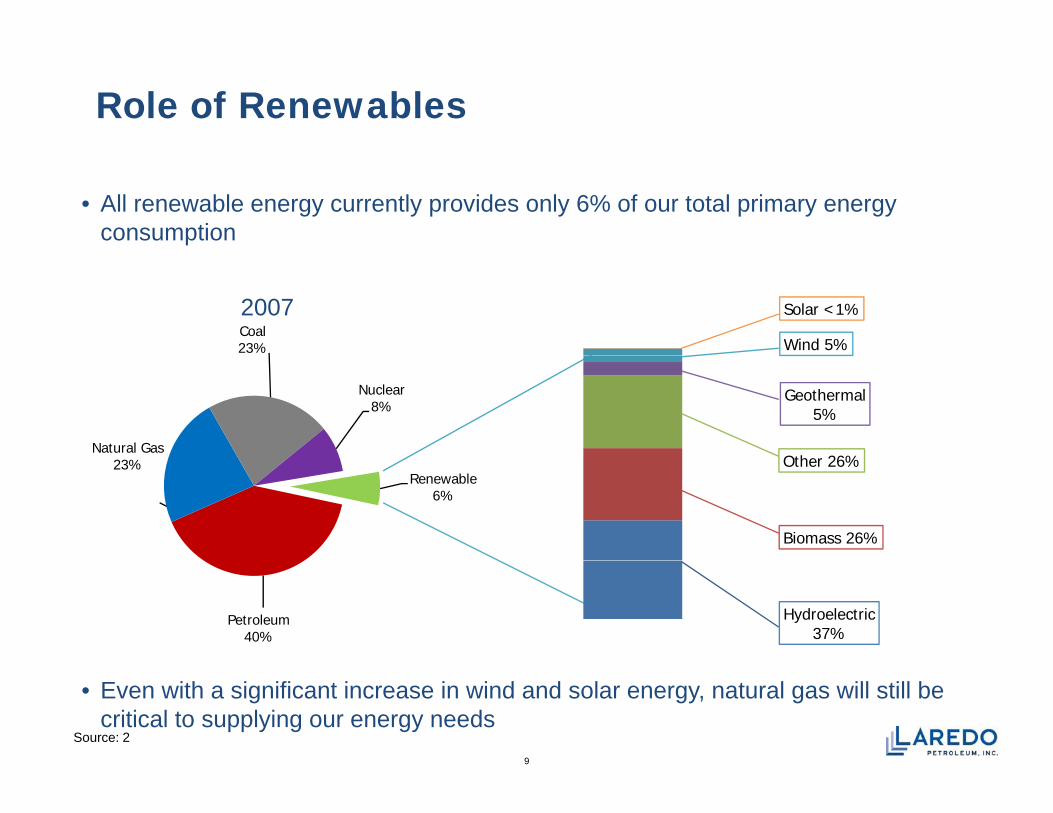
Role of Renewables
• All renewable energy currently provides only 6% of our total primary energy consumption
Wind 5%
Solar <1%Coal23%
2007
Other 26%
Geothermal 5%
Natural Gas
Nuclear8%
Biomass 26%
Other 26%23%Renewable
6%
Hydroelectric 37%
Petroleum40%
9
• Even with a significant increase in wind and solar energy, natural gas will still be critical to supplying our energy needs
Source: 2
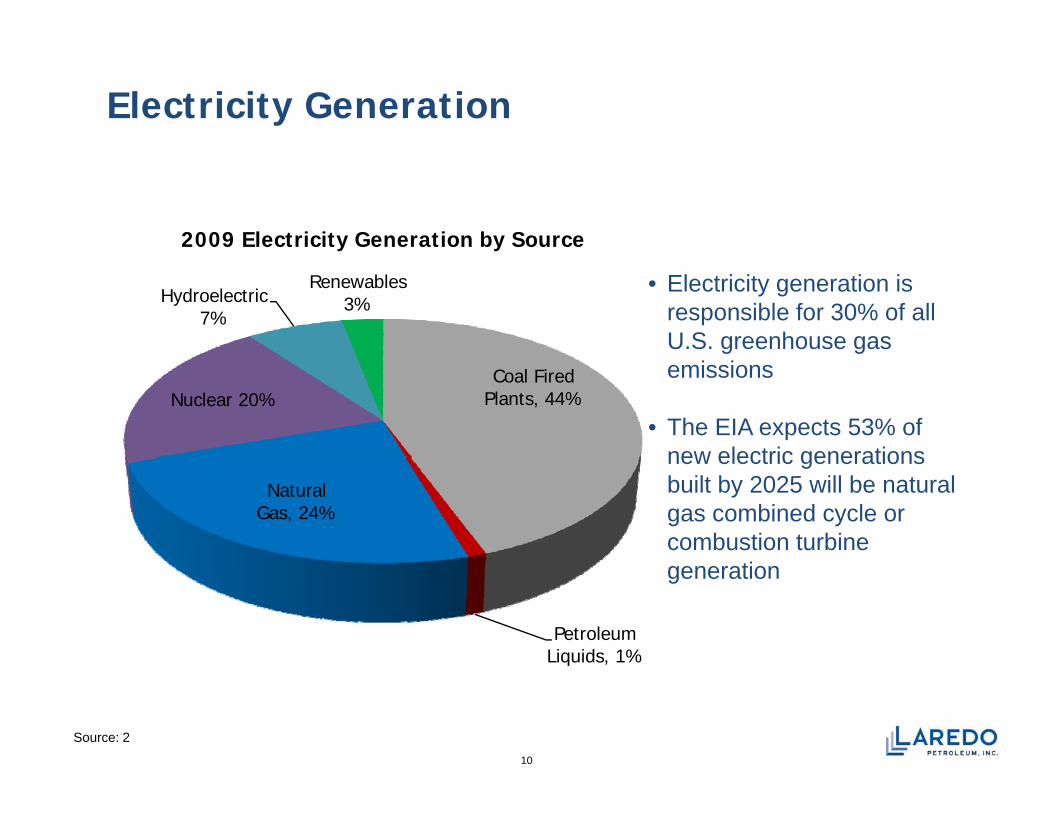
Electricity Generation
2009 Electricity Generation by Source
Hydroelectric 7%
Renewables 3%
• Electricity generation is responsible for 30% of all U.S. greenhouse gas
Coal Fired Plants, 44%Nuclear 20%
emissions
• The EIA expects 53% of new electric generations
Natural Gas, 24%
new electric generations built by 2025 will be natural gas combined cycle or combustion turbine
Petroleum Liquids, 1%
generation
10
q ,
Source: 2
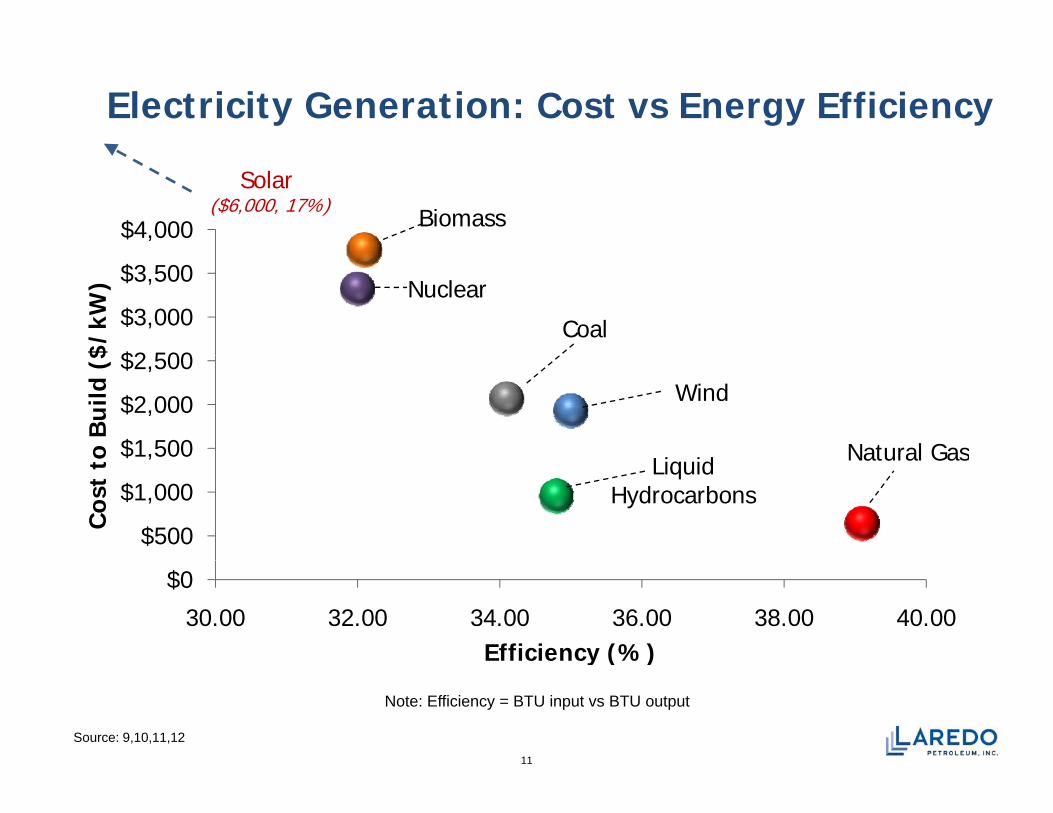
Electricity Generation: Cost vs Energy Efficiency
Biomass$4,000
Solar ($6,000, 17%)
Coal
Nuclear
$2 500
$3,000
$3,500
$/k
W)
Li id Natural Gas
Wind
$1,500
$2,000
$2,500
o B
uild
($
Liquid Hydrocarbons
Natural Gas
$500
$1,000
$ ,
Cos
t to
$0
30.00 32.00 34.00 36.00 38.00 40.00Efficiency (%)
11
y ( )
Source: 9,10,11,12
Note: Efficiency = BTU input vs BTU output
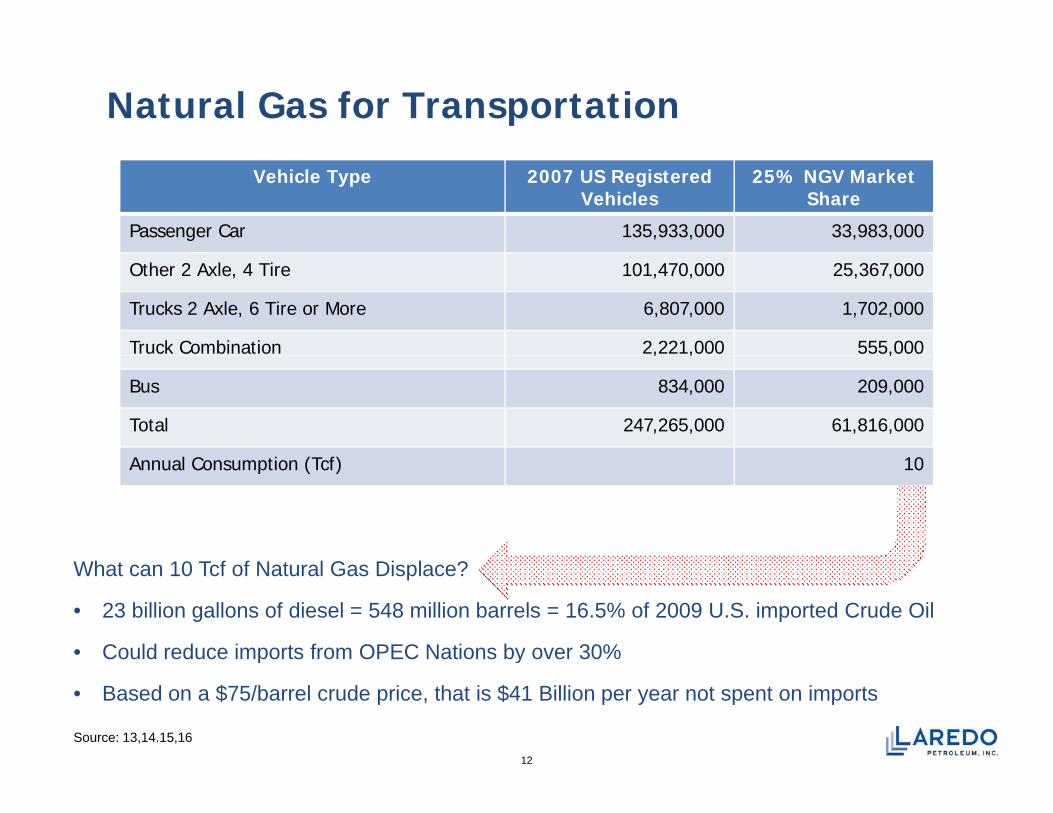
Natural Gas for Transportation
Vehicle Type 2007 US Registered Vehicles
25% NGV Market Share
Passenger Car 135,933,000 33,983,000
Other 2 Axle, 4 Tire 101,470,000 25,367,000
Trucks 2 Axle, 6 Tire or More 6,807,000 1,702,000
Truck Combination 2,221,000 555,000, , ,
Bus 834,000 209,000
Total 247,265,000 61,816,000
A l C ti (T f) 10Annual Consumption (Tcf) 10
f f G ?What can 10 Tcf of Natural Gas Displace?
• 23 billion gallons of diesel = 548 million barrels = 16.5% of 2009 U.S. imported Crude Oil
• Could reduce imports from OPEC Nations by over 30%
12
p y
• Based on a $75/barrel crude price, that is $41 Billion per year not spent on imports
Source: 13,14.15,16
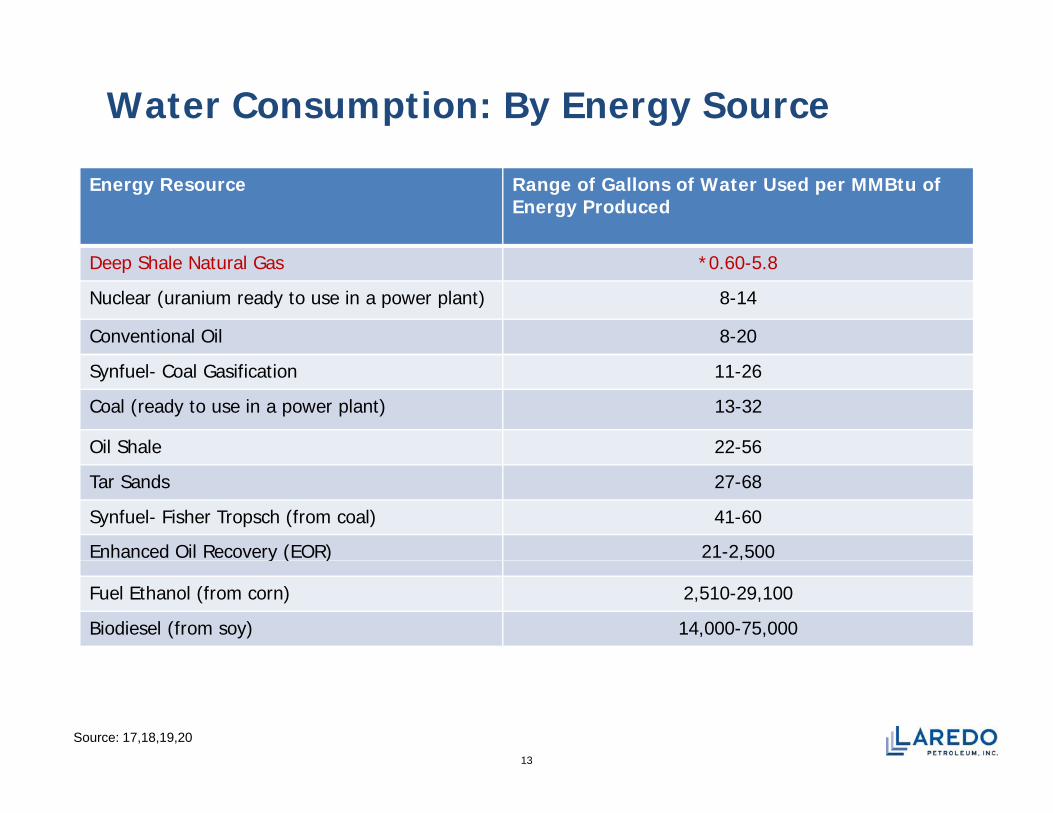
Water Consumption: By Energy Source
Energy Resource Range of Gallons of Water Used per MMBtu of Energy Produced
Deep Shale Natural Gas *0.60-5.8
Nuclear (uranium ready to use in a power plant) 8-14
Conventional Oil 8-20
Synfuel- Coal Gasification 11-26
Coal (ready to use in a power plant) 13-32
Oil Shale 22-56
Tar Sands 27-68
Synfuel- Fisher Tropsch (from coal) 41-60
Enhanced Oil Recovery (EOR) 21-2,500y ( ) ,
Fuel Ethanol (from corn) 2,510-29,100
Biodiesel (from soy) 14,000-75,000
13
Source: 17,18,19,20

Unconventional Reservoirs
Unconventional production currently accounts for 46% of total U.S. production
Shale Gas, Tight Sands, and Coal Bed Methane
p
14
Source: 17

Unconventional Reservoirs
Unconventional Since 2004, unconventional reservoirs are the primary source of
Annual Natural Gas Production
reservoirs:•Low Permeability•Low Porosity
Since 2004, unconventional reservoirs are the primary source of natural gas production
reservoirs are the primary source of natural gas production
Extraction requires the proper application of:•Horizontal drilling •Stimulation techniques
15
Source: 2
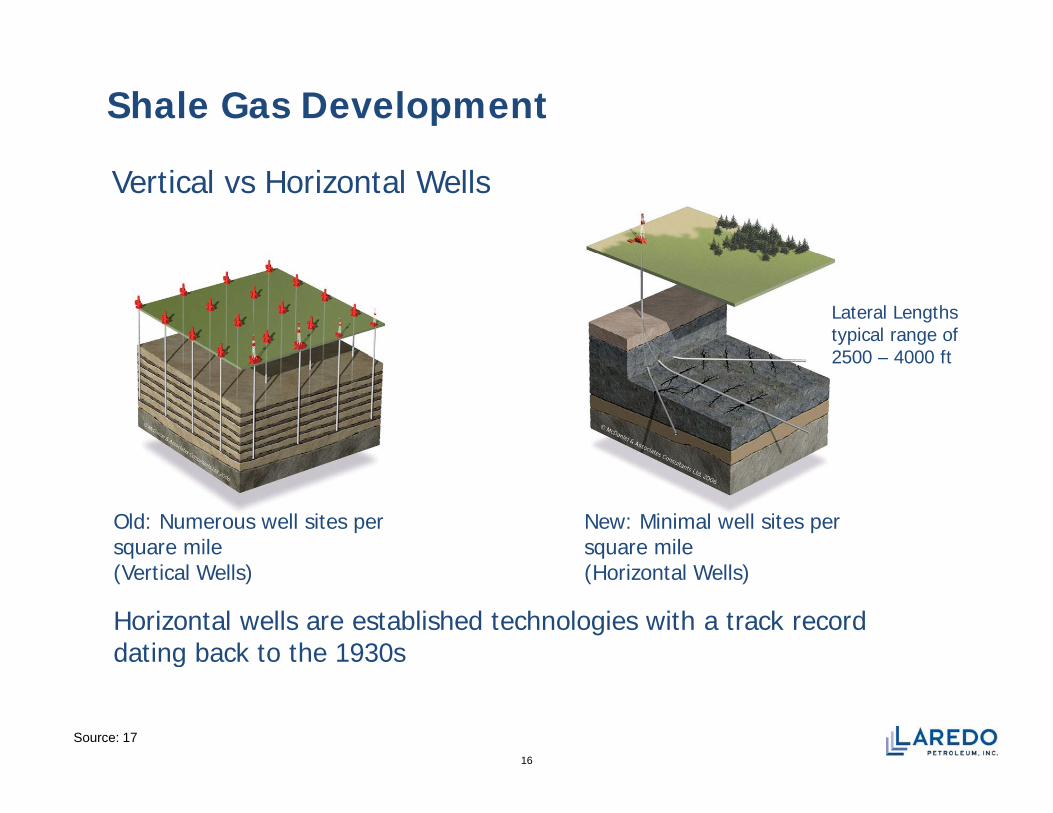
Shale Gas Development
Vertical vs Horizontal Wells
Lateral Lengthstypical range of 2500 4000 ft2500 – 4000 ft
Old: Numerous well sites per square mile
New: Minimal well sites per square mile
(Vertical Wells) (Horizontal Wells)
Horizontal wells are established technologies with a track record dating back to the 1930s
16
g
Source: 17
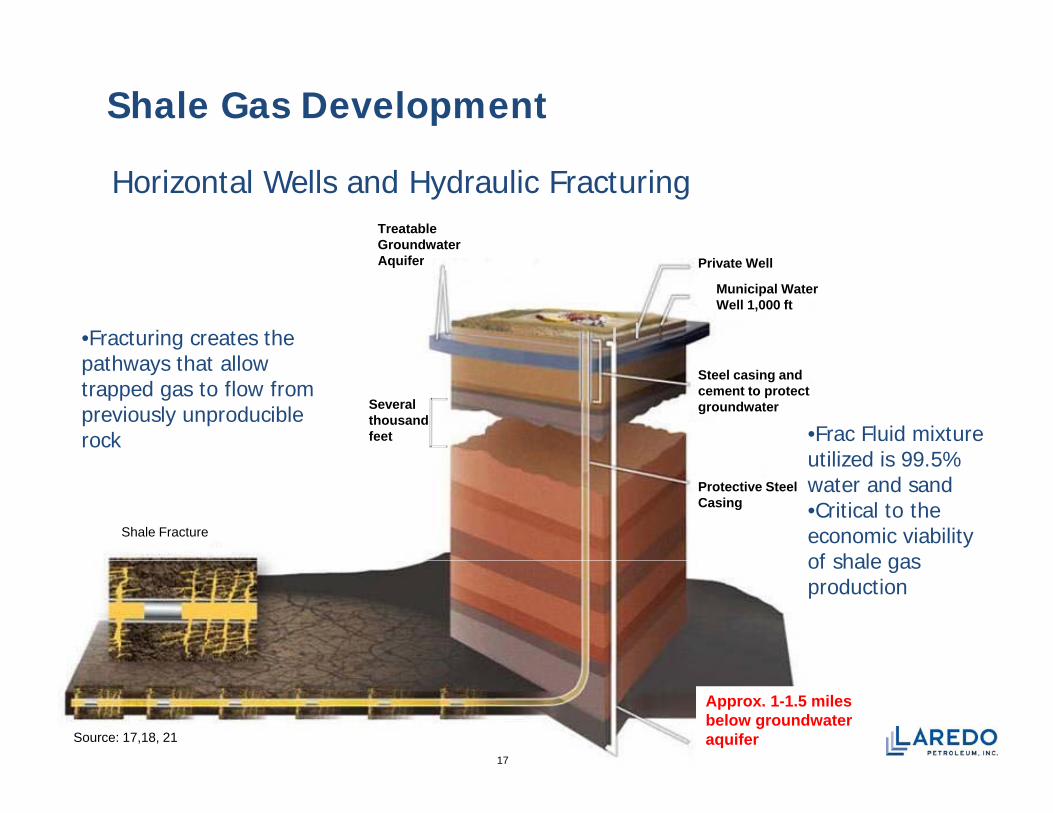
Shale Gas Development
Treatable Groundwater
Horizontal Wells and Hydraulic Fracturing
Municipal Water Well 1,000 ft
Private WellAquifer
•Fracturing creates the h h ll Steel casing and
cement to protect groundwater
•Frac Fluid mixture utilized is 99 5%
pathways that allow trapped gas to flow from previously unproducible rock
Several thousand feet
Protective Steel Casing
utilized is 99.5% water and sand•Critical to the economic viability of shale gas
Shale Fracture
of shale gas production
Approx. 1-1.5 miles below groundwater aquifer
17
Source: 17,18, 21
Shale Gas Development
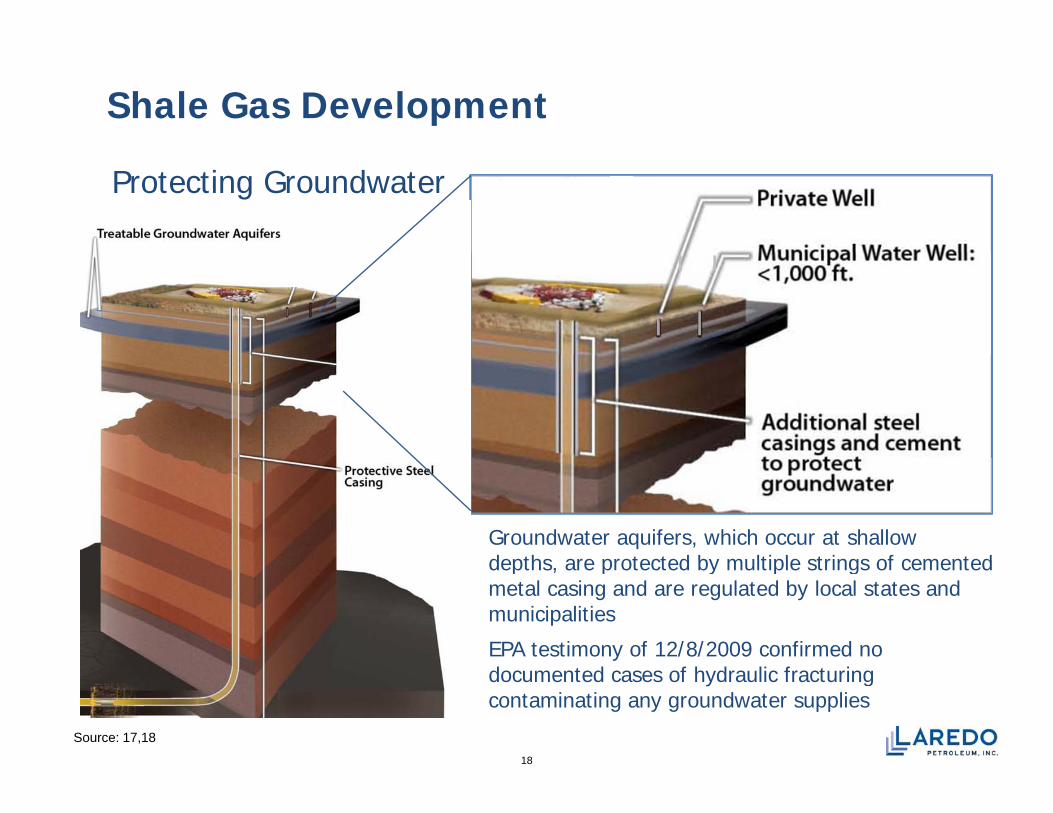
Protecting Groundwater
Groundwater aquifers, which occur at shallow depths are protected by multiple strings of cementeddepths, are protected by multiple strings of cemented metal casing and are regulated by local states and municipalities
EPA testimony of 12/8/2009 confirmed no
18
documented cases of hydraulic fracturing contaminating any groundwater supplies
Source: 17,18

Shale Gas Development
Natural Gas Well Lifecycle
Drilling(30 days)
Stimulating (Hydraulic Fracturing)
(1 3 Days)
Producing(Years)
Community concerns during drilling and stimulation include: traffic volume road
(1-3 Days)Drilling Pad site-
4 acresProduction Pad Site-
1 acre
19
stimulation include: traffic volume, road damage, dust, noise
Source: 17
Final Thoughts…• Natural Gas is a clean, domestic, abundant and secure energy that
is the energy bridge to the future
• Natural Gas is available today and in the future to meet theincreasing demand for electrical generation
Th l f N l G i idl i i h h• The supply of Natural Gas is rapidly growing with the proventechnologies currently in place
• Technologies exist that can increase the use of Natural Gas as agcleaner burning transportation fuel
• Domestic Natural Gas used for transportation could displace asignificant amount of the crude oil the U S currently importssignificant amount of the crude oil the U.S. currently imports
• In order to develop and produce our abundant Natural Gasreserves, regulatory policy must encourage the drilling for moreNat al GasNatural Gas
20

www.laredopetro.com

1) The American Clean Skies Foundation (ACSF): “North American Natural Gas Supply Assessment” (July 2008)
References1) The American Clean Skies Foundation (ACSF): North American Natural Gas Supply Assessment (July 2008)2) Energy Information Administration (EIA) Annual Energy Outlook 20093) Potential Gas Committee (PGC): June 20094) EIA: “Natural Gas Issues and Trends” (1998)5) Sierra Club: Testimony before the House Committee on Appropriations (April 3, 2009)6) EIA “Annual Energy Review 2007”7) The Contributions of the Natural Gas Industry to the U.S. Nation and State Economies ( Sep 2009)8) American Clean Skies Foundation- American Gas Association: “Key Factors Influencing U.S. Natural Gas Supply-2009”9) KEMA Power Generation and Sustainables: “Energy Efficiency in Power Plants” (2008) 10) Argonne National Laboratory- Energy Systems Division: “Comparison of Power Efficiency on Grid Level “(2004)) g y gy y p y ( )11) Argonne National Laboratory- Energy Systems Division: “Fuel Cycle Comparison of Distributed Power Generation
Technologies” (2008)12) EIA: “Electricity Market Module” (Mar 2009)13) American Natural Gas Alliance and American Gas Association- “Natural Gas Vehicles: The Right Solution. The Right
Time.” (Dec 2009)( )14) Clean Energy : “Natural Gas for Transportation: The Secret is Out” (April 2009)15) Natural Gas Vehicles for America: “Natural Gas Vehicles 2009 Year in Review”16) Center for Energy Policy and the Environment: “Kill Oil with Natural Gas and Electricity”(Report No. 4 Sept 2009)17) U.S. Department of Energy (DOE), Groundwater Protection Council (GWPC): “Modern Shale Gas Development in the
United States: A Primer” (2009)United States: A Primer (2009)18) Chesapeake Energy Corporation: “Hydraulic Fracturing “and “Water Use in Deep Shale Gas Exploration” Fact Sheets
(2009)19) Chesapeake Energy Corporation: “Deep Shale Natural Gas- Abundant, Affordable, and Surprisingly Water Efficient”
(2009)20) U S Department of Energy (DOE): “Energy Demands on Water Resources”- Report to Congress on the20) U.S. Department of Energy (DOE): Energy Demands on Water Resources Report to Congress on the
Interdependency of Energy and Water (Dec 2006)21) www.EnergyInDepth.com “A Fluid Situation: Typical Solution Used in Hydraulic Fracturing”22) PriceWaterhouseCooper- “The Economic Impacts of the Oil and Natural Gas Industry on the U.S. Economy:
Employment, Labor Income and Value Added” prepared for American Petroleum Institute (Sept 2009)22