u00a department of the environment - gam -...
TRANSCRIPT
U00A
Department of the Environment
Note: Numbers may not sum to total due to rounding. For further information contact: Andrew D. Gray Phone: (410) 946-5530
Analysis of the FY 2016 Maryland Executive Budget, 2015 1
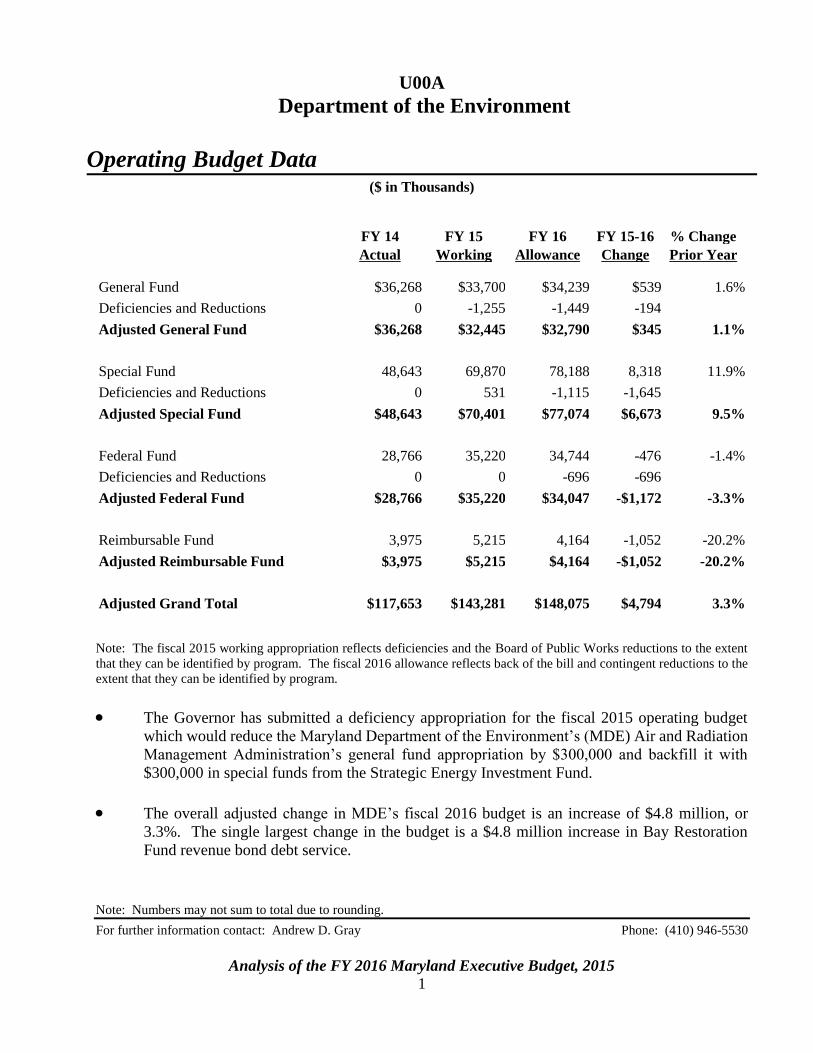
Operating Budget Data
($ in Thousands)
FY 14 FY 15 FY 16 FY 15-16 % Change
Actual Working Allowance Change Prior Year
General Fund $36,268 $33,700 $34,239 $539 1.6%
Deficiencies and Reductions 0 -1,255 -1,449 -194
Adjusted General Fund $36,268 $32,445 $32,790 $345 1.1%
Special Fund 48,643 69,870 78,188 8,318 11.9%
Deficiencies and Reductions 0 531 -1,115 -1,645
Adjusted Special Fund $48,643 $70,401 $77,074 $6,673 9.5%
Federal Fund 28,766 35,220 34,744 -476 -1.4%
Deficiencies and Reductions 0 0 -696 -696
Adjusted Federal Fund $28,766 $35,220 $34,047 -$1,172 -3.3%
Reimbursable Fund 3,975 5,215 4,164 -1,052 -20.2%
Adjusted Reimbursable Fund $3,975 $5,215 $4,164 -$1,052 -20.2%
Adjusted Grand Total $117,653 $143,281 $148,075 $4,794 3.3%
Note: The fiscal 2015 working appropriation reflects deficiencies and the Board of Public Works reductions to the extent
that they can be identified by program. The fiscal 2016 allowance reflects back of the bill and contingent reductions to the
extent that they can be identified by program.
The Governor has submitted a deficiency appropriation for the fiscal 2015 operating budget
which would reduce the Maryland Department of the Environment’s (MDE) Air and Radiation
Management Administration’s general fund appropriation by $300,000 and backfill it with
$300,000 in special funds from the Strategic Energy Investment Fund.
The overall adjusted change in MDE’s fiscal 2016 budget is an increase of $4.8 million, or
3.3%. The single largest change in the budget is a $4.8 million increase in Bay Restoration
Fund revenue bond debt service.

U00A – Department of the Environment
Analysis of the FY 2016 Maryland Executive Budget, 2015 2
Personnel Data
FY 14 FY 15 FY 16 FY 15-16
Actual Working Allowance Change
Regular Positions
937.00
955.00
958.00
3.00
Contractual FTEs
25.43
53.00
48.00
-5.00
Total Personnel
962.43
1,008.00
1,006.00
-2.00
Vacancy Data: Regular Positions
Turnover and Necessary Vacancies, Excluding New
Positions
62.08
6.50%
Positions and Percentage Vacant as of 1/1/15
94.00
9.84%
Regular positions increase by 3.0 between the fiscal 2015 working appropriation and the
fiscal 2016 allowance. The 3.0 new permit writers will review and issue National Pollutant
Discharge Elimination System permits for the implementation of enhanced nutrient removal
technology at major-minor wastewater treatment plants.
Contractual full-time equivalents (FTE) decrease by a net of 5.0. The largest decrease is
5.0 FTEs in Water Management Administration – Water Supply. MDE notes that it has had
difficulty retaining contractual FTEs in this program.
MDE’s turnover rate decreases slightly from 7.06% to 6.50% in the fiscal 2016 allowance. This
will necessitate holding 62.08 positions open; MDE has 94.0 positions vacant as of
January 1, 2015.

U00A – Department of the Environment
Analysis of the FY 2016 Maryland Executive Budget, 2015 3
Analysis in Brief
Major Trends
Connection Between Water Management Administration Inspectors and Sediment Inspection
Coverage Unclear: There does not appear to be a clear connection between Water Management
Administration inspector levels and the percentage of sediment inspection coverage on construction
sites.
Customer Service Goal Met by Changing Standard: A permit turnaround goal is being met in
fiscal 2014 by lowering the standard for several permits.
Municipal Landfill Compliance Declined Slightly: Municipal landfill compliance with ground water
standards declined slightly between fiscal 2013 and 2014.
Issues
Clean Power Rule Costs Mitigated by Regional Greenhouse Gas Initiative Involvement: In
June 2013, President Barack H. Obama published the Climate Action Plan. In response to the plan, in
June 2014, the U.S. Environmental Protection Agency proposed the “Clean Power Plan.” The plan,
which applies to existing power plants, outlines the four “building blocks” (i.e., make fossil fuel power
plants more efficient; use lower-emitting power plants more frequently; expand renewable power
sources; and use demand-side energy more efficiently) that make up the best system of emission
reductions under the Clean Air Act. Maryland anticipates being able to use involvement in the Regional
Greenhouse Gas Initiative (RGGI) as the way to comply with the Clean Power Plan. The Department
of Legislative Services (DLS) recommends that MDE comment on the economic benefits of RGGI
as they relate to the potential for compliance with the Clean Power Proposed Rule.
Marcellus Shale Fracking Status: In June 2011, Governor Martin J. O’Malley signed an executive
order establishing the Marcellus Shale Safe Drilling Initiative to assist State policymakers and
regulators in determining whether and how gas production from the Marcellus Shale in Maryland can
be accomplished without unacceptable risks of adverse impacts to public health, safety, and the
environment. The final report has been submitted and concludes that provided all the best practices are
followed, and the State is able to rigorously enforce compliance, the risk of Marcellus Shale
development can be managed to an acceptable level. DLS recommends that MDE comment on the
types of comments it has received for the Marcellus Shale hydraulic fracturing regulations.
Required Construction Site Inspections Not Occurring: MDE’s January 2015 audit completed by the
Office of Legislative Audits contained two repeat findings – an improvement upon the four repeat
findings in November 2011. However, the January 2015 audit contained the repeat finding that there
are insufficient resources to inspect every active construction site for compliance with erosion and
sediment control plans an average of once every two weeks in accordance with State regulations. DLS
recommends that $3,179,957 in general fund appropriations be reduced and authorization be

U00A – Department of the Environment
Analysis of the FY 2016 Maryland Executive Budget, 2015 4
provided in the Budget Reconciliation and Financing Act of 2015 to allow MDE to use
Chesapeake and Atlantic Coastal Bays 2010 Trust Fund money for sediment and erosion control
inspections and associated activities.
Recommended Actions
1. Abolish positions with funding equivalent to the 2% across-the-board reduction.
2. Add budget bill language reducing salary funding contingent on authorization of use from the
Chesapeake and Atlantic Coastal Bays 2010 Trust Fund.

U00A
Department of the Environment
Analysis of the FY 2016 Maryland Executive Budget, 2015 5
Operating Budget Analysis
Program Description
The Maryland Department of the Environment (MDE) was created in 1987 to protect and
restore the quality of the State’s land, air, and water resources and safeguard citizens from health risks
associated with pollution. It is responsible for planning, monitoring, controlling, and regulating air,
solid, and hazardous wastes; radiation, sewage sludge, sediment, and stormwater; toxicities, sewage
treatment, and water supply facilities; and environmental disease control programs. The department is
structured into seven major administrative units.
Office of the Secretary: This office provides direction and establishes State environmental
policies to be implemented by the operating units.
Operational Services Administration: This administration (formerly called the Administrative
Services Administration) provides general administrative and fiscal services to the department.
Water Management Administration: This administration administers the State’s water
pollution control program; implements Total Maximum Daily Loads (TMDL) for pollutants in
impaired waterways; and regulates industrial/municipal wastewater and stormwater discharge.
Science Services Administration: This administration develops and promulgates water quality
standards; provides technical support and analysis for TMDLs; monitors shellfish; develops
environmental and public health risk assessments; implements nonpoint source pollution
programs; and develops and issues fish advisories.
Land Management Administration: This administration ensures that all types of hazardous
and nonhazardous solid wastes are managed in a manner that protects public health and the
environment. It regulates solid waste management facilities, scrap tire recycling facilities,
above-ground and below-ground petroleum storage facilities, petroleum distribution, hazardous
waste transportation, mining, and both concentrated animal feeding operations and Maryland
animal feeding operations.
Air and Radiation Management Administration: This administration ensures that air quality
and radiation levels in Maryland sustain public health, safety, and the environment. It operates
an air-monitoring network, licenses asbestos removal contractors, provides oversight of the
Vehicle Emissions Inspection Program, and monitors radiation use. Climate change initiatives
are a relatively new component of its operations.

U00A – Department of the Environment
Analysis of the FY 2016 Maryland Executive Budget, 2015 6
Coordinating Offices: This office manages budget matters, the Water Quality and Drinking
Water Revolving Loan funds and other water pollution control program capital projects, and
Board of Public Works’ activities; coordinates public information and outreach; provides
hazardous chemical and oil spill emergency response services; provides legal advice; and
information technology services.
MDE’s four goals are consistent with efforts to protect and preserve Maryland’s natural
resources. They are:
reducing Maryland citizens’ exposure to hazards;
ensuring safe and adequate drinking water;
ensuring the air is safe to breathe; and
providing customer service and community outreach.
Performance Analysis: Managing for Results
MDE’s Managing for Results (MFR) measures show (1) the connection between Water
Management Administration inspector levels and sediment inspection coverage is unclear; (2) a permit
turnaround goal being met by lowering the standard; and (3) municipal landfill compliance with
groundwater standards declining slightly.
1. Connection Between Water Management Administration Inspectors
and Sediment Inspection Coverage Unclear
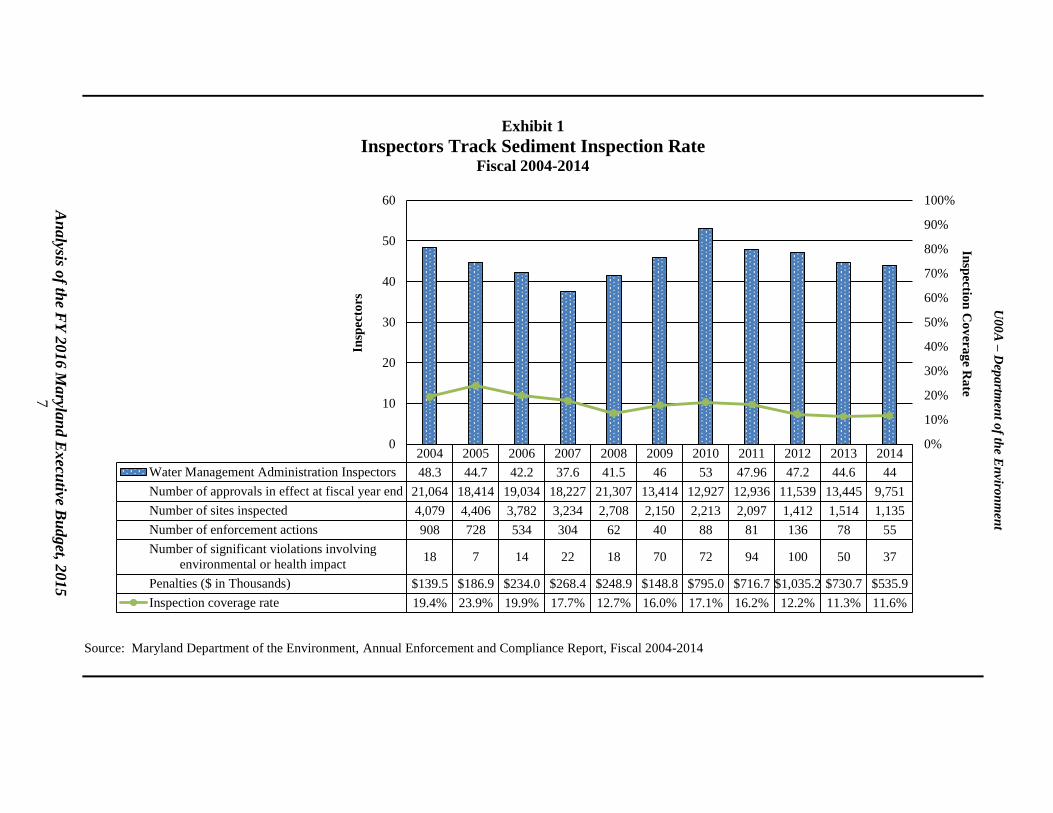
MDE has the goal to improve and protect Maryland’s water quality. While not explicitly
included as an objective for this goal, MDE reports on inspection activity as part of its Annual
Enforcement and Compliance Report. The data for fiscal 2004 through 2014 for inspections of
stormwater management and erosion and sediment control for construction activity are reflected in
Exhibit 1. There does not appear to be a clear connection between the number of Water Management
Administration inspectors – the most inclusive population of inspectors that would be expected to
address this type of inspection – and the inspection coverage rate – the number of sites inspected divided
by the coverage universe. Overall, there appears to be a downward trend in the inspection coverage
rate, which MDE has ameliorated partially by focusing more attention on the large sites that can be
expected to have a greater potential impact on environmental or public health. The Department of
Legislative Services (DLS) recommends that MDE comment on a reasonable inspection rate
against which its activities may be compared.
U0
0A
– D
epa
rtmen
t of th
e En
viron
men
t
An
alysis o
f the F
Y 2
016 M
aryla
nd E
xecu
tive Bu
dget, 2
015
7
Exhibit 1
Inspectors Track Sediment Inspection Rate Fiscal 2004-2014
Source: Maryland Department of the Environment, Annual Enforcement and Compliance Report, Fiscal 2004-2014
2004 2005 2006 2007 2008 2009 2010 2011 2012 2013 2014
Water Management Administration Inspectors 48.3 44.7 42.2 37.6 41.5 46 53 47.96 47.2 44.6 44
Number of approvals in effect at fiscal year end 21,064 18,414 19,034 18,227 21,307 13,414 12,927 12,936 11,539 13,445 9,751
Number of sites inspected 4,079 4,406 3,782 3,234 2,708 2,150 2,213 2,097 1,412 1,514 1,135
Number of enforcement actions 908 728 534 304 62 40 88 81 136 78 55
Number of significant violations involving
environmental or health impact18 7 14 22 18 70 72 94 100 50 37
Penalties ($ in Thousands) $139.5 $186.9 $234.0 $268.4 $248.9 $148.8 $795.0 $716.7 $1,035.2 $730.7 $535.9
Inspection coverage rate 19.4% 23.9% 19.9% 17.7% 12.7% 16.0% 17.1% 16.2% 12.2% 11.3% 11.6%
0%
10%
20%
30%
40%
50%
60%
70%
80%
90%
100%
0
10
20
30
40
50
60
Insp
ection
Co
ver
ag
e Ra
te
Insp
ecto
rs
U00A – Department of the Environment
Analysis of the FY 2016 Maryland Executive Budget, 2015 8
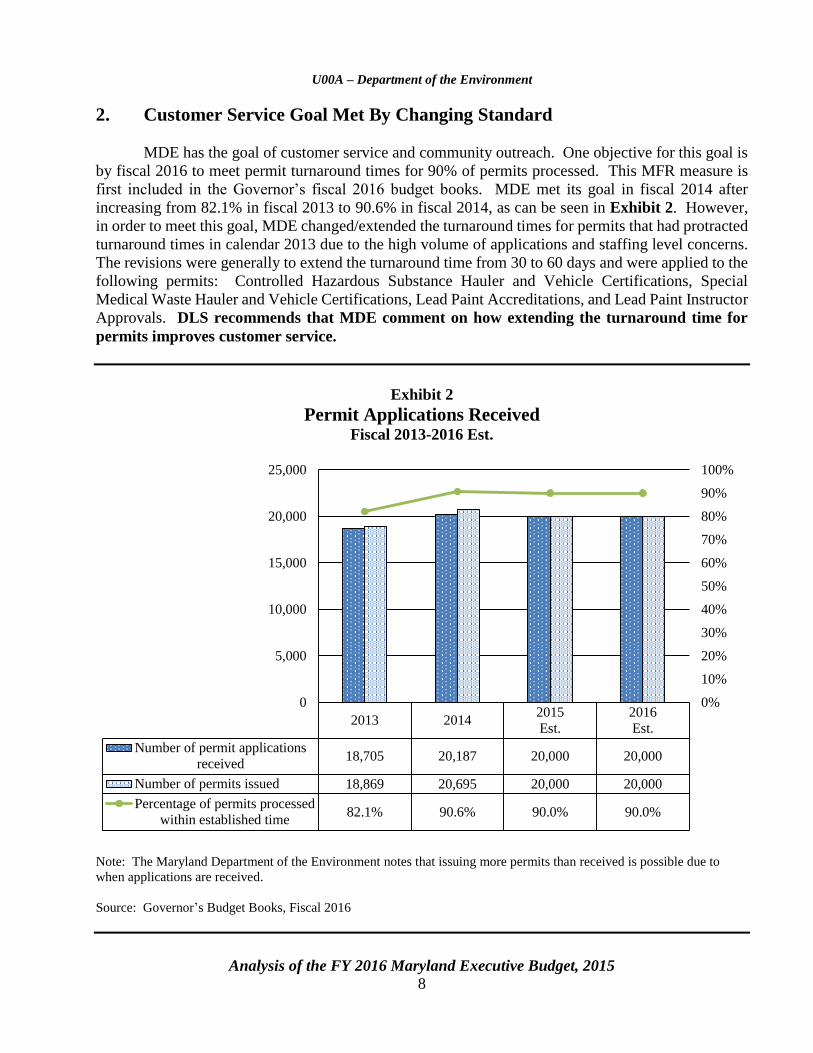
2. Customer Service Goal Met By Changing Standard
MDE has the goal of customer service and community outreach. One objective for this goal is
by fiscal 2016 to meet permit turnaround times for 90% of permits processed. This MFR measure is
first included in the Governor’s fiscal 2016 budget books. MDE met its goal in fiscal 2014 after
increasing from 82.1% in fiscal 2013 to 90.6% in fiscal 2014, as can be seen in Exhibit 2. However,
in order to meet this goal, MDE changed/extended the turnaround times for permits that had protracted
turnaround times in calendar 2013 due to the high volume of applications and staffing level concerns.
The revisions were generally to extend the turnaround time from 30 to 60 days and were applied to the
following permits: Controlled Hazardous Substance Hauler and Vehicle Certifications, Special
Medical Waste Hauler and Vehicle Certifications, Lead Paint Accreditations, and Lead Paint Instructor
Approvals. DLS recommends that MDE comment on how extending the turnaround time for
permits improves customer service.
Exhibit 2
Permit Applications Received Fiscal 2013-2016 Est.
Note: The Maryland Department of the Environment notes that issuing more permits than received is possible due to
when applications are received.
Source: Governor’s Budget Books, Fiscal 2016
2013 20142015
Est.
2016
Est.
Number of permit applications
received18,705 20,187 20,000 20,000
Number of permits issued 18,869 20,695 20,000 20,000
Percentage of permits processed
within established time82.1% 90.6% 90.0% 90.0%
0%
10%
20%
30%
40%
50%
60%
70%
80%
90%
100%
0
5,000
10,000
15,000
20,000
25,000

U00A – Department of the Environment
Analysis of the FY 2016 Maryland Executive Budget, 2015 9
3. Municipal Landfill Compliance Declined Slightly
MDE has the goal of ensuring safe and adequate drinking water. The associated objective is to
maintain 80% in significant compliance with groundwater standards for all active municipal solid waste
landfills each year. As shown in Exhibit 3, MDE exceeded its objective between fiscal 2011 and 2013
but then saw a decline in the percent in compliance from 91% in fiscal 2013 to 85% in fiscal 2014.
MDE notes that the percent in compliance is lower because 3 of the 20 currently active municipal
landfills, or 15%, have levels of contaminants in their groundwater wells above standards. In addition,
the fiscal 2016 Governor’s budget books indicate that the fiscal 2015 and 2016 estimates for compliance
have been reduced due to three additional active municipal landfills that may be added in calendar 2014,
which could impact groundwater. Also of note, over the time period shown, there has been a substantial
increase in the percentage of all landfill water quality reports reviewed within five months. DLS
recommends that MDE comment on where there is the greatest exposure of groundwater to
municipal landfill contamination.
Exhibit 3
Percentage of Municipal Solid Waste Landfills in Significant Compliance with
Groundwater Standards Fiscal 2005-2016 Est.
Source: Governor’s Budget Books, Fiscal 2008-2016
2005 2006 2007 2008 2009 2010 2011 2012 2013 20142015
Est.
2016
Est.
Percentage of municipal solid
waste landfills in significant
compliance with groundwater
standards
80% 80% 80% 80% 80% 80% 91% 90% 91% 85% 85% 85%
Percentage of all landfill water
quality reports reviewed within
five months48% 66% 54% 71% 86% 91% 100% 100% 100% 100%
Goal 80% 80% 80% 80% 80% 80% 80% 80% 80% 80% 80% 80%
0%
10%
20%
30%
40%
50%
60%
70%
80%
90%
100%
U00A – Department of the Environment
Analysis of the FY 2016 Maryland Executive Budget, 2015 10
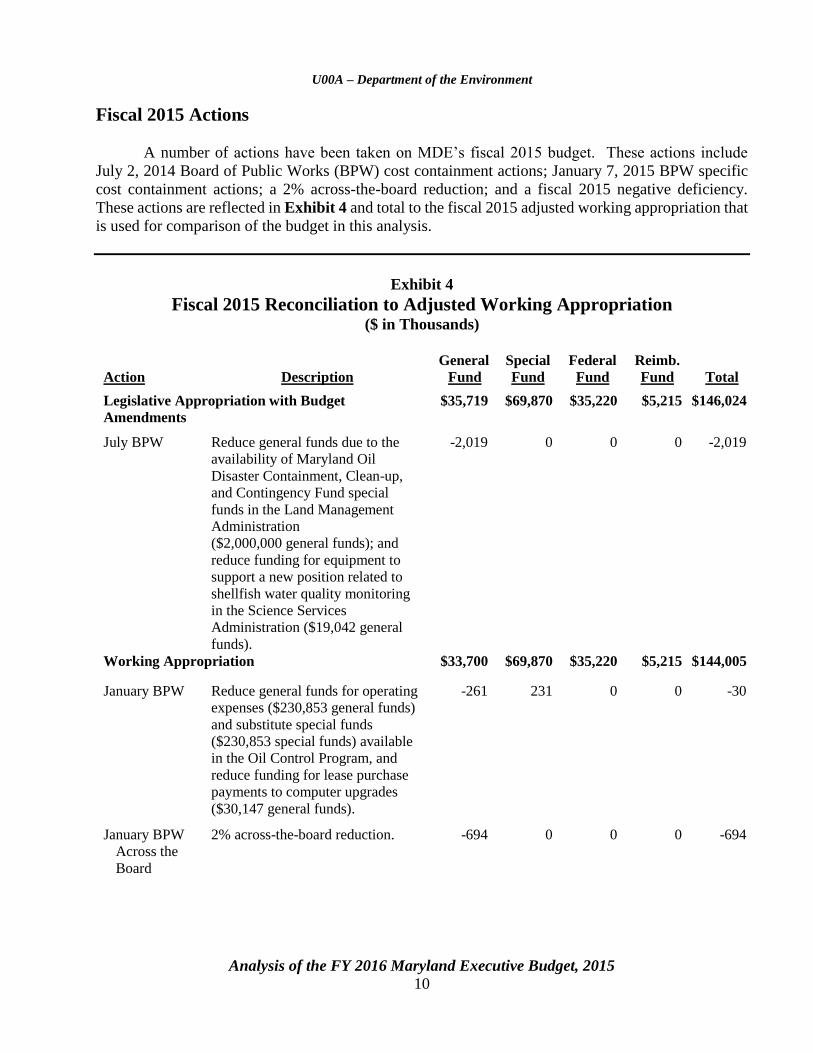
Fiscal 2015 Actions
A number of actions have been taken on MDE’s fiscal 2015 budget. These actions include
July 2, 2014 Board of Public Works (BPW) cost containment actions; January 7, 2015 BPW specific
cost containment actions; a 2% across-the-board reduction; and a fiscal 2015 negative deficiency.
These actions are reflected in Exhibit 4 and total to the fiscal 2015 adjusted working appropriation that
is used for comparison of the budget in this analysis.
Exhibit 4
Fiscal 2015 Reconciliation to Adjusted Working Appropriation ($ in Thousands)
Action Description
General
Fund
Special
Fund
Federal
Fund
Reimb.
Fund Total
Legislative Appropriation with Budget
Amendments
$35,719 $69,870 $35,220 $5,215 $146,024
July BPW Reduce general funds due to the
availability of Maryland Oil
Disaster Containment, Clean-up,
and Contingency Fund special
funds in the Land Management
Administration
($2,000,000 general funds); and
reduce funding for equipment to
support a new position related to
shellfish water quality monitoring
in the Science Services
Administration ($19,042 general
funds).
-2,019 0 0 0 -2,019
Working Appropriation $33,700 $69,870 $35,220 $5,215 $144,005
January BPW Reduce general funds for operating
expenses ($230,853 general funds)
and substitute special funds
($230,853 special funds) available
in the Oil Control Program, and
reduce funding for lease purchase
payments to computer upgrades
($30,147 general funds).
-261 231 0 0 -30
January BPW
Across the
Board
2% across-the-board reduction. -694 0 0 0 -694
U00A – Department of the Environment
Analysis of the FY 2016 Maryland Executive Budget, 2015 11
Action Description
General
Fund
Special
Fund
Federal
Fund
Reimb.
Fund Total
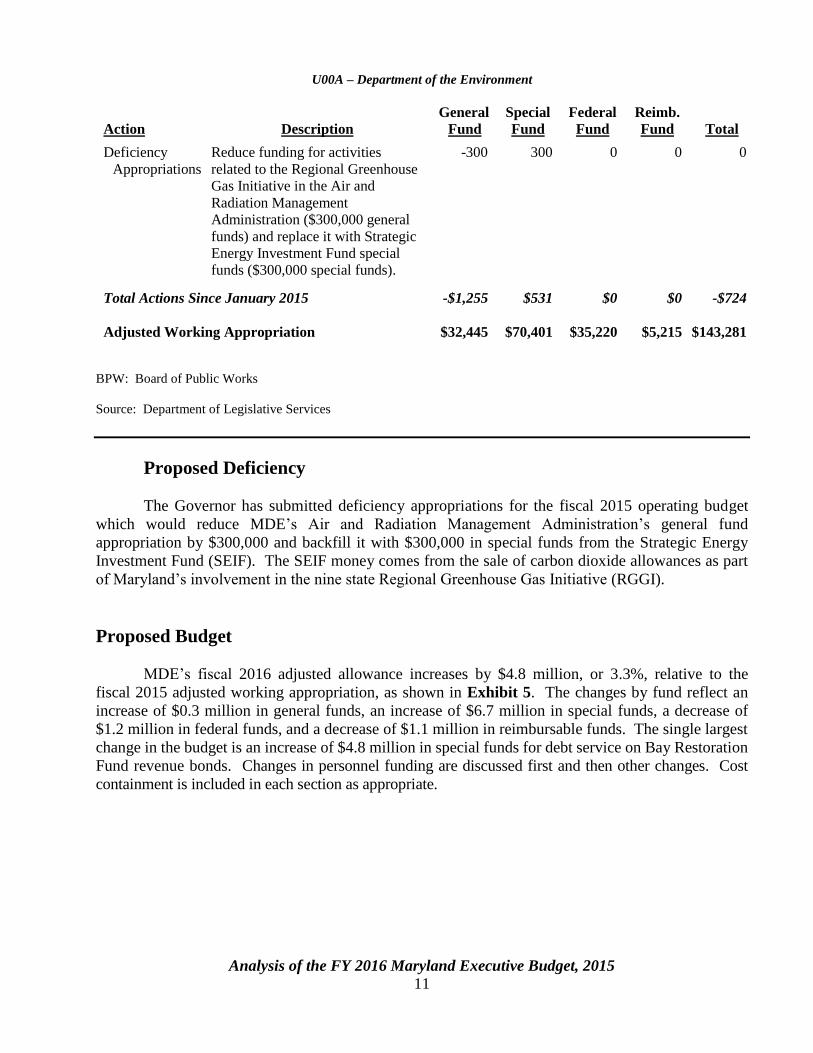
Deficiency
Appropriations
Reduce funding for activities
related to the Regional Greenhouse
Gas Initiative in the Air and
Radiation Management
Administration ($300,000 general
funds) and replace it with Strategic
Energy Investment Fund special
funds ($300,000 special funds).
-300 300 0 0 0
Total Actions Since January 2015 -$1,255 $531 $0 $0 -$724
Adjusted Working Appropriation $32,445 $70,401 $35,220 $5,215 $143,281
BPW: Board of Public Works
Source: Department of Legislative Services
Proposed Deficiency
The Governor has submitted deficiency appropriations for the fiscal 2015 operating budget
which would reduce MDE’s Air and Radiation Management Administration’s general fund
appropriation by $300,000 and backfill it with $300,000 in special funds from the Strategic Energy
Investment Fund (SEIF). The SEIF money comes from the sale of carbon dioxide allowances as part
of Maryland’s involvement in the nine state Regional Greenhouse Gas Initiative (RGGI).
Proposed Budget
MDE’s fiscal 2016 adjusted allowance increases by $4.8 million, or 3.3%, relative to the
fiscal 2015 adjusted working appropriation, as shown in Exhibit 5. The changes by fund reflect an
increase of $0.3 million in general funds, an increase of $6.7 million in special funds, a decrease of
$1.2 million in federal funds, and a decrease of $1.1 million in reimbursable funds. The single largest
change in the budget is an increase of $4.8 million in special funds for debt service on Bay Restoration
Fund revenue bonds. Changes in personnel funding are discussed first and then other changes. Cost
containment is included in each section as appropriate.

U00A – Department of the Environment
Analysis of the FY 2016 Maryland Executive Budget, 2015 12
Exhibit 5
Proposed Budget Department of the Environment
($ in Thousands)
How Much It Grows:
General
Fund
Special
Fund
Federal
Fund
Reimb.
Fund
Total
Fiscal 2014 Actual $36,268 $48,643 $28,766 $3,975 $117,653
Fiscal 2015 Working Appropriation 32,445 70,401 35,220 5,215 143,281
Fiscal 2016 Allowance 32,790 77,074 34,047 4,164 148,075
Fiscal 2015-2016 Amt. Change $345 $6,673 -$1,172 -$1,052 $4,794
Fiscal 2015-2016 Percent Change 1.1% 9.5% -3.3% -20.2% 3.3%
Where It Goes:
Personnel Expenses
Employee and retiree health insurance ................................................................................... $2,300
Increments and general salary increase annualization (prior to cost containment) ................ 1,861
Employee retirement ............................................................................................................... 1,431
Workers’ compensation premium assessment ........................................................................ 235
Turnover adjustments ............................................................................................................. 210
New positions: 3 permit writers ............................................................................................. 195
Social Security contribution .................................................................................................... 188
Other fringe benefit adjustments ............................................................................................. 104
Section 20: abolition of prior year 2% general salary increase .............................................. -1,366
Section 21: abolition of employee increments ....................................................................... -1,196
Fiscal 2015 adjustments .......................................................................................................... -684
Other Changes
Information Technology
Cloud-based data back-up service .......................................................................................... 135
Sharepoint Content Management System maintenance and support ...................................... 169
Lead activities ......................................................................................................................... -911
Environmental Permit Tracking System Modernization Project ............................................ -908
Geographic components for web services .............................................................................. -465
Remediation and Research
Oil Control Program spill remediation ................................................................................... 195
Gas chromatograph for analyzing soil and water samples ...................................................... 180
Nontidal wetland in-lieu fee projects ...................................................................................... -800
Mining projects ....................................................................................................................... -529
U00A – Department of the Environment
Analysis of the FY 2016 Maryland Executive Budget, 2015 13
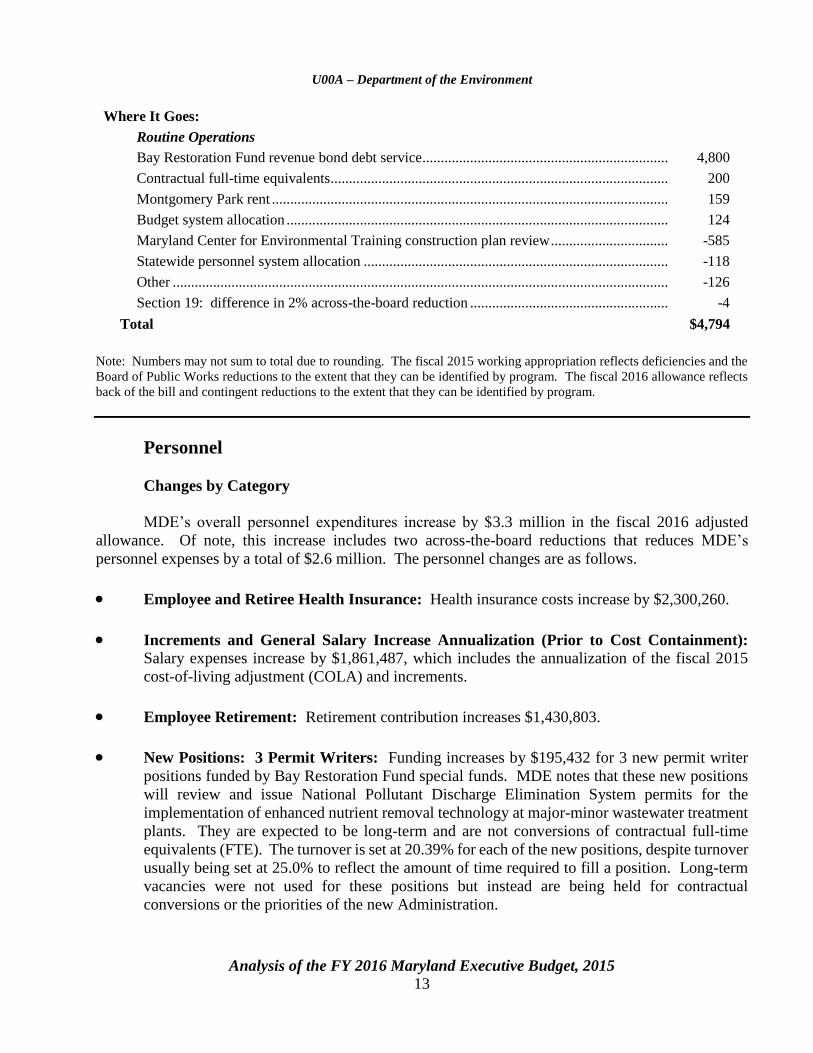
Where It Goes:
Routine Operations
Bay Restoration Fund revenue bond debt service ................................................................... 4,800
Contractual full-time equivalents ............................................................................................ 200
Montgomery Park rent ............................................................................................................ 159
Budget system allocation ........................................................................................................ 124
Maryland Center for Environmental Training construction plan review ................................ -585
Statewide personnel system allocation ................................................................................... -118
Other ....................................................................................................................................... -126
Section 19: difference in 2% across-the-board reduction ...................................................... -4
Total $4,794
Note: Numbers may not sum to total due to rounding. The fiscal 2015 working appropriation reflects deficiencies and the
Board of Public Works reductions to the extent that they can be identified by program. The fiscal 2016 allowance reflects
back of the bill and contingent reductions to the extent that they can be identified by program.
Personnel
Changes by Category
MDE’s overall personnel expenditures increase by $3.3 million in the fiscal 2016 adjusted
allowance. Of note, this increase includes two across-the-board reductions that reduces MDE’s
personnel expenses by a total of $2.6 million. The personnel changes are as follows.
Employee and Retiree Health Insurance: Health insurance costs increase by $2,300,260.
Increments and General Salary Increase Annualization (Prior to Cost Containment):
Salary expenses increase by $1,861,487, which includes the annualization of the fiscal 2015
cost-of-living adjustment (COLA) and increments.
Employee Retirement: Retirement contribution increases $1,430,803.
New Positions: 3 Permit Writers: Funding increases by $195,432 for 3 new permit writer
positions funded by Bay Restoration Fund special funds. MDE notes that these new positions
will review and issue National Pollutant Discharge Elimination System permits for the
implementation of enhanced nutrient removal technology at major-minor wastewater treatment
plants. They are expected to be long-term and are not conversions of contractual full-time
equivalents (FTE). The turnover is set at 20.39% for each of the new positions, despite turnover
usually being set at 25.0% to reflect the amount of time required to fill a position. Long-term
vacancies were not used for these positions but instead are being held for contractual
conversions or the priorities of the new Administration.
U00A – Department of the Environment
Analysis of the FY 2016 Maryland Executive Budget, 2015 14
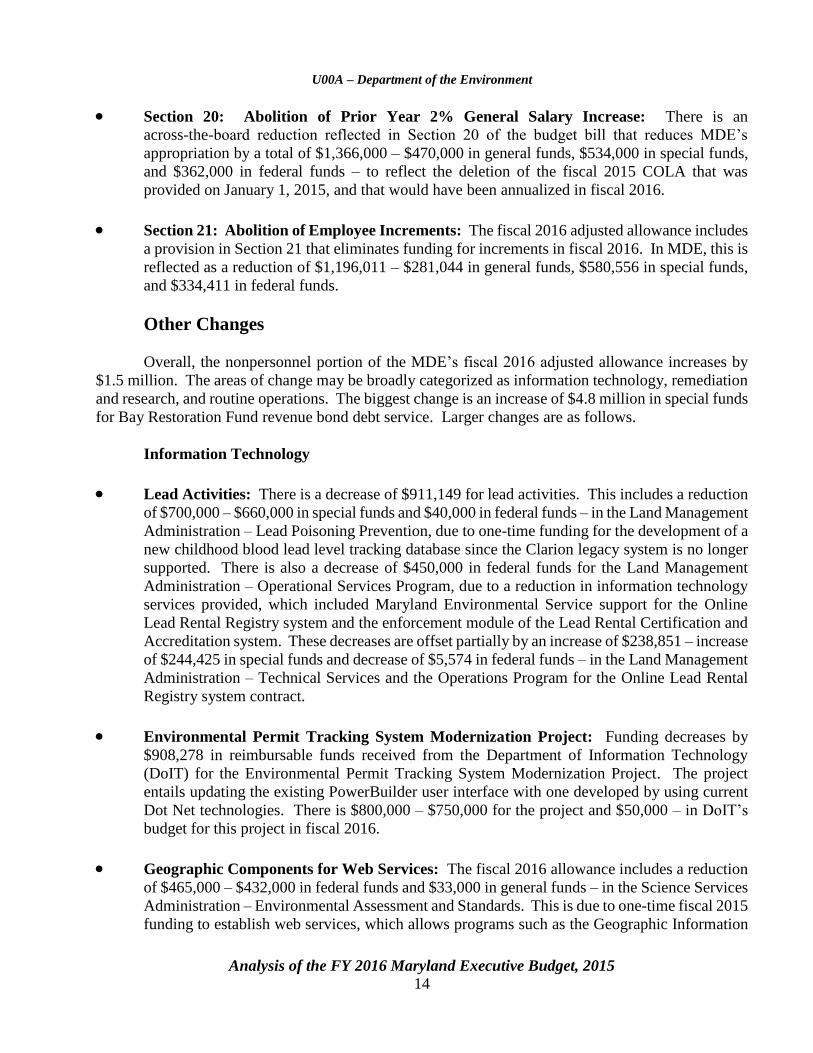
Section 20: Abolition of Prior Year 2% General Salary Increase: There is an
across-the-board reduction reflected in Section 20 of the budget bill that reduces MDE’s
appropriation by a total of $1,366,000 – $470,000 in general funds, $534,000 in special funds,
and $362,000 in federal funds – to reflect the deletion of the fiscal 2015 COLA that was
provided on January 1, 2015, and that would have been annualized in fiscal 2016.
Section 21: Abolition of Employee Increments: The fiscal 2016 adjusted allowance includes
a provision in Section 21 that eliminates funding for increments in fiscal 2016. In MDE, this is
reflected as a reduction of $1,196,011 – $281,044 in general funds, $580,556 in special funds,
and $334,411 in federal funds.
Other Changes
Overall, the nonpersonnel portion of the MDE’s fiscal 2016 adjusted allowance increases by
$1.5 million. The areas of change may be broadly categorized as information technology, remediation
and research, and routine operations. The biggest change is an increase of $4.8 million in special funds
for Bay Restoration Fund revenue bond debt service. Larger changes are as follows.
Information Technology
Lead Activities: There is a decrease of $911,149 for lead activities. This includes a reduction
of $700,000 – $660,000 in special funds and $40,000 in federal funds – in the Land Management
Administration – Lead Poisoning Prevention, due to one-time funding for the development of a
new childhood blood lead level tracking database since the Clarion legacy system is no longer
supported. There is also a decrease of $450,000 in federal funds for the Land Management
Administration – Operational Services Program, due to a reduction in information technology
services provided, which included Maryland Environmental Service support for the Online
Lead Rental Registry system and the enforcement module of the Lead Rental Certification and
Accreditation system. These decreases are offset partially by an increase of $238,851 – increase
of $244,425 in special funds and decrease of $5,574 in federal funds – in the Land Management
Administration – Technical Services and the Operations Program for the Online Lead Rental
Registry system contract.
Environmental Permit Tracking System Modernization Project: Funding decreases by
$908,278 in reimbursable funds received from the Department of Information Technology
(DoIT) for the Environmental Permit Tracking System Modernization Project. The project
entails updating the existing PowerBuilder user interface with one developed by using current
Dot Net technologies. There is $800,000 – $750,000 for the project and $50,000 – in DoIT’s
budget for this project in fiscal 2016.
Geographic Components for Web Services: The fiscal 2016 allowance includes a reduction
of $465,000 – $432,000 in federal funds and $33,000 in general funds – in the Science Services
Administration – Environmental Assessment and Standards. This is due to one-time fiscal 2015
funding to establish web services, which allows programs such as the Geographic Information

U00A – Department of the Environment
Analysis of the FY 2016 Maryland Executive Budget, 2015 15
System (ArcGIS) Desktop and ArcGIS Online to access Ambient Water Quality Monitoring
System data directly.
Remediation and Research
Nontidal Wetland In-lieu Fee Projects: There is a decrease of $800,000 in special funds in
the Water Management Administration – Wetlands and Waterways due to a reduction in the
number of in-lieu fee program nontidal wetland projects. MDE has a memorandum of
understanding with the Chesapeake Bay Trust to develop a request for proposals, and this
amount has been reduced in fiscal 2016.
Mining Projects: Mining project funding decreases by $528,657. This reflects a reduction of
$692,157 in federal funds in the Land Management Administration – Mining primarily due to
the completion of the Bald Knob Waterline Project – Phase I project to supply water to
residences in Allegany County and a reduction for the Casselman Acid Mine Drainage
Systems – Construction Phase III project. This decrease is offset partially by an increase of
$163,500 – $212,450 federal fund increase and $48,950 special fund decrease – in the Land
Management Administration – Mining. This increase reflects funding for mining projects
including the Braddock Run/Hoffman Tunnel Stream Stabilization project in the Clarysville
area of Allegany County and the Tasker’s Corner Deep Mine and Gob Pile project.
Routine Operations
Bay Restoration Fund Revenue Bond Debt Service: There is an increase of $4,800,000 in
special funds for the Coordinating Offices based on the new revenue bond issuance schedule
including $4.7 million for debt service associated with revenue bonds issued in fiscal 2008 and
$9.8 million for fiscal 2014 series bonds.
Contractual Full-time Equivalents: Funding increases by $200,129 for contractual FTEs
comprised of increases of $135,492 in special funds, $64,037 in federal funds, and $1,986 in
reimbursable funds, which are offset partially by a decrease of $1,386 in general funds. There
is an overall decrease of 5.0 FTEs. This decrease is comprised of the following: 5.0 FTEs in
the Water Management Administration – Water Supply, which is commensurate with a
$170,077 decrease in funding, and a decrease of 1.0 FTE in the Coordinating Offices –
Information Systems and Technology, which is commensurate with a decrease of $82,905.
These decreases are offset partially by an increase of 1.0 FTE in the Science Services
Administration – Environmental Assessment and Standards, which is commensurate with a
$35,254 increase. In addition to the changes noted above, there is an increase of $417,857
across MDE’s budget for contractual FTEs without any increase in FTE positions. MDE notes
that the funding increase despite the lack of any increase in FTE positions is due to positions
being added through the hiring exception process without increases in appropriations for
fiscal 2015.

U00A – Department of the Environment
Analysis of the FY 2016 Maryland Executive Budget, 2015 16
Maryland Center for Environmental Training Construction Plan Review: There is a
decrease of $585,000 in federal funds for the Coordinating Offices – Engineering and Capital
Projects Program, due to a one-time enhancement for engineering, training, and technical
assistance for review of construction plans provided by the Maryland Center for Environmental
Training.
Section 19: Difference in 2% Across-the-board Reduction: MDE’s fiscal 2015 adjusted
working appropriation included a 2% reduction of $693,999 in general funds, which is raised
to a $698,000 reduction in the fiscal 2016 adjusted allowance for an additional decrease of
$4,001. MDE notes that the fiscal 2015 spending reduction plan will most likely include
increased turnover for positions.

U00A – Department of the Environment
Analysis of the FY 2016 Maryland Executive Budget, 2015 17
Issues
1. Clean Power Rule Costs Mitigated By Regional Greenhouse Gas Initiative
Involvement
In June 2013, President Barack H. Obama published the Climate Action Plan. The plan, which
is designed to reduce the amount of energy consumed by American families, consists of three key
pillars: (1) reduce carbon pollution in the United States by utilizing clean energy and deploying
strategies that promote fuel economy and energy efficiency; (2) prepare the United States for the impact
of climate change by establishing policies that promote and support community-based preparedness,
including science and research germane to preparedness and resilience and the protection of critical
infrastructure and public resources; and (3) lead international efforts to combat global climate change
(while also preparing for its impact) by establishing international initiatives with major emitting
countries that are focused on spurring concrete action and forging global responses to climate change
via international negotiations.
The Overarching Plan: By 2030, Reduce Nationwide Carbon Emissions from
the Power Sector by 30% below 2005 Emission Levels
In response to President Obama’s Climate Action Plan, in June 2014, the U.S. Environmental
Protection Agency (EPA) proposed the “Clean Power Plan.” The plan, which applies to existing power
plants, outlines the four “building blocks” (i.e., make fossil fuel power plants more efficient; use
lower-emitting power plants more frequently; expand renewable power sources; and use demand-side
energy more efficiently) that make up the best system of emission reductions under the Clean Air Act.
Under the Clean Power Plan, EPA estimates that, by 2030, carbon emissions from the power sector
will decline by 30% below 2005 carbon emissions levels.
The Clean Power Plan gives each state a specific target goal to help reduce carbon pollution
from the power sector. Although the overall emissions reduction target is relative to 2005 baseline
emissions, the carbon pollution standards under the Clean Power Plan are based on each state’s
2012 energy mix, and the ability of each state to reduce carbon emissions below 2012 levels. The state
target goal, which reflects the pollution-to-power ratio that a state must meet by 2030, takes into
account carbon dioxide emissions from fossil-fuel-fired power plants, state electricity generation from
fossil-fuel-fired power plants, and certain low- or zero-emitting power sources. The Clean Power Plan
does not impose specific requirements on individual fossil-fuel-fired power plants nor does it outline a
specific set of mechanisms that a state must use to reduce carbon pollution. Rather, the plan affords
states with the flexibility to lower their pollution-to-power ratio by preparing and implementing
state plans that fit their specific circumstances.
If a state fails to submit a plan or if a plan is not approved, it is likely that EPA will develop,
implement, and enforce a federal implementation plan to meet the emissions reduction targets. EPA is
currently requesting comments on what consequences should apply if a state-approved plan fails to
achieve the interim or final goal.

U00A – Department of the Environment
Analysis of the FY 2016 Maryland Executive Budget, 2015 18
Implementing the Clean Power Plan in Maryland
The Clean Power Plan proposes a final target goal of 1,187 pounds of carbon dioxide per
megawatt hour for Maryland. This represents a 36.5% reduction in carbon emissions from 2012 levels,
which is in line with the reductions proposed for other states in the region, including Delaware,
Pennsylvania, and Virginia. Interim and baseline emission levels are summarized in Exhibit 6.
Exhibit 6
Maryland: Proposed Carbon Emission Reductions Emission Rate
Emission Rate1 Percent Reduction from Baseline Baseline (2012) 1,870 n/a
Interim Target (2020-2029) 1,347 28.0%
Final Target (2030) 1,187 36.5%
1 pounds carbon/dioxide per megawatt hour
Source: U.S. Environmental Protection Agency
Efforts to curb greenhouse gas emissions are already underway in Maryland. In 2007, the State
established a Commission on Climate Change, tasked with developing the State’s first comprehensive
Climate Action Plan. The plan was released in 2008, and it addressed the impacts of climate change
through participation in RGGI, increases to the State’s renewable energy portfolio, and the adoption of
the EmPOWER Maryland initiative. The State has already established a goal of achieving a
25.0% reduction in annual greenhouse gas emissions by 2020, compared with 2006 levels. As of 2013,
the State has reduced emissions by 9.7%.
Maryland’s current climate change initiatives put the State in a good position to comply with
the federal Clean Power Plan once it becomes final. As previously noted, the State already participates
in RGGI, a cap-and-trade program established in conjunction with eight other Northeastern and
Mid-Atlantic states. Maryland expects to demonstrate compliance with the federal rule through its
participation in RGGI – i.e., through the establishment of RGGI’s regional emissions cap, which
accounts for reductions in emissions due to the State’s existing portfolio of energy programs. Whether,
and to what extent, the State will need to strengthen any of these programs or deploy additional
measures to meet federal emissions targets is undetermined at this time.
Implementation Costs
EPA estimates the total nationwide cost of reporting and recordkeeping requirements under the
Clean Power Plan to range from $68.3 million per year during the early stages of implementation to
$8.9 million per year during the later stages of implementation. However, given that Maryland has
already incurred many of these costs through its participation in RGGI, the additional costs to the State

U00A – Department of the Environment
Analysis of the FY 2016 Maryland Executive Budget, 2015 19
are expected to be low. EPA projects that retail electricity prices may increase anywhere from 3.2% to
8.6% in the Mid-Atlantic region, depending on how states choose to implement the Clean Power Plan.
Average electricity bills are expected to decrease by as much as 8.7% by 2030, however, as states adopt
measures to promote energy efficiency.
Next Steps: Implementation Timeframe
Comments on the Clean Power Proposed Rule were received by EPA by October 16, 2014.
During that time, states had an opportunity to comment on the rule and argue for an adjustment in their
proposed targets. Maryland submitted comments to EPA stating that it should consider the RGGI
program as a compliance option for participating states and asking it to provide a method to convert
RGGI’s mass emissions caps (tons) to the Clean Power Proposed Plan’s emissions rates (pounds per
million British thermal units). EPA is expected to finalize the clean power regulations shortly after
July 2015, and the State will have until June 2016 to prepare and submit its implementation plan for
EPA review. Once the State has submitted its plan, EPA will review the plan and make an approval
determination within 12 months through a notice and comment rulemaking process.
DLS recommends that MDE comment on the economic benefits of RGGI as they relate to
the potential for compliance with the Clean Power Proposed Rule.
2. Marcellus Shale Fracking Status
In June 2011, Governor Martin J. O’Malley signed an executive order establishing the
Marcellus Shale Safe Drilling Initiative to assist State policymakers and regulators in determining
whether and how gas production from the Marcellus Shale in Maryland can be accomplished without
unacceptable risks of adverse impacts to public health, safety, and the environment. The executive
order requires three reports as follows: (1) findings and recommendations regarding sources of revenue
and standards of liability for damages caused by gas exploration and production (submitted
December 2011); (2) recommendations for best practices for all aspects of natural gas exploration and
production in the Marcellus Shale in Maryland (submitted July 2014); and (3) findings and
recommendations regarding the potential impact of Marcellus Shale drilling in Maryland
(submitted December 2014).
Final Report
The final report submitted in December 2014 notes that a number of interests need to be
weighed in terms of developing the Marcellus Shale in Maryland, including the following: property
owner rights to realize the value of mineral rights; positive impacts on the economy; threat to existing
tourism and outdoor recreation-based economies; possible climate change impacts; and protection of
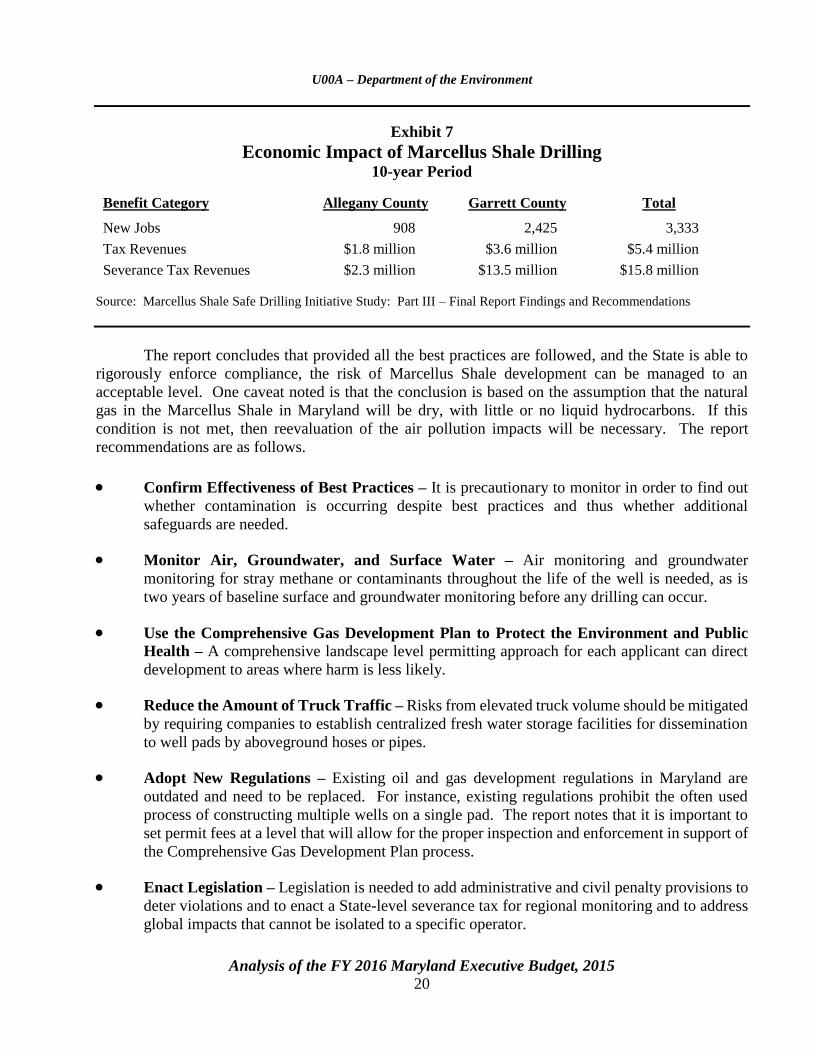
public health, the environment, and quality of life in Western Maryland. In terms of the economic
impact, the report notes that the effect on the economy could be mixed, but that there are certain
modeled parameters reflecting the maximum estimated rate of extraction over a 10-year period, which
are reflected in Exhibit 7.
U00A – Department of the Environment
Analysis of the FY 2016 Maryland Executive Budget, 2015 20
Exhibit 7
Economic Impact of Marcellus Shale Drilling 10-year Period
Benefit Category Allegany County Garrett County Total
New Jobs 908 2,425 3,333
Tax Revenues $1.8 million $3.6 million $5.4 million
Severance Tax Revenues $2.3 million $13.5 million $15.8 million
Source: Marcellus Shale Safe Drilling Initiative Study: Part III – Final Report Findings and Recommendations
The report concludes that provided all the best practices are followed, and the State is able to
rigorously enforce compliance, the risk of Marcellus Shale development can be managed to an
acceptable level. One caveat noted is that the conclusion is based on the assumption that the natural
gas in the Marcellus Shale in Maryland will be dry, with little or no liquid hydrocarbons. If this
condition is not met, then reevaluation of the air pollution impacts will be necessary. The report
recommendations are as follows.
Confirm Effectiveness of Best Practices – It is precautionary to monitor in order to find out
whether contamination is occurring despite best practices and thus whether additional
safeguards are needed.
Monitor Air, Groundwater, and Surface Water – Air monitoring and groundwater
monitoring for stray methane or contaminants throughout the life of the well is needed, as is
two years of baseline surface and groundwater monitoring before any drilling can occur.
Use the Comprehensive Gas Development Plan to Protect the Environment and Public
Health – A comprehensive landscape level permitting approach for each applicant can direct
development to areas where harm is less likely.
Reduce the Amount of Truck Traffic – Risks from elevated truck volume should be mitigated
by requiring companies to establish centralized fresh water storage facilities for dissemination
to well pads by aboveground hoses or pipes.
Adopt New Regulations – Existing oil and gas development regulations in Maryland are
outdated and need to be replaced. For instance, existing regulations prohibit the often used
process of constructing multiple wells on a single pad. The report notes that it is important to
set permit fees at a level that will allow for the proper inspection and enforcement in support of
the Comprehensive Gas Development Plan process.
Enact Legislation – Legislation is needed to add administrative and civil penalty provisions to
deter violations and to enact a State-level severance tax for regional monitoring and to address
global impacts that cannot be isolated to a specific operator.

U00A – Department of the Environment
Analysis of the FY 2016 Maryland Executive Budget, 2015 21
Manage Adaptively – Maryland must adapt through new regulations or permit provisions to
the constantly evolving information space surrounding shale gas development impacts.
Regulations
MDE notes that revisions to oil and regulations, effectively Marcellus Shale drilling regulations,
were proposed in the Maryland Register. The public comment period began on January 9, 2015, and
will end on February 9, 2015. Comments have been received from 17 parties to date. DLS
recommends that MDE comment on the types of comments it has received for the Marcellus
Shale hydraulic fracturing regulations.
3. Required Construction Site Inspections Not Occurring
MDE’s January 2015 audit completed by the Office of Legislative Audits contained two repeat
findings – an improvement upon the four repeat findings in the November 2011 audit. However, the
January 2015 audit contained the repeat finding that that there are insufficient resources to inspect every
active construction site for compliance with erosion and sediment control plans an average of once
every two weeks in accordance with State regulations. In its response to the November 2011 audit
finding, MDE noted that it is understaffed by 342 positions just to comply with minimum mandated
regulations. In the response to its January 2015 audit, MDE noted that it did not attempt to request
additional inspection positions because it did not believe the positions would be approved. In addition,
MDE noted that it did not pursue modifying inspection regulations due to anticipated environmental
community concerns.
Instead, MDE has gained a little flexibility via Chapter 81 of 2013 (Environment – Sediment
Control and Stormwater Management Plans – Authority). This legislation provides MDE with the
authority to delegate site inspection and plan approval activities to other agencies and entities. For
instance, MDE notes that the agreement with the Maryland Department of Transportation to delegate
inspections and plan approval for State Highway Administration and Maryland Transit Administration
projects is estimated to address up to 50% of the current State and federal projects in the annual
inspection portfolio. However, there still appears to be a sizeable gap between current practice and the
requirement to inspect every active construction site for compliance with erosion and sediment control
plans an average of once every two weeks. The Chesapeake and Atlantic Coastal Bays 2010 Trust
Fund is a dedicated source of funding for Chesapeake Bay restoration activities. It has fewer claims
on it than the State’s general fund and would provide a stable source of funding for compliance with
erosion and sediment control pans and related activities completed by MDE’s Water Management
Administration – Compliance subprogram. DLS recommends that $3,179,957 in general fund
appropriation be reduced and authorization be provided in the Budget Reconciliation and
Financing Act of 2015 to allow MDE to use Chesapeake and Atlantic Coastal Bays 2010 Trust
Fund money for sediment and erosion control inspections and associated activities.

U00A – Department of the Environment
Analysis of the FY 2016 Maryland Executive Budget, 2015 22
Recommended Actions
1. Add the following language:
Provided that 6 regular positions shall be abolished by July 1, 2015.
Explanation: The Maryland Department of the Environment’s share of the fiscal 2016
2% across-the-board reduction is $698,000 in general funds. This action abolishes 6 general
fund positions in order to create $660,048 in ongoing general fund savings, which is roughly
commensurate with the 2% across-the-board reduction. The estimated savings are based on an
average general fund position salary and fringe benefit cost of $110,008 and 220 funded
positions in the fiscal 2016 allowance.
2. Add the following language to the general fund appropriation:
, provided that this appropriation shall be reduced by $3,179,957 contingent upon the enactment
of HB 72 or SB 57 containing a provision authorizing the Chesapeake and Atlantic Coastal
Bays 2010 Trust Fund to be used for salaries associated with the statewide inspection,
enforcement, compliance assistance, and permit issuance in the Water Management
Administration – Compliance subprogram, including, but not limited, to the following
regulatory areas: industrial and municipal wastewater discharges, construction activities
involving sediment control, stormwater management, wetlands, and waterways.
Explanation: The Maryland Department of the Environment has been unable to muster
sufficient resources to inspect every active construction site for compliance with erosion and
sediment control plans an average of once every two weeks in accordance with State
regulations. This is reflected in the department’s November 2011 audit and again in its
January 2015 audit. This action reduces general funds contingent on authorization of
Chesapeake and Atlantic Coastal Bays 2010 Trust Fund special funds for this purpose and
related activities. There are fewer claims on the Chesapeake and Atlantic Coastal Bays 2010
Trust Fund than there are on the State’s general fund and thus, there is a higher likelihood that
the Maryland Department of the Environment will receive sufficient resources to meet its duty
under State regulations.

U00A – Department of the Environment
Analysis of the FY 2016 Maryland Executive Budget, 2015 23
Appendix 1
Current and Prior Year Budgets
Fiscal 2014
Legislative
Appropriation $36,936 $60,597 $33,729 $3,247 $134,510
Deficiency
Appropriation -904 -725 -463 0 -2,092
Budget
Amendments 464 554 376 1,250 2,643
Reversions and
Cancellations -227 -11,783 -4,876 -522 -17,409
Actual
Expenditures $36,268 $48,643 $28,766 $3,975 $117,653
Fiscal 2015
Legislative
Appropriation $35,484 $65,178 $34,396 $4,307 $139,364
Cost
Containment -2,019 0 0 0 -2,019
Budget
Amendments 235 4,692 824 908 6,660
Working
Appropriation $33,700 $69,870 $35,220 $5,215 $144,005
Current and Prior Year Budgets
Fund FundFund
Reimb.
Fund Total
($ in Thousands)
Maryland Department of the Environment
General Special Federal
Note: Numbers may not sum to total due to rounding. The fiscal 2015 working appropriation does not include January 2015
Board of Public Works reductions and deficiencies.
U0
0A
– D
epa
rtmen
t of th
e En
viron
men
t
Appen
dix
1

U00A – Department of the Environment
Analysis of the FY 2016 Maryland Executive Budget, 2015 24
Fiscal 2014
MDE’s general fund appropriation decreased by $667,742. The changes are as follows:
Deficiency Appropriation – A decrease of $903,948 across MDE’s budget for negative
deficiencies associated with health insurance ($414,153); retirement ($367,945); and State
personnel system allocation ($121,850).
Budget Amendments – An increase of $463,542 due to budget amendments allocating the
COLA, effective January 1, 2014 ($354,451); employee salary increments, effective
April 1, 2014 ($87,821); and personnel classifications as part of the Annual Salary Review
($21,270).
Reversions – A decrease of $227,336 primarily due to a reduction of $216,711 in the
Operational Services Administration.
MDE’s special fund appropriation decreased by $11,954,242. The changes are as follows:
Deficiency Appropriation – A decrease of $724,969 across MDE’s budget for negative
deficiencies associated with retirement ($465,189) and health insurance ($259,780).
Budget Amendments – An increase of $553,924 due to budget amendments allocating the
COLA, effective January 1, 2014 ($360,567); employee salary increments, effective
April 1, 2014 ($170,123); and personnel classifications as part of the Annual Salary Review
($23,234).
Cancellations – A decrease of $11,783,197, as a result of cancellations primarily in the Land
Management Administration ($5,042,074); the Coordinating Offices – Bay Restoration Fund
Debt Service, due to an unneeded appropriation based on the current revenue bond issuance
schedule ($4,817,091); the Air and Radiation Management Administration ($503,809); the
Science Services Administration ($478,490); and the Coordinating Offices – Coordinating
Offices ($450,085).
MDE’s federal fund appropriation decreased by $4,962,785. The changes are as follows.
Deficiency Appropriation – A decrease of $462,651 across MDE’s budget for negative
deficiencies associated with retirement ($309,541) and health insurance ($153,110).
Budget Amendments – An increase of $375,793 due to budget amendments allocating the
COLA, effective January 1, 2014 ($269,422); and employee salary increments, effective
April 1, 2014 ($106,371).
Cancellations – A decrease of $4,875,927, as a result of cancellations primarily in the Land
Management Administration ($2,936,401); the Coordinating Offices – Coordinating Offices
U00A – Department of the Environment
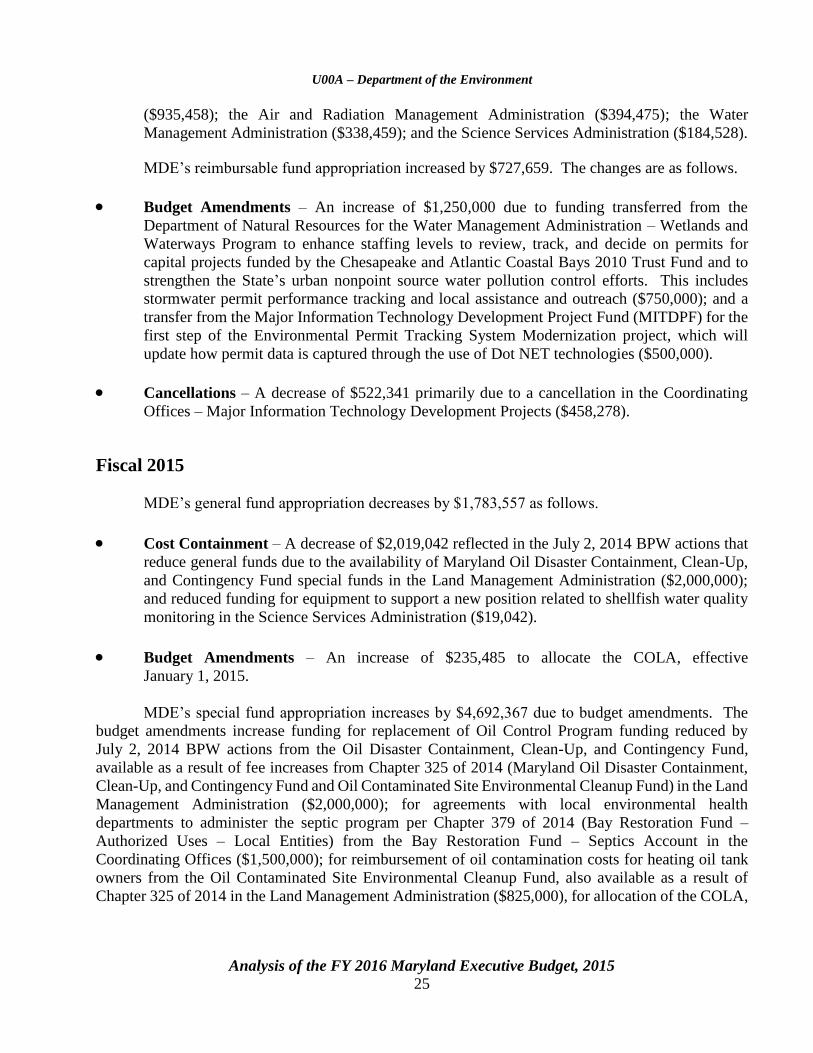
Analysis of the FY 2016 Maryland Executive Budget, 2015 25
($935,458); the Air and Radiation Management Administration ($394,475); the Water
Management Administration ($338,459); and the Science Services Administration ($184,528).
MDE’s reimbursable fund appropriation increased by $727,659. The changes are as follows.
Budget Amendments – An increase of $1,250,000 due to funding transferred from the
Department of Natural Resources for the Water Management Administration – Wetlands and
Waterways Program to enhance staffing levels to review, track, and decide on permits for
capital projects funded by the Chesapeake and Atlantic Coastal Bays 2010 Trust Fund and to
strengthen the State’s urban nonpoint source water pollution control efforts. This includes
stormwater permit performance tracking and local assistance and outreach ($750,000); and a
transfer from the Major Information Technology Development Project Fund (MITDPF) for the
first step of the Environmental Permit Tracking System Modernization project, which will
update how permit data is captured through the use of Dot NET technologies ($500,000).
Cancellations – A decrease of $522,341 primarily due to a cancellation in the Coordinating
Offices – Major Information Technology Development Projects ($458,278).
Fiscal 2015
MDE’s general fund appropriation decreases by $1,783,557 as follows.
Cost Containment – A decrease of $2,019,042 reflected in the July 2, 2014 BPW actions that
reduce general funds due to the availability of Maryland Oil Disaster Containment, Clean-Up,
and Contingency Fund special funds in the Land Management Administration ($2,000,000);
and reduced funding for equipment to support a new position related to shellfish water quality
monitoring in the Science Services Administration ($19,042).
Budget Amendments – An increase of $235,485 to allocate the COLA, effective
January 1, 2015.
MDE’s special fund appropriation increases by $4,692,367 due to budget amendments. The
budget amendments increase funding for replacement of Oil Control Program funding reduced by
July 2, 2014 BPW actions from the Oil Disaster Containment, Clean-Up, and Contingency Fund,
available as a result of fee increases from Chapter 325 of 2014 (Maryland Oil Disaster Containment,
Clean-Up, and Contingency Fund and Oil Contaminated Site Environmental Cleanup Fund) in the Land
Management Administration ($2,000,000); for agreements with local environmental health
departments to administer the septic program per Chapter 379 of 2014 (Bay Restoration Fund –
Authorized Uses – Local Entities) from the Bay Restoration Fund – Septics Account in the
Coordinating Offices ($1,500,000); for reimbursement of oil contamination costs for heating oil tank
owners from the Oil Contaminated Site Environmental Cleanup Fund, also available as a result of
Chapter 325 of 2014 in the Land Management Administration ($825,000), for allocation of the COLA,

U00A – Department of the Environment
Analysis of the FY 2016 Maryland Executive Budget, 2015 26
effective January 1, 2015 ($267,367); and for unanticipated exterminator costs from Special Indirect
Cost Recoveries in the Operational Services Administration ($100,000).
MDE’s federal fund appropriation increases by $823,591 due to budget amendments. The
budget amendments establish web services, allowing programs such as the Geographic Information
System (ArcGIS) Desktop and ArcGIS Online to access Ambient Water Quality Monitoring System
data directly using Environmental Information Exchange Network Grant Program funding in the
Science Services Administration ($442,000); fund equipment, supplies, and related services to establish
near-road monitoring sites to measure short-term, near-road nitrogen dioxide (NO2) concentrations
near heavily trafficked roads to assess the impact on vulnerable and susceptible populations using
Surveys, Studies, Research, Investigations, Demonstrations, and Special Purpose Activities Relating to
the Clean Air Act funding in the Air and Radiation Management Administration ($200,000); and
allocate the COLA, effective January 1, 2015 ($181,591).
MDE’s reimbursable fund appropriation increases by $908,278 due to budget amendments. The
budget amendments provide funding transferred from DoIT’s MITDPF for the Environmental Permit
Tracking System Modernization Project to reflect the unencumbered, unexpended balance of the
fiscal 2014 appropriation ($458,278), and funding transferred from DoIT’s MITDPF for the
Environmental Permit Tracking System Modernization Project to reflect new fiscal 2015 funding for
updating the existing PowerBuilder user interface with one developed using current Dot Net
technologies ($450,000).
U00A – Department of the Environment
Analysis of the FY 2016 Maryland Executive Budget, 2015 27
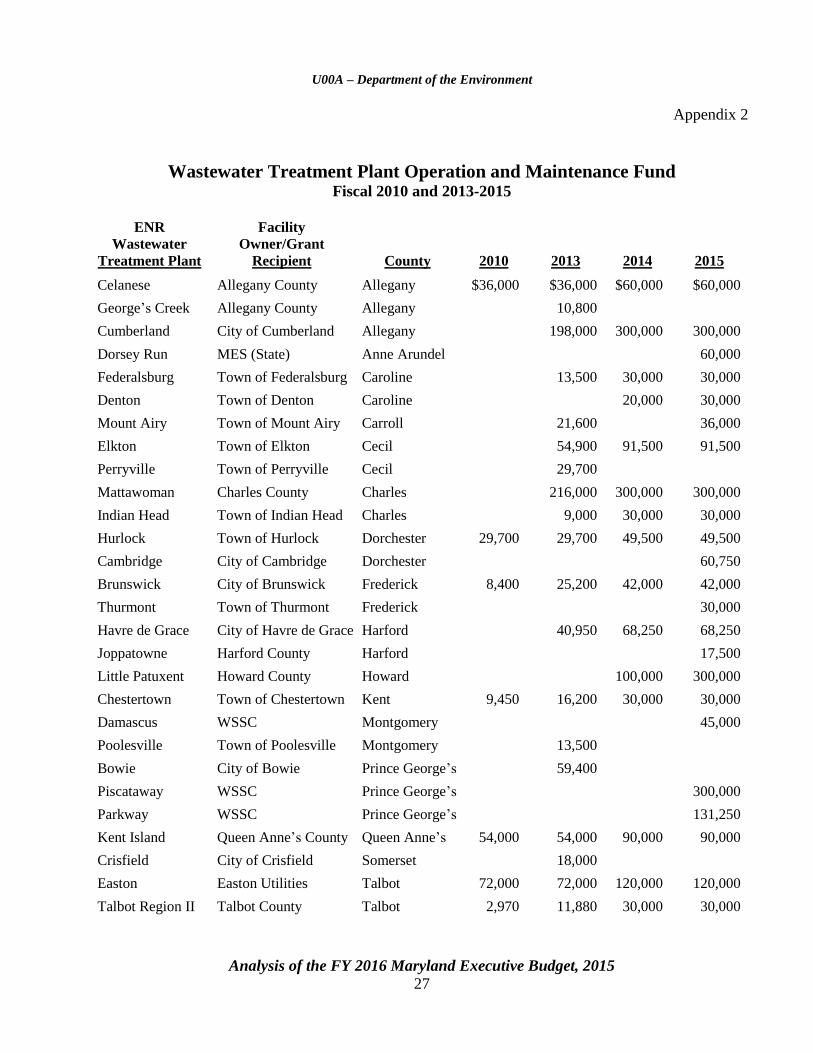
Appendix 2
Wastewater Treatment Plant Operation and Maintenance Fund Fiscal 2010 and 2013-2015
ENR
Wastewater
Treatment Plant
Facility
Owner/Grant
Recipient County 2010 2013 2014 2015
Celanese Allegany County Allegany $36,000 $36,000 $60,000 $60,000
George’s Creek Allegany County Allegany 10,800
Cumberland City of Cumberland Allegany 198,000 300,000 300,000
Dorsey Run MES (State) Anne Arundel 60,000
Federalsburg Town of Federalsburg Caroline 13,500 30,000 30,000
Denton Town of Denton Caroline 20,000 30,000
Mount Airy Town of Mount Airy Carroll 21,600 36,000
Elkton Town of Elkton Cecil 54,900 91,500 91,500
Perryville Town of Perryville Cecil 29,700
Mattawoman Charles County Charles 216,000 300,000 300,000
Indian Head Town of Indian Head Charles 9,000 30,000 30,000
Hurlock Town of Hurlock Dorchester 29,700 29,700 49,500 49,500
Cambridge City of Cambridge Dorchester 60,750
Brunswick City of Brunswick Frederick 8,400 25,200 42,000 42,000
Thurmont Town of Thurmont Frederick 30,000
Havre de Grace City of Havre de Grace Harford 40,950 68,250 68,250
Joppatowne Harford County Harford 17,500
Little Patuxent Howard County Howard 100,000 300,000
Chestertown Town of Chestertown Kent 9,450 16,200 30,000 30,000
Damascus WSSC Montgomery 45,000
Poolesville Town of Poolesville Montgomery 13,500
Bowie City of Bowie Prince George’s 59,400
Piscataway WSSC Prince George’s 300,000
Parkway WSSC Prince George’s 131,250
Kent Island Queen Anne’s County Queen Anne’s 54,000 54,000 90,000 90,000
Crisfield City of Crisfield Somerset 18,000
Easton Easton Utilities Talbot 72,000 72,000 120,000 120,000
Talbot Region II Talbot County Talbot 2,970 11,880 30,000 30,000

U00A – Department of the Environment
Analysis of the FY 2016 Maryland Executive Budget, 2015 28
ENR
Wastewater
Treatment Plant
Facility
Owner/Grant
Recipient County 2010 2013 2014 2015
Hagerstown City of Hagerstown Washington 144,000 240,000 240,000
Boonsboro Town of Boonsboro Washington 9,540 30,000
Delmar Town of Delmar Wicomico 10,000 30,000
Pocomoke City City of Pocomoke City Worcester 8,820 44,100
Snow Hill Town of Snow Hill Worcester 10,000
Total $212,520 $1,092,690 $1,655,350 $2,561,750
ENR: enhanced nutrient removal
MES: Maryland Environmental Service
WSSC: Washington Suburban Sanitary Commission
Source: Maryland Department of the Environment

U00A – Department of the Environment
Analysis of the FY 2016 Maryland Executive Budget, 2015 29
Appendix 3
Audit Findings
Audit Period for Last Audit: July 1, 2010 – July 29, 2013
Issue Date: January 2015
Number of Findings: 6
Number of Repeat Findings: 2
% of Repeat Findings: 33.3%
Rating: (if applicable)
Finding 1: Procedures were not sufficient to ensure properties with lead paint that were
constructed before 1950 were registered and fees paid.
Finding 2: MDE did not have a process to ensure that owners who have registered properties
affected by lead paint had a required inspection certificate.
Finding 3: Local jurisdictions were not required to submit critical documentation concerning Bay
Restoration Fund funded septic system installations and certain monitoring processes
were insufficient.
Finding 4: MDE had not performed documented verifications to ensure that all annual operations
and maintenance reports for Bay Restoration Fund-funded septic system installations
were submitted.
Finding 5: Inspections of construction activity that disturbs more than 5,000 square feet of
land or that results in more than 100 cubic yards of earth movement were not being
performed as required.
Finding 6: Monitoring, access, and update controls over the Tools for Environmental Management
and Protection of Organizations and Public and Private Drinking Water Information
System databases were not sufficient.
Note: The Office of Legislative Audits was unable to review the status of the following prior finding: “A process was not
established to verify hazardous material facilities are in compliance with security standards.” This is because federal
regulations developed by the U.S. Department of Homeland Security deny access to certain documentation critical to the
finding. The Office of Legislative Audits notes that this documentation is considered to be Chemical-terrorism
Vulnerability Information, which requires special training and approval to be obtained through the Department of Homeland
Security.
*Bold denotes item repeated in full or part from preceding audit report.

An
alysis o
f the F
Y 2
016 M
aryla
nd E
xecu
tive Bu
dget, 2
015
30
Major Information Technology Projects
Department of the Environment
Environmental Permit Tracking System Modernization
Project Status Planning. New/Ongoing Project: Ongoing.
Project Description: The Environmental Permit Tracking System Modernization project is intended to modernize how the Maryland
Department of the Environment (MDE) captures permit data by transferring the existing system from a legacy
PowerBuilder user interface to Dot NET technologies. The project will also support the Web Revamp Project by
making ePermitting and eCommerce available to citizens and businesses.
Project Business Goals: The project will reduce the level of effort required to enter data in MDE’s centralized permit tracking system and
ensure that the technologies that support MDE’s mission are cost effective and sustainable.
Estimated Total Project Cost: n/a Estimated Planning Project Cost: $3,340,000
Project Start Date: The project began in February 2013
with the development of the task order
request for proposals.
Projected Completion Date: Permit modernization and
eCommerce go live on
February 18, 2016.
Schedule Status: Planning and requirements analysis are planned to last from February 2013 to April 2014. Design is planned to
begin in June 2014 and implementation in November 2015. MDE indicates that it is working with the Regional
Economic Studies Institute at Towson University on developing a Consulting and Technical Services master
contract task order request for proposals to solicit contractor services to conduct the business requirements analysis
of the project. The JMT Technology Group was awarded a contract for the planning phase of the project on
September 26, 2014. It looks like the project schedule has slipped about three months given the new project
completion date above.
Cost Status: MDE received $500,000 in a reimbursable fund appropriation in fiscal 2014, and presumably the $50,000 for
oversight remained in the Department of Information Technology’s (DoIT) budget. For fiscal 2015, $450,000 is
budgeted in DoIT’s budget for this project, as well as $50,000 for oversight. For fiscal 2016, $750,000 is budgeted
in DoIT’s budget for this project, as well as $50,000 for oversight.
Scope Status: The scope is a plan at this stage.
Project Management Oversight Status: DoIT has approved the information technology request.
Identifiable Risks: Funding is the only medium-level risk. MDE notes that the technology is proven, but that it is new to MDE.
Additional Comments: Special funds may be used instead of general funds in the future if they become available.
Fiscal Year Funding ($ in Thousands) Prior Years FY 2015 FY 2016 FY 2017 FY 2018 FY 2019 Balance to Complete Total
Personnel Services $0.0 $0.0 $0.0 $0.0 $0.0 $0.0 $0.0 $0.0 Professional and Outside Services 0.6 0.5 0.8 1.5 0.0 0.0 0.0 3.3 Other Expenditures 0.0 0.0 0.0 0.0 0.0 0.0 0.0 0.0 Total Funding $0.6 $0.5 $0.8 $1.5 $0.0 $0.0 $3.1 $3.3
U0
0A
– D
epa
rtmen
t of th
e En
viron
men
t
Appen
dix
4
An
alysis o
f the F
Y 2
016 M
aryla
nd E
xecu
tive Bu
dget, 2
015
31
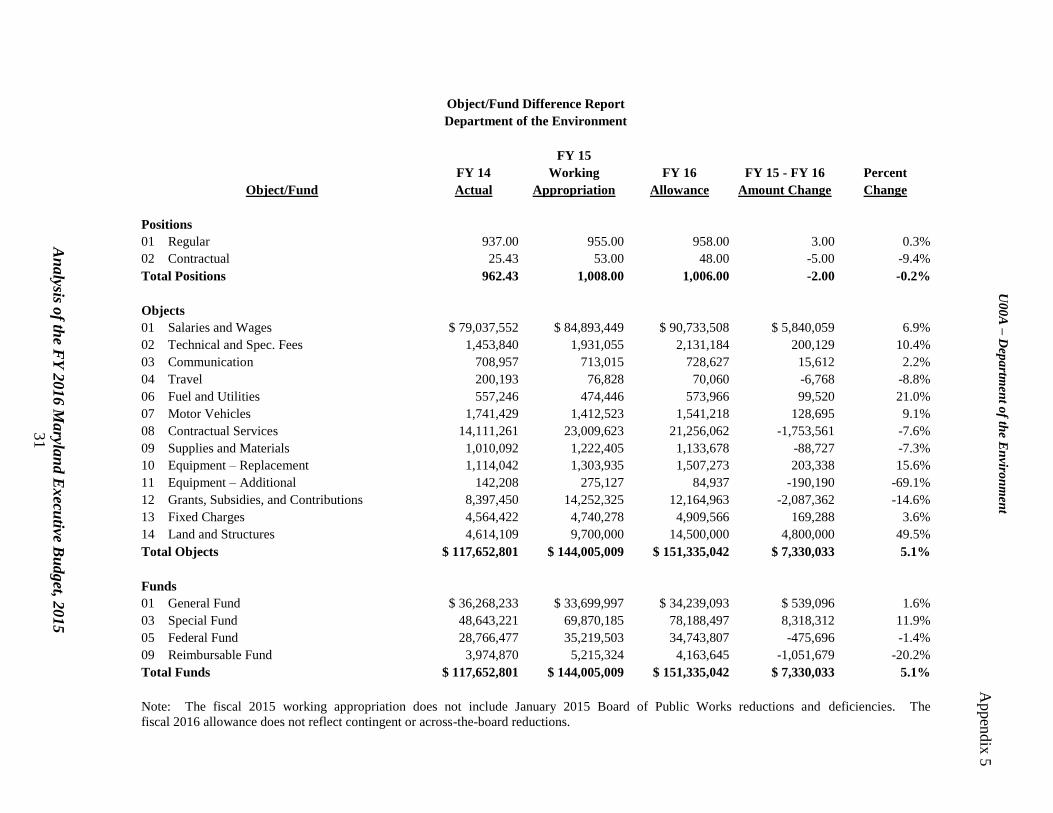
Object/Fund Difference Report
Department of the Environment
FY 15
FY 14 Working FY 16 FY 15 - FY 16 Percent
Object/Fund Actual Appropriation Allowance Amount Change Change
Positions
01 Regular 937.00 955.00 958.00 3.00 0.3%
02 Contractual 25.43 53.00 48.00 -5.00 -9.4%
Total Positions 962.43 1,008.00 1,006.00 -2.00 -0.2%
Objects
01 Salaries and Wages $ 79,037,552 $ 84,893,449 $ 90,733,508 $ 5,840,059 6.9%
02 Technical and Spec. Fees 1,453,840 1,931,055 2,131,184 200,129 10.4%
03 Communication 708,957 713,015 728,627 15,612 2.2%
04 Travel 200,193 76,828 70,060 -6,768 -8.8%
06 Fuel and Utilities 557,246 474,446 573,966 99,520 21.0%
07 Motor Vehicles 1,741,429 1,412,523 1,541,218 128,695 9.1%
08 Contractual Services 14,111,261 23,009,623 21,256,062 -1,753,561 -7.6%
09 Supplies and Materials 1,010,092 1,222,405 1,133,678 -88,727 -7.3%
10 Equipment – Replacement 1,114,042 1,303,935 1,507,273 203,338 15.6%
11 Equipment – Additional 142,208 275,127 84,937 -190,190 -69.1%
12 Grants, Subsidies, and Contributions 8,397,450 14,252,325 12,164,963 -2,087,362 -14.6%
13 Fixed Charges 4,564,422 4,740,278 4,909,566 169,288 3.6%
14 Land and Structures 4,614,109 9,700,000 14,500,000 4,800,000 49.5%
Total Objects $ 117,652,801 $ 144,005,009 $ 151,335,042 $ 7,330,033 5.1%
Funds
01 General Fund $ 36,268,233 $ 33,699,997 $ 34,239,093 $ 539,096 1.6%
03 Special Fund 48,643,221 69,870,185 78,188,497 8,318,312 11.9%
05 Federal Fund 28,766,477 35,219,503 34,743,807 -475,696 -1.4%
09 Reimbursable Fund 3,974,870 5,215,324 4,163,645 -1,051,679 -20.2%
Total Funds $ 117,652,801 $ 144,005,009 $ 151,335,042 $ 7,330,033 5.1%
Note: The fiscal 2015 working appropriation does not include January 2015 Board of Public Works reductions and deficiencies. The
fiscal 2016 allowance does not reflect contingent or across-the-board reductions.
U0
0A
– D
epa
rtmen
t of th
e En
viron
men
t
Appen
dix
5

An
alysis o
f the F
Y 2
016 M
aryla
nd E
xecu
tive Bu
dget, 2
015
32
Fiscal Summary
Department of the Environment
FY 14 FY 15 FY 16 FY 15 - FY 16
Program/Unit Actual Wrk Approp Allowance Change % Change
01 Office of the Secretary $ 2,425,708 $ 2,209,842 $ 2,541,369 $ 331,527 15.0%
02 Administrative and Employee Services Admin. 8,343,789 8,763,549 9,135,909 372,360 4.2%
04 Water Management Administration 29,331,915 31,567,722 32,124,711 556,989 1.8%
05 Technical and Regulatory Services Administration 11,554,904 13,266,330 13,394,697 128,367 1.0%
06 Land Management Administration 26,633,713 34,268,147 35,163,299 895,152 2.6%
07 Air and Radiation Management Administration 18,485,766 19,868,018 20,649,218 781,200 3.9%
10 Coordinating Offices 20,877,006 34,061,401 38,325,839 4,264,438 12.5%
Total Expenditures $ 117,652,801 $ 144,005,009 $ 151,335,042 $ 7,330,033 5.1%
General Fund $ 36,268,233 $ 33,699,997 $ 34,239,093 $ 539,096 1.6%
Special Fund 48,643,221 69,870,185 78,188,497 8,318,312 11.9%
Federal Fund 28,766,477 35,219,503 34,743,807 -475,696 -1.4%
Total Appropriations $ 113,677,931 $ 138,789,685 $ 147,171,397 $ 8,381,712 6.0%
Reimbursable Fund $ 3,974,870 $ 5,215,324 $ 4,163,645 -$ 1,051,679 -20.2%
Total Funds $ 117,652,801 $ 144,005,009 $ 151,335,042 $ 7,330,033 5.1%
Note: The fiscal 2015 working appropriation does not include January 2015 Board of Public Works reductions and deficiencies. The
fiscal 2016 allowance does not reflect contingent or across-the-board reductions.
U0
0A
– D
epa
rtmen
t of th
e En
viron
men
t
Appen
dix
6