uae economic report 2019 - .net framework
TRANSCRIPT

1January 02, 2019
ECONOMICS
UNITED ARAB EMIRATES
JANUARY 02, 2019
TABLE OF CONTENTS
CONTACTS
Research
Marwan S. Barakat
(961-1) 977409
Jamil H. Naayem
(961-1) 977406
Salma Saad Baba
(961-1) 977346
Fadi A. Kanso
(961-1) 977470
Gerard H. Arabian
(961-1) 964047
Farah N. Nahlawi
(961-1) [email protected]
Executive Summary 1
Introduction 2
Economic Conditions 3
Real Sector 3
External Sector 7
Public Sector 8
Financial Sector 9
Concluding Remarks 17
The UAE Economic Report can be accessed via internet at the following web address: http://www.bankaudigroup.com
UAE ECONOMIC REPORTSUBSTANTIAL POLICY SUPPORT OFFSETTING INTERNAL AND EXTERNAL HEADWINDS
• Economy weathering well the oil price environment: The economy of the United Arab Emirates has been adapting well to the relatively low oil price environment. A gradual recovery in non-oil activity is underway. With oil production and government spending on the rise, overall growth strength strengthened to 2.9% in 2018. Given the large fiscal buffers, ample spare capacity and rising investment needs for Expo 2020, the government has appropriately switched to providing stimulus to the economy. Such macro drivers, hinging over the use of counter-cyclical measures to support economic activity, helped offset the spillover effects of weak economic activity in neighboring countries and the rift with Qatar, in addition to the adverse effects of a strengthening US dollar.
• Reinforced overall external position supported by oil price recovery in 2018Merchandise exports (oil and non-oil sectors) are estimated to have picked up by 8% on a yearly basis, to reach US$ 333 billion in 2018, supported by the relative recovery in oil prices. In parallel, merchandise imports are estimated to have increased by 3% year-on-year, to reach US$ 236 billion in 2018. The estimated solid rise in UAE’s trade surplus in 2018, coupled with a moderate widening in deficits at the level of services and current transfers’ accounts, is likely to have resulted into a widening in the current account surplus from 6.9% of GDP in 2017 to an estimated 8.6% of GDP in 2018.
• Improving fiscal stance shifting the fiscal deficit to a surplus in 2018 The steady improvement in the UAE’s fiscal position following conservative fiscal reforms in the wake of previous declines in oil prices in the past few years along with the recent introduction of VAT and the improvement in oil prices in 2018, has put the fiscal position on a more sustainable footing over the year. As such, the increase in oil revenues along with a rise in non-oil revenues have more than offset the moderate increase in government spending, therefore shifting the modest fiscal deficits of the past three years to an estimated surplus of around 1% of GDP in 2018.
• Contained inflation rates along with continuous monetary policy tightening The year 2018 was marked by contained inflation rates in the UAE, contractions in the Central Bank’s gross international reserves, mixed year-to-date changes in monetary aggregates, and further monetary policy tightening in line with the US Federal Reserve interest rate hikes, as the UAE dirham remained pegged to the US dollar.
• Banking activity growth picks up in an ameliorated domestic macroeconomic environment The UAE banking sector has had a more favorable year during 2018 with economic activity picking up notably on the back of higher oil prices. This translated into accrued liquidity and ensuing higher deposit growth (especially on behalf of the public sector) along with renewed lending growth. Measured by the aggregated assets of banks operating in the emirates, sector activity grew by 6.0% in the first 11 months of 2018 as per the preliminary figures of the Central Bank of the UAE to reach the equivalent of US$ 777 billion at end-November. The volume increase represents a 70% markup relative to the similar period of 2017 increase.
• Activity in UAE capital markets tilted to the downside in 2018 Activity in the UAE capital markets was mainly tilted to the downside in 2018, mainly weighed down by a widespread sell-off mood in emerging markets, fears of a global economic slowdown, a sustained gradual US monetary policy tightening, lingering geopolitical concerns and a real estate market slump in the UAE. As to credit ratings, Standard & Poor’s affirmed at end-November Abu Dhabi’s “AA/A-1+” long-term and short-term foreign and local currency sovereign credit ratings, with “stable” outlook. Also, Fitch affirmed in November Abu Dhabi’s long-term foreign currency IDR at “AA” with a “stable” outlook.
Bank Audi sal - Group Research Department - Bank Audi Plaza - Bab Idriss - PO Box 11-2560 - Lebanon - Tel: 961 1 994 000 - email: [email protected]

2January 02, 2019
ECONOMICS
UNITED ARAB EMIRATES
JANUARY 02, 2019
UAE ECONOMIC PERFORMANCE
Sources: IMF, Bank Audi’s Group Research Department
The economy of the United Arab Emirates has been adapting well to the relatively low oil price
environment. A gradual recovery in non-oil activity is underway. With oil production and government
spending on the rise, overall growth strength strengthened to 2.9% in 2018. Given the large fiscal buffers,
ample spare capacity and rising investment needs for Expo 2020, the government has appropriately
switched to providing stimulus to the economy.
Such macro drivers, hinging over the use of counter-cyclical measures to support economic activity,
helped offset the spillover effects of weak economic activity in neighboring countries and the rift with
Qatar, in addition to the adverse effects of a strengthening US dollar. In parallel, the real estate market
continues to face headwinds due to oversupply especially given the tapering in expatriate population
growth, higher interest rates and stronger exchange rate via the dollar peg.
At the external level, a net improvement was recorded in 2018. The current account surplus exceeded
8.6% of GDP over the year, mainly driven by higher oil prices, against 6.9% the previous year. As such, the
current account surplus reported its highest level since 2014 (prior to the oil price collapse), when the
surplus had reached 13.5% of GDP. Subsequently, the ratio of exports to imports rose from 134.6% in 2017
to 141.1% in 2018 (against 146.2% in 2014).
At the fiscal level, the general government fiscal balance moved from a deficit of 1.6% of GDP in 2017 to
a surplus of 0.6% of GDP in 2018. This was realized within the context of a rise in government revenues
to GDP from 28.8% in 2017 to 29.7% in 2018, while government expenditures to GDP contracted from
30.4% in 2017 to 29.2% in 2018. The sizeable fiscal consolidation post-oil price collapse and the recent
improvement in non-oil revenues has put the fiscal stance on more sustainable footing over the medium
term. With a public debt of US$ 77 billion in 2018, public debt to GDP stood at 17.8% (19.7% in 2017),
which corresponds to one of the lowest indebtedness levels in emerging markets.
At the monetary level, inflation closed the year at circa 3.5% (2.0% in 2017) owing to the introduction of
the value added tax. It is worth mentioning that Broad Money supply growth was almost nil in 2018 (even
contracting slightly by 0.8%) for the first time in decades. Further increases in policy rates took place, in
line with US Fed moves. It is yet worth noting that a tighter monetary policy, in the context of the pegged
exchange rate, offsets some of the gains from an expansionary fiscal stance.
At the banking level, higher all prices have supported the sector, with improved liquidity, adequate
capitalization and strengthening demand for credit. The loans to deposits ratio declined in recent months
as growth in deposits (6.9% over the first 11 months) surpassed growth in credits (4.6% over the same
period). The acceleration in deposits growth was mainly tied to the substantial increase in government
deposits in the banking system. Net interest margins continue to improve, as loans reset at higher rates
and funding costs improved as liquidity conditions relatively eased.
At the capital markets level, the various domestic equity and fixed income markets performed unevenly.
While the Dubai Stock Market reported a contraction in its Price Index by 20.8% over the first 11 months
of 2018, the Abu Dhabi Stock Market reported an increase in its Price index by 8.4% over the period. The

3January 02, 2019
ECONOMICS
UNITED ARAB EMIRATES
JANUARY 02, 2019
5-year CDS spreads, a measure of the market perception of sovereign risks, remained relatively stable
in both markets in 2018, reporting 69 bps for Abu Dhabi and 125 bps for Dubai. It is worth mentioning
that UAE authorities have made progress towards deepening financial markets, including the recently
approved law on issuing sovereign debt by the federal government.
The in-depth developments in the real sector, external sector, public sector and financial sector of the
economy are detailed in the forthcoming sections. The concluding remarks are left to the outlook of the
UAE economy looking ahead.
1. ECONOMIC CONDITIONS
1.1. REAL SECTOR
1.1.1. Hydrocarbons Sector
Hydrocarbons sector recovers in 2018 amidst notable expansion in global oil prices
Despite consistent efforts to diversify the UAE economy, the contribution of the hydrocarbons sector is
anticipated to have increased in 2018 mainly due to higher oil prices. As a matter of fact, hydrocarbon
exports out of total exports rose from 18.8% in 2017 to an estimated 22.8% in 2018. Moreover, the
country’s hydrocarbons sector recovered as real oil GDP growth jumped from a contraction of 3.0% in
2017 to a growth of 2.3% in 2018.
Oil prices rose on average this year supported by the gaps left in the market by Iran, despite the
unwinding of the OPEC+ production cut deal. Brent crude oil prices expanded by 28.2% in 2018, against
a slight rise of 3.1% in 2017. On the supply side, crude oil production is estimated to rise by 2.4% in 2018,
with production expected to further rise by 2.3% in 2019. It is worth noting that the UAE has the fourth-
highest petroleum production in OPEC behind Saudi Arabia, Iraq and Iran.
Thus, the UAE would experience small but sustained growth in oil output driven by field expansion and
enhanced oil recovery techniques. Austria’s OMV reported the start-up of production at the Umm Lulu
and Satah al Razbot fields in Abu Dhabi. The company is targeting production of 129,000 b/d by end-
2018, with the latter to rise to 215,000 b/d by 2023. Moreover, the Minister of Energy indicated that the
UAE is targeting 500,000 b/d of additional production by the end of the year. That being said, there is an
CRUDE OIL & NATURAL GAS PRICES
Sources: Bloomberg, Bank Audi’s Group Research Department
OIL & GAS PRODUCTION
Sources: British Petroleum, Bank Audi’s Group Research Department

4January 02, 2019
ECONOMICS
UNITED ARAB EMIRATES
JANUARY 02, 2019
incentive to bring additional barrels to online production, with the unwinding of the OPEC+ production
cut deal and gaps left in the market by Iran.
According to the US Energy Information Administration (EIA), the UAE holds the seventh-largest proved
reserves of oil in the world at 96.6 billion barrels, with most of the reserves located in Abu Dhabi
(approximately 96% of the UAE’s total) followed by Dubai, Sharjah and Ras al-Khaimah. The UAE holds
approximately 6% of the world’s proved oil reserves. The majority of acreage, both onshore and offshore,
is relatively well explored and recent drilling yielded significant discoveries.
Moving on to oil consumption, it is expected to remain strong in the UAE despite ongoing fuel price
deregulation. This is due to sustained weakness in international fuels prices, increased vehicle sales and
strong growth in the energy-intensive industrial sectors. For instance, the consumption of refined fuel
products is set to rise by 2.5% year-on-year in 2018, in barrels of oil equivalent.
As for the country’s gas sector, the UAE plans to boost domestic natural gas production over the next
several years to help meet growing internal demand. In fact, gas consumption is expected to rise by 2.0%
in 2018, against a growth rate of 3.5% in 2017. Currently, the power sector accounts for the majority of
gas consumption in the UAE, representing more than 98% of total electricity generation, as per Fitch.
However, a growing role for nuclear and, to a lesser extent, renewables would see the share of gas fall
from 2020 and onwards to reach 70.5% by 2027.
With regards to gas reserves, the UAE holds 209.7 trillion cubic feet of gas of natural gas reserves, according
to the latest BP Statistical Review of World Energy. Nonetheless, despite its large endowment, the UAE
has been a net importer of natural gas since 2008 because of increased demand. This is mainly due to a
process where natural gas is injected into its oil fields as part of EOR techniques and the country’s rapidly
expanding electricity grid, as per Fitch. Natural gas has become a key strategic priority and the UAE is
planning a string of new investments to further develop its large sour gas resources and meet rising
domestic consumption.
Last but not least, the UAE’s commitment to diversification is displayed via a set of clear goals for
encouraging diversified and knowledge-based growth. A comprehensive strategy has been put in place
to encourage FDI outside free zones and energy sectors, and expand non-bank and capital market
financing options for SMEs. However, while the UAE has reported rapid growth in the non-oil sector,
progress towards diversification has remained limited and the country should continue its targetted
diversificationefforts.
1.1.2. Non-Hydrocarbons Sector
Real Estate and Construction
Real estate and construction sector report weaker performance
The real estate and construction sector continued to contribute to the country’s diversification strategy,
despite reporting a weaker performance in most of its branches.
In Abu Dhabi, the residential rents and sales prices continued to decrease while the vacancies are
increasing. This comes along subdued demand as a result of job losses and cuts in housing allowances.
Apartment rents declined by 6% year-on-year in the third quarter of 2018. With more completions
materializing, residential vacancies are expected to rise, leading to further rental declines. On a similar
note, the sales market performance continued to soften with average prices of villas reporting a 14%
decline year-on-year and those of apartments registering an annual 12% fall.
Abu Dhabi’s office market slowed down over the course of the year. Around 3.7 million square meters
worth of Gross Leasable Area (GLA) were added to the market in the first three quarters of 2018. Headline
rentals for both Grade A and B fell by 3.5% and 12.6% in the third quarter 2018, compared to the past year.
Demand remained limited, with some companies downsizing to smaller units, as per Jones Lang Lasalle
(JLL).

5January 02, 2019
ECONOMICS
UNITED ARAB EMIRATES
JANUARY 02, 2019
As for the retail space, supply rose from 2.6 million square meters of GLA in 2017 to around 2.7 million in
2018. Rents declined by 12% year-on-year in the third quarter of 2018, while vacancy rates increased from
2% in the third quarter of 2017 to 15% in the same quarter of 2018.
In Dubai’s residential market, sales and rent prices continued to decrease for both apartments and villas.
Apartment prices declined by 7% year-on-year in the third quarter of 2018, while those of villas retreated
by 8%. According to Dubai Land Department, the total value of sales transactions excluding land stood
at AED 12.3 billion up till the third quarter of 2018, which stands for a decline of 32% compared to the
same period of 2017.
According to JLL, the office market is moving in favor of the tenants as landlords continue to offer more
attractive terms. Vacancy rates rose from 8% in the third quarter of 2017 to 10% in the same quarter of
2018. Rents reported a yearly decline of 13% in the third quarter of 2018.
The retail market continued performing on its softer end. Rents in super regional and regional malls
declined by 19% year-on-year and 17% respectively. Market wide vacancies rose from 12% in the third
quarter of 2017 to 16% in the third quarter of 2018.
In conclusion, the real estate sector in the UAE is clearly encountering a relative slowdown. Prices and
rents are declining in both Abu Dhabi and Dubai’s properties as a result of oversupply of spaces and
subdued demand.
Transport
Transport sector benefiting from preparations for Dubai Expo 2020 and higher oil prices
Fueled by preparations for the Dubai Expo 2020 and higher oil prices, the UAE’s transport sector continues
making strides. With economic diversification a key objective of the government, the UAE is further
cementing its spot as a regional transport hub.
It is worth noting that the UAE benefits from one of the most attractive business environments for transport
infrastructure, reinforced by robust opportunities across the sector, its safe operating environment, and
openness to private sector involvement. Another factor that supports the transport sector is an expected
improvement in economic growth in the UAE over the coming years, as rising oil prices spur improvements
in business and consumer confidence. As a matter of fact, the country signed deals worth more than US$
50 billion in the infrastructure sector in October 2018, with the deals including transport projects.
As for the UAE’s airports subsector, it has been at the core of the transport sector, as the market saw
robust growth in freight volumes. A total of US$ 23.2 billion was earmarked by the government of the
UAE relating to air transport infrastructure in a bid to increase capacity to serve more than 300 million
passengers per annum, according to Fitch. The key investments in the pipeline included the US$ 8 billion
development at Al Maktoum International Airport, the US$ 7.6 billion expansion of the Phase IV of Dubai
International Airport, and the US$ 6.8 billion set aside for the re-development of Abu Dhabi International
Airport. In parallel, by the end of 2018, it is predicted that the combined fleet size of the four UAE airlines
would reach 525.
Moving on to the ports subsector, the country’s port infrastructure was at the forefront of its diversification
strategy, with the world class port facilities available allowing it to take advantage of its location on one of
the world’s major trade routes between Europe and Asia. It is worth noting that strong international trade
connectivity results in highly efficient export and import lead times, ensuring that the country would
remain an attractive prospect to investors. In terms of projects, Abu Dhabi’s National Marine Dredging
Company (NMDC) said that it was awarded a US$ 268 million contract for the expansion of Khalifa Port
in the UAE capital. On completion, its total annual capacity would reach 5.6 million vessels. The Khalifa
Port’s free zone includes around 40 companies in different business segments, such as industrial and
commercial businesses.
6January 02, 2019
ECONOMICS
UNITED ARAB EMIRATES
JANUARY 02, 2019
Last but not least, the expansion of UAE’s rail network would be a major driver of construction industry
growth, driven by investment into major rail links, particularly expansion of the Dubai Metro. The rail
network would result in a loss of market share by other freight modes, especially road freight. Nevertheless,
road would remain the dominant freight mode over the medium term in terms of tonnage carried, and air
freight would see the highest growth as domestic demand drives the import of more valuable goods. The
country’s rail network is to more than triple in length with the announcement of plans to extend services
from the border with Saudi Arabia to Fujairah.
Tourism
Tourism remains a pillar in UAE’s diversification strategy
The UAE has a flourishing and dynamic tourism industry. This comes as the country benefits from the
strong economic diversification strategy, continuous investment initiatives in capital and infrastructure
and the government strategies in promoting the country to a wider regional and international audience.
Tourism and travel sector in the UAE accounted for 11.3% of the country’s GDP in 2017, which is equivalent
to more than AED 154 billion (US$ 41.9 billion), according to a report from the World Travel and Tourism
Council.
The share is expected to increase by up to 4.9% by the end of 2018, accompanied by a compounded
annual growth rate (CAGR) of 3.9% until 2028, according to the Emirati Economic Ministry. The report also
pointed out that the sector accounted for 9.5% of the country’s labor market in 2017, with expectations
of a 3.2% increase this year or up to 604,500 jobs.
Meanwhile, the expected spending of visitors for this year is forecasted to increase by 5.3% this year,
surpassing the AED 123.5 billion posted in 2017. Tourism investments in the country reached AED 25.4
billion in 2017 or the equivalent of 8% of the total investments in the country.
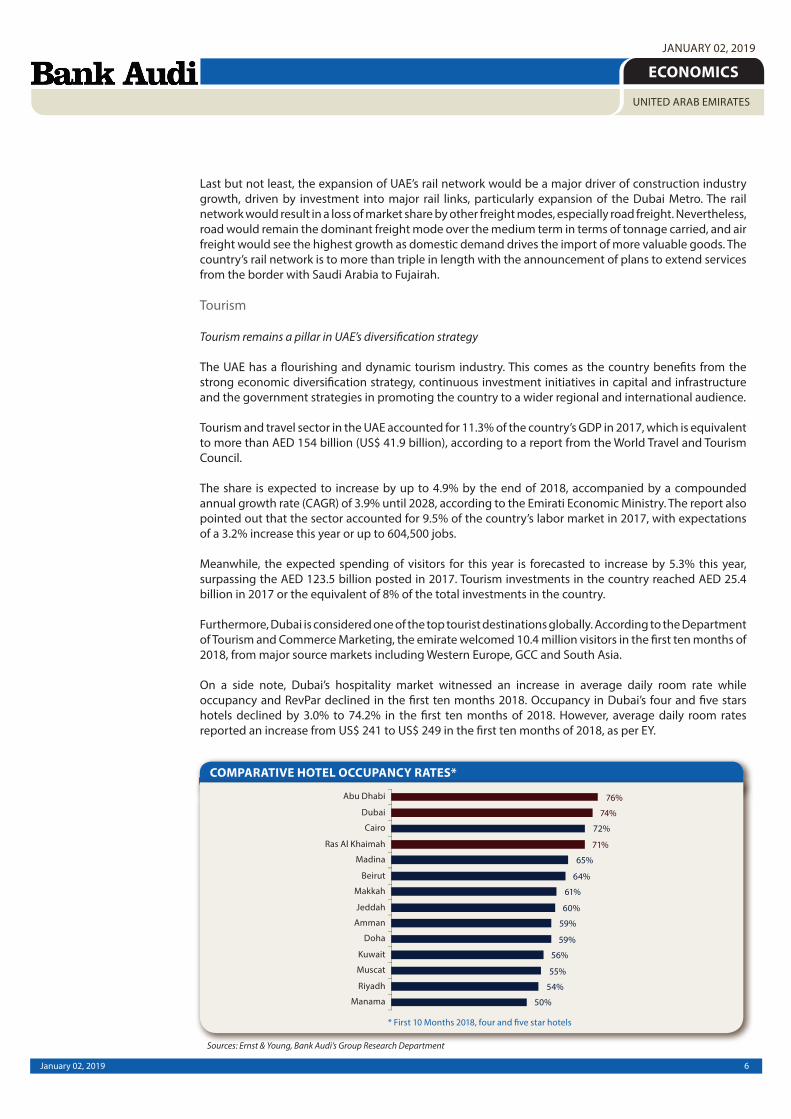
Furthermore, Dubai is considered one of the top tourist destinations globally. According to the Department
of Tourism and Commerce Marketing, the emirate welcomed 10.4 million visitors in the first ten months of
2018, from major source markets including Western Europe, GCC and South Asia.
On a side note, Dubai’s hospitality market witnessed an increase in average daily room rate while
occupancy and RevPar declined in the first ten months 2018. Occupancy in Dubai’s four and five stars
hotels declined by 3.0% to 74.2% in the first ten months of 2018. However, average daily room rates
reported an increase from US$ 241 to US$ 249 in the first ten months of 2018, as per EY.
COMPARATIVE HOTEL OCCUPANCY RATES*
Sources: Ernst & Young, Bank Audi’s Group Research Department

7January 02, 2019
ECONOMICS
UNITED ARAB EMIRATES
JANUARY 02, 2019
Abu Dhabi’s hospitality market reported a decline in occupancy, average daily room rate and RevPAR of
its four and five star hotels. Occupancy rates declined by 2.0% year-on-year from 78.3% in the first ten
months of 2017 to 76.4% in the same period of 2018. Average daily room rate retreated from US$ 101 to
US$ 96 over the same period. Accordingly, the RevPAR fell from US$ 79 to US$ 73 in the first ten months
of 2018, an annual decrease of 7.9%.
In conclusion, the sector remains one of the pillars in the country’s diversification strategy. Despite the
decline in the performance of four and five star hotels, the sector’s share in the country’s GDP is growing
along with the number of visitors.
1.2. EXTERNAL SECTOR
Reinforced overall external position supported by oil price recovery in 2018
In 2018, the UAE continued its trade policy based on establishing an extensive network of commercial
partnerships and developing adequate infrastructure to support business activities, while maintaining
its trade liberalization policies and facilitating the movement of goods and services across borders. The
wise policy of economic diversification and building sustainable national industries helped save the UAE
status as a world trade hub. Within this context, indicators for the non-oil sector showed positive signs
after a slow start in 2018, but recovered thereafter and remained in steady expansionary territory. As
such, the country’s non-oil trade continued its steady demonstration, though stagnating over the first
half of 2018, as shown by the latest preliminary statistical data of the Federal Customs Authority (FCA)
which revealed that UAE general trade volume of non-oil amounted to US$ 213.5 billion during the first
half of 2018, almost unchanged when compared to the same period of 2017.
In details, the value of non-oil imports reached US$ 126.0 billion during the first half of 2018, down by
3.1% when compared to previous year’s corresponding period, according to the FCA which revealed that
native and semi-proceed gold came on top of the imported goods with 12% of the total, followed by
telephone equipment with 8%, cars with 6%, then ornaments and jewelry with 5%, followed by non-
compounded diamonds with almost 5% over the same period.
The value of UAE non-oil exports reached US$ 24.3 billion over the first half of 2018, unchanged when
compared to the same period of 2017, pointing out that gold came on top of these exports at a share of
24% of the UAE total exports, followed by the raw aluminum with 10%, then cigarettes & cigars with 6%,
and ornaments and jewelry with almost 6%. In addition, the UAE’s non-oil trade witnessed a significant
growth in the value of re-exports of 6.7% to reach US$ 63.2 billion during the period, reflecting the high
competitive advantage of the UAE product and the country’s position globally in the field of re-export of
goods and products.
Regarding the UAE trading partners map, the structure of trading partners has not changed significantly
during the first half of 2018, as the UAE has maintained its business relations with its strategic partners.
As such, the Asia and the Pacific region ranked first in terms of trade partners accounting for 41% of the
total non-oil trade in the UAE, while Europe came second with 23% of total, followed by the Middle East
HOTEL ROOM YIELD IN US$*
Sources: Ernst & Young, Bank Audi’s Group Research Department
AVERAGE HOTEL ROOM RATE IN US$*
Sources: Ernst & Young, Bank Audi’s Group Research Department

8January 02, 2019
ECONOMICS
UNITED ARAB EMIRATES
JANUARY 02, 2019
and North Africa (MENA) region with a share of 19%, the US and Caribbean region with 9% of total, and
East and Southern Africa with 3.9%, and finally West and Central Africa with a share of 3.8%. It is worth
mentioning that UAE is one of the leading countries in the world today in terms of the facilitation of
international trade, reaching advanced rankings in trade exchange as per the World Trade Organization
(WTO).
Within this context, total merchandise exports (oil and non-oil sectors) are estimated to have picked up
by 8% on a yearly basis, moving from US$ 309 billion in 2017 to US$ 333 billion in 2018, supported by
the recovery in oil prices between the two periods, as per the IIF. In parallel, total merchandise imports
are estimated to have increased by 3% year-on-year, to reach US$ 236 billion in 2018, up from US$ 229
billion in 2017. Accordingly, the UAE’s general trade surplus is estimated to have grown by 22% year-on-
year, to reach US$ 96 billion, which continues to ensure a major buffer against relative leakages from the
services and transfers accounts, as the performance in the services account has been less pronounced
because of the subdued economic activity in the region as well as the appreciation of the dirham in real
terms against emerging markets currencies. As such, the estimated solid rise in UAE’s trade surplus in
2018, coupled with a moderate widening in deficits at the level of services and current transfers’ accounts,
is likely to have resulted into a widening in the current account surplus from 6.9% of GDP in 2017 to an
estimated 8.6% of GDP in 2018, as per the IIF.
1.3. PUBLIC SECTOR
Improving fiscal stance shifting the fiscal deficit to a surplus in 2018
The steady improvement in the UAE’s fiscal position following conservative fiscal reforms in the wake of
persistent previous declines in oil prices in the past few years along with the recent introduction of VAT
and the improvement in oil prices in 2018, has put the fiscal position on a more sustainable footing over
the year. As such, the increase in oil revenues along with a rise in non-oil revenues have more than offset
the moderate increase in government spending, therefore shifting the modest fiscal deficits of the past
three years to an estimated surplus of around 1% of GDP in 2018.
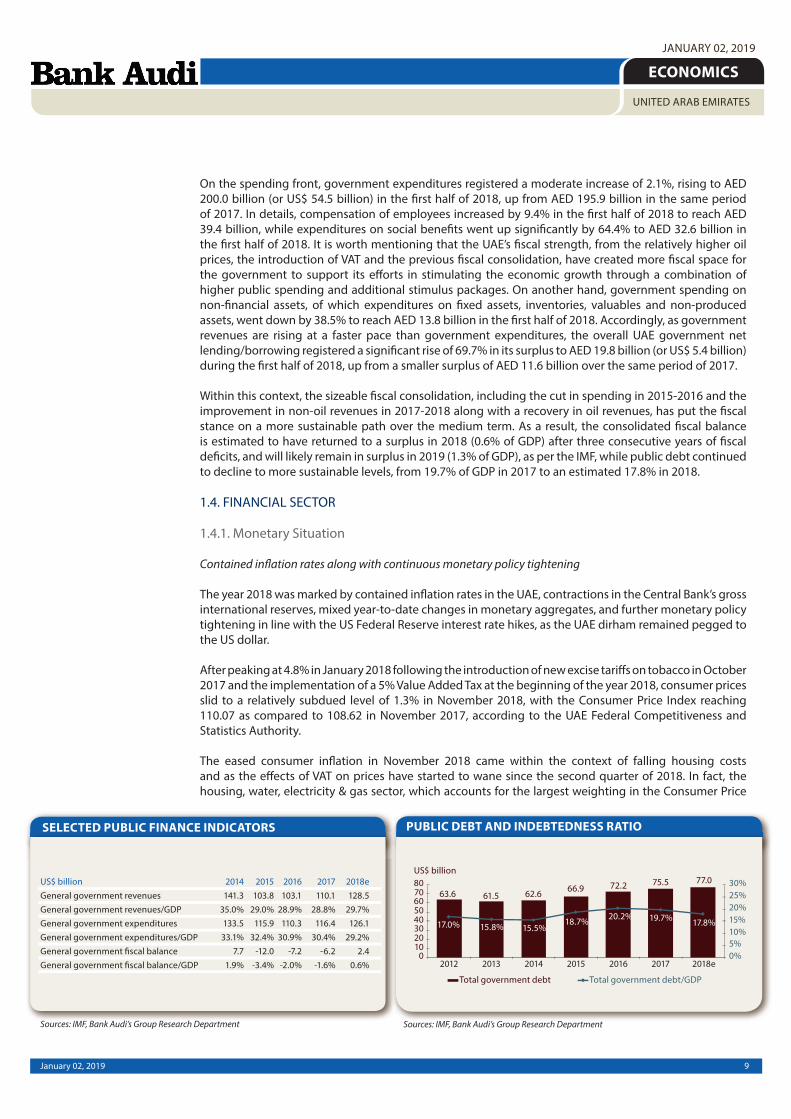
Going further into details, government revenues have registered an increase of 5.9% over the first half
of 2018, as per the Ministry of Finance, rising from AED 207.5 billion in the first half of 2017 to AED 219.8
billion (or US$ 59.8 billion) in the first half of 2018, as per the latest figures released. It is worth mentioning
that the implementation of VAT in the UAE in January 2018 marked a positive step towards revenue
diversification, providing the government with a new source of income which will be utilized to provide
high-quality public services, and also help the government to move towards its vision of reducing
dependence on oil and other hydrocarbons as a source of revenue. Within this context, tax revenues
increased by 3.2% over the first half of 2018, registering AED 92.1 billion compared to AED 89.2 billion in
the first half of 2017. As such, the IMF estimates general government revenues to have reached 29.7% of
GDP in 2018, up from 28.8% of GDP in 2017.
Sources: Central Bank of UAE, IIF, Bank Audi’s Group Research Department
FOREIGN SECTOR INDICATORS
9January 02, 2019
ECONOMICS
UNITED ARAB EMIRATES
JANUARY 02, 2019
On the spending front, government expenditures registered a moderate increase of 2.1%, rising to AED
200.0 billion (or US$ 54.5 billion) in the first half of 2018, up from AED 195.9 billion in the same period
of 2017. In details, compensation of employees increased by 9.4% in the first half of 2018 to reach AED
39.4 billion, while expenditures on social benefits went up significantly by 64.4% to AED 32.6 billion in
the first half of 2018. It is worth mentioning that the UAE’s fiscal strength, from the relatively higher oil
prices, the introduction of VAT and the previous fiscal consolidation, have created more fiscal space for
the government to support its efforts in stimulating the economic growth through a combination of
higher public spending and additional stimulus packages. On another hand, government spending on
non-financial assets, of which expenditures on fixed assets, inventories, valuables and non-produced
assets, went down by 38.5% to reach AED 13.8 billion in the first half of 2018. Accordingly, as government
revenues are rising at a faster pace than government expenditures, the overall UAE government net
lending/borrowing registered a significant rise of 69.7% in its surplus to AED 19.8 billion (or US$ 5.4 billion)
during the first half of 2018, up from a smaller surplus of AED 11.6 billion over the same period of 2017.
Within this context, the sizeable fiscal consolidation, including the cut in spending in 2015-2016 and the
improvement in non-oil revenues in 2017-2018 along with a recovery in oil revenues, has put the fiscal
stance on a more sustainable path over the medium term. As a result, the consolidated fiscal balance
is estimated to have returned to a surplus in 2018 (0.6% of GDP) after three consecutive years of fiscal
deficits, and will likely remain in surplus in 2019 (1.3% of GDP), as per the IMF, while public debt continued
to decline to more sustainable levels, from 19.7% of GDP in 2017 to an estimated 17.8% in 2018.
1.4. FINANCIAL SECTOR
1.4.1. Monetary Situation
Contained inflation rates along with continuous monetary policy tightening
The year 2018 was marked by contained inflation rates in the UAE, contractions in the Central Bank’s gross
international reserves, mixed year-to-date changes in monetary aggregates, and further monetary policy
tightening in line with the US Federal Reserve interest rate hikes, as the UAE dirham remained pegged to
the US dollar.
After peaking at 4.8% in January 2018 following the introduction of new excise tariffs on tobacco in October
2017 and the implementation of a 5% Value Added Tax at the beginning of the year 2018, consumer prices
slid to a relatively subdued level of 1.3% in November 2018, with the Consumer Price Index reaching
110.07 as compared to 108.62 in November 2017, according to the UAE Federal Competitiveness and
Statistics Authority.
The eased consumer inflation in November 2018 came within the context of falling housing costs
and as the effects of VAT on prices have started to wane since the second quarter of 2018. In fact, the
housing, water, electricity & gas sector, which accounts for the largest weighting in the Consumer Price
PUBLIC DEBT AND INDEBTEDNESS RATIO
Sources: IMF, Bank Audi’s Group Research Department
SELECTED PUBLIC FINANCE INDICATORS
Sources: IMF, Bank Audi’s Group Research Department
10January 02, 2019
ECONOMICS
UNITED ARAB EMIRATES
JANUARY 02, 2019
Index (34.1%), posted a yearly contraction of 5.33%, followed by the medical care sector with -0.16%.
All the remaining ten sectors in the Consumer Price Index witnessed yearly price increases in November
2018. For instance, the textiles, clothing and footwear sector saw a yearly price rise of 18.42%, followed
by the transportation sector (+8.80%), the recreation and culture sector (+8.28%), the tobacco sector
(+8.27%), the restaurants and hotels sector (+6.87%), the communications sector (+3.54%), the furniture
and household goods sector (+3.53%), the education sector (+2.46%), the food and beverages sector
(+1.83%), and the miscellaneous goods and services sector (+1.60%). Within this context, it is worth
mentioning that the IMF expects inflation to average 3.5% in 2018, up from 2.0% in 2017.
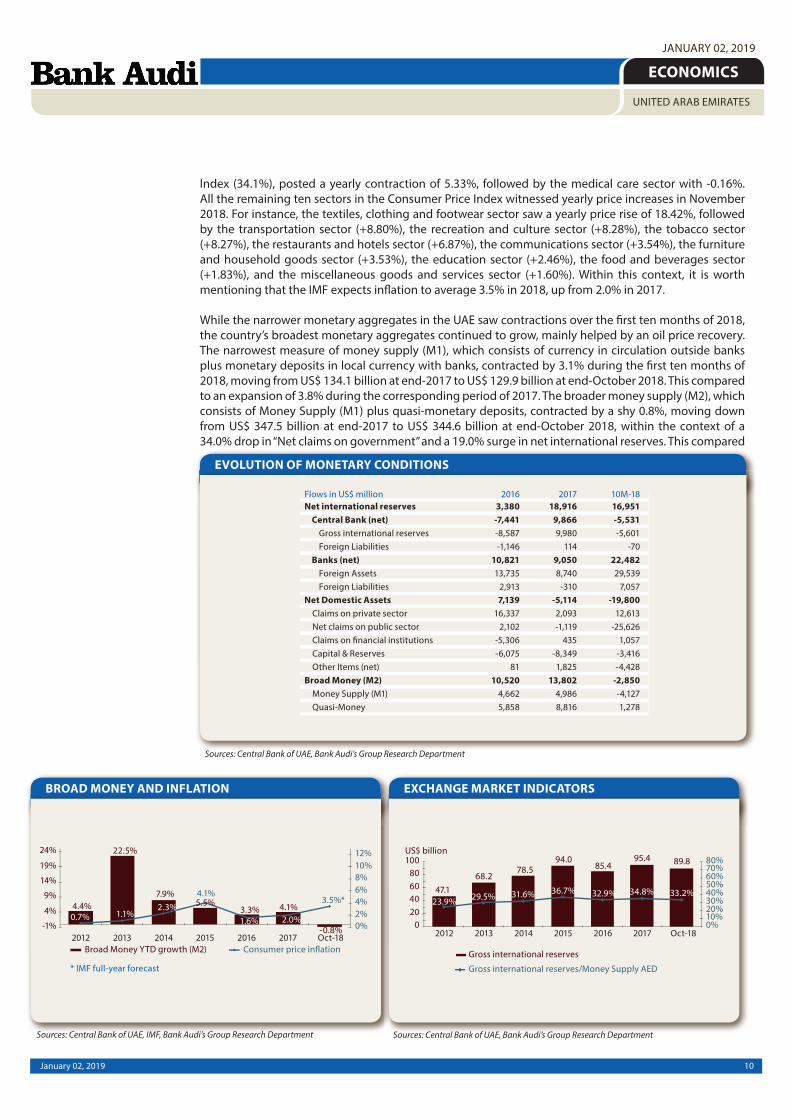
While the narrower monetary aggregates in the UAE saw contractions over the first ten months of 2018,
the country’s broadest monetary aggregates continued to grow, mainly helped by an oil price recovery.
The narrowest measure of money supply (M1), which consists of currency in circulation outside banks
plus monetary deposits in local currency with banks, contracted by 3.1% during the first ten months of
2018, moving from US$ 134.1 billion at end-2017 to US$ 129.9 billion at end-October 2018. This compared
to an expansion of 3.8% during the corresponding period of 2017. The broader money supply (M2), which
consists of Money Supply (M1) plus quasi-monetary deposits, contracted by a shy 0.8%, moving down
from US$ 347.5 billion at end-2017 to US$ 344.6 billion at end-October 2018, within the context of a
34.0% drop in “Net claims on government” and a 19.0% surge in net international reserves. This compared
Sources: Central Bank of UAE, Bank Audi’s Group Research Department
EVOLUTION OF MONETARY CONDITIONS
Sources: Central Bank of UAE, Bank Audi’s Group Research DepartmentSources: Central Bank of UAE, IMF, Bank Audi’s Group Research Department
BROAD MONEY AND INFLATION EXCHANGE MARKET INDICATORS

11January 02, 2019
ECONOMICS
UNITED ARAB EMIRATES
JANUARY 02, 2019
to a 1.5% expansion in (M2) over the first ten months of 2017. On the other hand, the money supply in its
broadest sense (M3), which consists of Money Supply (M2) plus government deposits, expanded by 5.3%
during the first ten months of 2018, moving from US$ 404.9 billion at end-2017 to US$ 426.4 billion at
end-October 2018 due to a 42.3% surge in government deposits to reach US$ 81.7 billion at end-October
2018 amid an oil price rebound. This followed a 4.0% expansion in (M3) during the same period of 2017.
The Central Bank of the UAE started mid-April 2018 implementing new EIBOR regulations, under which
Thomson Reuters Ltd has been appointed as the calculation agent, while the Central Bank has been
assigned the role of an administrator for EIBOR, and banks would be responsible for recording the factors,
adjustments and other considerations used to determine rate submissions, in a move aiming at enhancing
transparency in the rate submission process and sustaining the benchmark’s credibility. EIBOR, which is
the daily reference rate at which the panel banks are able to access UAE dirham funding in reasonable
market size for a given tenor from the UAE money market, saw increases across all its maturities ranging
from overnight to one-year over the year 2018, mainly mirroring the US Federal Reserve tight monetary
policy. The six-month EIBOR category recorded the largest expansion of 97 bps over the first eleven
months of 2018, moving from 2.07% at end-December 2017 to 3.04% at end-November 2018, followed by
the twelve-month category with +92 bps, the three-month category (+87 bps), the one-month category
(+79 bps), the one-week category (+75 bps) and the overnight category (+62 bps).
In parallel, key interest rates in Emirates continued to closely track US interest rate movements, given the
UAE dirham peg to the US dollar at 3.6725. The Central Bank of the UAE lifted the repo rate for borrowing
short-term liquidity from the UAE Central Bank against Certificates of Deposit four times over the year
2018 by a cumulative of 100 bps to reach currently 2.75%. It also raised the interest rates applied to the
issuance of its Certificates of Deposit four times over the year 2018 by a total of 100 bps to 3.00%.
Last but not least, the Central Bank’s gross international reserves contracted by 5.9% over the first ten
months of 2018, moving from US$ 95.4 billion at end-December 2017 to US$ 89.8 billion at end-October
2018, mainly due to a 34.6% drop in held-to-maturity foreign securities, with the latter moving from US$
23.0 billion at end-2017 to US$ 15.0 billion at end-October 2018. Accordingly, the Central Bank’s gross
international reserves coverage ratio to money supply (M1) and dirham deposits reached 33.2% at end-
October 2018, down from 34.8% at end-December 2017.
Looking forward, inflationary pressures are projected to ease in 2019, given the fading impact of the 5%
Value Added Tax and due to falling housing costs amid an increase in the housing supply and some expat
layoffs, while monetary conditions would continue to track US tightening cycle within the context of the
peg to the US dollar.
1.4.2. Banking Activity
Activity growth picks up in an ameliorated domestic macroeconomic environment
The UAE banking sector has had a more favorable year during 2018 with economic activity picking up
notably on the back of higher oil prices. This translated into accrued liquidity and ensuing higher deposit
growth (especially on behalf of the public sector) along with renewed lending growth. Measured by the
aggregated assets of banks operating in the emirates, sector activity grew by 6.0% in the first 11 months
of 2018 as per the preliminary figures of the Central Bank of the UAE to reach the equivalent of US$ 777.2
billion at end-November. The volume increase represents a 70% markup relative to the similar period of
2017 increase.
On the funding side, the major component accounting for more than 60% of banks’ total balance sheets,
i.e. deposits parked at UAE banks, saw an acceleration of growth year-on-year. Their growth rate moved
from 4.4% in the first 11 months of 2017 to 6.9% in the first 11 months of this year, in line with the rise
in oil prices and enhancement of macroeconomic activity at large in the emirates during 2018. Deposits
parked at banks in the UAE actually reached US$ 473.5 billion at end-November 2018 and proved to be a
major contributor to total sector activity growth during the year.

12January 02, 2019
ECONOMICS
UNITED ARAB EMIRATES
JANUARY 02, 2019
The latest figures disclosed on the breakdown of bank deposits covering the first ten months of 2018
shows that the bulk of deposit growth is attributed to the resident sector, leaving a 23% contribution to
the non-resident sector which got its deposits lifted up the most by governments and non-commercial
entities. As to the resident sector, the government accounted for the bulk of resident deposit growth
during the first ten months of 2018, followed by retail deposits. It is worth noting that generally speaking,
higher oil prices pull up revenues of large bank depositors in the emirates, notably the public sector.
Banks funding is generally solid and centered around stable resources mainly deposits and equity,
even though this is to some extent moderated by high depositor concentration (mainly large public
sector entities and corporates) and the maturity mismatch of credit and deposits. Banks are in fact well
capitalized with their capital and reserves growing by a further 4.8% so far in 2018 to attain 12.4% of total
assets. The growth in equity took their capital adequacy ratio to 18.2% at end-September 2018 (above
Central Bank minimum requirements) as per the latest Central Bank disclosures, of which the bulk in the
form of Tier 1 capital (Tier 1 ratio of 16.8%), thus constituting strong capital buffers against potential risks.
On the asset utilization side, a major contributor to activity growth accounting for 58% of total balance
sheets of banks, i.e. gross credit, managed to rise by 4.6% between December 2017 and November 2018
to reach the equivalent of US$ 450.2 billion at end-November. This represents a 78% increase in volume
growth when compared to the same period of 2017, in line with the improvement in macroeconomic
perspectives for the UAE and reflecting the accrued liquidity at hand for UAE banks.
Around 80% of the increase in gross credit over the covered period of 2018 was accounted for by domestic
credit, with the private sector getting the lion’s share of domestic credit (77% of new domestic credits,
mostly businesses and industrial sector credit). The government sector got 26% of new domestic credit
so far this year. The foreign sector obtained 20% of gross credit, noting that some of the UAE’s biggest
banks are looking outside the domestic market to make up for the relatively contained credit growth in
the UAE as the country recovers from a couple of years of slow economic growth.
Bank liquidity conditions in the UAE have improved during the year 2018. On the one hand, the lending to
stable resources ratio, measured as the ratio of total advances (net lending and net financial guarantees
& standby LC and interbank placements more than three months) to the sum of net free capital funds
and total other stable resources, has declined from 84.5% at end-2017 to a multi-year-end low of 82.9%
at end-November 2018. On the other hand, the ELAR ratio (eligible liquid assets ratio), measured as the
ratio of total banks’ eligible liquid assets (consisting of cash at hand, liquid assets at the Central Bank and
eligible bonds/Sukuks as prescribed by regulation 33/2015 & Basel Principles but excluding interbank
positions) to total assets (balance sheet total assets minus sum of capital & reserves and all provisions
except staff benefit provisions and refinancing and subordinated borrowing/deposits) stood at a decent
17.0% at end-November 2018 albeit slightly lower than the 18.3% registered at end-2017. It is worth
noting in this respect that banks’ reserves at the Central Bank declined by 2.7% in 11M2018 on the back
of a 6.9% contraction in Certificates of Deposit held by banks.
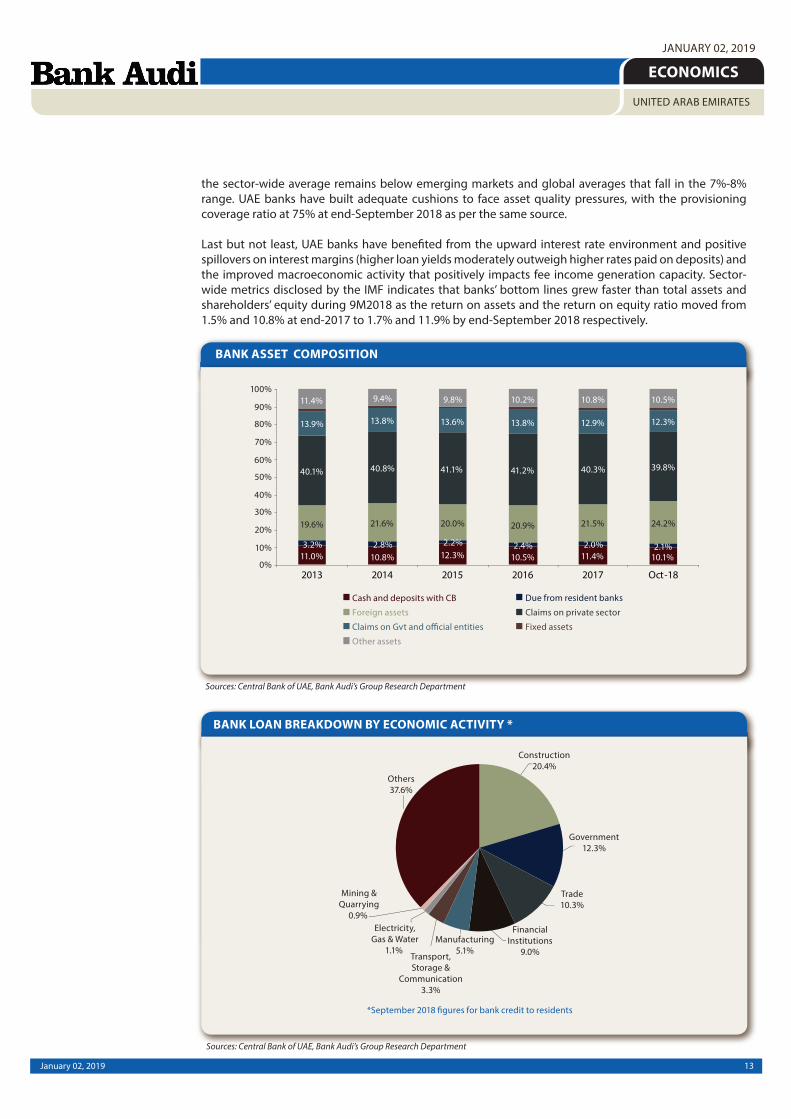
In parallel, UAE banks continue to post adequate asset quality metrics. It is true that the non-performing
loans to total loans ratio inched up from 6.4% at end-2017 to 6.8% at end-September 2018 as per the latest
IMF data, but this rise remains contained and follows a couple of years of slow economic activity. Besides,
Sources: Central Bank of UAE, Bank Audi’s Group Research Department
EVOLUTION OF BANKING AGGREGATES
13January 02, 2019
ECONOMICS
UNITED ARAB EMIRATES
JANUARY 02, 2019
the sector-wide average remains below emerging markets and global averages that fall in the 7%-8%
range. UAE banks have built adequate cushions to face asset quality pressures, with the provisioning
coverage ratio at 75% at end-September 2018 as per the same source.
Last but not least, UAE banks have benefited from the upward interest rate environment and positive
spillovers on interest margins (higher loan yields moderately outweigh higher rates paid on deposits) and
the improved macroeconomic activity that positively impacts fee income generation capacity. Sector-
wide metrics disclosed by the IMF indicates that banks’ bottom lines grew faster than total assets and
shareholders’ equity during 9M2018 as the return on assets and the return on equity ratio moved from
1.5% and 10.8% at end-2017 to 1.7% and 11.9% by end-September 2018 respectively.
Sources: Central Bank of UAE, Bank Audi’s Group Research Department
Sources: Central Bank of UAE, Bank Audi’s Group Research Department
BANK ASSET COMPOSITION
BANK LOAN BREAKDOWN BY ECONOMIC ACTIVITY *
14January 02, 2019
ECONOMICS
UNITED ARAB EMIRATES
JANUARY 02, 2019
1.4.3. Equity and Bond Markets
Activity in UAE capital markets tilted to the downside in 2018
Activity in the UAE capital markets was mainly tilted to the downside in 2018, mainly weighed down by a
widespread sell-off mood in emerging markets, fears of a global economic slowdown, a sustained gradual
US monetary policy tightening, lingering geopolitical concerns and a real estate market slump in the UAE.
In details, the UAE equity markets performed unevenly over the year 2018. The Dubai Financial Market
recorded this year its worst performance since 2008. The DFM General Index plunged significantly by
20.8% during the first eleven months of 2018, moving from 3,370.07 at end-2017 to 2,668.66 at end-
November 2018, and pursued its downward trajectory in December to reach 2,460.34 on December 24,
2018. Price drops were mainly driven by a recent emerging market sell-off, geopolitical tensions in Saudi
Arabia, in addition to a real estate market slump in Dubai amid an oversupplied residential market, a
subdued demand, a high interest rate environment and a soft jobs market. The poor performance of the
DFM comes despite efforts by the UAE capital markets regulator to attract investors by improving market
infrastructure and increasing product offerings such as derivatives.
The breakdown of the DFM General Index by sector during the first eleven months of 2018 shows that
all sectors saw contractions. The consumer staples and discretionary sector registered the highest index
drop of 55.8%, followed by the financial and investment services sector with -39.9%, the real estate sector
with -32.2% (noting that the cumulative weighting of the nine realty stocks on the DFM General index
was 35.72% as of July 2018 according to latest figures released by DFM), the services sector with -22.7%,
the transportation sector with -8.8%, the banking sector with -3.2%, the telecommunications sector with
-2.5%, and the insurance sector with -1.4%.
The Dubai Financial Market was marked by a reduced activity over the first eleven months of 2018, as
shown by a 47.7% yearly slump in the total turnover to reach US$ 15.0 billion. The total number of traded
shares reached 40.2 billion shares over the first eleven months of 2018 against 75.5 billion shares during
the same period of 2017, and the total number of trades was quoted at 600,541 during the first eleven
months of 2018 versus 1,001,354 during the same period of 2017. On the back of significant price drops,
the market capitalization in the Dubai Financial Market fell from US$ 104.7 billion at end-November
2017 to US$ 96.8 billion at end-November 2018, down by 7.5%. Within this context, the turnover ratio,
measured by the annualized trading value to market capitalization, fell from 29.9% over the first eleven
months of 2017 to 16.9% over the corresponding period of 2018.
In contrast, the Abu Dhabi Securities Exchange traced an upward trajectory during the first eleven
months of 2018, with the Abu Dhabi general index moving from 4,398.44 at end-2017 to 4,770.08 at
end-November 2018, up by 8.4%, and extended its rise until December, reaching 4,817.52 on December
24, 2018. Prices gains were mainly supported by favorable financial results, merger talks in the banking
sector, and an AED 50 billion stimulus package announced by Abu Dhabi in the aim of promoting growth.
The breakdown of the Abu Dhabi general index by sector during the first eleven months of 2018 shows
that the highest increase was in the banking sector with +22.3% (noting that ADX banks have a weight
of 62.02% in the Abu Dhabi general index), followed by the energy sector with +11.0% amid an oil price
recovery, and the services sector with +4.8%. In contrast, the real estate sector posted the largest price
drop with -26.9% (noting that this sector has a weight of 4.83% in the ADX general index), followed by the
consumer staples sector with -21.3%, the industrial sector (-16.4%), the investment and financial services
sector (-11.1%), the telecommunications sector (-5.0%) and the insurance sector (-2.5%).
The total trading value fell by 23.8% during the first eleven months of 2018 to reach US$ 8.6 billion. The
total number of traded shares reached 11.6 billion shares over the first eleven months of 2018 against
22.9 billion shares during the same period of 2017 (down by 49.4%), and the total number of trades was
quoted at 240,089 during the first eleven months of 2018 versus 313,329 during the same period of 2017.
The number of listed companies rose from 73 companies at end-2017 to 76 companies at end-November
2018. The market capitalization rose from US$ 119.3 billion at end-November 2017 to US$ 137.3 billion at
end-November 2018, mainly supported by decent price gains and new listings. Within this context, the

15January 02, 2019
ECONOMICS
UNITED ARAB EMIRATES
JANUARY 02, 2019
turnover ratio, measured by the annualized trading value to market capitalization, reached 6.8% over the
first eleven months of 2018 as compared to 10.3% over the corresponding period of 2017.
All in all, the UAE equity markets were the third worst performer in the MENA region over the first eleven
months of 2018 following the Casablanca Stock Exchange (-11.5%) and the Egyptian Exchange (-9.1%),
underperforming regional stock markets in general, as reflected by the 8.8% fall in the S&P UAE price
index as compared to a 5.5% rise in the S&P Pan Arab Composite Index.
In parallel, the UAE fixed income markets came under downward price pressures during the first eleven
months of 2018, with papers in the Dubai and Abu Dhabi credit spaces registering price falls across the
board, mainly tracking US Treasuries declines after the US Federal Reserve raised its benchmark interest
rate four times over this year, and dragged by concerns over a global economic slowdown amid lingering
US-China trade disputes.
In the Dubai credit space, sovereigns maturing between 2020 and 2043 registered price drops of up to
5.75 pts during the first eleven months of 2018. Prices of Emaar’19, ’24 and ’26 declined by up to 7.54 pts.
DP World’20, ’23 and ’37 closed down by 1.94 pt, 3.60 pts and 13.60 pts respectively. Majid Al Futtaim’19,
’24 and ’25 saw price falls of 3.01 pts, 5.99 pts and 4.21 pts respectively. Amongst financials, Dubai Islamic
Bank papers maturing in 2020, 2021 and 2022 were down by up to 3.39 pts. ENBD papers maturing in
2019, 2020 and 2022 recorded price retreats of up to 1.53 pt. As to the cost of insuring debt, Dubai’s five-
year CDS spreads reached 125 bps at end-November 2018, slightly up from 122 bps at end-2017.
In the Abu Dhabi credit space, sovereigns maturing between 2019 and 2047 posted price decreases
ranging between 1.24 pt and 6.70 pts. Taqa papers maturing between 2019 and 2024 were down by 2.24
pts to 4.56 pts. Prices of Taqa’26 and ’30 plunged by 5.47 pts and 28.72 pts respectively. Mubadala papers
maturing between 2019 and 2024 saw price retreats of up to 5.35 pts. Dolphin’19 and ’21 closed down
by 2.11 pts and 4.27 pts respectively. Etisalat papers maturing between 2019 and 2026 witnessed price
contractions of up to 4.69 pts. Amongst financials, First Abu Dhabi Bank papers maturing in 2019 and
2020 traded down by up to 2.98 pts. UNB’21 was down by 1.94 pt. As to the cost of insuring debt, Abu
Dhabi’s five-year CDS spreads registered shy expansions of 7 bps over the first eleven months of 2018 to
reach 69 basis points at end-November, remaining one of the lowest in the MENA region.
Regarding new bond issues in 2018, Dubai saw several new issues in 2018 for a total of US$ 4.3 billion
as compared to total new bond issues of US$ 3.0 billion in 2017. In details, Dubai Islamic Bank issued in
January 2018 a US$ 1.0 billion five-year bond at a coupon of 3.625%. Majid Al Futtaim raised in March
2018 circa US$ 400 million from the sale of Perpetual bonds at a coupon of 6.375%. DAMAC launched in
April 2018 a US$ 400 million five-year bond at 6.625%. DP World issued in September 2018 a US$ 1 billion
ten-year bond at 4.848% and a US$ 1 billion 30-year bond at 5.625%. Finally, Tabreed raised in October
2018 US$ 500 million from the sale of bonds maturing in 2025.
Also, Abu Dhabi saw new bond issues totalling US$ 6.7 billion over the year 2018 as compared to total
new issues of US$ 16.0 billion in 2017. In details, First Abu Dhabi Bank raised in February 2018 circa US$
650 million from the sale of five-year bonds offering a coupon of 3.625%. UNB issued in March 2018 a five-
year US$ 500 million bond at a coupon of 4.0%. ADCB launched in March 2018 a US$ 750 million five-year
bond at a coupon of 4.0%. Al Hilal Bank issued in August 2018 a five-year US$ 500 million bond at 4.375%.
ADIB raised in September 2018 US$ 750 million from the sale of Perpetual bond at 7.125%. Also, Emirates
Airline raised US$ 540 million in March 2018 from the sale of a five-year bond at 4.50%.Taqa issued in April
2018 a US$ 750 million bond maturing in 2025 at 4.375%, and a US$ 1.0 billion bond maturing in 2030 at
4.875%. Aldar issued in September 2018 a US$ 500 million bond maturing in 2025 at 4.75%. Mubadala
launched in October 2018 a US$ 800 million ten-year bond at 4.50%.
As to credit ratings, Standard & Poor’s affirmed at end-November 2018 Abu Dhabi’s “AA/A-1+” long-term
and short-term foreign and local currency sovereign credit ratings, with “stable” outlook. The affirmation
reflects S&P’s view of Abu Dhabi’s strong fiscal and external positions. The exceptional strength of the
government’s net asset position provides a buffer to counter the effect of oil price swings on economic
growth, government revenues, the external account, and increasing geopolitical uncertainty in the Gulf
region. The “stable” outlook on Abu Dhabi reflects S&P’s expectation that economic growth would steadily

16January 02, 2019
ECONOMICS
UNITED ARAB EMIRATES
JANUARY 02, 2019
DUBAI STOCK MARKET INDICATORS
ABU DHABI STOCK MARKET INDICATORS
Sources: Dubai Financial Market, Bank Audi’s Group Research Department
Sources: Abu Dhabi Securities Exchange, Bank Audi’s Group Research Department
recover and that the country’s fiscal position would remain strong over the next two years, although
structural and institutional weaknesses would likely persist.
Also, Fitch affirmed in November 2018 Abu Dhabi’s long-term foreign currency IDR at “AA” with a “stable”
outlook. Abu Dhabi’s key credit strengths are its strong fiscal and external metrics and high GDP per
capita, balanced by high dependence on hydrocarbons and a relatively underdeveloped economic policy
framework, according to Fitch.
Finally, it is worth mentioning that the UAE enacted in October 2018 a law permitting the Federal
Government to issue sovereign debt for the first time, which would help the banking sector meet
international liquidity rules and enable individual emirates to benefit from higher issuer ratings than
they could achieve on their own. The Public Debt Law would also support the establishment of a primary
and secondary market for government securities, through which public debt instruments can be traded
in the UAE financial markets, and long-term bonds can be issued to contribute to alternative sources of
funding for federal government projects. This would create deeper and more resilient financial markets,
benchmark the dirham-denominated yield, provide more diversified sources of financing, mobilize
additional domestic savings and attract capital inflows, according to the Central Bank of the UAE.

17January 02, 2019
ECONOMICS
UNITED ARAB EMIRATES
JANUARY 02, 2019
2. CONCLUDING REMARKS
Looking ahead, fiscal easing is expected to support growth further. With fading fiscal headwinds, the IMF
is projecting UAE growth to accelerate to 3.7% in 2019. Non-hydrocarbon activity is expected to improve
due to improving economic conditions in neighboring countries but also due to measures such as Abu
Dhabi’s Tomorrow 2021 plan, which includes AED 50 billion in stimulus (5% of Abu Dhabi GDP, of which
AED 20 billion is earmarked for 2019) and changes in residency rules for foreigners. While the stimulus is
surely positive for Abu Dhabi’s economy with support to the private sector, it would have also positive
spillovers on the country’s economy as a whole, including neighboring emirates like Dubai. Companies
exposed to tourism and retail spending would be the primary beneficiaries of the announcement, while
banks could benefit as well from higher credit growth.
At the monetary level, average inflation is expected to decline from 3.5% in 2018 to 1.9% in 2019. It
is expected that residential rents declines would continue in 2019 in line with the downward trend in
residential prices that started in mid-2014, as job growth remains low and new housing becomes available.
With respect to monetary policy, UAE’s policy rates are likely to go up further in 2019, in line with future
Fed moves. Although tighter monetary policy will come at a time when real sector pressures remain and
inflation is expected to fall, no changes in the peg regime are expected looking ahead.
At the external level, the current account balance is expected to report a surplus of 8% of GDP in 2019,
as per the IMF. In parallel, the fiscal balance is set to record a surplus of 1.3% of GDP, despite the fiscal
stimulus, which suggests a sound fiscal environment for the emirates on the back of a public debt ratio of
18% of GDP among the lowest in emerging markets at large. UAE’s sound fiscality played a major role in
its capacity to withstand the low price environment of the past few years.
When assessing the outlook of the UAE economy, it is important to address the key strengths and major
weaknesses facing the economy. At the level of strengths, we mention (1) the high GDP per capita and
developed infrastructure, (2) the history of domestic political stability, (3) the strong balance sheet of
the Government of Abu Dhabi, (4) the country’s strong institutional framework and effectiveness, (5) the
significantly low unemployment rate and (6) the potential expansionary effects of stimulus plans.
Among challenges, we mention (1) the USD strength that adds to the challenge of protecting Dubai’s
global competitiveness, (2) the tepid regional demand which should remain a drag on external sectors, (3)
the possibility of lower than expected oil prices within the context of a significant reliance of consolidated
revenues on hydrocarbon which could put pressure on the Abu Dhabi government to cut spending
with negative implications for growth, (4) a possibly faster than expected US monetary tightening, (5)
the disincentives to immigration from higher tax burden on foreigners, and (6) a possible escalation of
geopolitical tensions in the region which could impact tourism, weaken trade and asset prices.
Within this environment, the IMF Article IV Consultation mission report recommends that improving
medium term growth and job prospects and advancing to a competitive knowledge-based economy
require deepening and broadening structural reforms aimed at increasing the role of the private sector
and fostering talent and innovation. Tightening financial conditions and increased global and regional
uncertainty call for continued vigilance in monitoring financial sector risks, including those from a
downturn in real estate and concentrated loan portfolios. Last but not least, continued improvement of
economic policy frameworks and coordination would help align policies with the Vision 2021 goals for
non-oil growth and ensure further diversification of the United Arab Emirates economy at large.

18January 02, 2019
ECONOMICS
UNITED ARAB EMIRATES
JANUARY 02, 2019
DISCLAIMER
The content of this publication is provided as general information only and should not be taken as an
advice to invest or engage in any form of financial or commercial activity. Any action that you may take
as a result of information in this publication remains your sole responsibility. None of the materials herein
constitute offers or solicitations to purchase or sell securities, your investment decisions should not be
made based upon the information herein. Although Bank Audi sal considers the content of this publication
reliable, it shall have no liability for its content and makes no warranty, representation or guarantee as to
its accuracy or completeness.
Bank Audi sal - Group Research Department - Bank Audi Plaza - Bab Idriss - PO Box 11-2560 - Lebanon - Tel: 961 1 994 000 - email: [email protected]