uap holdings limited · uap insurance building, plot 1 kimathi avenue p. o. box 7185, kampala -...
TRANSCRIPT

MANAGEMENT COMMENTARY
Corporate Information 4 - 5
Board of Directors 6
Senior Management Team 12
Chairman’s Report 18
Group Managing Director’s Report 22
Corporate Governance Statement 28
Sustainability and Corporate Social Responsibility Report 31
Five Year Financial Highlights 34
NOTICE OF ANNUAL GENERAL MEETING 35
DIRECTORS REPORT 36
STATEMENT OF DIRECTORS’ REPSONSIBILITY 37
REPORT OF THE INDEPENDENT AUDITORS 38
FINANCIAL STATEMENTSConsolidated Income Statement 39
Consolidated Statement of Comprehensive Income 40
Consolidated Statement of Financial Position 41
Company Statement of Financial Position 42
Consolidated Statement of Changes in Equity 43
Company Statement of Changes in Equity 45
Consolidated Statement of Cash flows 46
NOTES TO THE FINANCIAL STATEMENTS 47 - 93
1TABLE OF
CO N T E N T S U A P H O L D I N G S L I M I T E D
ANNUAL REPORT & FINANCIAL STATEMENTS FOR THE YEAR ENDED 31 DECEMBER 2010

The Group’s management commentary has been prepared in accordance with the non-mandatory practice statement issued by the International Accounting Standards Board on 8 December 2010. This management commentary provides a description of the following items as required by the Practise Statement:
Commentary Content Relevant Management Commentary StatementCorporate information
Board of Directors
Manage-ment Team
Chairman’s Report
Group Managing Director’s report
Corporate Governance Statement
Sustainability and Corporate Social Responsibility Report
Five yearFinancial Highlights
Nature of business √ √ √ √ √ √ √
Management objectives and strategies
√ √
Critical financial and non-financial resources
√ √ √
Principal Risks √ √ √
Performance and Development of the Group
√ √ √
Performance measures √ √ √
Key√ - Management commentary content included in statement
U A P H O L D I N G S L I M I T E D 2ANNUAL REPORT & FINANCIAL STATEMENTS FOR THE YEAR ENDED 31 DECEMBER 2010
Management Commentary

OUR VALUES
We build life long relationships
We do what we say and say what we do
We are a pleasure to deal with
We are passionate about our work -
and it shows!
OUR VISIONTo be Africa’s revolutionary financial services Company.
OUR MISSIONTo enhance quality of life by delivering peace of mind and financial freedom through an exceptionally motivated team that delivers what customers want - when and where they want it.’

KENYA - BRANCHES
Bishops Garden Towers, Bishops Road P. O. Box 43013 - 00100, Nairobi, KenyaTel: (+254 20) 2850000 | Fax: (+254 20) 2719030 Email: [email protected]: www.uapkenya.com
Q U E E N S WAY - N A I R O B ICustomer Care Centre - Queensway Hse 3rd Floor Kaunda StreetP. O. Box 43013 - 00100 Tel: +254 20 2228070, 2229521 | Fax: +254 20 222 7659 E-mail: [email protected]
M O M B A S A Biashara Bank Building, Nyerere Road, P. O. Box 81612 - 80100 Mombasa, Kenya Tel: +254 041 - 2223777/8 | Fax: +254 041- 2315888 E-mail: [email protected]
N Y E R I Sohan Plaza P. O. Box 1231 - 10100 Nyeri, Kenya Tel: +254 061- 2030660\2034722 | Fax: +254 061-2032941 E-mail: [email protected]
N A K U R U Prestige Mall P. O. Box 14116 - 20100 Nakuru, Kenya Tel: +254 051 - 2212910 | Fax: +254 051- 2214563 E-mail: [email protected]
E L D O R E T Kiptagich House, Uganda Road P. O. Box 707 - 30100 Eldoret Kenya Tel: +245 053 - 2061437/8 | Fax: +254 053 - 2061437 E-mail: [email protected]
K I S U M U Al Imran Plaza P. O. Box 3379 - 40100 Kisumu, Kenya Tel: +254 057 - 2020119 | Fax: +254 057 - 2024488 E-mail: [email protected]
M E R U Mwalimu Plaza, Ground Floor P. O. Box 3258 - 60200 Meru, Kenya Tel: +254 064 - 30089 | Fax: +254 064 - 30094 Wireless: +254 020 - 2423190 / 064 - 30089 E-mail: [email protected]
M AC H A KO S KCB Building, Machakos P. O. Box 1092 - 90100 Tel: +254 020 2054611 E-mail: [email protected]
T H I K A Twin Oak Plaza – 1st Floor, Kwame Nkrumah Road P. O. Box 4280 01000, Thika, Kenya Tel: +254 020 2486803/4/5 E-mail: [email protected]
K I S I I Ouru Complex - Ground Floor P. O. Box 209 40200, Kisii, Kenya Tel: +254 058-31851, 020-8075777E-mail: [email protected]
HEAD OFFICE
U A P H O L D I N G S L I M I T E D 4ANNUAL REPORT & FINANCIAL STATEMENTS FOR THE YEAR ENDED 31 DECEMBER 2010
Corporate Information

H E A D O F F I C E UAP Insurance Uganda Limited UAP Insurance Building, Plot 1 Kimathi Avenue P. O. Box 7185, Kampala - Uganda Tel: +256 - 414 - 332700Fax: +256 - 414 - 256388 Email: [email protected]: www.uapinsurance.co.ug
J I N J A Plot 32/34 Main Street P. O. Box 1747, Tel: +256 0434 -120047
L I R A Plot 18 Olwol Road P. O. Box 423, Tel: +256 04734 - 20616
M B A R A R A Plot 23 High Street P. O. Box 1171, Tel: +256 04854 - 21422
M B A L E Plot 58 Republic Street P. O. Box 915, Tel: +256 0454 - 34568
G U LU Plot 16 Aewich Road Tel: +256 0471 - 432017
A R UA Plot 24 Avenue Road Mobile: +256 0772903442
UGANDA - BRANCHES
SERVICE PROVIDERS
B A N K E R SBarclays Bank of Kenya Limited.Bank of Africa Kenya Limited.Citibank.
AU D I TO RPricewaterhouseCoopers,Rahimtulla Trust Building,P. O. Box 43963-00100, Nairobi, Kenya.
AC T UA R I E SQED Actuaries and Consultants (Pty) Limited, The Place, Sandton Drive, Sandhurst,Sundton 2196 South Africa.
L AW Y E R S Coulson HarneyUnit A, Nairobi Business Park, Ngong Road,P. O. Box 10643, Nairobi, 00100 Kenya.
VA LU E R SKnight Frank Kenya Ltd,Lion Place,P. O. Box 39773, Nairobi 00623, Kenya.
SUDAN - BRANCHES
J U B A H E A D O F F I C E Plot No. 3 Block VI at Hai Suk Juba TownP. O. Box 201 Juba, Southern Sudan Tel: +249 - 959 - 000000, +256 - 477 - 296555, +249 - 126 - 454664E-mail: [email protected]
WAU Tel: +249 959 028518, Southern Sudan E-mail: [email protected]
N I M U L E Tel: +249 111395844, Southern Sudan E-mail: [email protected]
YA M B I O Tel: +249 959 000001,Southern Sudan E-mail: [email protected]
U A P H O L D I N G S L I M I T E D5ANNUAL REPORT & FINANCIAL
STATEMENTS FOR THE YEAR ENDED 31 DECEMBER 2010
Corporate Information (continued)

standing Portraits
Kamau Kuria | Chris Kirubi | James Mworia | Dr JB Wanjui | James Muguiyi | Sir. Gordon Wavamunno | Philip Coulson
Standing from left to right
6 The Board of Directors

Dr. JB Wanjui, CBS (Chairman) | 74Dr Wanjui, the Chairman of the Board has a long and illustrious career in the Kenyan corporate scene, the most prominent being the Chief Executive of East Africa Industries (later became Unilever). He is a graduate of Ohio Wesleyan University, (BA Physics and Mathematics) and Columbia University, (MSC Engineering). He is the Chancellor of the University of Nairobi and is also the Chairman of Stanbic Bank Kenya. He is also chairman and Board member of a number of other Kenyan and international organisations. Dr Wanjui has been a director of the Company since 1986 and the Chairman of the Board since 1998.
James Muguiyi (Group Managing Director) | 67James has been the Managing Director of the Company since 2001. During this time James has overseen the growth of the Group’s business in Kenya and the expansion into Uganda in 2004 and Sudan 2005. He has presided over the establishment of the Group Holdings Company and the demerger of Life business from General business in Kenya. Between 1988 and 2001 he was the Deputy Managing Director. During this time he oversaw the merger of Provincial Insurance with Union Insurance to form UAP in 1994. James is a director of several companies and Chairman of the Centum Investments Co. Limited. He is a Fellow of the Institute of Certified Public Accountants of Kenya (FCPA (K)) where he was one time the Chairman. He is also a Certified Public Secretary (CPS (K)) and a Chartered Management Accountant (ACMA).
Sir Gordon Wavamunno (Non-executive Director) | 67Mr Wavamunno is the chairman of UAP Uganda since 1988 and a board member since 1979. He joined the Board of UAP Holdings in 2009. He is a prominent international businessman who sits in several Boards including Spear Motors Limited, WBS Television among others. He is very knowledgeable of the business environment in Uganda and the region where he has established and run successfully a number of businesses since the 1960s.
Chris Kirubi (Non-executive Director) | 70Chris is an alumnus of INSEAD Institute, France, Handles University, Sweden and Harvard Business School. He is a prominent business executive who has invested heavily in a number of Kenya Companies and multinationals. He is the Chairman of Haco Industries, Nairobi Bottlers, International House Limited and DHL East Africa and is the CEO and Chairman of the Capital Group. He is a director of various companies, including Centum Investment Company Limited
and Bayer East Africa. Chris is a member of the Corporate Advisory Board of the Global Business Coalition on HIV/AIDS, TB & Malaria, a board member of the Friends of Africa of the Global Fund, and a member of the NEPAD Steering Committee in Kenya. He is also a member of the National Economic and Social Council, Kenya and the Investor’s Advisory Council, Ghana. He is currently the Ghanaian Honorary Consul General in Kenya.
Kamau Kuria (Non-executive Director) | 51Kamau is the Managing Director of Corporate Transformations Limited (CTL), a strategy execution and performance consultancy company. He is a management consultancy professional and prior to founding CTL he held positions as the University Secretary at Strathmore University and the Head of Change for Barclays Bank of Kenya Ltd. Prior to that he was the Managing Director of Quantum Consultants Limited, an independent consultancy company he founded in 1996. Before founding Quantum, Kamau was a Senior Manager in the Price Waterhouse East and Central Africa consultancy practice. He is a member of the Institute of Certified Public Accountants of Kenya. Kamau holds a Masters degree in Business Administration from Concordia University, Canada and a Bachelor’s degree in Electronic Engineering from Essex University, UK.
James Mworia (Non-executive Director) | 33James Mworia is the Chief Executive Officer of Centum Investment Company Limited. James is a private equity investment management professional and prior to joining Centum Investment Company Limited he was the Head of Investments at TransCentury Limited. He is a CFA Charterholder, an Advocate of the High Court of Kenya, a Certified Public Accountant and a Chartered Management Accountant. He is a member of the CFA Institute, Institute of Certified Public Accountants of Kenya, Law Society of Kenya and the Chartered Institute of Management Accountants.
Philip Coulson (Non-executive Director) | 45Philip Coulson Joined the Board of UAP Holdings Limited during the course of 2010. He is an Advocate of the High Court of Kenya and is also a qualified English solicitor. He practices as a commercial lawyer in Nairobi with Coulson Harney, Advocates, specialising in mergers and acquisitions. From 1994 to 2008 he worked with Kaplan and Stratton, Advocates. He is a member of the Law societies of Kenya and England and Wales and is also a member of the International Bar Association.
U A P H O L D I N G S L I M I T E D7ANNUAL REPORT & FINANCIAL
STATEMENTS FOR THE YEAR ENDED 31 DECEMBER 2010
The Board of Directors (Biographies)

James Wambugu
Dr. William S Kalema
Joseph Lesiew.
Francis Ogutu
Betty-Anne Mboche Prof. Joseph Kimura
Hon. Ngenye Kariuki
Prof. Scopas Dima
Mathew Koech
Andrew Kasirye Prof. Weke Jerim Otieno Wainaina KenyanjuiJoyce-Anne WainainaLony Duop
Patrick Kanyingi
U A P H O L D I N G S L I M I T E D 8ANNUAL REPORT & FINANCIAL STATEMENTS FOR THE YEAR ENDED 31 DECEMBER 2010
The Subsidiary Directors
Betty-Anne Mboche (Non-executive Director - UAP Insurance Kenya) | 46 Betty-Anne is a graduate in Accounting from Ohio Wesleyan University, USA. She is currently a shareholder and the Managing Director of Bawan Roses Ltd, a company involved in the growing of flowers, coffee and propagation of tree seedlings for sale and internal use. She previously worked for Bawan Group starting as an accountant before briefly becoming Projects Manager and later Managing Director. During this tenure, she was instrumental in the growth of the portfolio of the business especially in real estate development, tea growing and later establishing Bawan Roses Ltd which she now owns with her husband.
Prof. Scopas Dima (Non-executive Director - UAP Sudan) | 64 Professor Dima is an academic of high standing in the Eastern, Central and Southern Africa region. He holds a PhD in Agricultural Economics from Reading University England, UK, an MSc in Agricultural Engineering and Economics from Makerere University Uganda and a BSc (Agric) Honours from Makerere University, Uganda. He is currently an advisor to the Ministry of Agriculture of the Government of Southern Sudan. He has previously taught in various universities including University of Juba Sudan, Makerere University Uganda, Moi University Kenya, National University of Lesotho and University of Namibia. Professor Dima has also worked for various organizations and projects including being Principal Economist, Central Cabinet Economic Committee, Kampala Uganda; Director, Directorate of Agricultural Planning and Statistics, Ministry of Agriculture and Natural Resources, Equatorial Region Southern Sudan; General Manager, Equatorial Trading Corporation Equatorial Region, Southern Sudan, Juba. He is a director of various companies in Southern Sudan and Uganda.
Prof. Joseph Kimura (Non-executive Director - UAP Insurance Kenya) | 66 Professor Kimura is an academician of high standing in the region. He holds a PhD in Accounting from University of California, Los Angeles, MBA from University of Alberta, Edmonton, Canada and a Bachelor of Commerce from University of East Africa. He is also a Fellow of the Institute of Certified Public Accountants of Kenya (FCPA (K). He is currently the Dean of School of Business, United States International University Africa and between 1999 and 2003 he was the director/CEO of the College of Insurance. Previously he worked with the Institute of Policy Analysis and Research, Institute of Accountancy, Arusha, Tanzania and was the Dean of the Faculty of Commerce, University of Nairobi. Professor Kimura is also a director of several other prominent companies among them BAT Kenya Limited and Development Bank of Kenya Ltd. He is also the Chairman of NDEKA, a conservation initiative for the Ndakaini Dam which supplies over 70% of water to the City of Nairobi.
Joseph Lesiew (Non-Executive Director - UAP Life Assurance) | 73Joseph Lesiew is a business entrepreneur and farmer based in Eldoret. He is a life member of the Agricultural Society of Kenya, Red Cross and the Flying Doctors. He has previously served in the Local Government for over 18 years in various capacities including his tenure as Mayor of Eldoret Town during which various major business ventures were commenced in this region. He has received certifications from the Birmingham University and Strathmore Business School. He has been involved in various community projects over the years as the leader in institutions promoting the improvement of education, local infrastructure and community welfare. He is the current chairman of Kaptagat Girls High School and St. Patrick’s High School among others and founder of the Eldoret Special School for mentally retarded children.
James Wambugu (Managing Director - UAP Insurance Kenya) | 45 James joined UAP in July 2003 and has been involved in the development of the Company’s quality management systems, business expansion and strategy development. He previously worked for PricewaterhouseCoopers in Kenya and the UK, Lonrho Africa and African Lakes Corporation in the fields of audit, transaction structuring and support and risk management. He has extensive experience across many countries in Africa. He holds an MBA and Bachelor of Commerce degrees from the University of Nairobi and a diploma in Advanced Management Programme (AMP) from IESE Business School, Barcelona and Strathmore Business School, Nairobi. He is a Qualified Risk Manager (MIRM) and a Certified Public Accountant of Kenya CPA (K).
U A P H O L D I N G S L I M I T E D9ANNUAL REPORT & FINANCIAL
STATEMENTS FOR THE YEAR ENDED 31 DECEMBER 2010
The Subsidiary Directors (Biographies)

Patrick Kanyingi (Managing Director - UAP Sudan) | 59 Patrick was appointed Managing Director in July 2006. He was previously Finance and Administration Manager, UAP Provincial Insurance Kenya since 1991 and Company Secretary since 2001. Prior to joining UAP he had worked for Tana and Athi Rivers Development Authority (TARDA), the National Irrigation Board and Githongo and Company Certified Public Accountants. Patrick is a member of the Institute of Certified Public Accountants of Kenya CPA (K) and the Certified Public Secretaries of Kenya CPS(K). He holds an MBA in Strategic Management from Newport University, USA. a diploma in Advanced Management Programme (AMP) from IESE Business School, Barcelona and Strathmore Business School, Nairobi and Dip. CII from the Chartered Insurance Institute London.
Mathew Koech (Managing Director - UAP Uganda) | 46Mathew has been the Managing Director of UAP Insurance (Uganda), UAP’s subsidiary in Uganda since January 2005. Between 1998 and 2004 he worked at UAP initially as the Financial Controller and later as General Manager and has been a member of the Board since 2000. Mathew joined UAP from BAT Kenya where he was the Internal Audit Manager. Prior to this he had worked for PricewaterhouseCoopers and Ernst & Young both in Kenya and the UK. He is a member of the Institute of Certified Public Accountants of Kenya. He holds a Bachelor of Commerce degree from the University of Nairobi. Mathew is the Chairman of Uganda Insurers Association.
Hon. Ngenye Kariuki, CBS (Non-executive Director - UAP Insurance Kenya) | 65 Hon. Kariuki is a shareholder of Ngenye Kariuki & Co Ltd. stock broking members of the Nairobi Stock Exchange (NSE). He has a Bachelor of Commerce (Finance option) degree from the University of Nairobi. He is a former Member of Parliament and a Cabinet Minister in the Government of Kenya. He is the chairman of board of Trustees of UAP Pension Fund. Before establishing Ngenye Kariuki & Co he worked in senior positions in Dyer and Blair (stock brokers), Family Planning Association and Kenya Engineering Industries. Hon. Kariuki was the chairman of NSE for 12 years and is a director of many companies.
Francis Ogutu (Chairman - UAP Life Assurance) | 42 Francis is a founder-director of Cassia Capital Partners Limited (previously known as RMB Capital East Africa Limited), a private equity partnership. Before founding Cassia he was the managing director of Lattice Consulting Limited, a corporate finance, project finance and strategy consultancy firm. He was also previously a manager in the PricewaterhouseCoopers Corporate Finance & Strategy business in Africa Central, and an executive in the PricewaterhouseCoopers Telecommunications Project Finance team in the United Kingdom. He holds an MBA (with distinction) from the Graduate School of Business Administration, University of the Witwatersrand (South Africa) and is a member of the Institute of Certified Public Accountants of Kenya. He also holds a Bachelor of Education (Mathematics and Physics) degree from Egerton University.
Dr. William S Kalema (Non-executive Director - UAP Uganda) | 58 Joined the Board in April 2005. He possesses extensive knowledge of the Ugandan private sector. In 1991 he founded Uganda Manufacturers Association Consultancy and Information Services Limited (UMACIS), which has become established in Uganda as the leading firm with expertise in market and feasibility studies, business development, private sector development and public policy. He holds a Ph.D. degree in chemical engineering from the California Institute of Technology. From 1984 to 1991, he worked as a research engineer and as a business analyst in several divisions of the Du Pont Company based in Delaware, USA. Earlier, he had worked as a metallurgical engineer in the Zambian copper mining industry, from 1974 to 1978.
Lony Duop (Non- Executive Director - UAP Sudan) | 36 Lony has a diploma in International Relation from Sudan University of Science and Technology. He is currently working in the office of the Vice president, Government of Southern Sudan. He has previously worked with the Southern Sudan Government departments including Relief Assistance for South Sudan Head Office in Nairobi, Sudan Relief and Rehabilitation Commission (SRRC).
U A P H O L D I N G S L I M I T E D 10ANNUAL REPORT & FINANCIAL STATEMENTS FOR THE YEAR ENDED 31 DECEMBER 2010
The Subsidiary Directors (Biographies)
Joyce-Ann Wainaina (Non-Executive Director - UAP Life Assurance) | 42 Joyce-Ann Wainaina is a Managing Director with Citibank, a leading global financial services company, where she has had an extensive career in Kenya and South Africa spanning 20 years. She holds key positions on several boards including the American Chamber of Commerce Kenya as the Vice President, Junior Achievement Kenya as the Finance Director, and is a founding trustee of the JB Wanjui Education trust fund that focuses on providing education grants to science students in Kenya. She is a graduate in Finance from Duquesne university in Pittsburgh, USA.
Andrew Kasirye (Non-executive Director - UAP Uganda) | 50 Joined the Board in April 2005. He holds a Bachelor of Law degree from Makerere University and is a senior partner at Kasirye, Byaruhanga and Co. Advocates. He is a past President of Uganda Law Society, Vice-President of the East Africa Law Society and a Member of Parliament of the Buganda Kingdom. He is Chairman of Uganda Wildlife Authority and is a well known personality in the legal profession.
Prof. Patrick G O Weke (Non - Executive Director – UAP Life Assurance) | 42Professor Weke is an academician of high standing in the region. He holds a PhD in Mathematical Statistics from Harbin Institute of Technology, China, M.Sc. from both University of Nairobi and City University, London and a B.sc. in Mathematics, Statistics and Computer Science from the University of Nairobi. He is currently Head of Actuarial Science and Financial Mathematics Division at the University of Nairobi’s School of Mathematics. He sits on the Board of Trustees of the University Staff Pension Scheme and is a member of the Life Insurance Council Standing Committee on Kenyan mortality investigation. He is also a Coordinator of East African Universities’ Mathematics Programme. Prof. Weke is a member of the Institute of Actuaries (UK), member of Actuarial Education Network, Member of International Biometric Society and also member of The Actuarial Society of Kenya (TASK).
Jerim Otieno (Managing Director - UAP Life Assurance) | 42Jerim was appointed the Managing Director of UAP Life in October 2010. Between 2005 and 2008, he worked in UAP Insurance in various positions, where he was involved in product innovation and systems implementation, in the life department. Subsequently, he moved to UAP Life when the life business was spin off UAP Insurance in 2009. He joined UAP from ICEA Uganda where he headed their life operations. Prior to this he worked for Insurance Training & Education Trust and Jubilee Insurance. He is a Chartered Insurer, holds a diploma in Life & Disability Underwriting from the Assurance Medical Society of London and a Certificate in Pensions Administration from the World Bank Institute. He holds a Bachelor of Commerce degree from the University of Nairobi and is a graduate of Advanced Management Programme (AMP) from IESE Business School, Barcelona and Strathmore Business School, Nairobi.
Wainaina Kenyanjui (Non- Executive Director - UAP Sudan) | 47Wainaina Kenyanjui is an entrepreneur with a demonstrated track record of leading real estate development companies which focus on development of residential and commercial buildings in Kenya. Wainaina serves on several boards including the Privatization Commission presided over the divestiture of 25% Government ownership in Safaricom Kenya Ltd the most profitable company in East Africa. Wainaina is a Member of Bundume Investments Company limited, a private equity fund in Kenya and is the Chairman. Wainaina has also served on The Kenya Railways board for 4 years.
U A P H O L D I N G S L I M I T E D11ANNUAL REPORT & FINANCIAL
STATEMENTS FOR THE YEAR ENDED 31 DECEMBER 2010
The Subsidiary Directors (Biographies)

Isaac Nzyoka
Rosemary Brainerd
Michael Oduor
Jerim Otieno
Carolyn Munyua
Kimemia Mwangi
Francis Ogwell
Agnes Mutahi
Joseph Kamiri
Evans Ndirangu
Atanas K. Maina
James Wambugu
Christine Muchiri
UAP Kenya Senior Management Team
UAP Life Assurance Management Team
U A P H O L D I N G S L I M I T E D 12ANNUAL REPORT & FINANCIAL STATEMENTS FOR THE YEAR
ENDED 31 DECEMBER 2010

Faith Muriungi
Benjamin Muthenya
Eunice Kinungi
Henry Gisemwa
Anthony Muthiora
Collins Ng’eno
Fredrick Ruoro
Alice Warugongo
Caroline Maina
Florence Kimani
Anthony Kiragu
Caleb Maina
U A P H O L D I N G S L I M I T E D13ANNUAL REPORT & FINANCIAL
STATEMENTS FOR THE YEAR ENDED 31 DECEMBER 2010
UAP Kenya Management Team

Gerishon Mwangi
Leah Gatonye
Peter Mochama
John Njihia
Patrick Odhiambo
Thomas Njeru
James Macharia
Moses Mbuciri
Peter Murage
Jackson Koome
Maryanne Mung’ara
U A P H O L D I N G S L I M I T E D 14ANNUAL REPORT & FINANCIAL STATEMENTS FOR THE YEAR ENDED 31 DECEMBER 2010
UAP Kenya Management Team (continued)

Francis Ntenza Angela Kamau
Wilbroad Muhangi
Moses OtienoAgnes Naluko
Fredrick Mutua
Mathew Koech
Paul Nagemi
David Serunkuma
Fredrick Muhumuza
Ronald Musoke
Kenneth Muchina
U A P H O L D I N G S L I M I T E D15ANNUAL REPORT & FINANCIAL
STATEMENTS FOR THE YEAR ENDED 31 DECEMBER 2010
UAP Uganda Management Team

Antony Mwangi
James Wani
John KirutiRose Atemo
Gladys Lanyero
Nicholas Malesi
Kimanzi KyaloRichard MarisinGeorge OchiraPatrick Kanyingi
U A P H O L D I N G S L I M I T E D 16ANNUAL REPORT & FINANCIAL STATEMENTS FOR THE YEAR ENDED 31 DECEMBER 2010
UAP Sudan Management Team

My kids are my life.

Dr. JB Wanjui & Jason
18
I am delighted to present to you the 2010 annual report and financial statements of our company. This is the third annual report of UAP holdings which took over the entire business of our group from UAP
Insurance in 2008. The report reflects a significant recovery in our profits and comprehensive income from the difficult years of 2008 and 2009 following the recovery of the global and regional economies in 2010.
Chairman’s Report
HighlightsAs we predicted the recovery we had expected in 2009, eventually materialized in 2010. The Global economy registered a 3.9% growth in 2010 from -1.7% in 2009. The feared melt down in Portugal and Spain following Greece did not materialise and instead Ireland suffered more and had to be bailed out by the European Union. The emerging markets fared better and it is safe to conclude that the global economy has regained some stability albeit in a greatly altered way. China overtook Japan as the second largest economy in the World after the USA. The economies in the countries we operate in finally came out of the subdued growth to register high growth with Kenya being the lowest at 5%. Inflation edged up and the currencies lost ground but business environment remained steady. The stock market in Kenya recovered by 37% and the industry generally experienced robust activity in innovation and expansion. Regulation continued to get firmer especially in Kenya resulting in firmer rates particularly in Motor and Listed risks.
We continued with our innovation in products, distribution channels and business processes. We also ran a successful branding campaign in our three markets, Kenya, Uganda and Southern Sudan.
Against this background, UAP registered a greatly improved performance. Total premiums grew by 28% to Shs. 5.8b. This excludes deposit administration and other investment premiums of Shs 550 million which are not treated as insurance premiums in accordance with the accounting rules. Total profits improved from Shs 280m to Shs 806m, an increase of nearly 300%!
Operational environmentOur company operated under a much improved environment in 2010 than in the two difficult years of 2008 and 2009. Kenya grew by 5% from 1.9% in 2009; Uganda grew by 6.9%, data is not available for Southern Sudan but the whole of Sudan grew by 5.7%.
On the political front, there was heightened political activity in the region. Kenya successfully held a constitutional referendum and Rwanda and Tanzania concluded their elections during the year. Uganda’s elections in February 2011 were concluded peacefully. The greatest story is the successful referendum on self determination in South Sudan in January 2011. This led to a vote to separate from Sudan and South Sudan will be the newest country in the world in July 2011. The common theme coming from these elections is that people are asserting their right to make elective choices and the region is maturing albeit with some underlying risks. The
East Africa Customs Union also got off to a good start in July 2010, making the EAC the most advanced economic block in Africa. This maturity bodes well for business and leads to better economic performance.
The industry meanwhile continues to undergo changes. Innovation continues particularly in new products and also distribution channels. Following UAP’s lead, a number of companies have entered areas such as agriculture and political violence insurance. Emerging financial houses in which banks are partnering with insurance companies are beginning to make their influence felt. There is also greater focus to serve the ignored market. This is a direct response to the failure of insurance in the past to deepen penetration even as banks successfully banked more people.
The changes in the industry are partly due to evolving regulation. There is more effectiveness in regulation and the regulators continue to look for more intervention. In Kenya the new “No Claims Discount” (NCD) rating in Motor class held well as well as the rating of large risks. In Uganda the minimum rates introduced have resulted in lower rates hence a threat to business growth. In both Kenya and Uganda the insurance legislation is under review. In Kenya, risk based regulation is expected to be introduced while in Uganda the proposed separation of Life from General business could increase the cost of doing business. As a result of the NCD rates and better enforcement of minimum rates on listed risks total premiums in the industry are growing and we anticipate that companies have made better results in underwriting in 2010 compared to recent years. Investment markets improved, the NSE grew by 37% and property values also grew
New laws on maximum shareholding and minimum share capital in Kenya have resulted in a flurry of activities to comply. A number of companies are raising more capital; bringing on board more shareholders while others plan to list at the Nairobi Stock Exchange (NSE). UAP also plans to list at the NSE. While this will address the matter of maximum shareholding regulations, the bigger benefits is to enable shareholder unlock through increased liquidity and also securitize their shareholding with the company.
Overall performanceIn line with the improved conditions, the Group registered both growth and profits. The assets and net assets of the company also grew. Total premiums grew by 28% to Shs 5.8 billion. Total profits grew to Shs 806 million from Shs 280 million in 2009. In Kenya general Insurance premiums grew by 26% to Shs 3.9 billion. Total premiums in UAP Life grew by 52%, Uganda by 38% and
U A P H O L D I N G S L I M I T E D19ANNUAL REPORT & FINANCIAL
STATEMENTS FOR THE YEAR ENDED 31 DECEMBER 2010
Chairman’s Report (continued)

Sudan by 23%. In all four companies profitability improved tremendously. In Kenya UAP Insurance profits grew by 246% to Shs 446m and in Uganda profits grew by 188% to UShs 10 billion (over Shs 300 million equivalent).The total assets grew by 27% to Shs 12.4 billion and the net assets grew by 27% to Shs 4.4b. The growth in net assets of Shs 930m is made up of the profits net of dividends declared of Shs 204m and increase in value of our investments at the stock exchange which increased by over Shs 500m.
This performance is much better than we achieved last year and in 2008. It is still short of our peak performance of 2007. Our recovery in profits is mainly due to prudent underwriting aided by the turnaround in the motor class in Kenya as a result of the NCD rating. Underwriting performance would have been much better were it not for a poor performance of the medical class against rampant rates undercutting in the industry and double digit medical inflation. Midway through the year we made a conscious decision to underwrite medical for profit. This resulted in low growth in medical premiums and we halted what could have been higher losses in this class. We expect our efforts in this class to pay off in 2011 and beyond.
The growth in profits was also as a result of growth in investment income by Shs 608m to Shs 1.1b. This was as a result of increase in unrealized gains in equity investments for UAP Life of Shs 305m and gain in value of our investment properties of Shs 250m.The growth in our total assets ensures that we remain one of the highest valued insurance companies in the region. This is reflected in our credit rating in Kenya which was maintained at AA-, the highest rating given to any insurance company in the region.
Our overall performance is satisfactory in the circumstances we operated under during the year. We have a number of opportunities to grow our profits from our expanding business in 2011 and beyond. In particular, our medical business provides a good profit opportunity as well as our Life business which has suffered poor profits due to write down of financial assets at the NSE. We have further opportunities to hold expenses in 2011 as we believe that we have now put adequate capacity, particularly in ICT and other shared services to drive the business forward.
Governance and board performanceYour board has continued to discharge its duties diligently with the support of the company’s subsidiary company boards. All the boards effectively carried out
their board work plan for 2010 in accordance with the board charter and work plan for each board.There were no changes in the boards of UAP Holdings; UAP Insurance or UAP Uganda. Mr. Wainaina Kenyanjui was appointed a board member in UAP Sudan and Dr. Patrick Weke was appointed to the Board of UAP Life Assurance. Ms. Joyceanne Wainaina resigned from the Board of UAP Sudan and remains a board member of UAP Life. These changes were made in order to strengthen these boards with additional relevant skills. Mr. Kenyajui is a businessman and a real estate developer, while Dr. Weke is the Dean of the Faculty of Actuarial Studies at the University of Nairobi. All the directors have been provided with relevant training on corporate governance. More details on the operations of the board is provided in the statement on Corporate governance on page 25
Results and dividendsThe Group profit after tax and non controlling interest is Shs. 634 million. Based on these results the Board recommends a dividend of Shs 1.70 per share (2009: Shs 1.70) being the first and final dividend. This is based on your board’s assessment that we need to continue rewarding shareholders while retaining enough resources in the business to fund expected growth. Therefore Shs 430 million will be retained in the business for this purpose. The cumulative retained earnings of nearly Shs 2 billion is currently well deployed in the business and will ensure a continued flow of dividends and capital gains to shareholders into the future.
Future prospects and strategyWe cannot talk about the future without talking about the world and regional economic outlook. Our business has a direct relationship with economic prospects. We have prospered whenever the economy performs well. Total insurance penetration has a positive correlation with per capita income. The global economic outlook is brighter than when we started 2010. Actual growth in 2010 is expected to close at 3.9% and projection for 2011 is 3.1%. This is largely driven by the emerging markets forecast at 5.2% and the US economy which is now expected to grow by 2.8%, a figure much larger than previously thought. Sub-Saharan Africa is expected to grow by about 5.2% and will only be out performed by Asia excluding Japan at 6.2%. Africa is turning to be the engine for the next global economic revolution.
Amidst all this, our region is likely to outperform Sub-Saharan Africa. The risks are going to be increasing interest rates and inflation. A high growth presents opportunity to a Company like ours. Therefore from a regional perspective, we expect to continue with our regional expansion. This year we expect to start
U A P H O L D I N G S L I M I T E D 20ANNUAL REPORT & FINANCIAL STATEMENTS FOR THE YEAR ENDED 31 DECEMBER 2010
Chairman’s Report (continued)

operations in DRC and a lot of work has already gone into starting this operation. We are encouraged by our experience in Southern Sudan to pursue the DRC option. We will then be looking at both Rwanda and Tanzania.
In our core business of underwriting, we will continue with our strategy built around innovation in products, distribution channels and business processes. This should enable us charge the right premium and ensure we grow our underwriting margin even as we grow our volumes. This is particularly key in the Motor class and the Medical business too. These two classes comprise a large share of our business and any positive results from them will have a profound result on our bottom line. We plan to invest in an ERP system to the tune of Shs 150 million. When this is combined with our innovation in business processes we expect to unlock huge growth without incurring any additional overheads hence contributing to our bottom line again.
Due to the hard investment markets in 2008 and 2009 and the hard underwriting environment in 2009, we have come to recognize investments management as our second core business that requires better attention and management focus. We have over-relied on the stock market in the past and we plan to diversify our investment portfolio to ensure less fluctuation in our earnings. In this regard we have already signed contracts for two property developments; a 22 storey UAP Tower in Nairobi at a construction cost of Shs 2.5billion and a four block UAP Business Park in Kampala, Uganda, at a price of US $ 21million (approximately Shs 1.7billion). When these two developments are complete in 2013 we shall have an assured rental income of at least Shs 600milliion per year. Besides properties, we intend to diversify further to other forms of investments including private equity. We will rely on our partnership with associate and other companies with a pipeline of robust opportunities that promise handsome returns.
During the year we completed the acquisition of an asset management company now renamed UAP Financial Services based in Uganda. This company is involved in providing financial advisory services, assets management and securities trading. We intend to build this company into a fully fledged assets management company that will help us tap into this important segment of financial services to manage and grow our own investments and manage assets on behalf of others at a fee.
We are acutely aware of the potential in bancassurance and hence the need to integrate our insurance business with a bank. We have explored various choices,
held discussions with potential partners and even though we have not concluded any alignment we hope to do so in the next one or so years.
Our business has continued to grow and our company has continued to accumulate a lot of wealth. We are conscious that shareholders would like to have opportunities to realize this wealth or use it to secure appropriate financing for their investment activities. In order to meet these expectations the Board has resolved to seek an Initial Public Offer (IPO) and a listing of the company at the NSE. This will enhance the brand profile of UAP, enhance corporate governance and in addition ensure UAP’s full compliance with the new regulations on maximum shareholding by an individual shareholder.
We are fortunate to have invested in the two countries in our region that have oil; Uganda and Southern Sudan. This is an industry that presents immense opportunities on our underwriting business. We shall obtain the necessary skills and expertise to exploit these opportunities.
Ultimately we can have the best laid plans and resources. Their full utilization depends on our human capital. We have brought into the company excellent talent in all key areas. We shall continue to invest in them to assist them reach their excellence and grow our business significantly. The board has already put in place a bonus policy that will ensure effective reward to staff for good performance. The board had also approved the establishment of an employee share ownership scheme to align our people’s interest with the company. This may now be combined with the proposed listing.
AppreciationI would like to thank our shareholders for their continued support, my fellow directors for their wise counsel and the Management and staff for their hard work that is taking our Company forward.
I look forward to a great and prosperous future for UAP.
Dr. JB Wanjui CBSChairman15 April 2011
U A P H O L D I N G S L I M I T E D21ANNUAL REPORT & FINANCIAL
STATEMENTS FOR THE YEAR ENDED 31 DECEMBER 2010
Chairman’s Report (continued)

Chairman’s Report
James Muguiyi & Akwe
am delighted to present to you a review of our company’s operations during the year.I
22 Group Managing Director’s Report
Global viewIn my last year’s statement we were upbeat about a rebound in our economies but we were worried about how far the crisis in Greece was going to go and its impact in reversing the expected recovery. In the end the Greek crisis did not escalate into a full blown Euro zone crisis and Spain and Portugal the next distressed countries at that time largely survived. Instead it was Ireland that would go into distress later in the year which also did not escalate to other countries. It is fair then to say that the global recovery we expected then was not misplaced. Indeed the US, the engine of the world economy grew by an incredible 3.9% in 2010 coming out of negative growth only a year earlier. China clocked 8.1% but Euro zone has been disappointing at less than 2%.
Against this backdrop our projections of accelerated growth in Kenya and in Uganda have been met. Kenya has grown by 5.2% against our projections of 5% and Uganda by 6.9% against our projected 6%. This growth is expected to continue with a target of 6% in Kenya in 2010 and 7.2% for Uganda. There are emerging risks to this expectation particularly the impact of the ongoing Middle East and North Africa political and civil rights protests resulting in escalating oil prices and hence inflation. As expected the financial markets rebounded in the year and interest rates remained relatively low. The Nairobi Stock Exchange, the regions premier stock exchange recovered to post a growth of 37%. This presented a good opportunity for UAP to recover ground lost in 2008 and 2009. The property market remained vibrant with existing property values growing and continued opportunities for investments in property in all the three countries we operate in. The downside is the escalating price of building materials.
The Insurance industry in the region also saw significant developments. Efforts to introduce discipline have continued. In Kenya the “No Claims Discount” (NCD) rating in the Motor Class seems to have held well in the first year of operation. The Insurance Regulatory Authority (IRA) has also intensified compliance checks against the listed risks pricing and other industry stabilising activities like enforcement of Cash and Carry rules. Indeed the Authority has declined to renew licences for many brokers and delayed licences for a few insurance companies. This should continue to build discipline. In Uganda the Insurance Commission has also struggled with introduction of minimum rates and compliance with them. The downside has been that some companies filed minimum rates below their existing rates and this may have opened new frontiers for the destructive price undercutting that the market has suffered from. In both countries the industry associations, AKI in Kenya and UIA in Uganda, have provided leadership in improving industry conditions. An
emerging theme is the shifting in competition from price to other areas led by a few companies, UAP being one of them. There has been innovation around products, distribution mechanisms and in branding activities.
Against this background UAP has responded well and delivered satisfactory results to shareholders for 2010. Total revenues have grown by 28% to Shs 5.8 billion. All the companies have registered growth with UAP Life achieving a growth of 57%, UAP Sudan 23%, UAP Uganda 22% and UAP Insurance Kenya by 26%. Total profits have grown almost 3 times over last year on the back of better underwriting results and investment income. Other comprehensive income has grown by nearly Shs 1 billion on account of the positive revaluation of our shares at the stock exchange which we do not account under profit based on our business model following our early adoption of IFRS 9. Our total assets have also grown by 28% and net assets, the shareholder book worth, have also grown by a similar margin.
During the year we also continued our efforts to establish Group Shared Services beginning with IT Services. We have now also established group Human Resources and Risk Management and Internal Audit. A further addition to the Group is UAP Financial Services, an acquisition in Uganda whose main activities will be provision of financial advisory services, assets management and stock broking not just for our business in Uganda but as a vehicle for us to enter the assets and investments management business in all the countries in which we shall be operating.
Industry reviewThe biggest drivers of changes in the industry in the last few years and particularly in 2010 were the regulations in each of the countries; the industry associations and to a great extent individual companies that have chosen to adapt to the environment with various innovations. The regulators are asserting themselves more to stabilize the industry, ensure sustainability and eliminate risks of corporate failure that have dented the industry’s reputation in the past. The industry associations are trying to find ways of managing issues of common interest such as industry research and industry wide co-operation mechanist like data sharing. Individual companies have responded with relevant innovation to widen the choice for customers and therefore make insurance more relevant to people’s lives. Below are some of the specific industry initiatives in each of our markets.
Kenya insurance industry reviewTwo more companies were licensed in the market growing the total number to 44. No consolidation has happened as was expected and instead some companies
U A P H O L D I N G S L I M I T E D23ANNUAL REPORT & FINANCIAL
STATEMENTS FOR THE YEAR ENDED 31 DECEMBER 2010
Group Managing Director’s Report (continued)

have de-merged their life and general businesses including UAP and Blue Shield. It is widely expected that more companies will follow suit. Although the industry is growing the current industry premiums of Shs 65billion is too little for 44 companies. The market needs to grow significantly faster or companies will need to consolidate.
The Insurance Regulatory Authority (IRA) has continued to assert its authority most times positively following their establishment in 2007. This is what the industry asked for and certainly IRA has not been disappointing except that they have not moved fast enough on some areas. The best positive case in point is the introduction of the NCD rating for Motor insurance which is helping turn around the fortunes of many companies and introduce discipline to our driving public by linking claims experience with cost of motor insurance. IRA has also been keen on enforcing other key provisions of the Insurance Act such as the Cash and Carry Rules and the rating of large risks. IRA is also leading in the review of Insurance Act and although results are yet to be seen, it has indicated a strong desire to facilitate establishment of new distribution mechanisms. In this regard, IRA has licensed a number of bancassurance agencies and indicated willingness, not yet backed by action, to facilitate other distribution channels like shop keepers and motor service stations.
Following research by AKI in 2007 on the uninsured market and in 2010 on alternative distribution channels, a few companies have responded well with innovation in products and establishment of Bancassurance distribution partnerships. AKI is further leading the market in the establishment of an integrated Motor insurance database that should assist in controlling fraud which has been a big problem in the Motor class that constitutes over 40% of the total general insurance premiums.
UAP has not been left out and our effort to innovate in products has continued. After introducing PoliSure cover for political violence and terrorism and TravelSure for travel insurance we have now developed an innovative solution for small scale farmers with Kilimo Salama a weather index based insurance cover for farmers which has received worldwide acclaim. This has been developed in partnership with Sygenta Foundation for Sustainable Agriculture, Safaricom and other partners. An almost similar product for pastoralist farmers is also available as an Index Based Livestock Insurance cover developed in partnership with ILRI and Equity Bank. We have also introduced Events Insurance and one of the big events we covered was the All Africa Athletics Championships in Nairobi in early 2010.
In Life insurance, we developed Elimika, a unique education plan that guarantees fees for children to attend college. This guarantee is covered by tangible assets whose maturity values are tied to the guarantee. It has proved very popular not only for our clients but our staff as well which means we are selling what we ourselves are consuming – a powerful selling tool to convince our customers.
Uganda insurance industry reviewThe Industry continued to grow well ahead of GDP and penetration has begun to edge towards 1% of GDP. Two more companies were licensed in 2010 bringing the total number to 23. General Insurance still comprises about 90% of total premiums. The Uganda Insurance Association has invested in a public awareness and education campaign. This is what the industry needs to grow penetration. This effort has received a boost from the Bank of Uganda through the Financial Markets Development Plan. On its part the regulator, the Uganda Insurance Commission, led in the publication of the long overdue Insurance (amendment) Bill 2010. Although it is expected to give a boost to the industry, some of the provisions like the de-merger of life and general business is likely to stifle growth as the size of the market is possibly not big enough to accommodate this change. A further boost is likely to come from the Uganda Retirement Benefits Authority Bill 2010 which has been tabled but not concluded by Parliament. If enacted, after being in the works for such a long time, it will liberalise and open up big opportunities in the pensions industry which has so far been reserved for the state pension administrate the NSSF.
In this environment UAP Uganda has continued to grow its business. In particular Life business has grown by 109% to reach UShs 6 billion (Shs 200 million) which is comparable to UAP Life Assurance in Kenya of Shs 371 million.
Sudan insurance industry reviewBeing a young market, the industry in Southern Sudan is still under the regulation of the Bank of Southern Sudan (BOSS). An Insurance Bill has been proposed which, when enacted, will give fresh impetus to the industry. In the meantime BOSS has introduced an insurance section which will help matters as the Act is enacted and operationalised. The Association of Southern Sudan Insurers (ASSI) was registered with initial membership of three which includes UAP.
In a nascent industry and country like South Sudan, insurance penetration is very low. There is low awareness and low economic activity. Without an effective
U A P H O L D I N G S L I M I T E D 24ANNUAL REPORT & FINANCIAL STATEMENTS FOR THE YEAR ENDED 31 DECEMBER 2010
Group Managing Director’s Report (continued)
regulation there are some players who are not registered and there are many risks that are insured outside the country. There was little growth in 2010 and as a result the only big class, Motor, faced significant price undercutting. In addition to this, there are no claims service providers such as motor loss assessors and loss adjusters or risk surveyors. This means that UAP has to import these services at great cost. Despite this state of affairs UAP Sudan grew volumes by 23% to over US$ 5M. To expand the market share UAP has introduced medical insurance in 2010 and continues to expand its branch network.
Investment marketsThe recovery in the regional economies also led to a recovery in investments markets particularly the stock exchange. The NSE grew by 37%. Property market also continued to be vibrant and despite more investments in this area property prices continued to grow. The downside was in the decreasing interest rates which mean that the statutory holdings in government and other instruments earned less income. Interest rates are expected to increase in 2011.
Business performanceIn 2008 our total business crossed the Shs 3 billion mark. In 2009 we crossed the Shs 4 billion mark. In 2010 we fell just short of Shs 6 billion and achieved revenues of Shs 5.8 billion. This excludes Shs. 550 million of investments and deposit administration premiums not recognised as premiums under the International Financial Reporting Standards. Ours is an impressive growth as shown in the five year highlights on page 30. Of special note is the growth in Life premiums in both Kenya and Uganda at 57% and 217% respectively. We have therefore gained significant market share while remaining profitable. In Kenya we have managed to secure a strong and close number 3 in general insurance market share and in Uganda we remain a firm number three. In Sudan where statistics are hard to come by we believe we command a large market share of locally underwritten premiums. In effect we are one of the top two insurance players in the region and growing steadily to the top of the pecking order.
The many factors to consider in running insurance business makes the business complex and we are constantly looking into these ratios to ensure we create maximum value for our shareholders.
UAP Insurance, KenyaThe total written premiums grew by 26% to Shs 3.9 billion. This business has registered impressive growth in volumes growing two and half times in five years
from Shs 1.6 billion in 2006 to Shs 3.9 billion in 2010. This growth has enabled UAP Insurance to crawl its way up from market share of under 5% to about 8% and from number 7 to number 3 in market share.
As volumes grew profitability also grew from Shs.181 million in 2009 to Shs.446 million in 2010. Underwriting profit grew from Shs 6 million in 2009 to Shs 105 million in 2010. This is the result of net claims declining from 53% in 2009 to 43% in 2010. The largest contribution to the good underwriting profit was from the general business. Medical had a less than excellent performance with a reduced contribution to profit arising mainly from escalating medical costs to which the company could not respond immediately. This was in line with the experience of other companies in this sector. We developed a revised rating table which together with revamping of the medical team will lead to a recovery of this class going forward. The motor class registered a combined profit of Shs 34 million compared with a loss of Shs 125 million in 2009. This was due to the new risk based NCD rating. Motor Private insurance continues to pose a major threat to the profitability of insurance companies.
UAP Life Assurance, KenyaTotal premiums grew by 52% to Shs 317m. Investments income grew by 263% to Shs 450m reflecting partly the recovery of the Nairobi Stock Exchange and rental income. Despite this good performance on the income side the company returned a loss of Shs 44m which was better than the Shs 109m registered last year. The business is taking a good shape following demerger from UAP Insurance in 2009. The loss reflects the strain of a growing life book whose value is realised with maturity. Future growth in insurance is in life business and with better capitalisation UAP Life will continue to grow towards profitability.
UAP Insurance, UgandaTotal premiums grew by a healthy 38% in Uganda Shillings to cross the Shs 1 billion mark for the first time at Shs 1.2billion. Life premiums grew by 117% and general premiums by 33%. This growth is attributed to the company’s ability to harness opportunities in growing sectors of the economy mainly in telecommunications, oil exploration and infrastructure. It also reflects the growth in Life business and introduction of medical business.Profit before tax grew by 188% from Ushs 3.5billion to Ushs 10billion the highest profit the company has ever achieved. This was mainly due to favourable movements in unearned premium reserves, reduction in commissions arising from deferred acquisition costs and significant increase in investment and other income by 240%. In addition the capping of Motor claims
U A P H O L D I N G S L I M I T E D25ANNUAL REPORT & FINANCIAL
STATEMENTS FOR THE YEAR ENDED 31 DECEMBER 2010
Group Managing Director’s Report (continued)
under the law has greatly helped. As a result underwriting profit grew by 126% to Ushs 6 billion.
UAP Insurance, SudanThe premium growth trend continued with a growth of 23% compared to 28% in 2009 to reach US$5m. Net claims ratio increased to 20.4% from 17.3% in 2009. Underwriting profit declined by a bigger margin from US $849,000 in 2009 to US$396,000. This was primarily due to increase in management expenses which although within budget grew at a higher rate than premiums. The main areas of the increase was on staff costs as we strengthened the team, future strategies of opening two new branches and the brand awareness campaign all of which we believe were necessary and from which we shall reap the benefits in future. Overall profits closed at US$506,000 compared to US$976,000 in 2009
Operating performanceUAP remains a strong leader in customer service improvements. Our philosophy is that customers are willing to pay for what works and the rush to undercut prices is not only short sighted but it is wrong and unsustainable. We have therefore invested heavily in improving our customer service experience. For us this means having the relevant products to the customers where they are and when they need them in line with our corporate mission. It also means interacting with customers in the language they understand and in ways that fit their convenience. This is best exemplified in our brand essence of simple relevance which we believe will meet our desired results for our customers, ‘Better. Simple. Life.’
In this regard, we have continued to make further investments to improve our customers experience in all the markets we operate in. In Kenya, we have eliminated paper work by transferring all our major business processes to electronic document management system. All our files are now electronic and our staff work electronically. This has improved our efficiency and enabled centralization of common business processes.
We subjected our new processes to an audit under ISO standards and we achieved an upgrade of our ISO certification to ISO 9001:2008. In addition, we have led the industry in innovation of products with some of the best examples being Kilimo Salama; a weather index small scale agriculture insurance, TruckSure for owner of commercial vehicles, BiasharaSure for SME’s and KilimoSure for larger scale farmers. In addition, we have now developed AfyaImara, a revolutionary individual
medical insurance product covering both inpatient and outpatient medical costs and which also extends treatment in India.
These are in addition to other exciting products that we have delivered in the market in the recent past including events insurance, political violence, terrorism and sabotage insurance and travel insurance. In life we developed Elimika, a unique education plan that guarantees amounts of fees for children on reaching the insured age. We are making these products available in our other two markets as and when a market arises.
In order to get these excellent products to our clients conveniently, we have also expanded our branch network to 10 and to another 10 satellite branches in Kenya. The number of branches in Uganda is 5 and 3 in Southern Sudan. We have also spent considerable time and resources supporting our intermediary partners with training and motivation in order to assist them reach more clients.
In Uganda, UAP is committed to being the point of reference for best quality service in the industry. It has continued to invest in customer care programs to achieve world class service delivery standards and is ISO 9001:2000 certified. In addition, UAP has been recognised severally by the brokers association for its excellence during their annual awards.UAP Sudan continues to improve their processes to set high bench marks in a nascent market. We have invested in better connection to the Wide Area Network (WAN) connecting UAP Sudan to our offices in Nairobi and this has greatly improved the company’s operations.
Expenses managementTotal expenses grew by 34% to Shs 1.6 billion. A big part of this increase was in growing our brand in all three countries, increased expenditure on ICT to improve our customers experience and our continued efforts to build one of the best talent pools in the market by attracting high quality staff who now come at a premium given the increasing competition of talent as the economies expand rapidly. We believe that our investments will bear great fruits in the years to come and set us apart as the premier insurance group in the region.
Our peopleWe continue to grow our staff through training and motivation. Many of our managers have received high quality training and we have also developed a
U A P H O L D I N G S L I M I T E D 26ANNUAL REPORT & FINANCIAL STATEMENTS FOR THE YEAR ENDED 31 DECEMBER 2010
Group Managing Director’s Report (continued)

performance management system that sets out smart performance benchmarks which when achieved result in handsome rewards for our people. As we build the good talent, we have become a target by our competitors for talent, even those that do little to develop their own talent. A few of our people have left to take up much higher positions in other companies. We have been able to attract even better talent and reinforce areas we felt we were weak in. We continue to believe that we have the best talent in the market today that will continue to transform UAP into a great organisation.
AchievementsWe continued to record various achievements with some of the highlights in 2010
being;• We became fully paperless in all our key operations in the general insurance
business in Kenya.• We upgraded our quality management system during the year in Kenya and
obtained certification to the higher ISO 9000:2008 standard. We also maintained our ISO Certification in Uganda.
• We also retained our strong credit rating; AA- in Kenya, which is the highest rating in the region and A+ in Uganda which is a very good rating on which our customers should draw confidence.
• We won the FiRe (Financial Reporting) award again for the best presented accounts in the insurance sector. We have won an award at these awards every year since inception 9 years ago.
Future prospectsWe are encouraged by the economy’s recovery in 2010 and the anticipated growth in 2011 and beyond. We are however conscious of the risks to this growth. The North Africa and Middle East crisis currently ongoing, the risk of drought in Kenya and possible inflation and rising interest rates in our markets. The silver lining is the positive developments in the political environment particularly in Kenya and South Sudan. We therefore see increase in growth of our business. We have laid out good plans to take advantage of these opportunities. In order to improve underwriting results we will continue to be cautious in our technical decisions. We will monitor both Medical and Motor Private rating in Kenya and guard against price undertaking in Uganda and Sudan by remaining focused on profitable rates. In all markets we will continue to invest in claims management procedures to ensure we pay only genuine claims.Our customers deserve the best service and we will continue to work hard to deliver this to them. We will make more exciting products available to our clients
and invest in more innovative distribution channels to supplement current market efforts. We recognise that Investments is our second core business. In this area, we shall establish capacity to manage our investments more profitably and also seek partnerships with investment associates and other companies to identify and exploit the excellent investment opportunities arising from the growing economy. In particular we look forward to the completion of the two main property developments in Kenya and Uganda with a total built up area of over 500,000 square feet to start earning a better rental yield. As the region grows, we shall exploit more opportunities to reach more markets. We are now setting up in DRC and look forward to setting up in Tanzania, and later, hopefully seek opportunities in Rwanda.
AppreciationI would like to thank all our staff for the commitment and effort made in achieving the good performance. I also recognise and appreciate the Board’s input and guidance in running our business. I would like to pay tribute to our business partners and particularly intermediaries who continue to support us in a great way. We appreciate this and assure them of our reciprocal support too.
Finally I thank our shareholders for their continued support.
JN MuguiyiGroup Managing Director15 April 2011
U A P H O L D I N G S L I M I T E D27ANNUAL REPORT & FINANCIAL
STATEMENTS FOR THE YEAR ENDED 31 DECEMBER 2010
Group Managing Director’s Report (continued)

The UAP Group is committed to adhering to the highest standards of good corporate governance at all levels of its operations. This commitment is rooted in our core values and beliefs. We have put in place elaborate governance processes which comply with best practice as set out in various codes on Corporate Governance.
Board of directorsBoard charter and work planThe Board Charter contains provisions that ensure that the Board observes best practice in corporate governance and contains among other things; the size, role and functions of the Board; appointments, induction and tenure of directors and Board performance evaluation and remuneration of directors. The Work Plan has a formal schedule of matters specifically reserved for the Board’s attention to ensure it exercises full control over all significant matters. It sets out the schedule of meetings of the Board and its committees and the main business to be dealt with at those meetings. Additional meetings are scheduled when need arises.
Board composition and appointmentsThe Board consists of seven directors, one of whom are executive and six are non-executive. Three of the non-executive directors are also considered independent directors. The Board is composed of directors with a good mix of skills, experience and competencies in the relevant fields of expertise and is well placed to take the business forward. Appointments to the Board are made after careful consideration of these factors. All directors have a fixed tenure of office and are required to retire at least every three years with a provision for re-election. Detailed information on directors, their qualifications and experience is provided on page 5 - 9.
Board meetings; information for directors and board performance evaluationThe full Board meets at least four times a year. The Board deals with all significant matters including strategic direction for the Company and Group; ensuring competent management of the business; internal control; compliance with laws and regulations and reporting performance to shareholders.
The directors are given appropriate and timely information on key activities of the business regularly and on request in order to carry out their roles. Specifically the directors are provided with all available information in respect of items to be discussed at a meeting of the Board or committee prior to the meeting. They may also seek independent professional advice, at Company expense, concerning the
affairs of the Group in consultation with the Group Managing Director and the Group Company Secretary. The Board regularly commissions a board performance evaluation that is done independently by a certified professional organisation and the report is used to improve the Board’s performance.
Separation of role of chairman from chief executiveThe Group Chairman is responsible for managing the Board and providing leadership to the Group while the Group Managing Director is responsible to the Board for strategically overseeing and managing the business units in the UAP Group in accordance with instructions given by the Board. The Group Managing Director directs the implementation of Board decisions and instructions and the general management of the business units with the assistance of the chief executives and management teams.
Conflicts of interestThe directors of the company are under a fiduciary duty to act honestly and in the best interests of the Company. UAP has put in place a policy to ensure that directors avoid putting themselves in positions where their self interests’ conflict with their duty to act in the best interests of the Company and make an annual written declaration of any conflicts that may have arisen in the year. This policy provides that directors, their immediate families and companies where directors have interests must not transact business with UAP without express approval from the Board. Any such business transacted with UAP must be at arms length, fully disclosed to the Board which must consider and approve it. A director must refrain from discussion or voting on matters of potential conflict of interests.
Committees of the boardThe Board is fully cognizant of the fact that it is ultimately responsible for ensuring that the Company remains a going concern at all times. That it must exercise full control of the Company and direct and control the management in the implementation of key decisions affecting the Company or its business. The Board has an approved annual work plan and a Board Charter that enumerates the roles, responsibilities and powers of the Board and provides for the delegation of authority to the Committees of the Board in order to deal with:-
• Strategy and Planning;• Staffing;• Remuneration;• Capital Management and Financial Reporting;
U A P H O L D I N G S L I M I T E D 28ANNUAL REPORT & FINANCIAL STATEMENTS FOR THE YEAR ENDED 31 DECEMBER 2010
Corporate Governance Statement

• Performance Monitoring;• Risk Management; Audit & Compliance;• Board Processes and Policies.
In order to discharge its mandates and responsibilities effectively, the Board has delegated certain tasks to the Committees. The Management of the Company including the subsidiaries, the Group Company Secretary and the Group’s auditors are under clear instructions to provide information, explanations or documents required by the Committees in order to ensure that they cover their mandates to the extent necessary for informed decision making. During the year under review, the following Committees were in place.
Finance and Investments CommitteeMr. James Mworia - ChairmanDr. JB Wanjui - MemberMr. CJ Kirubi - MemberMr. JN Muguiyi - Member
Nominations and Compensation CommitteeMr. Philip Coulson - ChairmanMr. CJ Kirubi - MemberMr. James Muguiyi - Member
Audit, Governance, Risk and Compliance Committee.Mr. Kamau Kuria - ChairmanMr. James Mworia - MemberSir Gordon Wavamunno - Member
Conduct of Business and Performance ReportingThe Group’s business is conducted in accordance with a carefully formulated strategy, annual business plans and budgets which set out very clear objectives. Roles and responsibilities have been clearly defined with approved authority being delegated. Performance against the objectives is reviewed and discussed monthly and quarterly by the management teams in the Group. The Chief Executives and their respective Management teams prepare annual business review report which is presented to the Group Strategy and Finance Committee. Any issues arising are discussed by the full Board. In this way performance trends, forecasts as well as actual performance against budgets and prior periods are closely monitored.
Compliance with lawsThe Board is satisfied that the Group has, to the best of their knowledge, complied with all applicable laws and conducted its business affairs in accordance within the law. To the knowledge of the Board no director, employee or agent of the Group acted or committed any indictable offence under the Anti Corruption laws in conducting the business of the Group nor been involved or been used as a conduit for money laundering or any other activity incompatible with the relevant laws.
Group Company SecretaryAll members of the Board have direct access to the Group Company Secretary who is responsible for ensuring that all board procedures, corporate governance policies, rules and regulations are followed.
Accountability, audit and shareholder relationsThe Board recognises its responsibility to present a balanced and understandable assessment of the Group’s financial position and prospects. The Group’s financial statements are prepared in accordance with International Financial Reporting Standards (IFRS) and the requirements of the Companies Act and are audited in accordance with International Auditing Standards. The directors recognise and have confirmed their responsibility over the financial statements and have provided other information in this annual report that they consider useful to shareholders and other stakeholders.
All shareholders are invited to the Annual General Meeting and are free to put questions to the Board and the auditors on matters concerning operations and financial statements of the Group. During the year the Board held a shareholders’ briefing session which is intended to be a regular event so as to explain the direction the Company is taking and obtain shareholders views and ideas. This has enriched the company in a great way.
U A P H O L D I N G S L I M I T E D29ANNUAL REPORT & FINANCIAL
STATEMENTS FOR THE YEAR ENDED 31 DECEMBER 2010
Corporate Governance Statement (continued)

ShareholdingAt 31 December 2010, the top ten shareholders in the Company were: No. of Holding Shares %1 Bawan Limited 43,009,033 35.84%2 Centum Investment Company Limited 29,070,637 24.23%3 CJ Kirubi 20,260,683 16.88%4 JN Muguiyi 12,631,507 10.53%5 WK Martin 3,495,480 2.91%6 ASG Smith 1,774,368 1.48%7 TMJ Owen-Burke 1,369,758 1.14%8 Sayani Investments 1,194,957 1.00%9 Kikagi Limited 1,060,758 0.88%10 Joseph Kiplangat Lesiew 940,098 0.78%
The shareholders profile as at 31 December 2010 was as follows: No. of No. of Holding Shareholders Shares %Kenyan individual investors 21 45,664,615 38.05%Kenyan institutional investors 4 74,335,385 61.95% 25 120,000,000 100.00%Shares range10,001 to 100,000 3 121,271 0.10%100,001 to 1,000,000 13 6,011,548 5.01%Above 1,000,000 9 113,867,181 94.89% 25 120,000,000 100.00%
The directors’ direct and indirect interest in the ordinary share capital of the Company on 31 December 2010 was as follows:
1 Dr JB Wanjui CBS 43,009,033 35.84%2 Centum Investment Company Limited 29,070,637 24.23%3 CJ Kirubi EBS 20,260,683 16.88%4 JN Muguiyi 12,631,507 10.53%
The total number of shareholders at 31 December 2010 was 25 (2009: 25).
Dr JB Wanjui CBS (Chairman) JN Muguiyi (Group Managing Director)
U A P H O L D I N G S L I M I T E D 30ANNUAL REPORT & FINANCIAL STATEMENTS FOR THE YEAR ENDED 31 DECEMBER 2010
Corporate Governance Statement (continued)

Sustainability UAP Holdings recognizes the fact that for any business to survive it has to engage in sustainable business practices.
We remain committed to ensuring that the interests of our shareholders, employees, clients and the society in which we operate are taken care of.
We carefully assess the probable impact of all our decisions and activities on these stakeholders beyond profits, dividends and other financial factors in the short, medium and long term.
Industry sustainabilityAs a prominent industry player, we play a central role in supporting its sustainability. This being a critical contributor to the economy, we believe in injecting and maintaining a high level of compliance and cooperation with the industry regulator and the umbrella industry association AKI.
Even before the current push by the regulator to simplify the language in policy documents, UAP undertook to lead by example, decoding much of the wording for our customers. We also set up a fully fledged customer service department at the Head Office that is primarily dedicated to responding to customer queries of all forms. Besides we are keen to contribute to industry human capital development by training our staff and intermediaries both locally and overseas. In addition we continue to develop products and value added services to address the dynamic needs of the growing market.
We continue to use our advertising and public outreach activities to educate and empower the public about insurance. We have also enhanced our efforts to educate the public on ways and means of combating fraud.
And in view of the need to review and update the regulatory framework for the industry we have made considerable contribution through various avenues on what we see as the elements that are crucial for the sustainable growth of insurance in the region.
To this end we are actively pursuing efforts to educate the society to develop risk awareness. There are a number of initiatives that we have put in place to address this area of concern.
There is an inherent cost to society and our business when risks are not consciously addressed. For us this remains a core pillar of our vision of sustainable business. As we forge ahead with these initiatives it is our hope that other industry players will see it as we do.
Ethics and integrity UAP believes that integrity is the cornerstone of our collective common sense and lends great credence to the skills, abilities and commitments of our people.
We strive to deal ethically and transparently with our clients, staff, partners and suppliers. In this regard we are committed to increasing customer satisfaction by providing them with quality products and services that we innovate to respond to their needs and enhance the quality of their lives.
We treat our suppliers fairly, objectively and honestly.
We believe in treating our employees in a fair and even handed manner while fostering a culture rich in diversity but based on teamwork, integrity, trust and mutual respect. As a business we aggressively pursue growth and profitability while maintaining ethical standards in all our activities.
Health safety and employee welfare The Group considers the health and safety of the employees, customers and members of the public very important.
We therefore subscribe to the highest possible level of practical standards of health and safety.
In addition we also appreciate the need to proactively manage the issue of HIV/AIDS.
To address it, the group has in place a structured HIV/AIDS and wellness policy. The total annual cost of this program has been maintained at Shs 5 million and it is built on the principal of non discrimination.
In 2010 we spent a total of Shs. 23 million on staff welfare including Shs. 5 million on training. Indeed, at the Head Office we have since set up a refreshment area where we hold occasional informal cocktails for staff and which also serves as a kitchen area for our staff.
U A P H O L D I N G S L I M I T E D31ANNUAL REPORT & FINANCIAL
STATEMENTS FOR THE YEAR ENDED 31 DECEMBER 2010Sustainability and Corporate Social Responsibility Report

We also maintain a policy of an equal opportunity employer, giving all qualified people a chance to join UAP and once they are on board, ensure that they all have fair terms of engagement and quality training.
As we move towards the eventuality of being a publicly listed company, we are already in the process of setting up an Employee Share Ownership Scheme (ESOP).
Corporate social responsibility We aim to minimise the impact of our business on the environment, have a positive effect on society and the environment, and seek to work with other organisations who embrace these objectives.
We aim to use natural resources responsibly, work with communities and encourage and educate our employees on these goals.
We recognise that our Company has the potential to make a significant impact on its staff, customers, society and the environment.
We aim to comply with and where possible, exceed all current environmental legislation and meet all other requirements to which we subscribe. We are committed to a process of continual improvement, including the ongoing assessment and reduction in use of paper and reduction of pollution.
We inform our customers and suppliers of our activities and where possible, work with them to achieve the desired aims. We seek to work with other local organisations to share ideas and help develop our management systems.
We act as a responsible member of the local community and consider our impact on it, in particular with regard to our office location and employees’ movements to and from the office, and seek to recruit new staff and work with new suppliers where the local community will benefit most strongly.
Environmental conservation Our aim is to contribute to the sustainable conservation of our environment. To this end we have for the past six years been planting trees around the Ndakaini water dam in Thika district. This dam provides over 70% of clean drinking water to Nairobi’s three million residents.
In an annual exercise that involves our staff, the local community and our partners we have so far planted over 70,000 trees. Our target is to plant 250,000 trees in the area. Every year in April, our staff and with involvement of the local community converge around the Ndakaini dam to plant trees. We have already done this for 2011.
We are involved in these initiatives from a business perspective. It is important to note that the scarcity of water has both an economic and social cost and as an insurance company we are aware of the need to mitigate any risks that may exacerbate these costs.
Ndakaini Marathon The tree planting exercise we engage in annually is closely tied to a flagship athletics event that takes place later in the year. The UAP Ndakaini Half Marathon is an event that serves to highlight the plight of the Ndakani Dam and draw support by other organizations. We also aim to use the marathon as an instrument of building sports talent and support our youth reach their potential. The event, in its sixth year has proven very successful, attracting increasingly larger numbers of athletes and spectators. It has produced great talent that has gone on to dominate athletics around the world.
Supporting rugby development In line with our drive to support sports development among the youth, we increased our involvement in sports particularly in Rugby. UAP sponsored the Bamburi Rugby Super Series to the tune of Shs. 1.5 million. This sponsorship includes an insurance cover for the players against injury for the full year. The matches were held across East Africa and we were proud to contribute to a regional initiative like this. As part of the sponsorship, UAP was a shirt sponsor of the Rhino team that went on to win the highly exciting tournament.
Education scholarship UAP is a firm believer in educating children. As such, we have a deliberate policy to support needy and bright children to get an education. We have largely supported children at secondary school level for over ten years. We support a needy student each at Starehe Boys and Starehe Girls Centres every year and on a case by case basis of other students in other schools. The students we have supported have gone on to make great achievements in life and one was admitted to a prestigious
U A P H O L D I N G S L I M I T E D 32ANNUAL REPORT & FINANCIAL STATEMENTS FOR THE YEAR ENDED 31 DECEMBER 2010 Sustainability and Corporate Social
Responsibility Report (continued)

university overseas. Last year we extended our educational support to two children at primary school level. We will build on this program to reach more deserving cases in future.
Lollipop project Along the education lines, we also have a strong focus on maintaining the safety of children using our roads as they go to and from school. In this respect we have for the past few years consistently supported the Lollipop Project, a national program aimed at stationing uniformed marshals with prominent signs to aid school children cross the road at designated points usually next to their schools.
Urban renewal Our relationship with the community extends to the aesthetics. We have over the years ‘adopted’ a number of road islands at various strategic points in Nairobi and given them a fresh look of landscaping. Over the last three years, we have spent Ksh 3 million in our urban environmental conservation and preservation program, primarily landscaping the Hurlingham roundabout in Nairobi. Last year we expanded the program to include the Mbagathi Way roundabout. We will be adopting another roundabout in 2011.
Environmental clean up We have started a program to partner with local organizations and local authorities to maintain the cleanliness of the environment. To kick us off in this program was our Kisii branch which partnered with the Municipal Council of Kisii and the regional representative from the Ministry of Environment. The Mayor led the residents in cleaning up the town.
The environment is about our life and if we live in a clean environment we are all going to benefit. The essence of our approach is to engage in proactive risk management so that we do not end up in situations that require larger financial intervention such as insurance compensation. Indeed cleanliness is a responsibility for each one of us as individuals.
Other charities We were also involved in other philanthropic activities in which we supported various charities during the year. These included supporting the fund raising golf tournament for the Nyeri Hospice, donating and participating in the Kenya Diabetes Management Center Diabetes Walk and Golf and the Nairobi Hospital Children’s Fund fundraising golf.
We also sponsored the Mater Hospital Heart Run, the Diocese of Mt Kenya Boys School’s medical camp and golf tournaments in Nyahururu, Nyeri, Kisii, Nanyuki, Kitale and Muthaiga respectively.
JN Muguiyi Group Managing Director15 April 2011
U A P H O L D I N G S L I M I T E D33ANNUAL REPORT & FINANCIAL
STATEMENTS FOR THE YEAR ENDED 31 DECEMBER 2010Sustainability and Corporate Social Responsibility Report (continued)

2010 2009 2008 2007 2006 Shs ‘000 Shs ‘000 Shs ‘000 Shs ‘000 Shs ‘000
Gross written premium 5,818,851 4,526,058 3,746,777 2,895,322 2,303,848Gross earned premium 5,374,107 4,148,264 3,254,823 2,741,981 2,166,098Net earned premium 4,147,757 3,338,081 2,511,133 2,084,683 1,587,301Investment and other income 1,467,755 762,393 674,999 1,265,721 991,142Total income 5,615,512 4,100,474 3,186,132 3,350,404 2,578,443
Claims and policy owners’ benefits payable (2,424,829) (1,951,616) (1,133,110) (973,142) (835,533)Commissions and other operating expenses (2,397,257) (1,868,369) (1,606,758) (1,250,306) (928,415)Share of loss of associate (3,572) - - - -Profit before income tax 789,854 280,489 446,263 1,126,956 814,495Income tax expense (155,537) (80,737) (119,387) (183,071) (116,185)
Profit after income tax 634,317 199,752 326,876 943,885 698,310Non-controlling interests (150,602) (38,085) (46,651) (60,073) (21,135)
NET PROFIT ATTRIBUTABLE TO SHAREHOLDERS 483,715 161,667 280,225 883,812 677,175Other comprehensive income 531,304 (394,707) (738,181) (561,212) 1,468,945Total comprehensive income 1,165,621 (194,955) (411,305) 317,094 2,146,120Dividends 204,000 204,000 204,000 402,000 240,000Bonus issue - - - - 350,000Total distributions 204,000 204,000 204,000 402,000 590,000Total assets 12,393,002 9,827,091 9,430,394 8,477,090 7,527,876Total equity 4,399,183 3,445,910 3,853,409 4,671,898 4,534,781
Gross Earned Premiums
PREMIUM INCOME (SHS. MILLIONS)Net Earned Premiums
TOTAL ASSETS (SHS. MILLIONS)
0
2,000
4,000
6,000
8,000
10,000
12,000
14,000
2006 2007 2008 2009 2010
PROFIT (SHS. MILLIONS)
0
200
400
600
800
1,000
1,200
2006 2007 2008 2009 2010
Pro�t before Income Tax Pro�t after Income Tax
0
1,000
2,000
3,000
4,000
5,000
6,000
2006 2007 2008 2009 2010
U A P H O L D I N G S L I M I T E D 34ANNUAL REPORT & FINANCIAL STATEMENTS FOR THE YEAR ENDED 31 DECEMBER 2010
Five Years Financial Highlights
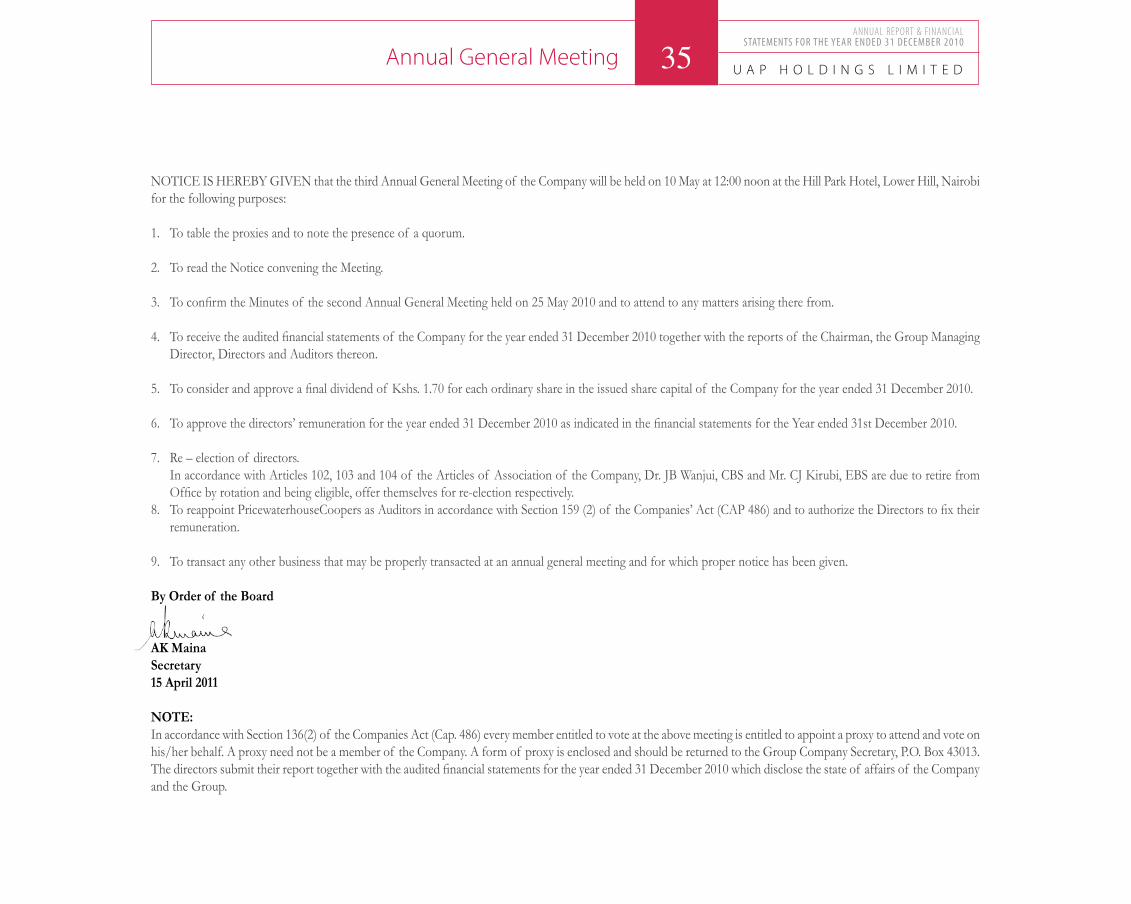
NOTICE IS HEREBY GIVEN that the third Annual General Meeting of the Company will be held on 10 May at 12:00 noon at the Hill Park Hotel, Lower Hill, Nairobi for the following purposes:
1. To table the proxies and to note the presence of a quorum.
2. To read the Notice convening the Meeting.
3. To confirm the Minutes of the second Annual General Meeting held on 25 May 2010 and to attend to any matters arising there from.
4. To receive the audited financial statements of the Company for the year ended 31 December 2010 together with the reports of the Chairman, the Group Managing Director, Directors and Auditors thereon.
5. To consider and approve a final dividend of Kshs. 1.70 for each ordinary share in the issued share capital of the Company for the year ended 31 December 2010.
6. To approve the directors’ remuneration for the year ended 31 December 2010 as indicated in the financial statements for the Year ended 31st December 2010.
7. Re – election of directors. In accordance with Articles 102, 103 and 104 of the Articles of Association of the Company, Dr. JB Wanjui, CBS and Mr. CJ Kirubi, EBS are due to retire from
Office by rotation and being eligible, offer themselves for re-election respectively.8. To reappoint PricewaterhouseCoopers as Auditors in accordance with Section 159 (2) of the Companies’ Act (CAP 486) and to authorize the Directors to fix their
remuneration.
9. To transact any other business that may be properly transacted at an annual general meeting and for which proper notice has been given.
By Order of the Board
AK MainaSecretary15 April 2011
NOTE:In accordance with Section 136(2) of the Companies Act (Cap. 486) every member entitled to vote at the above meeting is entitled to appoint a proxy to attend and vote on his/her behalf. A proxy need not be a member of the Company. A form of proxy is enclosed and should be returned to the Group Company Secretary, P.O. Box 43013.The directors submit their report together with the audited financial statements for the year ended 31 December 2010 which disclose the state of affairs of the Company and the Group.
U A P H O L D I N G S L I M I T E D35ANNUAL REPORT & FINANCIAL
STATEMENTS FOR THE YEAR ENDED 31 DECEMBER 2010
Annual General Meeting
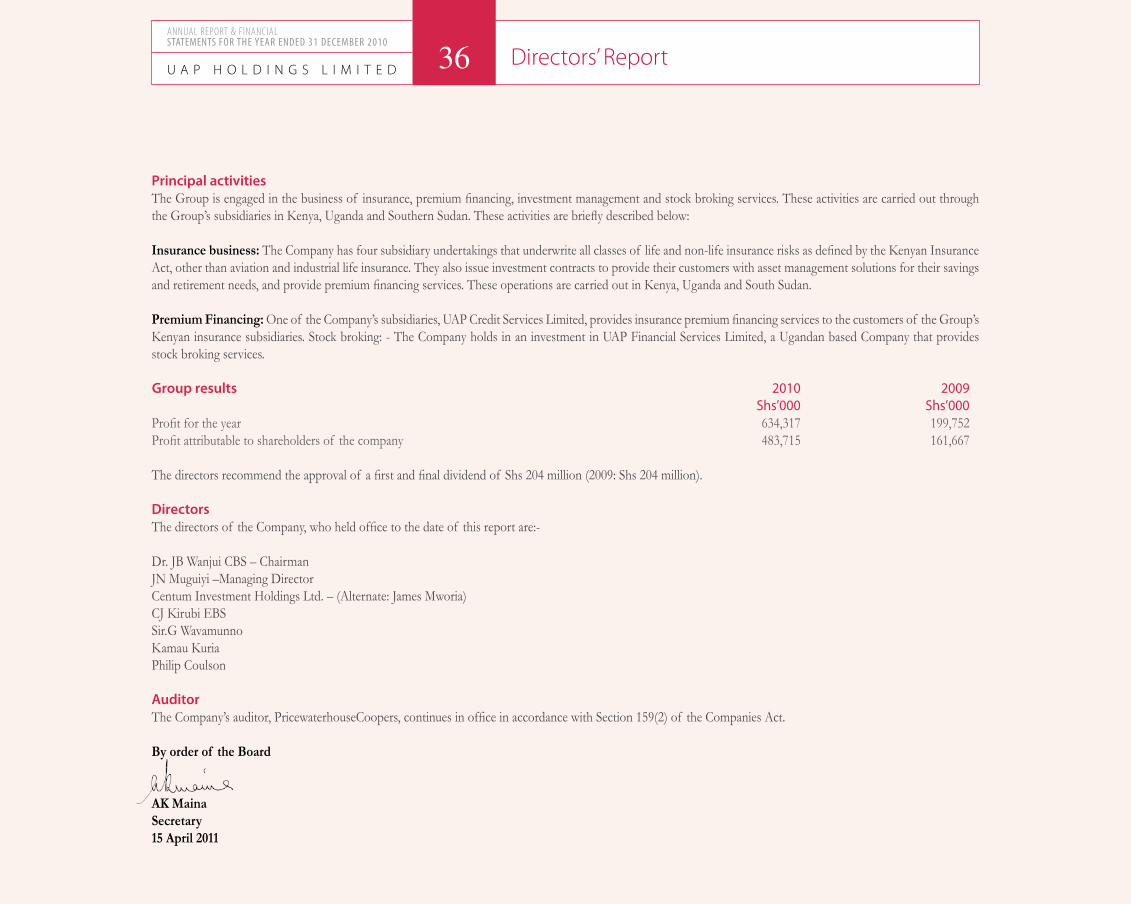
Principal activitiesThe Group is engaged in the business of insurance, premium financing, investment management and stock broking services. These activities are carried out through the Group’s subsidiaries in Kenya, Uganda and Southern Sudan. These activities are briefly described below: Insurance business: The Company has four subsidiary undertakings that underwrite all classes of life and non-life insurance risks as defined by the Kenyan Insurance Act, other than aviation and industrial life insurance. They also issue investment contracts to provide their customers with asset management solutions for their savings and retirement needs, and provide premium financing services. These operations are carried out in Kenya, Uganda and South Sudan.
Premium Financing: One of the Company’s subsidiaries, UAP Credit Services Limited, provides insurance premium financing services to the customers of the Group’s Kenyan insurance subsidiaries. Stock broking: - The Company holds in an investment in UAP Financial Services Limited, a Ugandan based Company that provides stock broking services. Group results 2010 2009 Shs’000 Shs’000Profit for the year 634,317 199,752 Profit attributable to shareholders of the company 483,715 161,667
The directors recommend the approval of a first and final dividend of Shs 204 million (2009: Shs 204 million).
DirectorsThe directors of the Company, who held office to the date of this report are:-
Dr. JB Wanjui CBS – ChairmanJN Muguiyi –Managing DirectorCentum Investment Holdings Ltd. – (Alternate: James Mworia)CJ Kirubi EBSSir.G WavamunnoKamau KuriaPhilip Coulson
AuditorThe Company’s auditor, PricewaterhouseCoopers, continues in office in accordance with Section 159(2) of the Companies Act.
By order of the Board
AK MainaSecretary15 April 2011
U A P H O L D I N G S L I M I T E D 36ANNUAL REPORT & FINANCIAL STATEMENTS FOR THE YEAR ENDED 31 DECEMBER 2010
Directors’ Report

The Kenyan Companies Act requires the directors to prepare financial statements for each financial year that gives a true and fair view of the state of affairs of the Company and the Group as at the end of the financial year and the Group’s profit or loss. It also requires the directors to ensure that the Company keeps proper ac-counting records that disclose, with reasonable accuracy, the financial position of the Company. They are also responsible for safeguarding the assets of the Company.
The directors accept responsibility for the annual financial statements, which have been prepared using appropriate accounting policies supported by reasonable esti-mates, in conformity with International Financial Reporting Standards and the requirements of the Companies Act. The directors are of the opinion that the financial statements give a true and fair view of the state of the financial affairs of the Company and of the Group and of the Group’s profit in accordance with International Financial Reporting Standards. The directors further accept responsibility for the maintenance of accounting records that may be relied upon in the preparation of financial statements, as well as designing, implementing and maintaining internal control relevant to the preparation and fair presentation of financial statements that are free from material misstatement.
Nothing has come to the attention of the directors to indicate that the Company and its subsidiaries will not remain a going concern for at least twelve months from the date of this statement.
Dr JB Wanjui CBS JN Muguiyi Chairman Group Managing Director15 April 2011 15 April 2011
U A P H O L D I N G S L I M I T E D37ANNUAL REPORT & FINANCIAL
STATEMENTS FOR THE YEAR ENDED 31 DECEMBER 2010
Statement of Director’s Responsibilities

Report on the financial statements We have audited the accompanying consolidated financial statements of UAP Holdings Limited (‘the Company’) and its subsidiaries (together “the Group”) as set out on pages 39 to 93. These financial statements comprise the consolidated statement of financial position at 31 December 2010 and the consolidated income statement, consolidated statement of comprehensive income and consolidated statement of cash flows for the year then ended together with the statement of financial position of the Company standing alone as at 31 December 2010 and the statement of changes in equity of the Company for the year then ended, and a summary of significant accounting policies and other explanatory notes.
Directors’ responsibility for the financial statementsThe directors are responsible for the preparation and fair presentation of these financial statements in accordance with International Financial Reporting Standards and with the requirements of the Kenyan Companies Act and for such internal control as the directors determine necessary to enable the preparation of financial statements that are free from material misstatements, whether due to fraud or error.
Auditor’s responsibilityOur responsibility is to express an opinion on the financial statements based on our audit. We conducted our audit in accordance with International Standards on Auditing. Those standards require that we comply with ethical requirements and plan and perform our audit to obtain reasonable assurance that the financial statements are free from material misstatement.
An audit involves performing procedures to obtain audit evidence about the amounts and disclosures in the financial statements. The procedures selected depend on the auditor’s judgement, including the assessment of the risks of material misstatement of the financial statements, whether due to fraud or error. In making those risk assessments, the auditor considers internal control relevant to the entity’s preparation and fair presentation of the financial statements in order to design audit procedures that are appropriate in the circumstances, but not for the purpose of expressing an opinion on the effectiveness of the entity’s internal control. An audit also includes evaluating the appropriateness of accounting policies used and the reasonableness of accounting estimates made by the directors, as well as evaluating the overall presentation of the financial statements.
We believe that the audit evidence we have obtained is sufficient and appropriate to provide a basis for our opinion.
OpinionIn our opinion the accompanying financial statements give a true and fair view of the state of the financial affairs of the Group and of the Company at 31 December 2010 and of the profit and cash flows of the Group for the year then ended in accordance with International Financial Reporting Standards and the Kenyan Companies Act.
Report on other legal requirementsThe Kenyan Companies Act requires that in carrying out our audit we consider
and report to you on the following matters. We confirm that:i) We have obtained all the information and explanations which to the best of
our knowledge and belief were necessary for the purposes of our audit;ii) In our opinion proper books of account have been kept by the Company, so
far as appears from our examination of those books; andiii) The Company’s statement of financial position is in agreement with the books
of account.
Certified Public Accountants6 May 2011Nairobi
U A P H O L D I N G S L I M I T E D 38ANNUAL REPORT & FINANCIAL STATEMENTS FOR THE YEAR ENDED 31 DECEMBER 2010 Report of the Independent Auditor
to the members of UAP Holdings Limited

2010 2009 Notes Shs ’000 Shs ’000
Gross written premium 5 5,818,851 4,526,058Gross earned premium 5 5,374,107 4,148,264Reinsurance ceded (1,226,350) (810,183)Net earned premium 4,147,757 3,338,081 Investment income 6 1,117,939 508,014Commissions earned 279,021 188,140Other income 7 70,795 66,239Total income 5,615,512 4,100,474
Claims and policy holders’ benefits payable 8 (2,872,392) (2,164,748)Less: Amount recoverable from reinsurers 447,563 213,132Net claims payable (2,424,829) (1,951,616)
Operating and other expenses 9 (1,660,255) (1,228,034)Finance costs 36 (53,519) (71,290)Commissions payable (683,483) (569,045)Share of loss of associate 22 (3,572) -Profit before income tax 789,854 280,489
Income tax expense 11 (155,537) (80,737)Profit for the year 634,317 199,752
Attributable to:Owners of the parent 483,715 161,667Non-controlling interests 150,602 38,085Profit for the year 634,317 199,752
Basic and diluted earnings per share (Shs) 13 4.03 1.35
The notes on pages 47 to 93 are an integral part of these financial statements
U A P H O L D I N G S L I M I T E D39ANNUAL REPORT & FINANCIAL
STATEMENTS FOR THE YEAR ENDED 31 DECEMBER 2010Consolidated Income StatementFor the year ended 31 December 2010
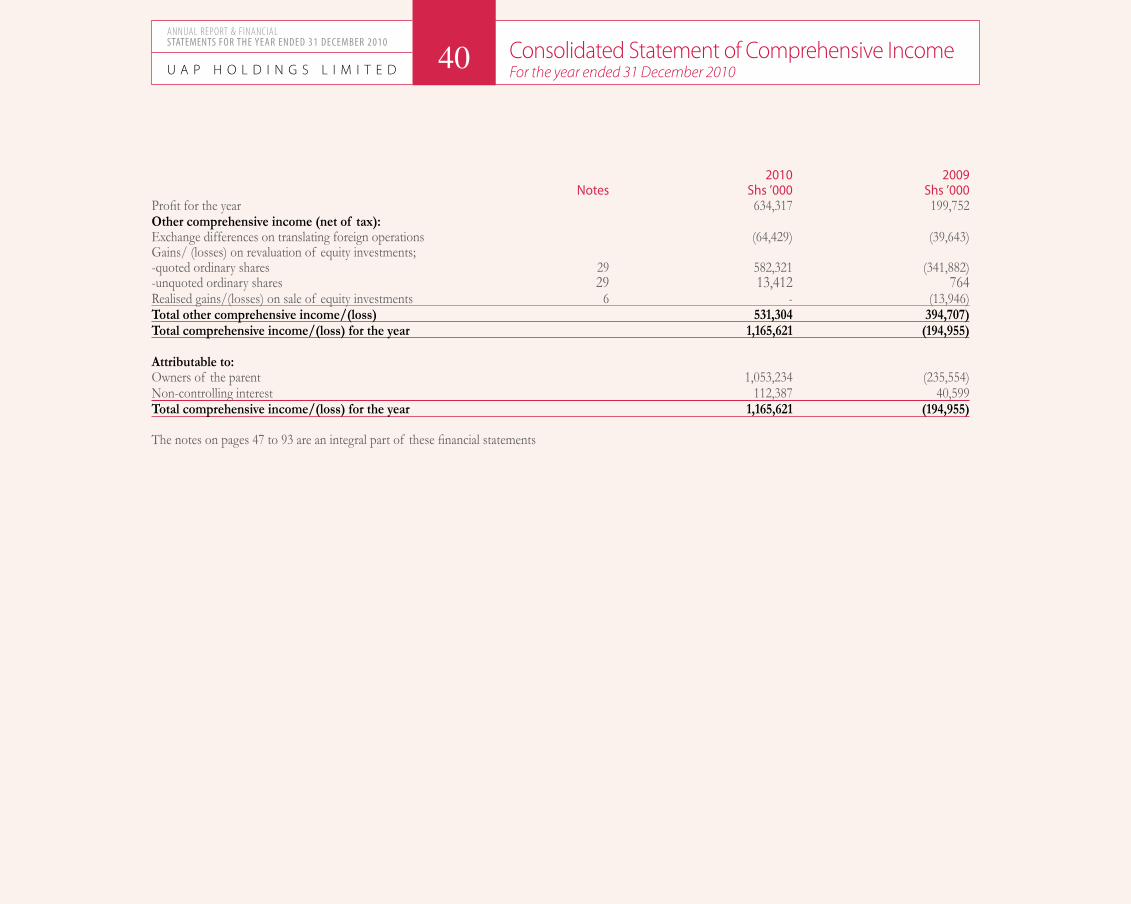
2010 2009 Notes Shs ’000 Shs ’000Profit for the year 634,317 199,752Other comprehensive income (net of tax):Exchange differences on translating foreign operations (64,429) (39,643)Gains/ (losses) on revaluation of equity investments;-quoted ordinary shares 29 582,321 (341,882)-unquoted ordinary shares 29 13,412 764Realised gains/(losses) on sale of equity investments 6 - (13,946)Total other comprehensive income/(loss) 531,304 394,707)Total comprehensive income/(loss) for the year 1,165,621 (194,955)
Attributable to:Owners of the parent 1,053,234 (235,554)Non-controlling interest 112,387 40,599Total comprehensive income/(loss) for the year 1,165,621 (194,955)
The notes on pages 47 to 93 are an integral part of these financial statements
U A P H O L D I N G S L I M I T E D 40ANNUAL REPORT & FINANCIAL STATEMENTS FOR THE YEAR ENDED 31 DECEMBER 2010 Consolidated Statement of Comprehensive Income
For the year ended 31 December 2010

2010 2009 Notes Shs ’000 Shs ’000CAPITAL EMPLOYEDShare capital 12 600,000 600,000Fair value reserve for equity investments 14 1,285,580 729,400Retained earnings 15 1,932,953 1,629,498Proposed dividend 16 204,000 204,000Translation reserve (81,309) (52,674)Statutory reserve 17 87,542 68,048Shareholders’ funds 4,028,766 3,178,272
Non controlling interest 370,417 267,638Total equity 4,399,183 3,445,910
REPRESENTED BY: AssetsGoodwill 18 50,545 50,545Property and equipment 19 255,807 134,260Intangible assets 20 88,472 94,761Investment properties 21 3,225,259 2,937,800Investment in associate 22 1,783 -Reinsurers share of insurance liabilities 24 1,074,114 666,987 Mortgage loans receivable 25 64,103 54,214Deferred acquisition costs 26 203,234 133,021Receivables arising out of direct insurance arrangements 734,061 619,719Receivables arising out of reinsurance arrangements 133,612 93,437Current income tax recoverable 50,185 57,210 Retirement benefit asset 27 92,922 71,693Corporate bonds 140,121 110,402Other receivables and prepayments 28 288,277 364,481Equity investments 29 3,412,679 2,360,361Government securities 30 1,379,581 1,112,789Deposits with financial institutions 31 854,321 646,549Cash and bank balances 31 343,926 318,862Total assets 12,393,002 9,827,091
Liabilities Payable under deposit administration contracts 32 1,448,028 1,029, 388Unit - linked investment contracts 33 637,323 382,692Insurance contract liabilities 34 2,135,940 1,773,555Borrowings 36 499,146 707,001Deferred income tax 37 278,133 280,340Unearned premium 38 2,210,787 1,775,369Creditors arising from reinsurance arrangements 322,657 112,483Other payables 39 435,063 301,144Current income tax payable 26,742 19,209Total liabilities 7,993,819 6,381,181Net assets 4,399,183 3,445,910
The notes on pages 47 to 93 are an integral part of these financial statementsThe financial statements on pages 39 to 93 were approved for issue by the board of directors on 15 April 2011 and signed on its behalf by:
Dr JB Wanjui CBS (Chairman) JN Muguiyi (Group Managing Director)
U A P H O L D I N G S L I M I T E D41ANNUAL REPORT & FINANCIAL
STATEMENTS FOR THE YEAR ENDED 31 DECEMBER 2010Consolidated Statement of Financial PositionAs at 31 December 2010

2010 2009 Notes Shs ’000 Shs ’000CAPITAL EMPLOYED Share capital 12 600,000 600,000Retained earnings 15 620,382 (144,833)Proposed dividend 16 204,000 204,000Shareholders’ funds 1,424,382 659,167
REPRESENTED BY: AssetsProperty and equipment 19 23,200 -Intangible assets 20 87,300 6,238Investment in associate 22 3,255 -Investment in subsidiaries 23 1,096,509 1,087,871Other receivables 571,637 38,536Cash and bank balances 212 4,464Total assets 1,782,113 1,137,109
LiabilitiesAmount due to subsidiaries 43(iv) 357,056 473,599Other payables 676 4,343Total liabilities 357,732 477,942Net assets 1,424,382 659,167
The notes on pages 47 to 93 are an integral part of these financial statements
U A P H O L D I N G S L I M I T E D 42ANNUAL REPORT & FINANCIAL STATEMENTS FOR THE YEAR ENDED 31 DECEMBER 2010 Company Statement of Financial Position
As at 31 December 2010

Notes Share Fair value Retained Translation Statutory Proposed Non Total capital reserves earnings reserve reserve dividends Controlling equity Shs’000 Shs’000 Shs’000 Shs’000 Shs’000 Shs’000 Shs’000 Shs’000 At start of year 600,000 729,400 1,629,498 (52,674) 68,048 204,000 267,638 3,445,910Comprehensive income / (loss) for the year: Profit for the year - - 483,715 - - - 150,602 634,317Other comprehensive income / (loss): of equity investments -quoted ordinary shares - 582,321 - - - - - 582,321 -unquoted ordinary shares - 13,412 - - - - - 13,412Transfer of realised gains on sale of shares - (41,950) 41,950 - - - - -Currency translation differences - 2,397 - (28,635) - - (38,191) (64,429)
Total other comprehensive income / (loss) - 556,180 41,950 (28,635) - - (38,191) 531,304 Total comprehensive income / (loss) for the year - 556,180 525,665 (28,635) - - 112,411 1,165,621Net transfer to statutory reserve - - (18,210) 19,494 630 1,914Transactions with owners Dividends:- Final for 2009 paid 16 - - - - - (204,000) (204,000)- Proposed final for 2010 16 - - (204,000) - - 204,000 - -Dividend paid to non controlling interest - - - - - - (10,262) (10,262)Total transactions with owners - - (204,000) - - - (10,262) (214,262)At end of year 600,000 1,285,580 1,932,953 (81,309) 87,542 204,000 370,417 4,399,183 The notes on pages 47 to 93 are an integral part of these financial statements
Attributable to owners of the parent
U A P H O L D I N G S L I M I T E D43ANNUAL REPORT & FINANCIAL
STATEMENTS FOR THE YEAR ENDED 31 DECEMBER 2010Consolidated Statement of Changes in EquityYear Ended 31 December 2010

Notes Share Fair value Retained Translation Statutory Proposed Non Total capital reserves earnings reserve reserve dividends Controlling equity Shs’000 Shs’000 Shs’000 Shs’000 Shs’000 Shs’000 Shs’000 Shs’000
At start of year 600,000 1,177,513 1,582,384 (10,517) 64,446 204,000 235,583 3,853,409Transfer of fair value reserves to retained earnings on early adoption of IFRS 9 2(a) - (93,049) 93,049 - - - - -
Adjusted balances after early adoption of IFRS 9 600,000 1,084,464 1,675,433 (10,517) 64,446 204,000 235,583 3,853,409
Comprehensive income / (loss) for the year:Profit for the year - - 161,667 - - - 38,085 199,752Other comprehensive income / (loss):Gains/ (losses) on revaluation of equity investments -quoted ordinary shares - (341,882) - - - - - (341,882) -unquoted ordinary shares - 764 - - - - - 764Realised gains on sale of shares - (13,946) - - - - - (13,946)Currency translation differences - - - (42,157) - - 2,514 (39,643)
Total other comprehensive income / (loss) - (355,064) - (42,157) - - 2,514 (394,707) Total comprehensive income / (loss) for the year - (355,064) 161,667 (42,157) - - 40,599 (194,955)Net transfer to statutory reserve - - (3,602) - 3,602 - - -
Transactions with ownersDividends:- Final for 2008 paid 16 - - - - - (204,000) - (204,000)- Proposed final for 2009 16 - - (204,000) - - 204,000 - -Dividend paid to non controlling interest - - - - - - (8,544) (8,544)Total transactions with owners - - 204,000 - - - (8,544) (212,544)At end of year 600,000 729,400 1,629,498 (52,674) 68,048 204,000 267,638 3,445,910
The notes on pages 47 to 93 are an integral part of these financial statements
Attributable to owners of the parent
U A P H O L D I N G S L I M I T E D 44ANNUAL REPORT & FINANCIAL STATEMENTS FOR THE YEAR ENDED 31 DECEMBER 2010 Consolidated Statement of Changes in Equity
Year Ended 31 December 2009

Notes Share Retained Proposed capital earnings dividends Total Shs’000 Shs’000 Shs’000 Shs’000
Year ended 31 December 2010
At start of year 600,000 (144,833) 204,000 659,167 Comprehensive income for the year: Profit for the year - 969,215 969,215 Other comprehensive income - - - -Total comprehensive income for the year - 969,215 - 969,215 Transactions with owners Dividends: - Proposed final for 2010 16 - (204,000) 204,000 -- 2009 -Final dividend paid 16 - (204,000) (204,000)Total transactions with owners - (204,000) - (204,000)At end of year 600,000 620,382 204,000 1,424,382
Year ended 31 December 2009At start of year 600,000 - 204,000 804,000Comprehensive income for the year: Profit for the year - 59,167 59,167 Other comprehensive income - - - -Total comprehensive income for the year - 59,167 - 59,167
Transactions with owners Dividends: - Final for 2008 paid 16 - - (204,000) (204,000)-Proposed final for 2009 16 - (204,000) 204,000 -
Total transactions with owners - (204,000) - (204,000)At end of year 600,000 (144,833) 204,000 659,167
The notes on pages 47 to 93 are an integral part of these financial statements.
U A P H O L D I N G S L I M I T E D45ANNUAL REPORT & FINANCIAL
STATEMENTS FOR THE YEAR ENDED 31 DECEMBER 2010
Company Statement of Changes in Equity
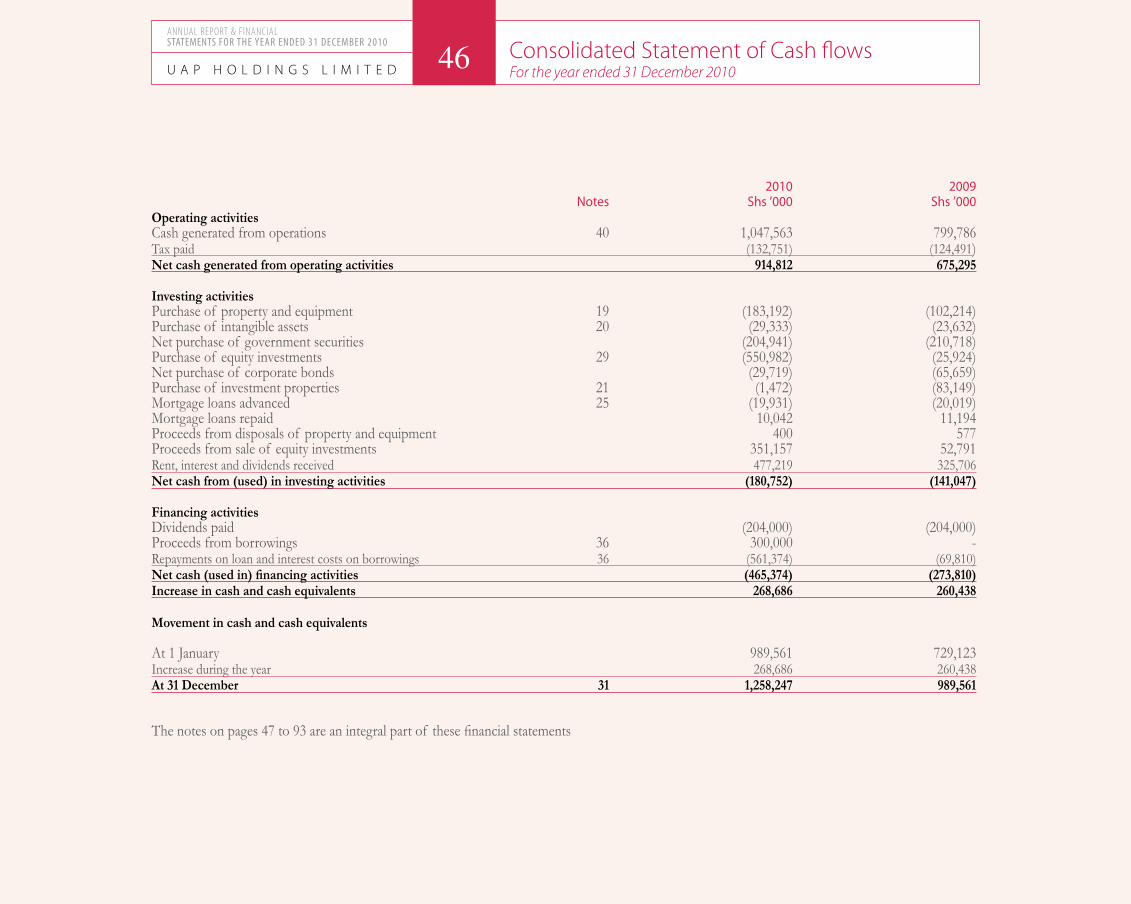
2010 2009 Notes Shs ’000 Shs ’000Operating activities Cash generated from operations 40 1,047,563 799,786Tax paid (132,751) (124,491)Net cash generated from operating activities 914,812 675,295
Investing activities Purchase of property and equipment 19 (183,192) (102,214)Purchase of intangible assets 20 (29,333) (23,632)Net purchase of government securities (204,941) (210,718)Purchase of equity investments 29 (550,982) (25,924)Net purchase of corporate bonds (29,719) (65,659)Purchase of investment properties 21 (1,472) (83,149)Mortgage loans advanced 25 (19,931) (20,019)Mortgage loans repaid 10,042 11,194Proceeds from disposals of property and equipment 400 577Proceeds from sale of equity investments 351,157 52,791Rent, interest and dividends received 477,219 325,706Net cash from (used) in investing activities (180,752) (141,047) Financing activities Dividends paid (204,000) (204,000)Proceeds from borrowings 36 300,000 -Repayments on loan and interest costs on borrowings 36 (561,374) (69,810)Net cash (used in) financing activities (465,374) (273,810)Increase in cash and cash equivalents 268,686 260,438
Movement in cash and cash equivalents
At 1 January 989,561 729,123Increase during the year 268,686 260,438At 31 December 31 1,258,247 989,561
The notes on pages 47 to 93 are an integral part of these financial statements
U A P H O L D I N G S L I M I T E D 46ANNUAL REPORT & FINANCIAL STATEMENTS FOR THE YEAR ENDED 31 DECEMBER 2010 Consolidated Statement of Cash flows
For the year ended 31 December 2010
1. General InformationThe Company is incorporated in Kenya under the Companies Act as a limited liability company, and is domiciled in Kenya. The address of its registered office is Bishops Garden Towers, Bishops Road, P.O. Box 43013 - 00100 Nairobi The Company has four subsidiary companies that operate as insurance companies and one subsidiary company, UAP Credit Services Limited that provides insurance premiums financing services. Two of the Company’s insurance subsidiaries are short term (“general”) insurance companies, one is a long term (“life”) insurance company and one is a composite insurance company selling both general and life insurance. Long term business comprises life assurance business, deposit administration business and investment contracts. Life assurance business relates to the underwriting of risks relating to death of an insured person, and includes contracts subject to the payment of premiums for a term dependent on the termination or continuance of the life of an insured person.
Short term (general) insurance business relates to all other categories of short term insurance business, analysed into several sub-classes of business based on the nature of the assumed risks. UAP Credit Services Limited provides premium financing services to policyholders of the Group’s Kenyan insurance companies. The Company also holds an Investment in UAP Financial Services limited, a Ugandan based Company that provides stock broking services.
2. Summary of significant accounting policiesThe principal accounting policies adopted in the preparation of these financial statements are set out below. These policies have been consistently applied to all years presented, unless otherwise stated. (a) Basis of preparationThe financial statements are prepared in accordance with International Financial Reporting Standards (IFRS). The measurement basis applied is the historical cost basis, except where otherwise stated in the accounting policies set out below. The financial statements are presented in the functional currency of the Company, Kenya Shillings (Shs), rounded to the nearest thousand.
The preparation of financial statements in conformity with IFRS requires the use of estimates and assumptions. It also requires management to exercise its judgement in the process of applying the Group’s accounting policies. The areas involving a
higher degree of judgement or complexity, or where assumptions and estimates are significant to the financial statements, are disclosed in Note 3.
Adoption of new and revised standards(i) Standards that have been early adopted in the Group’s 2010 financial statements
IFRS 9 ‘Financial Instruments’- effective 1 January 2013. In 2009, the Group early adopted IFRS 9 provisions relating to the classification and measurement of financial assets. In 2010, IFRS 9 provisions relating to the classification and measurement of financial liabilities have been released and early adopted by the Group. The early adoption of the provisions relating to the classification and measurement of financial liabilities did not have a material impact on the Group’s financial statements for 2010 as the classification and measurement rule remained similar to those under IAS 39, financial instruments, as previously applied by the Group. The impact of early adoption of IFRS 9 on 2010 financial statements is a reduction in profit of Shs 41.3 million (2009: Shs 13.9 million) mainly as a result of realised gains on sale of equity investments not recycled into the income statement.
(ii) Standards, amendments and interpretations to existing standards effective in 2010 but not relevantAmendments to IFRS 2: Group cash-settled share-based payment transactions – effective 1 January 2010. The amendment clarifies the accounting for group cash-settled share-based payment transactions. The entity receiving the goods or services shall measure the share-based payment transaction as equity-settled only when the awards granted are its own equity instruments, or the entity has no obligation to settle the share-based payment transaction. The entity settling a share-based payment transaction when another entity in the group receives the goods or services recognises the transaction as equity-settled only if it is settled in its own equity instruments. In all other cases, the transaction is accounted for as cash-settled. IFRS 3 Business Combinations – Revised – effective 1 July 2009. The new standard continues to apply the acquisition method to business combinations, with some significant changes. For example, all payments to purchase a business are to be recorded at fair value at the acquisition date, with some contingent payments subsequently re-measured at fair value through income. Goodwill may be calculated based on the parent’s share of net assets or it may include goodwill related to the minority interest. All transaction costs will be expensed.
U A P H O L D I N G S L I M I T E D47ANNUAL REPORT & FINANCIAL
STATEMENTS FOR THE YEAR ENDED 31 DECEMBER 2010
Notes to the Financial Statements
IAS 27 Consolidated and Separate Financial Statements – Revised – effective 1 July 2009. IAS 27 (revised) requires the effects of all transactions with non-controlling interests to be recorded in equity if there is no change in control. They will no longer result in goodwill or gains and losses. The standard also specifies the accounting when control is lost. Any remaining interest in the entity is re-measured to fair value and a gain or loss is recognised in profit or loss.
Amendments to IAS 39 Financial Instruments: Recognition and Measurement Eligible Hedged Items – effective 1 July 2009. The amendment makes two significant changes. It prohibits designating inflation as a hedgeable component of a fixed rate debt. It also prohibits including time value in the one-sided hedged risk when designating options as hedges.
IFRIC 17 Distributions of Non-cash Assets to Owners – effective 1 July 2009. IFRIC 17 applies to the accounting for distributions of non-cash assets (commonly referred to as dividends in specie) to the owners of the entity. The interpretation clarifies that: a dividend payable should be recognised when the dividend is appropriately authorised and is no longer at the discretion of the entity; an entity should measure the dividend payable at the fair value of the net assets to be distributed; and an entity should recognise the difference between the dividend paid and the carrying amount of the net assets distributed in profit or loss.
IFRIC 18 Transfer of assets to customers -effective 1 July 2009. This interpretation clarifies the accounting for arrangement where an item of property, plant and equipment, which is provided by the customer, is used to provide an ongoing service. This has no impact on the Group’s Financial statements.
(iii) New standards, amendments and interpretations issued but not yet effective and not early adopted by the Group
IAS 24 (Revised) ‘Related party disclosures’ – effective 1 January 2011. The revised standard clarifies and simplifies the definition of a related party and removes the requirement for government-related entities to disclose details of all transactions with the government and other government-related entities. The amendment is not expected to have a material impact on the Group’s financial statements. Classification of rights issues’ (amendment to IAS 32) – effective 1 February 2010. The amendment addresses the accounting for rights issues that are denominated in a currency other than the functional currency of the issuer. Provided certain conditions are met, such rights issues are now classified as equity regardless of the
currency in which the exercise price is denominated. Previously, these issues had to be accounted for as derivative liabilities. The amendment applies retrospectively in accordance with IAS 8 ‘Accounting policies, changes in accounting estimates and errors’.
IFRIC 19, ‘Extinguishing financial liabilities with equity instruments’ - effective 1 July 2010. The interpretation clarifies the accounting by an entity when the terms of a financial liability are renegotiated and result in the entity issuing equity instruments to a creditor of the entity to extinguish all or part of the financial liability (debt for equity swap). It requires a gain or loss to be recognised in profit or loss, which is measured as the difference between the carrying amount of the financial liability and the fair value of the equity instruments issued. If the fair value of the equity instruments issued cannot be reliably measured, the equity instruments should be measured to reflect the fair value of the financial liability extinguished. It is not expected to have any impact on the Group’s financial statements.
Amendment to IFRS 7, Financial instruments: Disclosures (effective 1 July 2011)- This amendment requires additional disclosures in respect of risk exposures arising from transferred financial assets. The amendment includes a requirement to disclose by class of asset the nature, carrying amount and a description of the risks and rewards of financial assets that have been transferred to another party yet remain on the entity’s balance sheet. Disclosures are also required to enable a user to understand the amount of any associated liabilities, and the relationship between the financial assets and associated liabilities. This amendment is not expected to have a material impact on the Group’s financial statements as the Group does not have financial assets that have been transferred to another party that remain on the Group’s balance sheet Amendment to IAS 12,’Income taxes’ on deferred tax (effective 1 January 2012): - This amendment introduces an exception to the existing principle for the measurement of deferred tax assets or liabilities arising on investment property measured at fair value by adding a rebuttable presumption that investment property measured at fair value is recovered entirely by sale to the current principles in IAS 12.
Following the adoption of this standard, the deferred tax recognised on investment property fair value gains is likely to reduce. The Group is currently assessing the full impact of this amendment by assessing the capital gains tax rules across the jurisdictions in which it operates.
U A P H O L D I N G S L I M I T E D 48ANNUAL REPORT & FINANCIAL STATEMENTS FOR THE YEAR ENDED 31 DECEMBER 2010
Notes to the Financial Statements (continued)
2. Summary of significant accounting policies (continued)

Prepayments of a minimum funding requirement’ (amendments to IFRIC 14). – effective 1 January 2011. The amendments correct an unintended consequence of IFRIC 14, ‘IAS 19 – The limit on a defined benefit asset, minimum funding requirements and their interaction’.
Without the amendments, entities are not permitted to recognise as an asset some voluntary prepayments for minimum funding contributions. This was not intended when IFRIC 14 was issued, and the amendments correct this. The amendments should be applied retrospectively to the earliest comparative period presented.
(b) Insurance contracts (a) Classification The Group issues contracts that transfer insurance risk. Insurance contracts are those contracts that transfer significant insurance risk. As a general guideline, the group defines as significant insurance risk, the possibility of having to pay benefits on the occurrence of an insured event that are at least 10% more than the benefits payable if the insured event did not occur.
Insurance contracts are classified into two main categories, depending on the duration of risk and as per the provisions of the Insurance Act: long term insurance business and short term insurance business.
(i) Long term insurance businessIncludes business of all or any of the following classes, namely; group life business, ordinary life business, deposit administration business and unit linked business.
Life insurance business means the business of, or in relation to, the issuing of, or the undertaking of liability to pay money on death (not being death by accident or in specified sickness only) or on the happening of any contingency dependent on the termination or continuance of human life (either with or without provision for a benefit under a continuous disability insurance contract), and include a contract which is subject to the payment of premiums for term dependent on the termination or continuance of human life and any contract securing the grant of an annuity for a term dependent upon human life.
Superannuation business means life assurance business, being business of, or in relation to, the issuing of or the undertaking of the liability under superannuation, group life and permanent health insurance policy.
(ii) Short term insurance businessMeans insurance business of any class or classes not being long term insurance business. Classes of general insurance include aviation insurance, engineering insurance, fire insurance - domestic risks, fire insurance - industrial and commercial risks, liability insurance, marine insurance, motor insurance-private vehicles, motor insurance - commercial vehicles, personal accident insurance, theft insurance, workmen’s compensation and employer’s liability insurance and miscellaneous insurance (i.e. class of business not included under those listed above)
Motor insurance business means the business of affecting and carrying out contracts of insurance against loss of, or damage to, or arising out of or in connection with the use of, motor vehicles, inclusive of third party risks but exclusive of transit risks.
Personal accident insurance business means the business of affecting and carrying out contracts of insurance against risks of the persons insured sustaining injury as the result of an accident or of an accident of a specified class or dying as the result of an accident or of an accident of a specified class or becoming incapacitated in consequence of disease or of disease of a specified class.
Fire insurance business means the business of affecting and carrying out contracts of insurance, otherwise than incidental to some other class of insurance business against loss or damage to property due to fire, explosion, storm and other occurrences customarily included among the risks insured against in the fire insurance business. (b) Recognition and measurement(i) Premium income For long term insurance business, premiums are recognised as revenue when they become payable by the contract holder. Premiums are shown before deduction of commission.
For short term insurance business, premium income is recognised on assumption of risks, and includes estimates of premiums due but not yet received less unearned premium. Unearned premiums represent the proportion of the premiums written in periods up to the accounting date that relates to the unexpired terms of policies in force at the financial reporting date, and is computed using the 365ths method. Premiums are shown before deduction of commission and are gross of any taxes or duties levied on premiums.
U A P H O L D I N G S L I M I T E D49ANNUAL REPORT & FINANCIAL
STATEMENTS FOR THE YEAR ENDED 31 DECEMBER 2010
Notes to the Financial Statements (continued)
2. Summary of significant accounting policies (continued)(a) Basis of preparation (continued)

(ii) ClaimsFor long term insurance business, benefits are recorded as an expense when they are incurred. Claims arising on maturing policies are recognised when the claim becomes due for payment. Death claims are accounted for on notification. Surrenders are accounted for on payment.
For short term insurance business, claims incurred comprise claims paid in the year and changes in the provision for outstanding claims. Claims paid represent all payments made during the year, whether arising from events during that or earlier years. Outstanding claims represent the estimated ultimate cost of settling all claims arising from incidents occurring prior to the financial reporting date, but not settled at that date. Outstanding claims are computed on the basis of the best information available at the time the records for the year are closed, and include provisions for claims incurred but not reported (“IBNR”). Outstanding claims are not discounted.
(iii) Commissions payable and deferred acquisition costs (“DAC”)Commissions payable are based on the premium written and are recorded as an expense in the period in which they are incurred
A proportion of commissions payable is deferred and amortised over the period in which the related premium is earned. Deferred acquisition costs represent a proportion of acquisition costs that relate to policies that are in force at the year end.
(iv) Liability adequacy testAt each financial reporting date, liability adequacy tests are performed to ensure the adequacy of the insurance contract liabilities net of related DAC. In performing these tests, current best estimates of future contractual cash flows and claims handling and administration expenses, as well as investment income from the assets backing such liabilities, are used. Any deficiency is immediately charged to profit or loss.
(v) Reinsurance contracts heldContracts entered into by the Group with reinsurers under which the Group is compensated for losses on one or more contracts issued by the Group and that meet the classification requirements for insurance contracts are classified as reinsurance contracts held. Contracts that do not meet these classification requirements are classified as financial assets. Insurance contracts entered into by
the Group under which the contract holder is another insurer (inwards reinsurance) are included with insurance contracts.
The benefits to which the Group is entitled under its reinsurance contracts held are recognised as reinsurance assets. These assets consist of short-term balances due from reinsurers, as well as longer term receivables that are dependent on the expected claims and benefits arising under the related reinsured insurance contracts. Amounts recoverable from or due to reinsurers are measured consistently with the amounts associated with the reinsured insurance contracts and in accordance with the terms of each reinsurance contract. Reinsurance liabilities are primarily premiums payable for reinsurance contracts and are recognised as an expense when due.
The Group assesses its reinsurance assets for impairment on a quarterly basis. If there is objective evidence that the reinsurance asset is impaired, the Group reduces the carrying amount of the reinsurance asset to its recoverable amount and recognises that impairment loss in profit or loss. The Group gathers the objective evidence that a reinsurance asset is impaired using the same process adopted for financial assets held at amortised cost. The impairment loss is also calculated following the same method used for these financial assets. These processes are set out under Note 2(j)
(vi) Receivables and payables related to insurance contracts and investment contractsReceivables and payables are recognised when due. These include amounts due to and from agents, brokers and insurance contract holders.
If there is objective evidence that the insurance receivable is impaired, the Group reduces the carrying amount of the insurance receivable accordingly and recognises that impairment loss in the income statement. The Group gathers the objective evidence that an insurance receivable is impaired using the same process adopted for financial assets classified at amortised cost. The impairment loss is also calculated under the same method used for these financial assets. These processes are described under Note 2 (j).
(vii) Salvage and subrogation reimbursementsSome insurance contracts permit the Group to sell (usually damaged) property acquired in settling a claim (for example, salvage). The Group may also have the right to pursue third parties for payment of some or all costs (for example, subrogation).
U A P H O L D I N G S L I M I T E D 50ANNUAL REPORT & FINANCIAL STATEMENTS FOR THE YEAR ENDED 31 DECEMBER 2010
Notes to the Financial Statements (continued)
2. Summary of significant accounting policies (continued)(b) Recognition and measurement (continued)

Estimates of salvage recoveries are included as an allowance in the measurement of the insurance liability for claims, and salvage property is recognised in other assets when the liability is settled. The allowance is the amount that can reasonably be recovered from the disposal of the property.
Subrogation reimbursements are also considered as an allowance in the measurement of the insurance liability for claims and are recognised in other assets when the liability is settled. The allowance is the assessment of the amount that can be recovered from the action against the liable third party.
(c) Revenue recognition(i) Insurance premium revenueThe revenue recognition policy relating to insurance contracts is set out under note 2 (b) above
(ii) CommissionsCommissions receivable are recognised as income in the period in which they are earned.
(iii) Interest incomeInterest income is recognised on a time proportion basis that takes into account the effective yield on the asset. When a receivable is impaired, the Group reduces the carrying amount to its recoverable amount, being the estimated future cash flow discounted at the original effective interest rate of the instrument, and continues unwinding the discount as interest income.
(iv) Dividend incomeDividends are recognised as income in the period in which the right to receive payment is established.
(v) Rental incomeRental income is recognised as income in the period in which it is earned.All investment income is stated net of investment expenses.
(vi) Fee incomeFee income consists primarily of administration fees arising from services rendered in relation to the issue and management of deposit administration and investment contracts. Fees are recognised in the accounting period in which the services are rendered and are presented in the income statement within ‘other income’.
(d)Investment contracts The Group issues investment contracts without fixed terms (unit-linked) and investment contracts with fixed and guaranteed terms (fixed interest rate). The investment contracts include funds administered for a number of retirement benefit schemes.Investment contracts without fixed terms are financial liabilities whose fair value is dependent on the fair value of underlying financial assets, and are designated at inception as at fair value through profit or loss. The Group designates these investment contracts to be measured at fair value through profit or loss because it eliminates or significantly reduces a measurement or recognition inconsistency (sometimes referred to as ‘an accounting mismatch’) that would otherwise arise from measuring assets or liabilities or recognising the gains and losses on them on different bases.
The best evidence of the fair value of these financial liabilities at initial recognition is the transaction price (i.e. the fair value received) unless the fair value of that instrument is evidenced by comparison with other observable current market transactions in the same instrument or based on a valuation technique whose variables include only data from observable markets. When such evidence exists, the Group recognises profit on day1.
The fair value of financial liabilities for investment contracts without fixed terms is determined using the current unit values in which the contractual benefits are denominated. These unit values reflect the fair values of the financial assets contained within the Group’s unitised investment funds linked to the financial liability. The fair value of the financial liabilities is obtained by multiplying the number of units attributed to each contract holder at the financial reporting date by the unit value for the same date.
For investment contracts with fixed and guaranteed terms, the amortised cost basis is used. In this case, the liability is initially measured at its fair value less transaction costs that are incremental and directly attributable to the acquisition or issue of the contract.
Subsequent measurement of investment contracts at amortised cost uses the effective interest method. This method requires the determination of an interest rate (the effective interest rate) that exactly discounts to the net carrying amount of the financial liability, the estimated future cash payments or receipts through the expected life of the financial instrument or, when appropriate, a shorter period if the holder has the option to redeem the instrument earlier than maturity.
U A P H O L D I N G S L I M I T E D51ANNUAL REPORT & FINANCIAL
STATEMENTS FOR THE YEAR ENDED 31 DECEMBER 2010
Notes to the Financial Statements (continued)
2. Summary of significant accounting policies (continued)(b) Recognition and measurement (continued)(vii) Salvage and subrogation reimbursements (continued)
The Group re-estimates at each reporting date the expected future cash flows and recalculates the carrying amount of the financial liability by computing the present value of estimated future cash flows using the financial liability’s original effective interest rate. Any adjustment is immediately recognised as income or expense in the income statement.
(e) Property and equipmentAll categories of property and equipment are initially recorded at cost and subsequently stated at historical cost less depreciation. Historical cost includes expenditure that is directly attributable to the acquisition of the items. Subsequent costs are included in the asset’s carrying amount or recognised as a separate asset, as appropriate, only when it is probable that future economic benefits associated with the item will flow to the Group and the cost of the item can be measured reliably.
All other repairs and maintenance costs are charged to the income statement during the financial period in which they are incurred. Depreciation is calculated using the straight line method to write down their cost to their residual values over their estimated useful lives, as follows:
- Equipment and motor vehicle 3 - 8 years The assets’ residual values and useful lives are reviewed, and adjusted if appropriate, at each financial reporting date.
An asset’s carrying amount is written down immediately to its estimated recoverable amount if the asset’s carrying amount is greater than its estimated recoverable amount. Gains and losses on disposal of property and equipment are determined by comparing proceeds with carrying amount and are included in the income statement.
(f) Investment propertiesBuildings, or part of a building, (freehold or held under a finance lease) and land (freehold or held under an operating lease) held for long term rental yields and/or capital appreciation and are not occupied by the Group are classified as investment property under non-current assets. Investment property is carried at fair value, representing open market value determined annually by external valuers. Changes in fair values are included in investment income in the income statement.
(g) Intangible assets The Group’s intangible assets relate to computer software.Acquired computer software licences are capitalised on the basis of the costs incurred to acquire and bring to use the specific software. These costs are amortised over their estimated useful lives of three years.
Development costs that are directly associated with the production of identifiable and unique software products controlled by the Group, and that will probably generate economic benefits exceeding costs beyond one year, are recognised as intangible assets if:-
• It is technically feasible to complete the software product so that it will be available for use;
• Management intends to complete the software product and use or sell it;• There is an ability to use or sell the software product;• It can be demonstrated how the software product will generate probable future
economic benefits;• Adequate technical, financial and other resources to complete the development
and use or sell it are available; and,• The expenditure attributable to the software product during its development
can be reliably measured.
Direct costs include the software development, employee costs and an appropriate portion of relevant overheads. Other development expediture that do not meet these criteria are recognised as an expense as incurred. Development costs that have been expensed are not recognised as an asset in a subsequent period.
Computer software development costs recognised as assets are amortised over their estimated useful lives (not exceeding three years). Costs associated with maintaining computer software programmes are recognised as an expense as incurred.
(h) Impairment of non-financial assetsAssets that have an indefinite useful life are not subject to amortisation and are tested annually for impairment. Assets that are subject to amortisation are reviewed for impairment whenever events or changes in circumstances indicate that the carrying amount may not be recoverable. An impairment loss is recognised for the amount by which the asset’s carrying amount exceeds its recoverable amount. The recoverable amount is the higher of an asset’s fair value less costs to sell and value in use. For the purposes of assessing impairment, assets are grouped at the
U A P H O L D I N G S L I M I T E D 52ANNUAL REPORT & FINANCIAL STATEMENTS FOR THE YEAR ENDED 31 DECEMBER 2010
Notes to the Financial Statements (continued)
2. Summary of significant accounting policies (continued)(d) Investment contracts (continued)
lowest levels for which there are separately identifiable cash flows (cash-generating units). Non-financial assets other than goodwill that suffered an impairment are reviewed for possible reversal of the impairment at each reporting date.
(i) Financial assetsClassification and measurement -from 12 November 2009
The Group classifies its financial assets as subsequently measured at either amortised cost or fair value on the basis of both the Group’s business model for managing the financial assets and the contractual cash flow characteristics of the financial asset. A financial asset is measured at amortised cost if both of the following conditions are met:
the asset is held within a business model whose objective is to hold assets in order to collect contractual cash flows.the contractual terms of the financial asset give rise on specified dates to cash flows that are solely payments of principal and interest on the principal amount outstanding.
The Group’s corporate bonds, government securities, receivables, mortgage loans, receivables, cash at bank and deposits with financial institutions are classified at amortised cost. Financial assets in this category had a total carrying value of Shs 5,112,849 at end of the year (2009: Shs 3,987,445).
All financial assets that do not meet the above criteria are measured at fair value. The Group’s equity investments are classified at fair value. Financial assets in this category had a total carrying value of Shs 3,442,739 at end of the year (2009: Shs 2,360,361).
Classification and measurement prior to November 2009, the Group classified its financial assets in accordance with the classification criteria of IAS 39 – Financial Instruments: Recognition and Measurement, as follows:
(i) Financial assets at fair value through profit or lossThis category had two sub-categories: financial assets held for trading, and those designated at fair value through profit or loss at inception. A financial asset was classified as held for trading if acquired principally for the purpose of selling in the short term. Derivatives were also categorised as held for trading. Financial assets were designated at fair value through profit or loss when:
doing so significantly reduced or eliminated a measurement inconsistency; or they formed part of a group of financial assets that is managed and evaluated on a fair value basis in accordance with a documented risk management or investment strategy and reported to key management personnel on that basis.
(ii) Loans and receivablesLoans, advances and receivables were non-derivative financial assets with fixed or determinable payments that were not quoted in an active market, other than: (a) those classified as held for trading and those that the Group on initial recognition designated as at fair value through profit or loss; (b) those that the Group upon initial recognition designated as available-for-sale; or (c) those for which the holder may not recover substantially all of its initial investment, other than because of credit deterioration.
(iii) Held-to maturityHeld-to-maturity assets were non-derivative financial assets with fixed or determinable payments and fixed maturities that the Group had the positive intention and ability to hold to maturity. Were the Group to sell more than an insignificant amount of held-to-maturity assets, the entire category would have had to be reclassified as available for sale.
(iv) Available for saleAvailable-for-sale assets were non-derivatives that were either designated in this category or not classified in any other categories.
Recognition and de-recognitionFinancial assets are recognised when the Group becomes a party to the contractual provisions of the asset. Initial recognition of financial asset is at fair value plus, for all financial assets except those carried at fair value through profit or loss, transaction costs. Financial assets are derecognised when the rights to receive cash flows from the financial assets have expired or where the Group has transferred substantially all risks and rewards of ownership.
Equity investments are carried at fair value. Gains and losses arising from changes in the fair value of equity investments are recognised in other comprehensive income. When equity investments are derecognised, the cumulative gain or loss previously recognised in other comprehensive income are transferred to retained earnings. Prior to the adoption of IFRS 9 on 12 November 2009, this gain would be
U A P H O L D I N G S L I M I T E D53ANNUAL REPORT & FINANCIAL
STATEMENTS FOR THE YEAR ENDED 31 DECEMBER 2010
Notes to the Financial Statements (continued)
2. Summary of significant accounting policies (continued)(h) Impairment of non-financial assets (continued)
recycled to the income statement. Dividends on equity instruments are recognised in the income statement when the Group’s right to receive payment is established.
Fair values of quoted investments in active markets are based on current bid prices. Fair values for unlisted equity securities are estimated using valuation techniques. These include the use of recent arm’s length transactions, discounted cash flow analysis and other valuation techniques commonly used by market participants.
(j) Impairment of financial assets Assets carried at amortised cost:The Group assesses at each financial reporting date whether there is objective evidence that a financial asset or a group of financial assets measured at amortised cost is impaired. A financial asset or a group of financial assets is impaired and impairment losses are incurred only if there is objective evidence of impairment as a result of one or more events that occurred after initial recognition of the asset (a ‘loss event’) and that loss event (or events) has an impact on the estimated future cash flows of the financial asset or group of financial assets that can be reliably estimated. Objective evidence that a financial asset or group of assets is impaired includes observable data that comes to the attention of the Group about the following loss events:.
a) significant financial difficulty of the borrower;b) a breach of contract, such as default or delinquency in interest or principal
repayments; c) the Group granting to the borrower, for economic or legal reasons relating
to the borrower’s financial difficulty, a concession that the Group would not otherwise consider;
d) it becoming probable that the borrower will enter bankruptcy or other financial reorganisation;
e) the disappearance of an active market for that financial asset because of financial difficulties; or
f) observable data indicating that there is a measurable decrease in the estimated future cash flows from a group of financial assets since the initial recognition of those assets, although the decrease cannot yet be identified with the individual financial assets in the Group, including:
- adverse changes in the payment status of borrowers in the Group; or- national or local economic conditions that correlate with defaults on the assets
in the Group
The estimated period between a loss occurring and its identification is determined by management for each identified portfolio.
The Group first assesses whether objective evidence of impairment exists individually for financial assets that are individually significant, and individually or collectively for financial assets that are not individually significant. If the Group determines that no objective evidence of impairment exists for an individually assessed financial asset, whether significant or not, it includes the asset in a group of financial assets with similar credit risk characteristics and collectively assesses them for impairment. Assets that are individually assessed for impairment and for which an impairment loss is or continues to be recognised are not included in a collective assessment of impairment. If there is objective evidence that an impairment loss on financial assets carried at amortised cost has been incurred, the amount of the loss is measured as the difference between the asset’s carrying amount and the present value of estimated future cash flows (excluding future credit losses that have not been incurred) discounted at the financial instrument’s original effective interest rate. The carrying amount of the asset is reduced through the use of an allowance account and the amount of the loss is recognised in the income statement. If a loan or held-to-maturity asset has a variable interest rate, the discount rate for measuring any impairment loss is the current effective interest rate determined under the contract. As a practical expedient, the Group may measure impairment on the basis of an instrument’s fair value using an observable market price. The calculation of the present value of the estimated future cash flows of a collateralised financial asset reflects the cash flows that may result from foreclosure less costs for obtaining and selling the collateral, whether or not foreclosure is probable.
For the purposes of a collective evaluation of impairment, financial assets are grouped on the basis of similar credit risk characteristics (i.e. on the basis of the Group’s grading process that considers asset type, industry, geographical location, collateral type, past-due status and other relevant factors). Those characteristics are relevant to the estimation of future cash flows for groups of such assets by being indicative of the debtors’ ability to pay all amounts due according to the contractual terms of the assets being evaluated.Future cash flows in a group of financial assets that are collectively evaluated for impairment are estimated on the basis of the contractual cash flows of the assets
U A P H O L D I N G S L I M I T E D 54ANNUAL REPORT & FINANCIAL STATEMENTS FOR THE YEAR ENDED 31 DECEMBER 2010
Notes to the Financial Statements (continued)
2. Summary of significant accounting policies (continued)(i) Financial Assets (continued)

in the Group and historical loss experience for assets with credit risk characteristics similar to those in the Group. Historical loss experience is adjusted on the basis of current observable data to reflect the effects of current conditions that did not affect the period on which the historical loss experience is based and to remove the effects of conditions in the historical period that do not exist currently.
When a loan is uncollectible, it is written off against the related provision for loan impairment. Such loans are written off after all the necessary procedures have been completed and the amount of the loss has been determined. Subsequent recoveries of amounts previously written off decrease the amount of the provision for loan impairment in the income statement.
If, in a subsequent period, the amount of the impairment loss decreases and the decrease can be related objectively to an event occurring after the impairment was recognised (such as an improvement in the debtor’s credit rating), the previously recognised impairment loss is reversed by adjusting the allowance account. The amount of the reversal is recognised in the income statement. Loans that are either subject to collective impairment assessment or individually significant and whose terms have been renegotiated are no longer considered to be past due but are treated as new loans. In subsequent years, the renegotiated terms apply in determining whether the asset is considered to be past due.
(k) Accounting for leasesLeases of property and equipment where the Group assumes substantially all the risks and rewards of ownership are classified as finance leases. Assets acquired under finance leases are capitalised at the inception of the lease at the lower of their fair value and the estimated present value of the underlying lease payments.
Each lease payment is allocated between the liability and finance charges so as to achieve a constant rate on the finance balance outstanding. The corresponding rental obligations, net of finance charges, are included in non-current liabilities. The interest element of the finance charge is charged to the income statement over the lease period. Property and equipment acquired under finance leases is depreciated over the estimated useful life of the asset.
Leases in which a significant portion of the risks and rewards of ownership are retained by the lessor are classified as operating leases. Payments made under operating leases are charged to the income statement on a straight-line basis over the period of the lease.
(l) Cash and cash equivalentsCash and cash equivalents includes cash in hand, deposits held at call with banks, other short term highly liquid investments with original maturitiesof three months or less, and bank overdrafts.
(m) Employee benefits(i) Retirement benefit obligationsThe Group operates a defined benefit scheme for employees. A defined benefit plan is a pension plan that defines an amount of pension benefit that an employee will receive on retirement, usually dependent on one or more factors such as age, years of service and compensation. A defined contribution plan is a pension plan under which the Group pays fixed contributions into a separate entity. The Group has no legal or constructive obligations to pay further contributions if the fund does not hold sufficient assets to pay all employees the benefits relating to employee service in the current and prior periods.
The assets of the scheme are held in separate trustee administered funds, which are funded by contributions from both the Group and employees. The Group and all its employees also contribute to the appropriate National Social Security Fund, which are defined contribution schemes. The Group’s contributions to the defined contribution schemes are charged to the income statement in the year to which they relate.
The liability recognised in the statement of financial position in respect of defined benefit pension plans is the present value of the defined benefit obligation at the financial reporting date less the fair value of plan assets, together with adjustments for unrecognised actuarial gains or losses and past service costs. The defined benefit obligation is calculated annually by independent actuaries using the projected unit credit method. The present value of the defined benefit obligation is determined by discounting the estimated future cash outflows using interest rates of high-quality corporate bonds that are denominated in the currency in which the benefits will be paid, and that have terms to maturity approximating to the terms of the related pension liability. Actuarial gains and losses arising from experience adjustments and changes in actuarial assumptions in excess of the greater of 10% of the value of plan assets or 10% of the defined benefit obligation are charged or credited to income over the employees’ expected average remaining working lives. Past-service costs are recognised immediately in income, unless the changes to the pension plan are conditional on the employees remaining in service for a specified
U A P H O L D I N G S L I M I T E D55ANNUAL REPORT & FINANCIAL
STATEMENTS FOR THE YEAR ENDED 31 DECEMBER 2010
Notes to the Financial Statements (continued)
2. Summary of significant accounting policies (continued)(j) Impairment of financial assets (continued)

period of time (the vesting period). In this case, the past-service costs are amortised on a straight-line basis over the vesting period.
(ii) Other entitlementsEmployee entitlements to long service awards are recognised when they accrue to employees. A provision is made for the estimated liability for such entitlements as a result of services rendered by employees up to the financial reporting date.The estimated monetary liability for employees’ accrued annual leave entitlement at the financial reporting date is recognised as an expense accrual.
(n) Income taxThe tax expense for the period comprises current and deferred income tax. Tax is recognised in the income statement except to the extent that it relates to items recognised in other comprehensive income or directly in equity. In this case, the tax is also recognised in other comprehensive income or directly in equity respectively. Current income tax is the amount of income tax payable on the taxable profit for the year determined in accordance with the relevant tax legislation.Deferred income tax is provided in full, using the liability method, on all temporary differences arising between the tax bases of assets and liabilities and their carrying values for financial reporting purposes. However, if the deferred income tax arises from the initial recognition of an asset or liability in a transaction other than a business combination that at the time of the transaction affects neither accounting nor taxable profit or loss, it is not accounted for. Deferred income tax is determined using tax rates and laws that have been enacted or substantively enacted at the financial reporting date and are expected to apply when the related deferred income tax liability is settled.
Deferred income tax assets are recognised only to the extent that it is probable that future taxable profits will be available against which the temporary differences can be utilised.
Deferred income tax assets and liabilities are offset when there is a legally enforceable right to offset current tax assets against current tax liabilities and when the deferred income taxes assets and liabilities relate to income taxes levied by the same taxation authority on either the same taxable entity or different taxable entities where there is an intention to settle the balances on a net basis.(o) Functional currency and translation of foreign currencies
Transactions are recorded on initial recognition in the currency of the primary economic environment in which the Group operates (the functional currency). Transactions in foreign currencies are converted into the functional currency using the exchange rates prevailing at the dates of the transactions. Foreign exchange gains and losses resulting from the settlement of such transactions and from the translation at year-end exchange rates of monetary assets and liabilities denominated in foreign currencies are recognised in the income statement.
Foreign exchange gains and losses that relate to borrowings and cash and cash equivalents are presented in the income statement within ‘finance income or cost’. All other foreign exchange gains and losses are presented in the income statement within operating and other expenses.
(p) DividendsDividends payable to the Group’s shareholders are charged to equity in the period in which they are declared. Proposed dividends are shown as a separate component of equity until declared.
(q) Consolidation of subsidiaries(i) SubsidiariesSubsidiaries are all entities over which the Company has the power to govern the financial and operating policies generally accompanying a shareholding of more than one half of the voting rights. Subsidiaries are fully consolidated from the date on which control is transferred to the Company. They are de-consolidated from the date the control ceases.
The Group uses the acquisition method of accounting to account for business combinations. The consideration transferred for the acquisition of a subsidiary is the fair values of the assets transferred, the liabilities incurred and the equity interests issued by the Group. The consideration transferred includes the fair value of any asset or liability resulting from a contingent consideration arrangement. Acquisition-related costs are expensed as incurred. Identifiable assets acquired and liabilities and contingent liabilities assumed in a business combination are measured initially at their fair values at the acquisition date.
On an acquisition-by-acquisition basis, the Group recognises any non-controlling interest in the acquiree either at fair value or at the non-controlling interest’s proportionate share of the acquiree’s net assets.
U A P H O L D I N G S L I M I T E D 56ANNUAL REPORT & FINANCIAL STATEMENTS FOR THE YEAR ENDED 31 DECEMBER 2010
Notes to the Financial Statements (continued)
2. Summary of significant accounting policies (continued)(m) Employee benefits (continued)(i) Retirement benefit obligations (continued)

Investments in subsidiaries are accounted for at cost less impairment. Cost is adjusted to reflect changes in consideration arising from contingent consideration amendments. Cost also includes direct attributable costs of investment. The excess of the consideration transferred the amount of any non-controlling interest in the acquiree and the acquisition-date fair value over any previous equity interest in the acquiree over the fair value of the Group’s share of the identifiable net assets acquired is recorded as goodwill. If this is less than the fair value of the net assets of the subsidiary acquired in the case of a bargain purchase, the difference is recognised directly in income statement.
Inter-company transactions, balances and unrealised gains on transactions between companies are eliminated. Unrealised losses are also eliminated unless the transaction provides evidence of an impairment of the asset transferred. Accounting policies of subsidiaries have been changed where necessary to ensure consistency with the policies adopted by the Group.
(ii) Transactions and non-controlling interests The Group treats transactions with non-controlling interests as transactions with equity owners of the Group. For purchases from non-controlling interests, the difference between any consideration paid and the relevant share acquired of the carrying value of net assets of the subsidiary is recorded in equity. Gains or losses on disposals to non-controlling interests are also recorded in equity.
When the Group ceases to have control or significant influence, any retained interest in the entity is remeasured to its fair value, with the change in carrying amount recognised in profit or loss. The fair value is the initial carrying amount for the purposes of subsequently accounting for the retained interest as an associate, joint venture or financial asset. In addition, any amounts previously recognised in other comprehensive income in respect of that entity are accounted for as if the Group had directly disposed of the related assets or liabilities. This may mean that amounts previously recognised in other comprehensive income are reclassified to profit or loss. If the ownership interest in an associate is reduced but significant influence is retained, only a proportionate share of the amounts previously recognised in other comprehensive income are reclassified to profit or loss.
(iii) AssociatesAssociates are all entities over which the Group has significant influence but not control, generally accompanying a shareholding of between 20% and 50% of the voting rights. Investments in associates are accounted for by the equity method of accounting and are initially recognised at cost.
The Group’s investment in associates includes goodwill identified on acquisition, net of any accumulated impairment loss. The Group’s share of its associates’ post-acquisition profits or losses is recognised in the income statement, and its share of post-acquisition movements in other comprehensive income is recognised in other comprehensive income. The cumulative post-acquisition movements are adjusted against the carrying amount of the investment. When the Group’s share of losses in an associate equals or exceeds its interest in the associate, including any other unsecured receivables, the Group does not recognise further losses, unless it has incurred obligations or made payments on behalf of the associate.
Unrealised gains on transactions between the Group and its associates are eliminated to the extent of the Group’s interest in the associates. Unrealised losses are also eliminated unless the transaction provides evidence of an impairment of the asset transferred. Accounting policies of associates have been changed where necessary to ensure consistency with the policies adopted by the Group. Dilution gains and losses arising from investments in associates are recognised in the income statement.
(iv) Translation of results and financial positionResults and financial position of all the Group entities (none of which has the currency of a hyperinflationary economy) that have a functional currency different from the presentation currency are translated into the presentation currency as follows:
(i) assets and liabilities for each statement of financial position presented are translated at the closing rate at the date of that statement of financial position;
(ii) income and expenses for income statement are translated at average exchange rates (unless this average is not a reasonable approximation of the cumulative effect of the rates prevailing on the translation dates, in which case it is assumed expenses are translated at the dates of the transactions; and
U A P H O L D I N G S L I M I T E D57ANNUAL REPORT & FINANCIAL
STATEMENTS FOR THE YEAR ENDED 31 DECEMBER 2010
Notes to the Financial Statements (continued)
2. Summary of significant accounting policies (continued)(q) Consolidation of subsidiaries (continued)(i) Subsidiaries (continued)

(iii) all resulting exchange differences are recognised in other comprehensive income.
On consolidation, the exchange differences arising from the translation of the net investment in foreign entities are recognised in other comprehensive income. When a foreign operation is sold, such exchange differences are recognized in the income statement as part of the gain or loss on sale.
Goodwill and fair value adjustments arising on the acquisition of a foreign entity are treated as assets and liabilities of the foreign entity and translated atclosing rate.
(r) GoodwillGoodwill represents the excess of the cost of an acquisition over the fair value of the Group’s share of the net identifiable assets of the acquired subsidiary/associate at the date of acquisition. Goodwill on acquisitions of subsidiaries is included in intangible assets. Goodwill on acquisitions of associates is included in investments in associates. Goodwill on subsidiaries is tested annually for impairment and carried at cost less accumulated impairment losses. Impairment losses on goodwill are not reversed. Gains and losses on disposal of an entity include the carrying amount of goodwill relating to the entity sold.
Goodwill is allocated to cash-generating units for the purpose of impairment testing. The allocation is made to these cash generating units that are expected to benefit from the business combination in which the goodwill arose identified according to operating segment.
(s) Segment reportingOperating segments are reported in a manner consistent with the internal reporting provided to the chief operating decision- maker (CODM). The CODM is the person or group that allocates resources to and assesses the performance of the operating segments of an entity. The group has determined the UAP Holdings Board of Directors to be its CODM.
All transactions between business segments are conducted on an arm’s length basis, with intra-segment revenue and costs being eliminated in head office. Income and expenses directly associated with each segment are included in determining business segment performance.
3. Critical accounting estimates and judgements in applying accounting policiesThe Group makes estimates and assumptions that affect the reported amounts of assets and liabilities within the next financial year. Estimates and judgements are continually evaluated and based on historical experience and other factors, including expectations of future events that are believed to be reasonable under the circumstances.
(a) Future benefit payments from long-term insurance contracts The estimation of future benefit payments from long-term insurance contracts is one of the Group’s most critical accounting estimates. There are several sources of uncertainty that need to be considered in the estimate of the liability that the Group will ultimately pay for such claims. Note 28 contains further details on this process.
The determination of the liabilities under long-term insurance contracts is dependent on estimates made by the Group. Estimates are made as to the expected number of deaths for each of the years in which the Group is exposed to risk. The Group bases these estimates on standard mortality tables that reflect historical mortality experience. The estimated number of deaths determines the value of the benefit payments and the value of the valuation premiums. The main source of uncertainty is that epidemics such as AIDS could result in future mortality being significantly worse than in the past for the age groups in which the Group has significant exposure to mortality risk. However, continuing improvements in medical care and social conditions could result in improvements in longevity in excess of those allowed for in the estimates used to determine the liability for contracts where the Group is exposed to longevity risk.
For contracts without fixed terms and with discretionary participation in profits, it is assumed that the Group will be able to increase mortality risk charges in future years in line with emerging mortality experience. Estimates are also made as to future investment income arising from the assets backing long-term insurance contracts. These estimates are based on current market returns as well as expectations about future economic and financial developments. The average estimated rate of investment return is 12% p.a.(2009:12% p.a)
(b) Claims reserving and determination of IBNRThe estimation of future contractual cash flows in relation to reported losses and losses incurred but not reported is a key accounting estimate. There are several sources of uncertainty that need to be considered in the estimate of the liability that the Group will ultimately pay for such claims. Case estimates are computed
U A P H O L D I N G S L I M I T E D 58ANNUAL REPORT & FINANCIAL STATEMENTS FOR THE YEAR ENDED 31 DECEMBER 2010
Notes to the Financial Statements (continued)
2. Summary of significant accounting policies (continued)(q) Consolidation of subsidiaries (continued)(iv) Translation of results and financial position (continued)

on the basis of the best information available at the time the records for the year are closed. Further details on the process used to estimate claims incurred but not reported and amounts recorded as liabilities at the end of the current and previous year are set out in note 34 of the financial statements.
(c) Fair value of financial assetsFair values of certain financial assets recognised in the financial statements are determined using valuation techniques based on assumptions that are not supported by prices from current market transactions or observable market data.
The fair values of financial instruments that are not quoted in active markets are determined by using valuation techniques. Where valuation techniques (for example models) are used to determine fair values, they are validated and periodically independently reviewed by qualified senior personnel. All models are certified before they are used, and models are calibrated to ensure that outputs reflect actual data and comparative market prices. To the extent practical, models use observable data, however, areas such as credit risk (both own and counterparty), volatilities and correlations require management to make estimates.
(d) Recoverable amount of receivablesCritical estimates are made by the directors in determining the recoverable amount of impaired receivables. This process is set out in note 2(j). The carrying amounts of receivables are shown on note 4(b)
(e) Goodwill impairmentCritical estimates have been made by directors in determining whether the goodwill is impaired. These assumptions are disclosed on note 18.
(f) Valuation of investment propertiesA critical assumption has been made by the directors in the valuation of Group’s investment property. One of the Group’s investment properties with a carrying value of Shs 600 million has a ground lease set to expire on 1 November 2012. In the valuation of this property, an assumption that the lease will be renewed for a period of at least 45 years has been applied. The directors are currently in the process of pursuing the new title.
4. Management of insurance and financial riskThe Group’s activities expose it to a variety of risks, including insurance risk and financial risk. The Group’s overall risk management programme focuses on the
identification and management of risks and seeks to minimise potential adverse effects on its financial performance, by use of underwriting guidelines and capacity limits, reinsurance planning, credit policy governing the acceptance of clients, and defined criteria for the approval of intermediaries and reinsurers. Investment policies are in place which help manage liquidity, and seek to maximise return within an acceptable level of interest rate risk.
This section summarises the way the Group manages key risks:
(a) Insurance riskThe risk under any one insurance contract is the possibility that the insured event occurs and the uncertainty of the amount of the resulting claim. By the very nature of an insurance contract, this risk is random and therefore unpredictable. For a portfolio of insurance contracts where the theory of probability is applied to pricing and provisioning, the principal risk that the Group faces under its insurance contracts is that the actual claims and benefit payments exceed the carrying amount of the insurance liabilities.
This could occur because the frequency or severity of claims and benefits are greater than estimated. Insurance events are random and the actual number and amount of claims and benefits will vary from year to year from the level established using statistical techniques.
Experience shows that the larger the portfolio of similar insurance contracts, the smaller the relative variability about the expected outcome will be. In addition, a more diversified portfolio is less likely to be affected by a change in any subset of the portfolio.
The group has developed its insurance underwriting strategy to diversify the type of insurance risks accepted and within each of these categories to achieve a sufficiently large population of risks to reduce the variability of the expected outcome. Factors that aggravate insurance risk include lack of risk diversification in terms of type and amount of risk, geographical location and type of industry covered.
The following tables disclose the concentration of insurance risk by the class of business in which the contract holder operates and by the maximum insured loss limit included in the terms of the policy. The amounts are the maximum insured loss limit of the insurance liabilities (gross and net of reinsurance) arising from insurance contracts.
U A P H O L D I N G S L I M I T E D59ANNUAL REPORT & FINANCIAL
STATEMENTS FOR THE YEAR ENDED 31 DECEMBER 2010
Notes to the Financial Statements (continued)
3. Critical accounting estimates and judgements in applying accounting policies (continued)(b) Claims reserving and determination of IBNR (continued)

60U A P H O L D I N G S L I M I T E D
Year ended 31 December 2010Class of business Maximum insured loss General insurance business Shs 0 m - 15m Shs 15m - 250m Shs 250m - 1000m Total(Amounts presented in Shs ‘000) Motor Gross 22,774,020 6,840,479 - 29,614,499 Net 22,961,997 6,840,479 - 29,802,476Fire Gross 24,255,062 80,699,491 598,466,475 703,421,028 Net 23,854,681 64,353,033 144,473,144 232,680,858Accident Gross 48,519,038 31,351,175 4,601,324 84,471,537 Net 16,845,707 9,435,462 171,057 26,452,226Others Gross 15,729,447 51,593,867 84,065,006 151,388,320 Net 21,966,898 21,882,298 3,415,383 47,264,579Life assurance business Ordinary life Gross 799,334 2,374,357 - 3,173,691 Net 799,334 2,374,357 - 3,173,691Group life Gross 65,722,340 39,456,220 - 105,178,560 Net 38,600,880 4,089,000 - 42,689,880Total Gross 177,799,241 212,315,589 687,132,805 1,077,247,635 Net 125,029,497 108,974,629 148,059,584 382,063,710 The concentration by sector or maximum insured loss at the end of the year is broadly consistent with the prior year.
Year ended 31 December 2009Class of business Maximum insured loss General insurance business Shs 0 m - 15m Shs 15m - 250m Shs 250m - 1000m Total(Amounts presented in Shs ‘000) Motor Gross 24,943,319 7,455,810 6,613,383 38,562,512 Net 24,924,797 7,212,371 1,596,745 33,751,912Fire Gross 24,477,745 71,062,009 522,038,043 617,577,797 Net 26,484,139 65,279,351 63,026,952 154,790,442Accident Gross 41,434,665 19,213,146 18,606,946 79,254,757 Net 15,404,764 9,077,896 9,701,767 34,184,427Others Gross 22,633,390 68,950,081 161,639,682 253,223,153 Net 20,660,502 51,765,702 48,706,484 121,132,688Life assurance business Ordinary life Gross 117,300 1,157,787 - 1,275,087 Net 117,300 1.157,787 - 1,275,087Group life Gross 30,736,780 4,850,950 - 35,587,730 Net 21,388,241 694,282 - 22,082,523Total Gross 144,343,199 172,689,783 708,448,055 1,025,481,037 Net 108,997,743 135,187,389 123,031,948 367,217,079
The concentration by sector or maximum insured loss at the end of the year is broadly consistent with the prior year.
ANNUAL REPORT & FINANCIAL STATEMENTS FOR THE YEAR ENDED 31 DECEMBER 2010
Notes to the Financial Statements (continued)
4. Management of insurance and financial risk (continued)(a) Insurance risk (continued)
(b) Financial riskThe Group is exposed to financial risk through its financial assets, financial liabilities (investment contracts and borrowings), reinsurance assets and insurance liabilities. In particular the key financial risk is that the proceeds from its financial assets are not sufficient to fund the obligations arising from its insurance and investment contracts. The most important types of risk are credit risk, liquidity risk and market risk. Market risk includes currency risk, interest rate risk, equity price risk and other price risks.
These risks arise from open positions in interest rate, currency and equity prices, all of which are exposed to general and specific market movements. The risks that the Group primarily faces due to the nature of its investments and liabilities are liquidity rate risk and equity price risk. The Group manages these risks through policies set out by the Finance and Investment Committee of the Board (FIC).
These policies have been developed to achieve long-term investment returns in excess of the Group’s obligations under insurance and investment contracts. The principal technique is to match assets to the liabilities arising from insurance and investment contracts by reference to the type of benefits payable to contract holders. For each distinct category of liabilities, a separate portfolio of assets is maintained.
Market risk(i) Foreign exchange riskThe company underwrites some short term insurance policies contracted in US dollars and maintains foreign currency denominated current accounts with local banks. Additionally, the company invests in offshore stock exchange markets and places deposits in local financial institutions denominated in foreign currencies. This exposes the company to onward foreign exchange risk arising from the various currency exposures, primarily with respect to the Uganda shillings, US dollar, Euro and Sterling Pound. Foreign exchange risk arises from future commercial transactions and recognised assets and liabilities.
At 31 December 2010, if the Shilling had weakened/strengthened by 10% against the US dollar with all other variables held constant, the post tax profit for the year would have been Shs 11.54 million (2009: Shs 868,051) higher/lower, mainly as a result of US dollar bank balances. At 31 December 2010, and 31 December 2009, the company had no significant exposure with respect to Uganda Shillings, Euro and the Sterling Pound.
(ii) Price riskThe Company is exposed to equity securities price risk because of investments in quoted and unquoted shares classified either as available-for-sale or at fair value through profit or loss. The Company is not exposed to commodity price risk. To manage its price risk arising from investments in equity securities, the Company diversifies its portfolio. Diversification of the portfolio is done in accordance with policies set out by the Finance & Investment committee of Board. All quoted shares held by the Company are traded on the Nairobi Stock Exchange (NSE) and Uganda Stock Exchange (USE).
At 31 December 2010, if the NSE Index had increased/decreased by 10% with all other variables held constant and all the Company’s equity instruments moved according to the historical correlation to the index, equity would have been Shs 341 million higher/ lower (2009: Shs 162 million). Movement in the USE would not have had a material impact on the company’s equity in 2010 and 2009 as investments in the USE Index are not material.
Investment in shares of Centum Investment Company Limited and Kenya Commercial Bank Limited comprised of 24% (2009: 15%) and 37% (2009: 40 %) respectively of the Group’s total equity portfolio. There was no other concentration of price risk.
(iii) Cash flow and fair value interest rate riskFixed interest rate financial instruments expose the Company and Group to fair value interest rate risk. Variable interest rate financial instruments expose the company to cash flow interest rate risk. The Group’s fixed interest rate financial instruments are government securities, deposits with financial institutions and borrowings. The Company’s variable interest rate financial instruments are quoted corporate bonds, which are always the treasury bills rate plus some basis points. No limits are placed on the ratio of variable rate financial instruments to fixed rate financial instruments.
Investment contracts with fixed and guaranteed terms, government securities and deposits with financial institutions held to maturity are accounted for at amortised cost and their carrying amounts are not sensitive to changes in the level of interest rates. At 31 December 2010 if interest rates on quoted corporate bonds had been 2% higher/lower with all other variables held constant, post-tax profit for the year would have been Shs 43 million (2009: Shs 860,000) lower/higher, mainly as a result of higher/lower interest income on floating rate quoted corporate bonds.
U A P H O L D I N G S L I M I T E D61ANNUAL REPORT & FINANCIAL
STATEMENTS FOR THE YEAR ENDED 31 DECEMBER 2010
Notes to the Financial Statements (continued)
4. Management of insurance and financial risk (continued)
Credit riskThe Group has exposure to credit risk, which is the risk that a counterparty will be unable to pay amounts in full when due. Key areas where the Group is exposed to credit risk are:
• receivables arising out of direct insurance arrangements;• receivables arising out of reinsurance arrangements; • reinsurers’ share of insurance liabilities.• Loans and corporate bonds and• Deposits and government securities
The Group has no significant concentrations of credit risk. The Group structures the levels of credit risk it accepts by placing limits on its exposure to a single counterparty, or groups of counterparty, and to geographical and industry segments. Such risks are subject to an annual or more frequent review. Limits on the level of credit risk by category and territory are approved quarterly by the Board of Directors. Reinsurance is used to manage insurance risk. This does not, however, discharge the Group’s liability as primary insurer. If a reinsurer fails to pay a claim for any reason, the Group remains liable for the payment to the policyholder. The creditworthiness of reinsurers is considered on an annual basis by reviewing their financial strength prior to finalisation of any contract.
The exposure to individual counterparties is also managed by other mechanisms, such as the right of offset where counterparties are both debtors and creditors of the Group. Management information reported to the Group includes details of provisions for impairment on loans and receivables and subsequent write-offs. Finance and Investment committee of the Group Board makes regular reviews to assess the degree of compliance with the Group procedures on credit. Exposures to individual policyholders and groups of policyholders are collected within the ongoing monitoring by the management credit committee.
The credit quality of financial assets that are neither past due nor impaired can be assessed by reference to external credit ratings if available or historical information about counterparty default rates. None of the Company’s credit risk counter parties are rated except the Government of Kenya, the issuer of the Group’s government securities which has B+ rating. The Company classifies counterparties without an external credit rating as on the next page:
U A P H O L D I N G S L I M I T E D 62ANNUAL REPORT & FINANCIAL STATEMENTS FOR THE YEAR ENDED 31 DECEMBER 2010
Notes to the Financial Statements (continued)
4. Management of insurance and financial risk (continued)

63 U A P H O L D I N G S L I M I T E D
Group 1 - new customers/related parties.Group 2 - existing customers/related parties with no defaults in the past.Group 3 - existing customers/related parties with some defaults in the past. All defaults were fully recovered Maximum exposure to credit risk before collateral held - Group Credit rating/ 2010 2009 Classification Shs ’000 Shs ’000 Receivables arising out of reinsurance arrangements Group 2 133,612 93,437Receivables arising out of direct insurance arrangements Group 2 734,061 619,719Reinsurers’ share of insurance liabilities Group 2 1,074,114 666,987Other receivables Group 2 178,856 309,960Government securities Group 2 1,379,581 1,112,789Corporate bonds Group 2 140,121 110,402Mortgage loans receivable Group 2 64,103 54,214Deposits with financial institutions Group 2 854,321 646,549Cash at bank Group 2 343,926 318,687 4,902,695 3,932,744
Maximum exposure to credit risk before collateral held - Company 2010 2009 Shs ’000 Shs ’000Cash at bank Group 2 212 4,464Other receivables Group 2 571,637 38,536 571,849 43,000
U A P H O L D I N G S L I M I T E D63ANNUAL REPORT & FINANCIAL
STATEMENTS FOR THE YEAR ENDED 31 DECEMBER 2010ANNUAL REPORT & FINANCIAL
STATEMENTS FOR THE YEAR ENDED 31 DECEMBER 2010
Notes to the Financial Statements (continued)
4. Management of insurance and financial risk (continued)(b) Financial risk (continued) | Credit risk (continued)

64U A P H O L D I N G S L I M I T E D
No collateral is held for any of the above assets other than for staff mortgage loans and car loans included under other receivables. Properties in relation to staff mortgage loans and motor vehicles in relation to staff car loans are charged to the company as collateral. The fair value of collateral held as at 31 December 2010 was Shs 50 million (2009:Shs 54 million) for mortgage loans and Shs 60 million (2009:Shs 42 million) for staff car loans. All receivables that are neither past due or impaired are within their approved credit limits, and no receivables have had their terms renegotiated.
None of the above assets are past due or impaired except for the following amounts in; • receivables arising out of direct insurance arrangements which are due on inception of insurance cover• receivables arising out of reinsurance arrangements
None of the above assets are either past due or impaired except for the following amounts in the Group’s receivables under direct insurance and reinsurance arrangements.
Credit rating/ Receivables arising from Receivables arising from classification direct insurance arrangements re-insurance arrangements 2010 2009 2010 2009 Shs’000 Shs’000 Shs’000 Shs’000Past due but not impaired: - by up to 30 days Group2 305,215 238,739 - - - by 31 to 60 days Group2 278,786 212,024 2,907 -- by 61 to 150 days Group2 79,839 87,062 201 57,547- by 151 to 360 days Group2 70,221 81,894 35,736 -Total past due but not impaired 734,061 619,719 38,844 57,547 Receivables individually determined to be impaired: Carrying amount before provision for impairment loss Group3 417,343 346,917 - -Provision for impairment loss (417,343) (346,917) - -Net carrying amount 734,061 619,719 38,844 57,547
No collateral is held in respect of the receivables that are pat due but not impaired. Movements on the provision for impairment of receivables arising on direct insurance arrangements are as follows: 2010 2009 Shs ’000 Shs ’000 At start of year 346,917 231,251Provision in the year 70,426 115,666At end of year 417,343 346,917
All receivables past due by more than 365 days are considered to be impaired, and are carried at their estimated recoverable value.
ANNUAL REPORT & FINANCIAL STATEMENTS FOR THE YEAR ENDED 31 DECEMBER 2010
Notes to the Financial Statements (continued)
4. Management of insurance and financial risk (continued)(b) Financial risk (continued) | Credit risk (continued

65 U A P H O L D I N G S L I M I T E D
Receivables arising out of direct insurance arrangements individually impaired of the total gross amount of impaired receivables, the following amounts have been individually assessed: Direct insurance arrangements 2010 2009 Individually assessed impaired receivables Shs ‘000 Shs ‘000Brokers 208,180 91,132Agents 109,595 33,949Insurance companies 27,432 28,788Direct clients 72,136 193,048 417,343 346,917
Liquidity risk Liquidity risk is the risk that the Group is unable to meet its payment obligations associated with its financial liabilities as they fall due and to replace funds when they are withdrawn. The Group is exposed to daily calls on available cash resources for claims settlement and other administration expenses. The Group does not maintain cash resources to meet all of these needs as experience shows that a minimum level of reinvestment of maturing funds can be predicted with a high level of certainty. The Finance and Investment Committee sets limits on the minimum level of cash balances.
The table below presents the cash flows payable by the Group under financial liabilities by remaining expected maturities at the balance sheet date. Up to 1 1-3 3-12 1-5 Over 5 month months months years years Total As at 31 December 2010: Shs ’000 Shs ’000 Shs ’000 Shs ’000 Shs ’000 Shs ’000 LiabilitiesInsurance contract liabilities 120,947 262,295 564,864 702,195 485,639 2,135,940Creditors arising from reinsurance arrangements 322,657 - - - - 322,657Payable under deposit administration contracts 1,448,028 - - - - 1,448,028Unit-linked investment contracts 637,323 - - - - 637,323Other payables 112,198 109,500 193,706 19,659 - 435,063Borrowings - - 499,146 - - 499,146Total financial liabilitiesAs at 31 December 2010 2,641,153 371,795 1,257,716 721,854 485,639 5,478,157
U A P H O L D I N G S L I M I T E D65ANNUAL REPORT & FINANCIAL
STATEMENTS FOR THE YEAR ENDED 31 DECEMBER 2010ANNUAL REPORT & FINANCIAL
STATEMENTS FOR THE YEAR ENDED 31 DECEMBER 2010
Notes to the Financial Statements (continued)
4. Management of insurance and financial risk (continued)(b) Financial risk (continued) | Credit risk (continued)

66U A P H O L D I N G S L I M I T E D
Up to 1 1-3 3-12 1-5 Over 5 month months months years years Total As at 31 December 2009: Shs ’000 Shs ’000 Shs ’000 Shs ’000 Shs ’000 Shs ’000 LiabilitiesInsurance contract liabilities 229,441 215,234 566,416 425,408 337,056 1,773,555 Creditors arising from reinsurance arrangements 112,483 - - - - 112,483Payable under deposit administration contracts 1,029,388 - - - - 1,029,388Unit-linked investment contracts 382,692 - - - - 382,692Other payables 301,144 - - - - 301,144Borrowings 707,001 - - - - 707,001Total financial liabilitiesAs at 31 December 2009 2,762,149 215,234 566,416 425,408 337,056 4,306,263
Investment contracts and deposit administration contracts can be surrendered before maturity for a cash surrender value specified in the contractual terms and conditions. Prudent liquidity risk management includes maintaining sufficient cash balances to cover anticipated surrenders before the contractual maturity dates. In addition, the Group invests only a limited proportion of its assets in investments that are not actively traded. The Group’s listed securities are considered readily realisable, as they are actively traded on the Nairobi Stock Exchange and Uganda Stock Exchange. The table below presents the cash flows payable by the company under financial liabilities by remaining expected maturities at the financial reporting date.
Less than 1 yearAt 31 December 2010: Amounts due to subsidiaries 357,056Other payables 676 357,732
At 31 December 2009: Amounts due to UAP Insurance Company Limited 473,599Other payables 4,343 477,942
(c) Capital Management The Group’s objectives when managing capital, which is a broader concept than the ‘equity’ on the statement of financial position, are:• to comply with the capital requirements as set out in the regulations of the jurisdictions in which the Group entities operate in;• to comply with regulatory solvency requirements as set out in legislation in the jurisdictions in which the Group entities operate in;.• to safeguard the Group’s ability to continue as a going concern, so that it can continue to provide returns to shareholders and benefits for other stake holders; and • to provide an adequate return to shareholders by pricing insurance and investment contracts commensurately with the level of risk.The Company’s capital comprises
share capital as disclosed on note 12. The Group manages the minimum paid up capital and regulatory Capital (solvency) held in each subsidiary as capital.
ANNUAL REPORT & FINANCIAL STATEMENTS FOR THE YEAR ENDED 31 DECEMBER 2010
Notes to the Financial Statements (continued)
4. Management of insurance and financial risk (continued)(b) Financial risk (continued) | Credit risk (continued

67 U A P H O L D I N G S L I M I T E D
During the year the Group held the minimum paid up share capital required as well as met the required solvency margins required in the jurisdictions in which the Group entities operate in except for the Group’s subsidiary in Sudan which had not met the minimum level of paid share capital required for insurance companies operating in Southern Sudan. The company has obtained an extension to increase the paid up share capital in 2011. In addition, the Group’s life insurance subsidiary in Kenya did not meet the minimum solvency margins required by Insurance regulations in Kenya in 2010 and 2009, as shown below.
Capital adequacy and solvency margin are monitored regularly by the Board of Directors. The required information is filed with the respective authorities.The Group’s paid up capital at the end of 2010 and 2009 is presented in note 12. The table below summarises the capital requirements of the Group’s entities in the various jurisdictions in which the Group operates and the amount of capital held.
2010 2009 Kenya General Kenya Life Kenya General Kenya Life Insurance Insurance Sudan Uganda Insurance Insurance Sudan Uganda Shs’000 Shs’000 Shs’000 Shs’000 Shs’000 Shs’000 Shs’000 Shs’000
Regulatory capital requirements 300,000 150,000 341,190 70,006 100,000 50,000 341,190 79,602Amount of paid up capital 600,000 158,637 340,909 140,011 600,000 150,000 227,460 159,202Required solvency margin 378,901 126,954 - 46,432 289,416 99,267 - 129,787Solvency margin by Group 574,000 24,175 - 121,195 1,094,866 49,012 - 39,337Surplus/(deficit) over required margin 195,099 (102,779) - 74,763 796,450 (50,255) - (90,450)
U A P H O L D I N G S L I M I T E D67ANNUAL REPORT & FINANCIAL
STATEMENTS FOR THE YEAR ENDED 31 DECEMBER 2010ANNUAL REPORT & FINANCIAL
STATEMENTS FOR THE YEAR ENDED 31 DECEMBER 2010
Notes to the Financial Statements (continued)
4. Management of insurance and financial risk (continued)(c) Capital Management (continued)
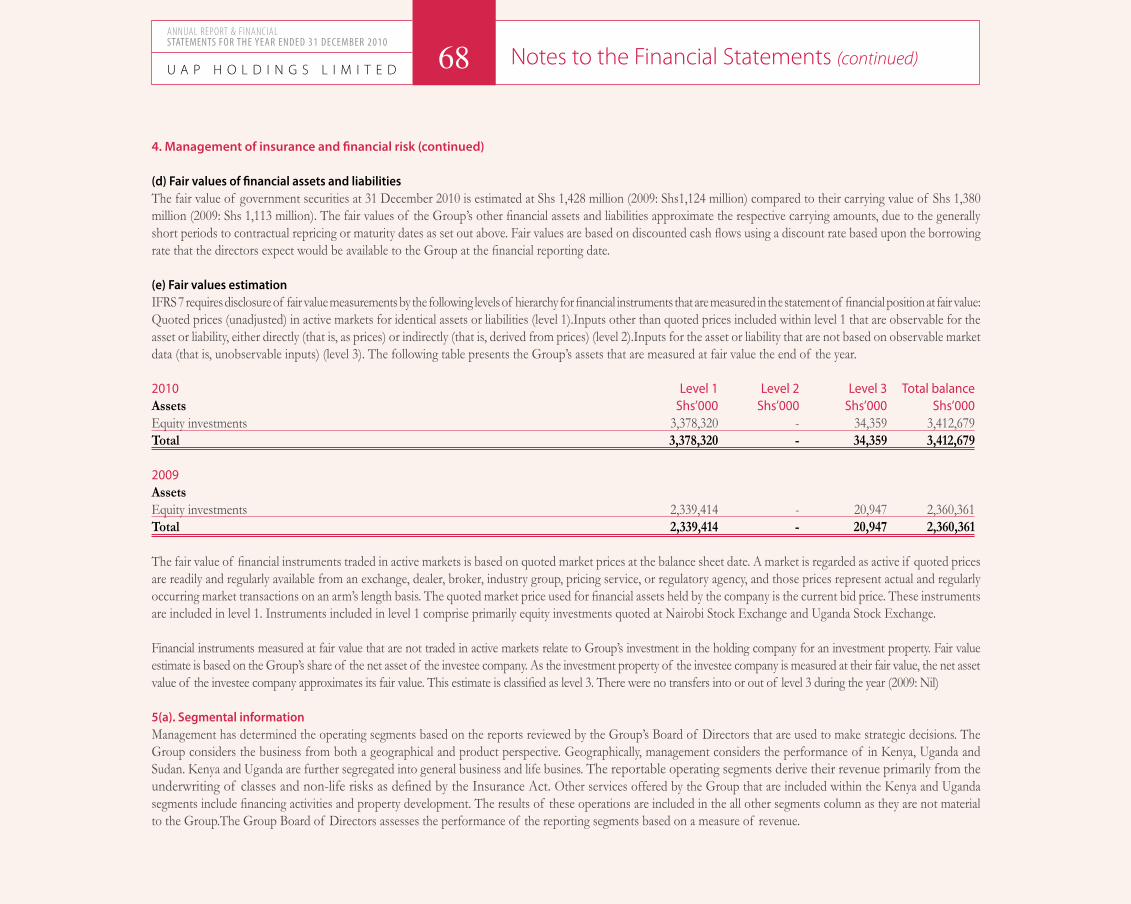
68U A P H O L D I N G S L I M I T E D
(d) Fair values of financial assets and liabilitiesThe fair value of government securities at 31 December 2010 is estimated at Shs 1,428 million (2009: Shs1,124 million) compared to their carrying value of Shs 1,380 million (2009: Shs 1,113 million). The fair values of the Group’s other financial assets and liabilities approximate the respective carrying amounts, due to the generally short periods to contractual repricing or maturity dates as set out above. Fair values are based on discounted cash flows using a discount rate based upon the borrowing rate that the directors expect would be available to the Group at the financial reporting date.
(e) Fair values estimation IFRS 7 requires disclosure of fair value measurements by the following levels of hierarchy for financial instruments that are measured in the statement of financial position at fair value: Quoted prices (unadjusted) in active markets for identical assets or liabilities (level 1).Inputs other than quoted prices included within level 1 that are observable for the asset or liability, either directly (that is, as prices) or indirectly (that is, derived from prices) (level 2).Inputs for the asset or liability that are not based on observable market data (that is, unobservable inputs) (level 3). The following table presents the Group’s assets that are measured at fair value the end of the year.
2010 Level 1 Level 2 Level 3 Total balanceAssets Shs’000 Shs’000 Shs’000 Shs’000Equity investments 3,378,320 - 34,359 3,412,679Total 3,378,320 - 34,359 3,412,679
2009Assets Equity investments 2,339,414 - 20,947 2,360,361Total 2,339,414 - 20,947 2,360,361
The fair value of financial instruments traded in active markets is based on quoted market prices at the balance sheet date. A market is regarded as active if quoted prices are readily and regularly available from an exchange, dealer, broker, industry group, pricing service, or regulatory agency, and those prices represent actual and regularly occurring market transactions on an arm’s length basis. The quoted market price used for financial assets held by the company is the current bid price. These instruments are included in level 1. Instruments included in level 1 comprise primarily equity investments quoted at Nairobi Stock Exchange and Uganda Stock Exchange.
Financial instruments measured at fair value that are not traded in active markets relate to Group’s investment in the holding company for an investment property. Fair value estimate is based on the Group’s share of the net asset of the investee company. As the investment property of the investee company is measured at their fair value, the net asset value of the investee company approximates its fair value. This estimate is classified as level 3. There were no transfers into or out of level 3 during the year (2009: Nil)
5(a). Segmental informationManagement has determined the operating segments based on the reports reviewed by the Group’s Board of Directors that are used to make strategic decisions. The Group considers the business from both a geographical and product perspective. Geographically, management considers the performance of in Kenya, Uganda and Sudan. Kenya and Uganda are further segregated into general business and life busines. The reportable operating segments derive their revenue primarily from the underwriting of classes and non-life risks as defined by the Insurance Act. Other services offered by the Group that are included within the Kenya and Uganda segments include financing activities and property development. The results of these operations are included in the all other segments column as they are not material to the Group.The Group Board of Directors assesses the performance of the reporting segments based on a measure of revenue.
ANNUAL REPORT & FINANCIAL STATEMENTS FOR THE YEAR ENDED 31 DECEMBER 2010
Notes to the Financial Statements (continued)
4. Management of insurance and financial risk (continued)
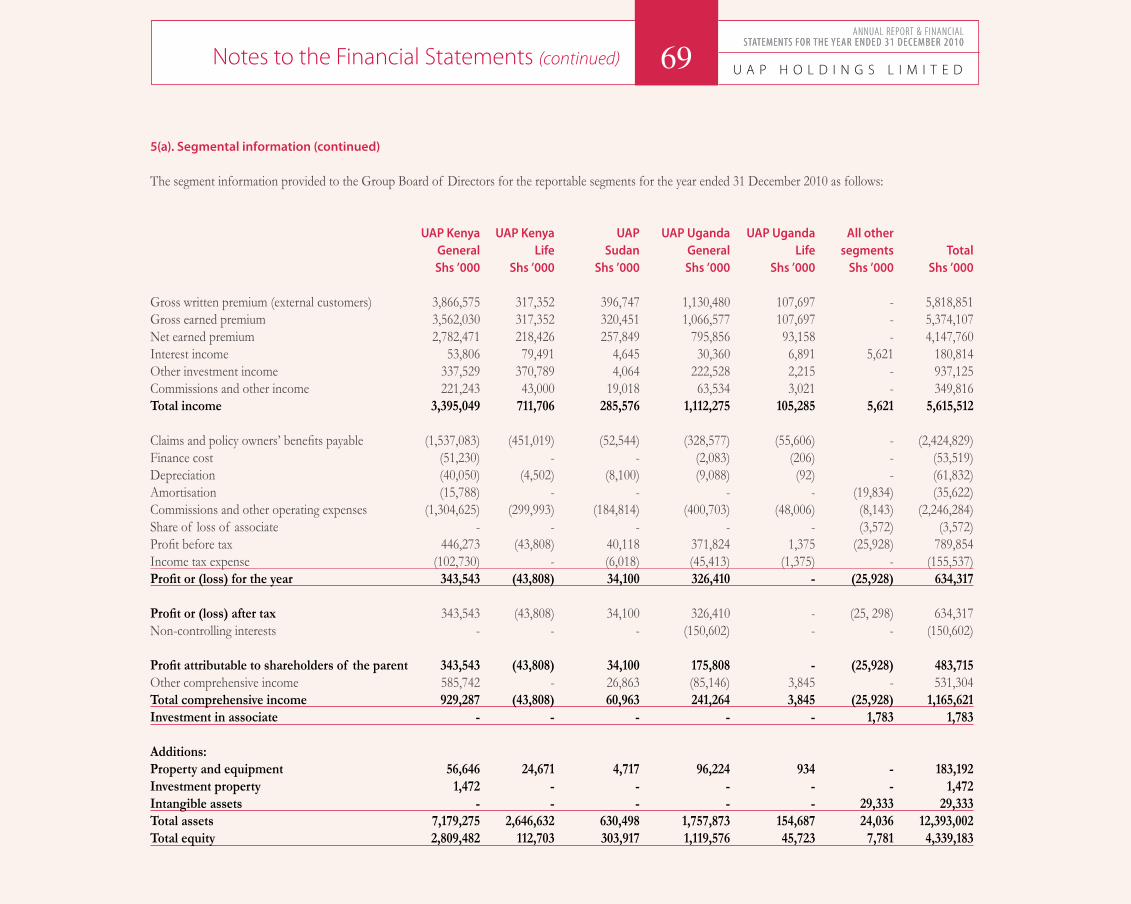
69 U A P H O L D I N G S L I M I T E D
The segment information provided to the Group Board of Directors for the reportable segments for the year ended 31 December 2010 as follows:
UAP Kenya UAP Kenya UAP UAP Uganda UAP Uganda All other General Life Sudan General Life segments Total Shs ’000 Shs ’000 Shs ’000 Shs ’000 Shs ’000 Shs ’000 Shs ’000
Gross written premium (external customers) 3,866,575 317,352 396,747 1,130,480 107,697 - 5,818,851Gross earned premium 3,562,030 317,352 320,451 1,066,577 107,697 - 5,374,107Net earned premium 2,782,471 218,426 257,849 795,856 93,158 - 4,147,760Interest income 53,806 79,491 4,645 30,360 6,891 5,621 180,814Other investment income 337,529 370,789 4,064 222,528 2,215 - 937,125Commissions and other income 221,243 43,000 19,018 63,534 3,021 - 349,816Total income 3,395,049 711,706 285,576 1,112,275 105,285 5,621 5,615,512
Claims and policy owners’ benefits payable (1,537,083) (451,019) (52,544) (328,577) (55,606) - (2,424,829)Finance cost (51,230) - - (2,083) (206) - (53,519)Depreciation (40,050) (4,502) (8,100) (9,088) (92) - (61,832)Amortisation (15,788) - - - - (19,834) (35,622)Commissions and other operating expenses (1,304,625) (299,993) (184,814) (400,703) (48,006) (8,143) (2,246,284)Share of loss of associate - - - - - (3,572) (3,572)Profit before tax 446,273 (43,808) 40,118 371,824 1,375 (25,928) 789,854Income tax expense (102,730) - (6,018) (45,413) (1,375) - (155,537)Profit or (loss) for the year 343,543 (43,808) 34,100 326,410 - (25,928) 634,317
Profit or (loss) after tax 343,543 (43,808) 34,100 326,410 - (25, 298) 634,317Non-controlling interests - - - (150,602) - - (150,602)
Profit attributable to shareholders of the parent 343,543 (43,808) 34,100 175,808 - (25,928) 483,715Other comprehensive income 585,742 - 26,863 (85,146) 3,845 - 531,304Total comprehensive income 929,287 (43,808) 60,963 241,264 3,845 (25,928) 1,165,621Investment in associate - - - - - 1,783 1,783
Additions:Property and equipment 56,646 24,671 4,717 96,224 934 - 183,192Investment property 1,472 - - - - - 1,472Intangible assets - - - - - 29,333 29,333Total assets 7,179,275 2,646,632 630,498 1,757,873 154,687 24,036 12,393,002Total equity 2,809,482 112,703 303,917 1,119,576 45,723 7,781 4,339,183
U A P H O L D I N G S L I M I T E D69ANNUAL REPORT & FINANCIAL
STATEMENTS FOR THE YEAR ENDED 31 DECEMBER 2010ANNUAL REPORT & FINANCIAL
STATEMENTS FOR THE YEAR ENDED 31 DECEMBER 2010
Notes to the Financial Statements (continued)
5(a). Segmental information (continued)

70U A P H O L D I N G S L I M I T E D
The segment information for the year ended 31 December 2009 is as follows:
UAP Kenya UAP Kenya UAP UAP Uganda UAP Uganda All other General Life Sudan General Life segments Total Shs ’000 Shs ’000 Shs ’000 Shs ’000 Shs ’000 Shs ’000 Shs ’000
Gross written premium (external customers) 3,064,856 208,201 311,214 887,276 54,511 - 4,526,058Gross earned premium 2,841,204 208,201 290,812 753,536 54,511 - 4,148,264Net earned premium 2,361,154 127,706 234,802 571,946 42,473 - 3,338,081Interest income 45,169 61,118 6,725 21,547 7,072 11,310 152,961Other investment income 237,149 62,985 4,992 45,271 4,641 15 355,053Commissions and other income 162,035 40,099 9,151 37,350 5,744 - 254,379Total income 2,805,507 291,908 255,670 676,114 59,950 11,325 4,100,474
Claims and policy owners’ benefits payable (1,510,608) (174,902) (40,591) (202,288) (23,227) - (1,951,616)Finance cost 69,032) - - (2,258) - - (71,290)Depreciation (31,959) (1,188) (7,216) (11,056) (52) (1,217) (52,688)Amortisation (5,700) (260) - - - - (5,960)Commissions and other operating expenses (1,006,907) (222,598) (133,053) (336,994) (29,291) (9,588) (1,738,431)Share of loss of associate - - - - - - -Profit before tax 181,301 (107,040) 74,810 123,518 7,380 520 280,489Income tax expense (16,462) - (11,222) (49,490) (3,563) - (80,737)Profit for the year 164,839 (107,040) 63,588 74,028 3,817 520 199,752
Profit or (loss) after tax 164,839 (107,040) 63,588 74,028 3,817 520 199,752Non-controlling interests - - - (36,291) (1,794) - (38,085)Profit attributable to shareholdersof the parent 164,839 (107,040) 63,588 37,737 2,023 520 161,667Other comprehensive income (348,853) - (8,120) (23,880) (13,854) - (394,707)Total comprehensive income (184,014) (107,040) 55,468 50,148 (10,037) 520 (194,955)
Property and equipment 70,598 4,799 13,566 13,252 - - 102,214Investment property 83,149 - - - - - 83,149Intangible assets 12,608 4,786 - - - - 23,632Total assets 6,464,007 1,985,339 498,245 641,869 154,687 82,944 9,827,091Total equity 2,822,201 147,871 274,258 150,796 40,488 10,296 3,445,910
ANNUAL REPORT & FINANCIAL STATEMENTS FOR THE YEAR ENDED 31 DECEMBER 2010
Notes to the Financial Statements (continued)
5(a). Segmental information (continued)

71 U A P H O L D I N G S L I M I T E D
The premium income of the Group can be analysed between the main classes of business as shown below:-
Gross Written Premium Gross Earned Premium 2010 2009 2010 2009 Shs ’000 Shs ’000 Shs ’000 Shs ’000Short term insurance businessEngineering 208,834 143,777 191,102 145,383Fire 835,576 568,955 734,486 531,386Liability 118,156 111,858 121,441 104,626Marine 201,459 187,422 203,584 183,271Motor 2,124,081 1,601,139 1,832,783 1,433,446Workmen’s compensation 336,526 311,052 359,109 249,099Personal accident 1,113,841 1,016,285 1,115,404 934,751Theft 257,707 292,403 238,559 274,832Others 197,623 33,183 152,591 31,486 5,393,803 4,266,074 4,949,059 3,888,280
Long term insurance business Ordinary life 173,113 91,404 173,113 91,404Group life 251,935 168,580 251,935 168,580 425,048 259,984 425,048 259,984 5,818,851 4,526,058 5,374,107 4,148,264
Gross written premium represents the total premiums receivable by the Group before adjusting for the unearned proportion of the premiums. It is reported in the income statement for information purposes only. Revenue comprises gross earned premiums. All revenue is earned from external customers.
U A P H O L D I N G S L I M I T E D71ANNUAL REPORT & FINANCIAL
STATEMENTS FOR THE YEAR ENDED 31 DECEMBER 2010ANNUAL REPORT & FINANCIAL
STATEMENTS FOR THE YEAR ENDED 31 DECEMBER 2010
Notes to the Financial Statements (continued)
5(b). Gross earned premiums
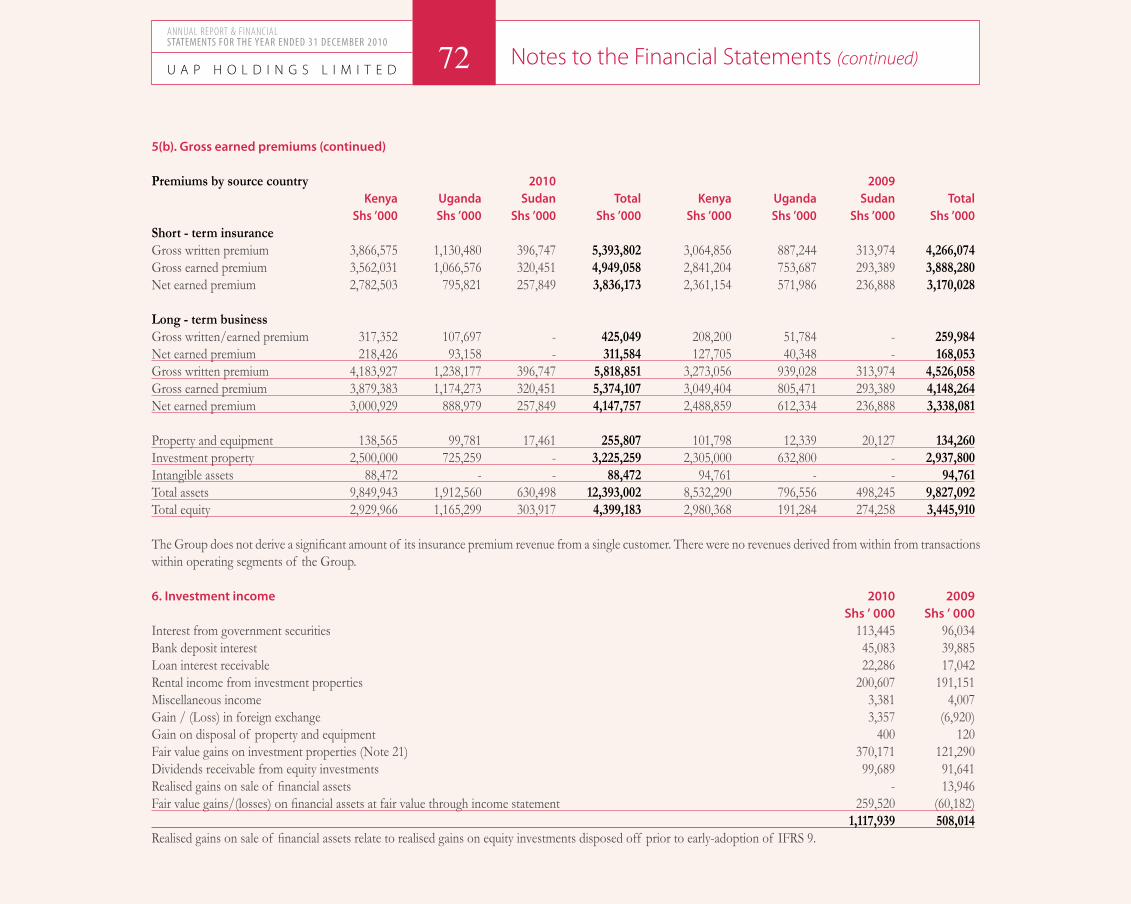
72U A P H O L D I N G S L I M I T E D
Premiums by source country 2010 2009 Kenya Uganda Sudan Total Kenya Uganda Sudan Total Shs ’000 Shs ’000 Shs ’000 Shs ’000 Shs ’000 Shs ’000 Shs ’000 Shs ’000Short - term insurance Gross written premium 3,866,575 1,130,480 396,747 5,393,802 3,064,856 887,244 313,974 4,266,074Gross earned premium 3,562,031 1,066,576 320,451 4,949,058 2,841,204 753,687 293,389 3,888,280Net earned premium 2,782,503 795,821 257,849 3,836,173 2,361,154 571,986 236,888 3,170,028
Long - term business Gross written/earned premium 317,352 107,697 - 425,049 208,200 51,784 - 259,984Net earned premium 218,426 93,158 - 311,584 127,705 40,348 - 168,053Gross written premium 4,183,927 1,238,177 396,747 5,818,851 3,273,056 939,028 313,974 4,526,058Gross earned premium 3,879,383 1,174,273 320,451 5,374,107 3,049,404 805,471 293,389 4,148,264Net earned premium 3,000,929 888,979 257,849 4,147,757 2,488,859 612,334 236,888 3,338,081 Property and equipment 138,565 99,781 17,461 255,807 101,798 12,339 20,127 134,260Investment property 2,500,000 725,259 - 3,225,259 2,305,000 632,800 - 2,937,800Intangible assets 88,472 - - 88,472 94,761 - - 94,761Total assets 9,849,943 1,912,560 630,498 12,393,002 8,532,290 796,556 498,245 9,827,092Total equity 2,929,966 1,165,299 303,917 4,399,183 2,980,368 191,284 274,258 3,445,910
The Group does not derive a significant amount of its insurance premium revenue from a single customer. There were no revenues derived from within from transactions within operating segments of the Group.
6. Investment income 2010 2009 Shs ’ 000 Shs ’ 000Interest from government securities 113,445 96,034Bank deposit interest 45,083 39,885Loan interest receivable 22,286 17,042Rental income from investment properties 200,607 191,151Miscellaneous income 3,381 4,007Gain / (Loss) in foreign exchange 3,357 (6,920)Gain on disposal of property and equipment 400 120Fair value gains on investment properties (Note 21) 370,171 121,290Dividends receivable from equity investments 99,689 91,641Realised gains on sale of financial assets - 13,946Fair value gains/(losses) on financial assets at fair value through income statement 259,520 (60,182) 1,117,939 508,014 Realised gains on sale of financial assets relate to realised gains on equity investments disposed off prior to early-adoption of IFRS 9.
ANNUAL REPORT & FINANCIAL STATEMENTS FOR THE YEAR ENDED 31 DECEMBER 2010
Notes to the Financial Statements (continued)
5(b). Gross earned premiums (continued)
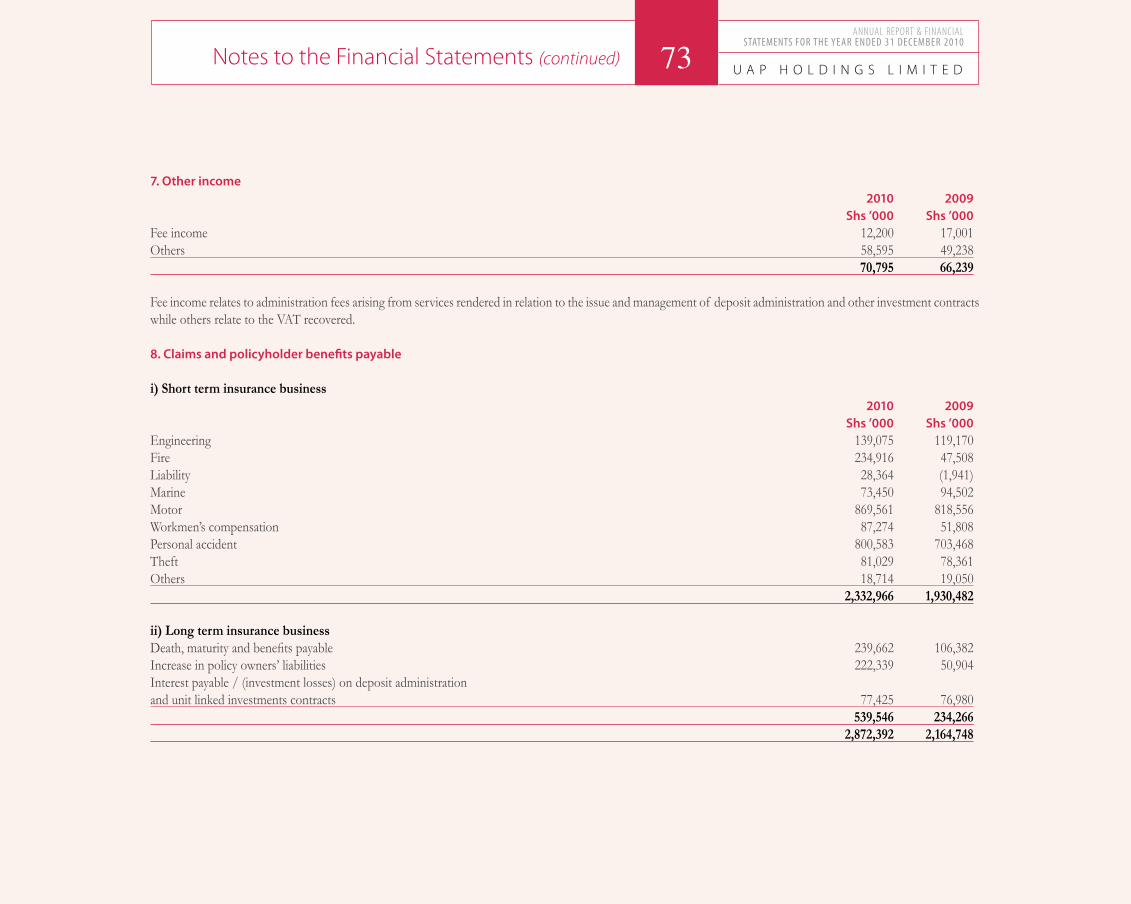
7. Other income 2010 2009 Shs ’000 Shs ’000Fee income 12,200 17,001Others 58,595 49,238 70,795 66,239
Fee income relates to administration fees arising from services rendered in relation to the issue and management of deposit administration and other investment contracts while others relate to the VAT recovered.
8. Claims and policyholder benefits payable
i) Short term insurance business 2010 2009 Shs ’000 Shs ’000Engineering 139,075 119,170Fire 234,916 47,508Liability 28,364 (1,941)Marine 73,450 94,502Motor 869,561 818,556Workmen’s compensation 87,274 51,808Personal accident 800,583 703,468Theft 81,029 78,361Others 18,714 19,050 2,332,966 1,930,482
ii) Long term insurance business Death, maturity and benefits payable 239,662 106,382 Increase in policy owners’ liabilities 222,339 50,904 Interest payable / (investment losses) on deposit administration and unit linked investments contracts 77,425 76,980 539,546 234,266 2,872,392 2,164,748
U A P H O L D I N G S L I M I T E D73ANNUAL REPORT & FINANCIAL
STATEMENTS FOR THE YEAR ENDED 31 DECEMBER 2010
Notes to the Financial Statements (continued)
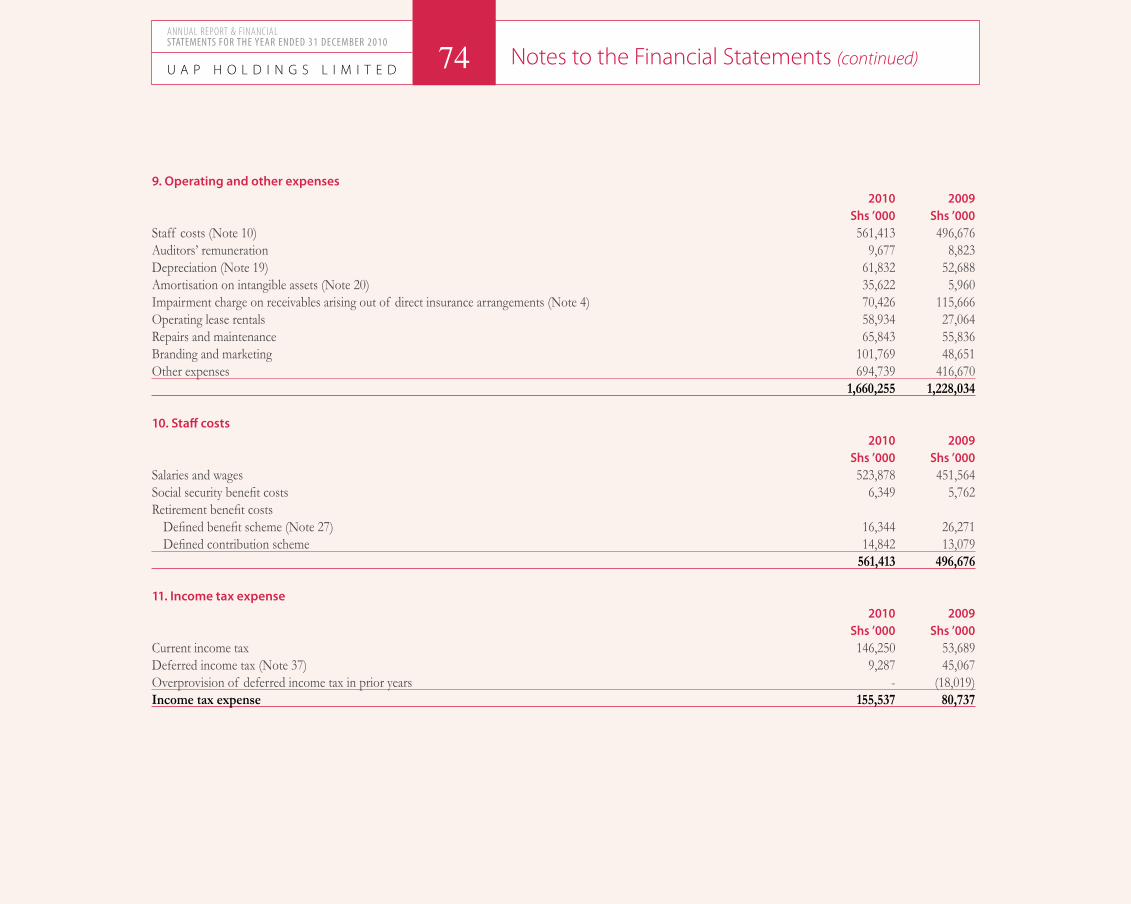
9. Operating and other expenses 2010 2009 Shs ’000 Shs ’000Staff costs (Note 10) 561,413 496,676Auditors’ remuneration 9,677 8,823Depreciation (Note 19) 61,832 52,688Amortisation on intangible assets (Note 20) 35,622 5,960Impairment charge on receivables arising out of direct insurance arrangements (Note 4) 70,426 115,666Operating lease rentals 58,934 27,064Repairs and maintenance 65,843 55,836Branding and marketing 101,769 48,651Other expenses 694,739 416,670 1,660,255 1,228,034
10. Staff costs 2010 2009 Shs ’000 Shs ’000Salaries and wages 523,878 451,564Social security benefit costs 6,349 5,762Retirement benefit costs
Defined benefit scheme (Note 27) 16,344 26,271 Defined contribution scheme 14,842 13,079 561,413 496,676 11. Income tax expense 2010 2009 Shs ’000 Shs ’000Current income tax 146,250 53,689Deferred income tax (Note 37) 9,287 45,067Overprovision of deferred income tax in prior years - (18,019)Income tax expense 155,537 80,737
U A P H O L D I N G S L I M I T E D 74ANNUAL REPORT & FINANCIAL STATEMENTS FOR THE YEAR ENDED 31 DECEMBER 2010
Notes to the Financial Statements (continued)

75 U A P H O L D I N G S L I M I T E D
The tax on the Group’s profit before income tax differs from the theoretical amount that would arise using the statutory income tax rate as follows:
2010 2009 Shs ’000 Shs ’000Profit before tax 789,854 280,489Tax calculated at a tax rate of 30% 236,956 84,147Less: tax effect of income not subject to tax (90,385) (40,840)Add: tax effect of expenses not deductible for tax purposes 8,966 55,449Overprovision of deferred income tax in prior years - (18,019)Income tax expense 155,537 80,737
12. Share capital
Number of Ordinary shares shares (Thousands) Shs’000Balance at 1 January 2009, Balance at 31 December 2009 and at 31 December 2010 120,000 600,000
13. Earnings per shareBasic earnings per share are calculated by dividing the profit attributable to equity holders of the Company by the weighted average number of ordinary shares outstanding during the year.
2010 2009 Shs ’000 Shs ’000Profit attributable to equity holders of the Company (Shs’000) 483,715 161,667Weighted number of shares in issue (in thousands) 120,000 120,000Basic earnings per share (Shs) 4.03 1.35Diluted earnings per share (Shs) 4.03 1.35
There were no potentially dilutive shares outstanding at 31 December 2010 or 31 December 2009. Diluted earnings per share are therefore the same as basic earnings per share.
14. Fair value reserve for equity investmentsMovements in the fair value reserve are shown in the statement of changes in equity on pages 43 and 44. This reserve is not distributable.
U A P H O L D I N G S L I M I T E D75ANNUAL REPORT & FINANCIAL
STATEMENTS FOR THE YEAR ENDED 31 DECEMBER 2010ANNUAL REPORT & FINANCIAL
STATEMENTS FOR THE YEAR ENDED 31 DECEMBER 2010
Notes to the Financial Statements (continued)
11. Income tax expense (continued)
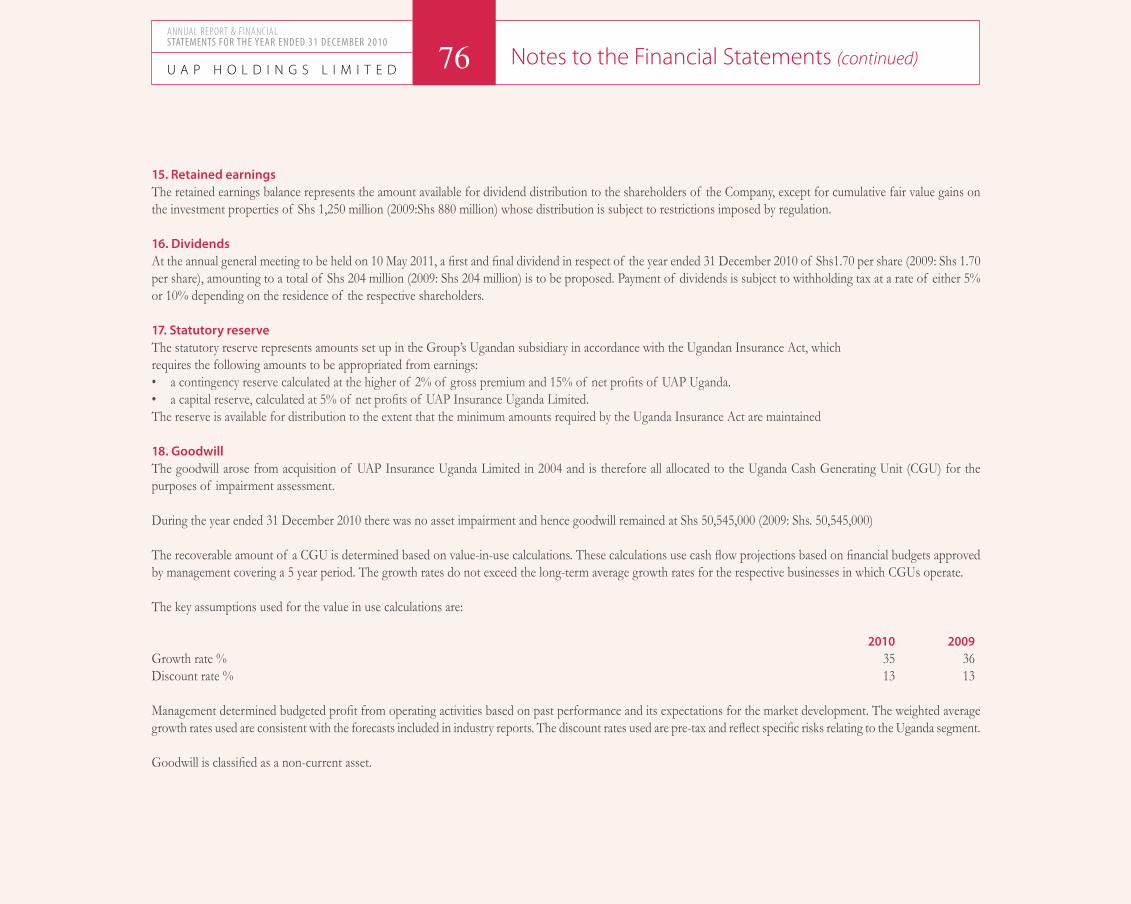
15. Retained earningsThe retained earnings balance represents the amount available for dividend distribution to the shareholders of the Company, except for cumulative fair value gains on the investment properties of Shs 1,250 million (2009:Shs 880 million) whose distribution is subject to restrictions imposed by regulation.
16. DividendsAt the annual general meeting to be held on 10 May 2011, a first and final dividend in respect of the year ended 31 December 2010 of Shs1.70 per share (2009: Shs 1.70 per share), amounting to a total of Shs 204 million (2009: Shs 204 million) is to be proposed. Payment of dividends is subject to withholding tax at a rate of either 5% or 10% depending on the residence of the respective shareholders.
17. Statutory reserveThe statutory reserve represents amounts set up in the Group’s Ugandan subsidiary in accordance with the Ugandan Insurance Act, which requires the following amounts to be appropriated from earnings:• a contingency reserve calculated at the higher of 2% of gross premium and 15% of net profits of UAP Uganda.• a capital reserve, calculated at 5% of net profits of UAP Insurance Uganda Limited.The reserve is available for distribution to the extent that the minimum amounts required by the Uganda Insurance Act are maintained
18. GoodwillThe goodwill arose from acquisition of UAP Insurance Uganda Limited in 2004 and is therefore all allocated to the Uganda Cash Generating Unit (CGU) for the purposes of impairment assessment.
During the year ended 31 December 2010 there was no asset impairment and hence goodwill remained at Shs 50,545,000 (2009: Shs. 50,545,000)
The recoverable amount of a CGU is determined based on value-in-use calculations. These calculations use cash flow projections based on financial budgets approved by management covering a 5 year period. The growth rates do not exceed the long-term average growth rates for the respective businesses in which CGUs operate. The key assumptions used for the value in use calculations are:
2010 2009Growth rate % 35 36Discount rate % 13 13
Management determined budgeted profit from operating activities based on past performance and its expectations for the market development. The weighted average growth rates used are consistent with the forecasts included in industry reports. The discount rates used are pre-tax and reflect specific risks relating to the Uganda segment.
Goodwill is classified as a non-current asset.
U A P H O L D I N G S L I M I T E D 76ANNUAL REPORT & FINANCIAL STATEMENTS FOR THE YEAR ENDED 31 DECEMBER 2010
Notes to the Financial Statements (continued)

19. Property and equipment -Group Office Capital furniture & Computer Motor work-in- Telephone equipment equipment vehicles progress equipment TotalYear ended 31 December 2010: Shs ’000 Shs ’000 Shs ’000 Shs ’000 Shs ’000 Shs ’000Cost At 1 January 2010 159,127 197,555 34,302 39,149 6,413 436,546Additions 56,780 14,664 3,926 107,822 - 183,192Disposals (15) - (1,692) - - (1,707)Translation difference (4,239) (4,818) (1,085) - - (10,142)At 31 December 2010 211,653 207,401 35,451 146,971 6,413 607,889
Depreciation At 1 January 2010 124,599 147,068 24,206 - 6,413 302,286Charge for the year 24,313 31,409 6,110 - - 61,832Accumulated depreciation on disposals (15) - (1,236) - - (1,251)Translation difference (4,289) (5,490) (1,006) - - (10,785)At 31 December 2010 144,608 172,987 28,074 - 6,413 352,082Net book amountAt 31 December 2010 67,045 34,414 7,377 146,971 - 255,807 Year ended 31 December 2009: Cost At 1 January 2009 142,570 148,830 30,610 7,519 6,413 335,942Additions 19,401 47,139 4,044 31,630 - 102,214Disposals - (271) (1,144) - - (1,415)Transfer to computer equipment (27) 27 - - - -Translation difference (2,817) 1,830 792 - - (195)At 31 December 2009 159,127 197,555 34,302 39,149 6,413 436,546
Depreciation At 1 January 2009 106,513 116,735 20,895 - 6,413 250,556Charge for the year 18,086 30,553 4,049 - - 52,688Accumulated depreciation on disposals - (220) (738) - - (958)At 31 December 2009 124,599 147,068 24,206 - 6,413 302,286Net book amountAt 31 December 2009 34,528 50,487 10,096 39,149 - 134,260
U A P H O L D I N G S L I M I T E D77ANNUAL REPORT & FINANCIAL
STATEMENTS FOR THE YEAR ENDED 31 DECEMBER 2010
Notes to the Financial Statements (continued)

19. Property and equipment - company 2010 2009Cost- Computers Shs ’000 Shs ’000At start of year - -Additions - -Transferred from related parties 23,200 -At 31 December 2010 23,200 -
Property and equipment are classified as non-current assets.
20. Intangible assets(a) Group 2010 2009At 1 January: Shs ’000 Shs ’000Cost 107,228 83,596Accumulated amortisation and impairment (12,467) (6,507)
Net book amount 94,761 77,089
Year ended 31 December:Opening net book amount 94,761 77,089Additions 29,333 23,632Amortisation (35,622) (5,960)Closing net book amount 88,472 94,761
At 31 December: Cost 136,561 107,228Accumulated amortisation and impairment (48,089) (12,467)Net book amount 88,472 94,761
Intangible assets relate to computer software. As at 31 December 2010, the cost associated with computer software that had not been commissioned was Shs 89 million. No amortisation was therefore charged on this component of software.
U A P H O L D I N G S L I M I T E D 78ANNUAL REPORT & FINANCIAL STATEMENTS FOR THE YEAR ENDED 31 DECEMBER 2010
Notes to the Financial Statements (continued)

(b) Company 2010 2009Carrying value Shs ’000 Shs ’000At start of year 6,238 -Additions - 6,238Transferred from related parties 98,462 -Accumulated amortisation (17,400) -At end of year 87,300 6,238
The intangible assets for the company relate to computer software. No amortisation was therefore charged on the software. All intangible assets are classified as non-current assets.
21. Investment properties 2010 2009 Shs ’000 Shs ’000At start of year 2,937,800 2,730,244Additions 1,472 83,149Fair value gains 370,171 121,290Currency translation difference (84,184) 3,117At end of year 3,225,259 2,937,800
The Group’s investment properties were revalued in December 2010 and 2009 by Knight Frank and Bageine & Company Surveyors and Valuers, professional independent valuers in Kenya and Uganda respectively on the basis of determining the open market value of the investment property. The open market value of all properties was determined using recent market prices.. The rental income earned by the Group from its investment properties leased out under operating leases amounted to Shs 201 million (2009: Shs 191 million). Direct operating expenses arising on investment properties amounted to Shs 12.3 million (2009: Shs 10.2 million). A critical assumption has been made in the valuation of one of the Group’s investment properties. Refer to note 3(f) for details. All investment properties are classified as non-current assets.
22. Investment in associates Group Company 2010 2009 2010 2009 Shs ’000 Shs ’000 Shs ’000 Shs ’000At start of year - - - -Acquisition 5,355 - 3,255 -Share of profit/(loss) (3,572) - - -Other equity movements (available for sale reserve) - - - -At end of year 1,783 - 3,255 -
The Group’s share of the results of its principal associate of which is unlisted, and it’s aggregated assets (including goodwill) and liabilities are as follows:
U A P H O L D I N G S L I M I T E D79ANNUAL REPORT & FINANCIAL
STATEMENTS FOR THE YEAR ENDED 31 DECEMBER 2010
Notes to the Financial Statements (continued)
20. Intangible assets (continued)

80U A P H O L D I N G S L I M I T E D
Country of % Interest assets liabilities revenue loss) 2010 Incorporation held Shs ’000 Shs ’000 Shs ’000 Shs ’000UAP Financial Services Ltd Uganda 100% 17,245 2,567 2,342 (8,505)Group’s ShareUAP Financial Services Ltd Uganda 42% 7,243 1,078 984 (3,572
During the year, the company increased its investment in subsidiaries as follows:
23. Investment in subsidiaries Country of Interest 2010 2009 Incorporation held(%) Shs ’000 Shs’000UAP Insurance Company Limited Kenya 100 600,000 600,000UAP Insurance Uganda Limited Uganda 53 202,507 202,507UAP Insurance Sudan Limited Sudan 100 213,667 213,667UAP Life Assurance Limited Kenya 100 70,335 61,697UAP Credit Services Limited Kenya 100 10,000 10,000 1,096,509 1,087,871
During the year, the company increased its investment in subsidiaries as follows: 2010 2009 Shs ’000 Shs’000UAP Insurance Sudan Limited - 95,770UAP Life Assurance Limited 8,637 11,697Total 8,637 107,467
The investment in subsidiaries is classified as a non-current asset.
24. Reinsurer’s share of insurance liabilities 2010 2009Reinsurer’s share of: Shs ’000 Shs’000Unearned premium (Note 38) 292,400 313,104Notified claims outstanding - short term insurance (Note 35) 631,374 271,931Long term insurance contract liabilities (Note 35) 74,364 37,954Claims incurred but not reported short term insurance (Note 35) 75,976 43,998
At 31 December 1,074,114 666,987
Amounts due from reinsurers in respect of claims already paid by the Group on contracts that are reinsured are included in receivables arising out of reinsurance arrangements on the statement of financial position. Movements in the above reinsurance assets are shown in note 34 and 35. Reinsurer’s share of insurance liabilities is classified as a current asset.
ANNUAL REPORT & FINANCIAL STATEMENTS FOR THE YEAR ENDED 31 DECEMBER 2010
Notes to the Financial Statements (continued)
22. Investment in associates (continued)

25. Mortgage loans receivable 2010 2009 Shs ’000 Shs’000At start of year 54,214 45,389Loans advanced 19,931 20,047Loan repayments (10,042) (11,222)At end of year 64,103 54,214
Maturity profile of loans 2010 2009Loans maturing Shs ’000 Shs’000Within 1 year 3,005 3,771In 1-5 years 4,758 6,631Over 5 years 56,340 43,812At end of year 64,103 54,214
There is no concentration of credit risk with respect to mortgage loans. Loans maturing within 1 year are classified as current assets while those with a maturity period of more than 1 year are classified as non-current assets.
26. Deferred acquisition costs 2010 2009 Shs ’000 Shs’000At start of year 133,021 93,500Additions 197,085 129,406Amortisation charge (126,872) (89,885)At end of year 203,234 133,021
Deferred acquisition costs are classified as current assets.
27. Retirement benefit obligation
Description of plan The Group operates a funded defined benefit plan for all employees. The Scheme is open to new, entrants. Scheme members’ contributions are a fixed percentage of pensionable pay with the Group responsible for the balance of the cost of benefits accruing. The Scheme is established under trust. The Scheme funds are invested by a fund manager in a variety of asset classes comprising government securities (Treasury bills and bonds), stocks and shares and commercial paper.
U A P H O L D I N G S L I M I T E D81ANNUAL REPORT & FINANCIAL
STATEMENTS FOR THE YEAR ENDED 31 DECEMBER 2010
Notes to the Financial Statements (continued)

The amounts recognised in the balance sheet are determined as follows: 2010 2009 Shs ’000 Shs ’000Present value of funded obligations 318,680 295,127Fair value of plan assets 517,779 392,179Present value of unfunded obligations/(over-funding) (199,099) (97,052)Unrecognised actuarial gains 106,177 25,359Asset in the statement of financial position (92,922) (71,693)
The retirement benefit asset is classified as a non-current asset. The movement in the defined benefit obligation over the year was as follows: 2010 2009 Shs ’000 Shs ’000At start of year 295,127 276,515Current service cost 29,849 33,077Interest cost 40,358 34,054Actuarial losses (29,302) (30,407)Benefits paid (17,352) (18,112)At end of year 318,680 295,127
The movement in the fair value of the plan assets is as follows: 2010 2009 Shs ’000 Shs ’000At start of year 392,179 341,349Expected return on scheme assets 53,864 42,386Actuarial gain / (losses) 51,508 (9,163)Employer contributions 21,350 22,024Employee contributions 16,230 13,695Benefits paid (17,352) (18,112)At end of year 517,779 392,179
Plan assets comprise: 2010 2010 2009 2009 Shs ’000 %age Shs ’000 %ageEquity instruments 171,624 33.15 141,140 35.99Debt instruments 295,647 57.10 224,154 57.16Other 50,508 9.75 26,885 6.86 517,779 100 392,179 100
U A P H O L D I N G S L I M I T E D 82ANNUAL REPORT & FINANCIAL STATEMENTS FOR THE YEAR ENDED 31 DECEMBER 2010
Notes to the Financial Statements (continued)
27. Retirement benefit obligation (continued)
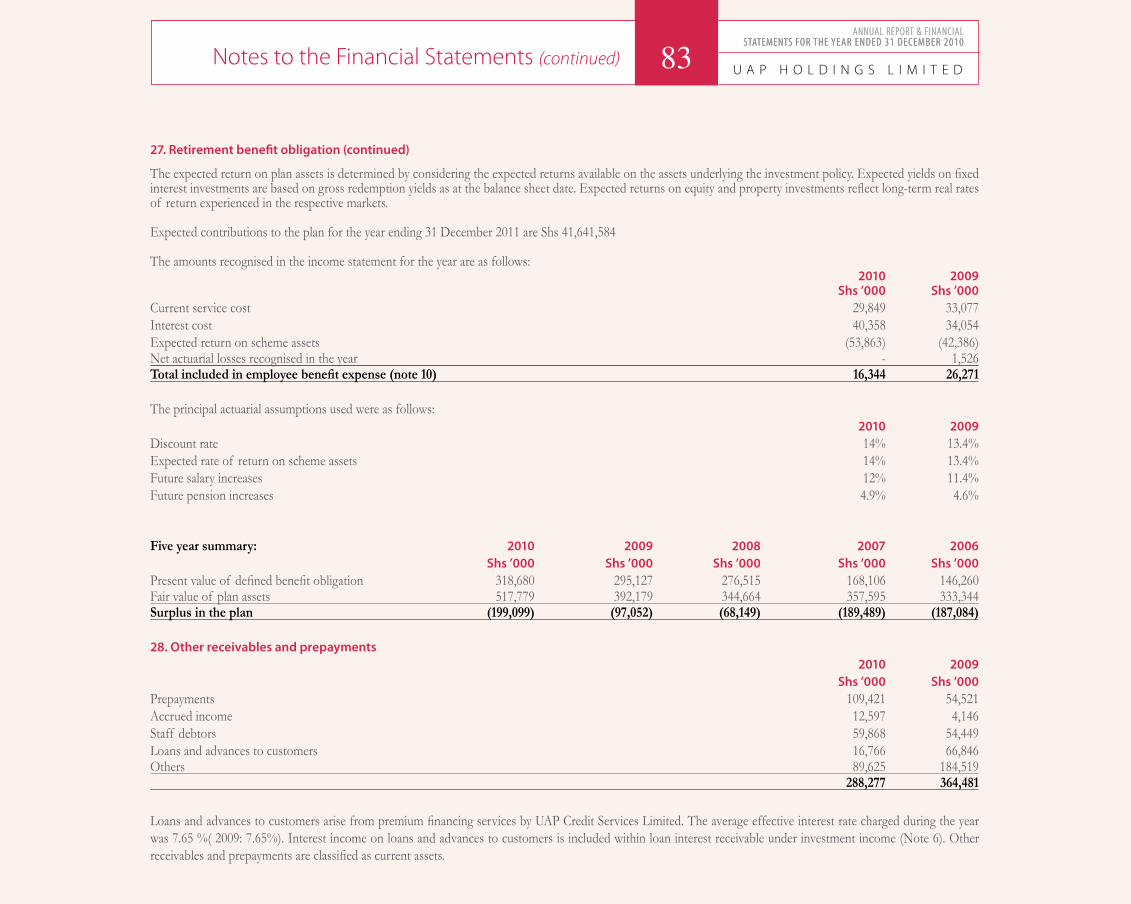
83 U A P H O L D I N G S L I M I T E D
The expected return on plan assets is determined by considering the expected returns available on the assets underlying the investment policy. Expected yields on fixed interest investments are based on gross redemption yields as at the balance sheet date. Expected returns on equity and property investments reflect long-term real rates of return experienced in the respective markets.
Expected contributions to the plan for the year ending 31 December 2011 are Shs 41,641,584
The amounts recognised in the income statement for the year are as follows: 2010 2009 Shs ’000 Shs ’000Current service cost 29,849 33,077Interest cost 40,358 34,054Expected return on scheme assets (53,863) (42,386)Net actuarial losses recognised in the year - 1,526Total included in employee benefit expense (note 10) 16,344 26,271
The principal actuarial assumptions used were as follows: 2010 2009Discount rate 14% 13.4%Expected rate of return on scheme assets 14% 13.4%Future salary increases 12% 11.4%Future pension increases 4.9% 4.6%
Five year summary: 2010 2009 2008 2007 2006 Shs ’000 Shs ’000 Shs ’000 Shs ’000 Shs ’000Present value of defined benefit obligation 318,680 295,127 276,515 168,106 146,260Fair value of plan assets 517,779 392,179 344,664 357,595 333,344Surplus in the plan (199,099) (97,052) (68,149) (189,489) (187,084)
28. Other receivables and prepayments 2010 2009 Shs ’000 Shs ’000Prepayments 109,421 54,521Accrued income 12,597 4,146Staff debtors 59,868 54,449Loans and advances to customers 16,766 66,846Others 89,625 184,519 288,277 364,481
Loans and advances to customers arise from premium financing services by UAP Credit Services Limited. The average effective interest rate charged during the year was 7.65 %( 2009: 7.65%). Interest income on loans and advances to customers is included within loan interest receivable under investment income (Note 6). Other receivables and prepayments are classified as current assets.
27. Retirement benefit obligation (continued)
U A P H O L D I N G S L I M I T E D83ANNUAL REPORT & FINANCIAL
STATEMENTS FOR THE YEAR ENDED 31 DECEMBER 2010ANNUAL REPORT & FINANCIAL
STATEMENTS FOR THE YEAR ENDED 31 DECEMBER 2010
Notes to the Financial Statements (continued)
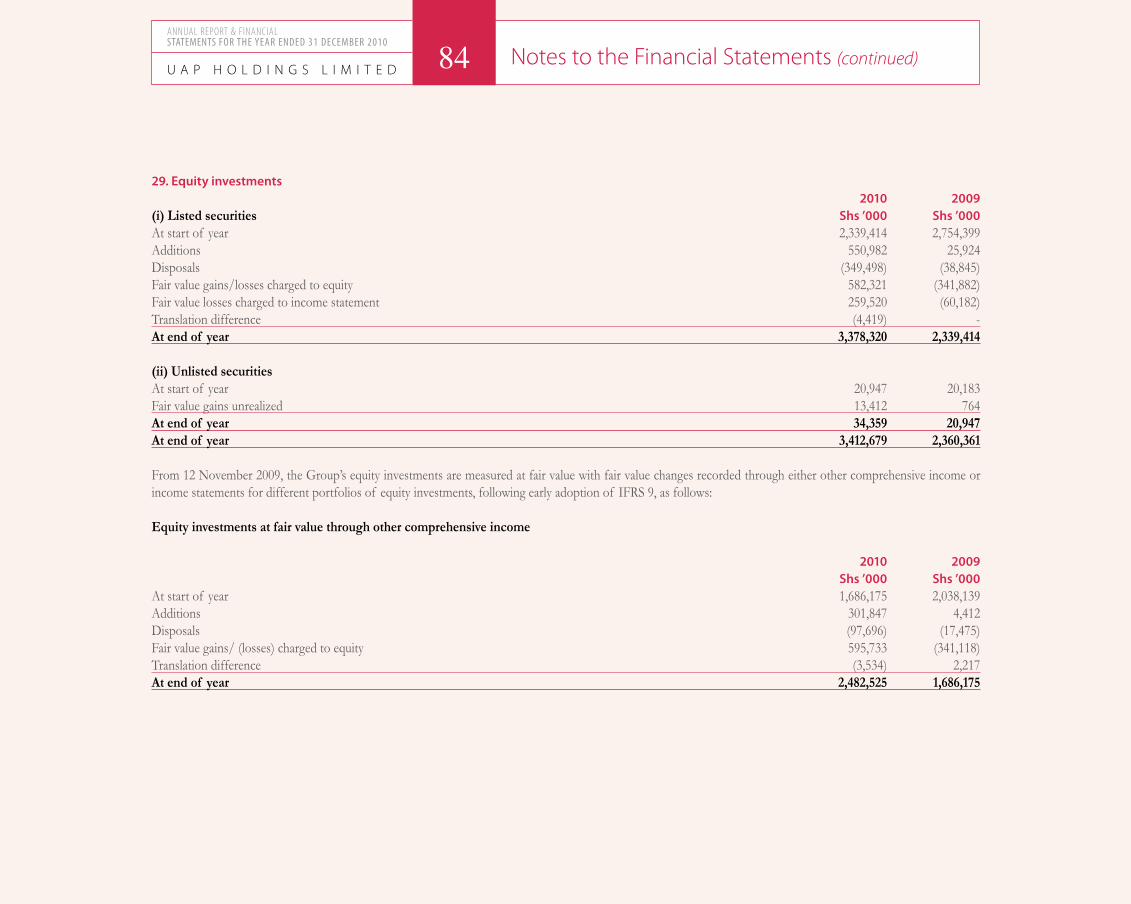
29. Equity investments 2010 2009(i) Listed securities Shs ’000 Shs ’000At start of year 2,339,414 2,754,399Additions 550,982 25,924Disposals (349,498) (38,845)Fair value gains/losses charged to equity 582,321 (341,882)Fair value losses charged to income statement 259,520 (60,182)Translation difference (4,419) -At end of year 3,378,320 2,339,414
(ii) Unlisted securitiesAt start of year 20,947 20,183Fair value gains unrealized 13,412 764At end of year 34,359 20,947At end of year 3,412,679 2,360,361
From 12 November 2009, the Group’s equity investments are measured at fair value with fair value changes recorded through either other comprehensive income or income statements for different portfolios of equity investments, following early adoption of IFRS 9, as follows:
Equity investments at fair value through other comprehensive income
2010 2009 Shs ’000 Shs ’000At start of year 1,686,175 2,038,139Additions 301,847 4,412Disposals (97,696) (17,475)Fair value gains/ (losses) charged to equity 595,733 (341,118)Translation difference (3,534) 2,217At end of year 2,482,525 1,686,175
U A P H O L D I N G S L I M I T E D 84ANNUAL REPORT & FINANCIAL STATEMENTS FOR THE YEAR ENDED 31 DECEMBER 2010
Notes to the Financial Statements (continued)
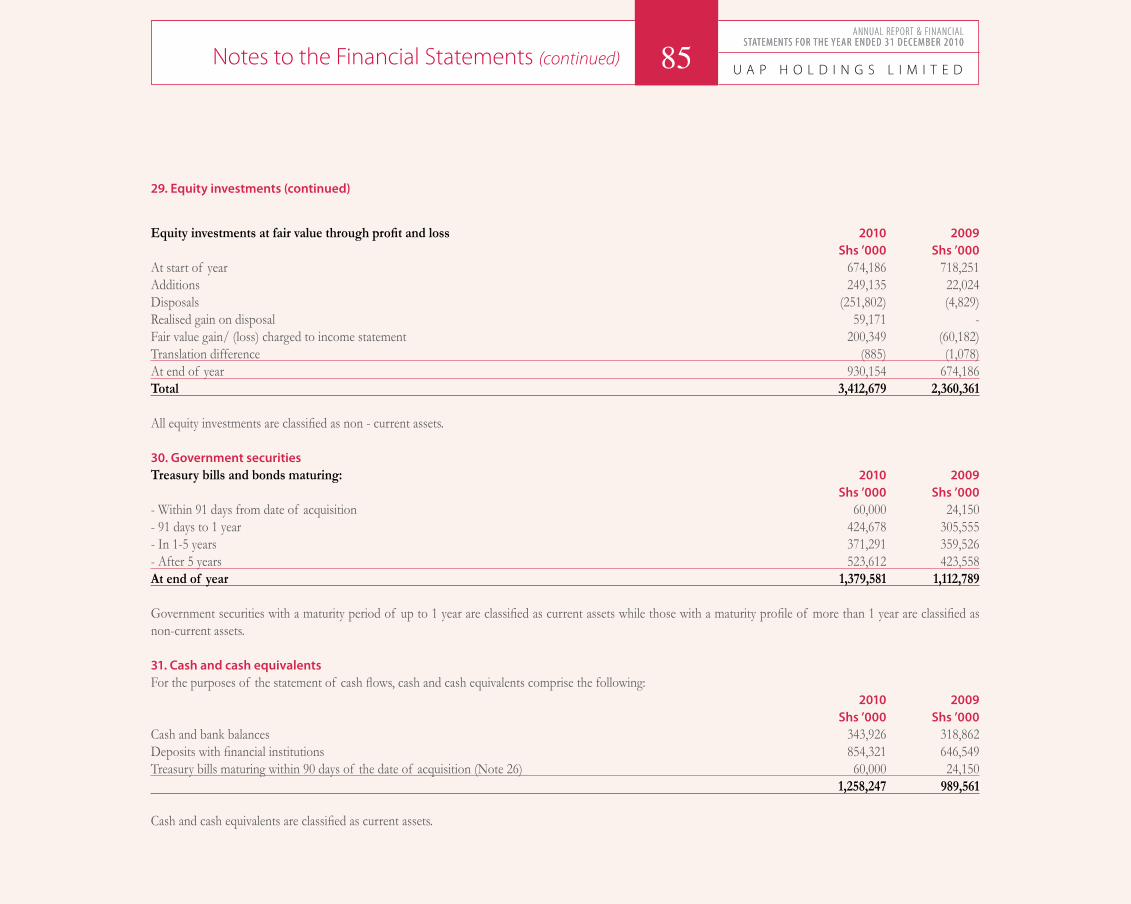
85 U A P H O L D I N G S L I M I T E D
Equity investments at fair value through profit and loss 2010 2009 Shs ’000 Shs ’000At start of year 674,186 718,251Additions 249,135 22,024Disposals (251,802) (4,829)Realised gain on disposal 59,171 -Fair value gain/ (loss) charged to income statement 200,349 (60,182)Translation difference (885) (1,078)At end of year 930,154 674,186Total 3,412,679 2,360,361
All equity investments are classified as non - current assets.
30. Government securitiesTreasury bills and bonds maturing: 2010 2009 Shs ’000 Shs ’000- Within 91 days from date of acquisition 60,000 24,150- 91 days to 1 year 424,678 305,555- In 1-5 years 371,291 359,526- After 5 years 523,612 423,558At end of year 1,379,581 1,112,789
Government securities with a maturity period of up to 1 year are classified as current assets while those with a maturity profile of more than 1 year are classified as non-current assets.
31. Cash and cash equivalentsFor the purposes of the statement of cash flows, cash and cash equivalents comprise the following: 2010 2009 Shs ’000 Shs ’000Cash and bank balances 343,926 318,862Deposits with financial institutions 854,321 646,549Treasury bills maturing within 90 days of the date of acquisition (Note 26) 60,000 24,150 1,258,247 989,561
Cash and cash equivalents are classified as current assets.
29. Equity investments (continued)
U A P H O L D I N G S L I M I T E D85ANNUAL REPORT & FINANCIAL
STATEMENTS FOR THE YEAR ENDED 31 DECEMBER 2010ANNUAL REPORT & FINANCIAL
STATEMENTS FOR THE YEAR ENDED 31 DECEMBER 2010
Notes to the Financial Statements (continued)

32. Amounts payable under deposit administration contracts Deposit administration contracts are recorded at amortised cost. Movements in amounts payable under deposit administration contracts during the year were as shown below. The liabilities are shown inclusive of interest accumulated to 31 December. Interest was declared and credited to the customers accounts at a weighted average rate of 10 % for the year (2009: 4.5 %). 2010 2009 Shs ’000 Shs ’000At start of year 1,029,388 742,735Pension fund deposits received 388,540 330,921Surrenders and annuities paid (93,450) (78,734)Interest payable to policyholders 111,941 41,519Other movements 12,552 (7,053)Translation difference (943) -At end of year 1,448,028 1,029,388
Other movements relate to a release of excess liabilities recognised following reconciliation of the deposit administration policyholders accounts in year. Amounts payable under deposit administration contracts are classified as current liabilities.
33. Unit-linked investment contracts The benefits offered under these contracts are based on the return of a portfolio of equities and debt securities. The maturity value of the financial liabilities is determined by the fair value of the linked assets. There will be no difference between the carrying amount and the maturity amount at maturity date. 2010 2009 Shs ’000 Shs ’000At start of year 382,692 202,524Premium received 207,974 172,960Interest credited 77,486 35,461Liabilities released for payment (61,109) (18,305)Other movements 30,280 (9,948)At end of year 637,323 382,692
Unit linked investment contracts are classified as current liabilities.
34. Insurance contract liabilities 2010 2009Short term insurance contracts Shs ’000 Shs ’000claims reported and claims handling expenses 1,523,138 1,303,715claims incurred but not reported 222,950 226,830Total 1,746,088 1,530,545
U A P H O L D I N G S L I M I T E D 86ANNUAL REPORT & FINANCIAL STATEMENTS FOR THE YEAR ENDED 31 DECEMBER 2010
Notes to the Financial Statements (continued)

2010 TotalLong term contracts Shs’000 Kshs’000Claims reported and claims handling expenses 389,852 243,010Total gross insurance liabilities 2,135,940 1,773,555
Insurance contract liabilities are classified as current liabilities. Movements in insurance liabilities and reinsurance assets are shown in Note 29.
(i) Short term insurance contracts Gross claims reported, claims handling expenses liabilities and the liability for claims incurred but not reported are net of expected recoveries from salvage and subrogation. The expected recoveries at the end of 2010 and 2009 are not material.
The Group uses chain-ladder techniques to estimate the ultimate cost of claims and the IBNR provision. Chain ladder techniques are used as they are an appropriate technique for mature classes of business that have a relatively stable development pattern. This involves the analysis of historical claims development factors and the selection of estimated development factors based on this historical pattern. The selected development factors are then applied to cumulative claims data for each accident year that is not fully developed to produce an estimated ultimate claims cost for each accident year.
The development of insurance liabilities provides a measure of the Groups’ ability to estimate the ultimate value of claims. The table below illustrates how the Groups’ estimate of total claims outstanding for each accident year has changed at successive year ends. Year ended 31 December 2010Accident year 2006 2007 2008 2009 2010 TotalEstimate of ultimate claims costs Shs’000 Shs’000 Shs’000 Shs’000 Shs’000 Kshs’000At end of accident year 1,275,466 1,173,481 1,297,075 1,216,683 1,329,004 6,291,709One years later 1,324,672 1,180,070 1,437,744 1,624,885 - 5,567,371Two years later 1,345,652 1,246,642 1,455,670 - - 4,047,964Three years later 1,377,065 1,237,397 - - - 2,614,462Four years later 1,387,480 - - - - 1,387,480Current estimate of cumulative claims 1,387,480 1,237,397 1,455,670 1, 624,885 1,329,004 7,034,436Less: Cumulative payments to date (1,315,982) (1,175,627) (1,382,989) (1,228,718) (523,983) (5,620,299)Liability in the Balance sheet 71,498 61,770 72,681 396,167 791,431 1,407,137Liability in respect of prior years - - - - 116,001 116,001Incurred but not reported - - - - 222,950 222,950Total gross claims liability included in the balance sheet 71,498 61,770 72,681 396,167 1,130,382 1,746,088
34. Insurance contract liabilities (continued)
U A P H O L D I N G S L I M I T E D87ANNUAL REPORT & FINANCIAL
STATEMENTS FOR THE YEAR ENDED 31 DECEMBER 2010
Notes to the Financial Statements (continued)

(ii) Long term business contractsThe Group determines its liabilities on long term insurance contracts based on assumptions in relation to future deaths, voluntary terminations, investment returns and administration expenses. A margin for risk and uncertainty is added to these assumptions. The liabilities are determined on the advice of the consulting actuary and actuarial valuations are carried out on an annual basis.
Valuation assumptionsThe latest actuarial valuation of the Life Fund was carried out as at 31 December 2010 by QED Actuaries and Consultants, using the Net Premium Valuation method (and basis) prescribed by the Kenyan Insurance Act, 1988, as amended, and the Gross Premium Valuation (GPV) method for the universal and unit-linked policies for which it was not possible to use the NPV method. The GPV method is generally accepted in the actuarial industry as an appropriate method to place realistic value (with an appropriate allowance for margins) on the liabilities of a life Company. This method is based on a discounted cashflow approach taking into account the expected cashflows from the existing inforce business. By setting appropriate assumptions this method determines liabilities which are consistent with the value of assets included in the accounts.
The more significant valuation assumptions are summarised below. The assumptions used for the previous year-end valuation are shown in brackets:
a) Mortality – The Company used SA56-62 (2009: SA56-62) as a base table of standard mortality. Statistical methods are used to adjust the rates reflected in the table based on the Company’s experience. An allowance for AIDS is made based on the Actuarial Society of South Africa’s 2003 AIDS tables. For contracts insuring survivorship the a(55) (2009: a(55)) life table was used as a base; no allowance is made for future mortality improvements.
b) Persistency – The Company does not have sufficient historical data to allow statistical methods to be used to determine an appropriate persistency rate. The persistency rates used in the valuation were set according to the experience observed (by the actuary) in similar environments.
c) Investment returns are derived with reference to the return on long term fixed interest investments available in Kenya and adjusted to reflect the actual underlying mix of assets. For the current valuation, the rate of return was 9% p.a. (2009: 12% p.a.) for the GPV basis and 6%p.a (2009: 6% p.a) for the NPV basis.
d) Expenses, tax and inflation – The current level of renewal expenses were taken to be an appropriate expense base. Expenses pertaining to business establishment and expansion were excluded from the valuation assumption. Expense inflation is assumed to be 9% p.a. (2009:9% p.a.). It has been assumed that the current tax legislation and rates continue unaltered. Under the NPV method it is not possible to model expenses, tax and inflation explicitly.
Sensitivity analysisThe following table presents the sensitivity of the value of long term insurance liabilities to movements in key assumptions used in the estimation of liabilities. For liabilities under insurance contracts with fixed and guaranteed terms, key assumptions are unchanged for the duration of the contract. For long term insurance contracts without fixed terms and with discretionary participation in profits, the liability is set approximately equal to the value of the underlying asset of the contract. Hence, there is no sensitivity analysis for these types of contracts.
U A P H O L D I N G S L I M I T E D 88ANNUAL REPORT & FINANCIAL STATEMENTS FOR THE YEAR ENDED 31 DECEMBER 2010
Notes to the Financial Statements (continued)
34. Insurance contract liabilities (continued)

Long-term contracts without fixed terms and with DPF – variable: Change Increase / Increase / (decrease) in (decrease) in In variable liability - 2010 liability - 2009Contracts with Fixed and Guaranteed Terms – Variable: Shs ’000 Shs ’000Worsening of mortality +10% 11,129 1,383Lowering of investment returns p.a. -1% 15,391 (1,380)Worsening of expense inflation rate +1% 2,118 1,379Worsening of lapse rate +10% (640) 1,378
35. Movements in insurance liabilities and reinsurance assets a) Short term insurance business 2010 2009 Gross Reinsurance Net Gross Reinsurance Net Shs ’000 Shs ’000 Shs ’000 Shs ’000 Shs ’000 Shs ’000Notified claims 1,303,715 (271,931) 1,031,784 1,055,642 (333,539) 722,103Incurred but not reported 226,830 (43,998) 182,832 190,482 (58,885) 131,597Total at beginning of year 1,530,545 (315,929) 1,214,616 1,246,124 (392,424) 853,700Cash paid for claims settled in year (2,047,352) 166,135 (1,881,217) (1,592,592) 220,002 (1,372,590)Increase in liabilities - arising from current year claims 1,140,622 (379,605) 761,017 694,655 (77,940) 616,715- arising from prior year claims 1,122,273 (177,951) 944,322 1,104,176 (215,839) 888,337Total at end of year 1,746,088 (707,350) 1,038,738 1,452,363 (466,201) 1,088,167 Notified claims 1,465,256 (631,374) 833,882 1,303,715 (271,931) 1,031,784Incurred but not reported 280,832 (75,976) 204,856 226,830 (43,998) 182,832Total at end of year 1,746,088 (707,350) 1,038,738 1,530,545 (315,929) 1,214,616
b) long term insurance business
At January 243,010 (37,954) 205,056 247,578 (112,871) 134,707Premium received/valuation premium 319,226 (44,114) 275,112 259,983 (91,930) 168,053Liabilities released for payments (109,431) 7,705 (101,726) (148,917) 50,419 (98,498)Other movements (62,952) - (62,952) (115,634) 116,428 794Total at end of year 389,852 (74,364) 315,489 243,010 (37,954) 205,056Total at end of year 2,135,940 (619,037) 1,516,903 1,773,555 (353,883) 1,419,672
U A P H O L D I N G S L I M I T E D89ANNUAL REPORT & FINANCIAL
STATEMENTS FOR THE YEAR ENDED 31 DECEMBER 2010
Notes to the Financial Statements (continued)
34. Insurance contract liabilities (continued)
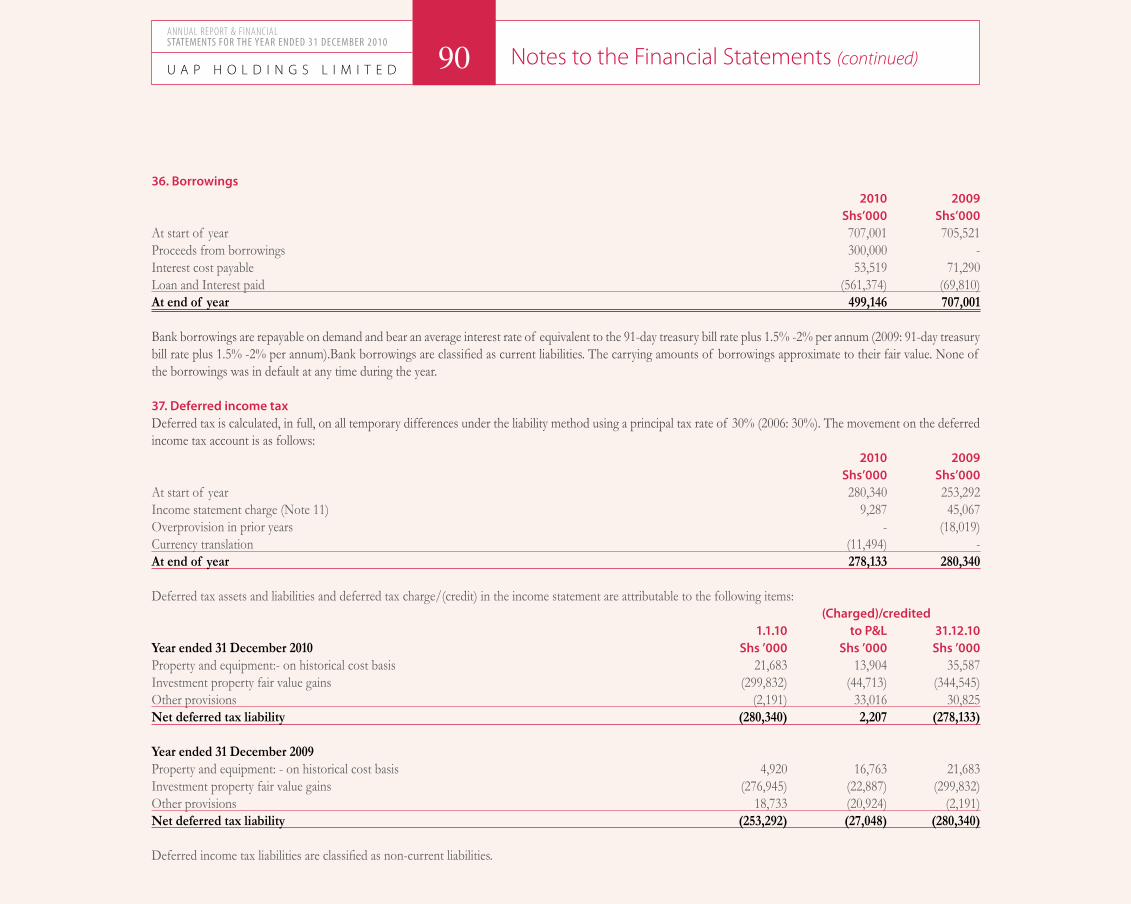
36. Borrowings 2010 2009 Shs’000 Shs’000At start of year 707,001 705,521Proceeds from borrowings 300,000 -Interest cost payable 53,519 71,290Loan and Interest paid (561,374) (69,810)At end of year 499,146 707,001
Bank borrowings are repayable on demand and bear an average interest rate of equivalent to the 91-day treasury bill rate plus 1.5% -2% per annum (2009: 91-day treasury bill rate plus 1.5% -2% per annum).Bank borrowings are classified as current liabilities. The carrying amounts of borrowings approximate to their fair value. None of the borrowings was in default at any time during the year.
37. Deferred income taxDeferred tax is calculated, in full, on all temporary differences under the liability method using a principal tax rate of 30% (2006: 30%). The movement on the deferred income tax account is as follows: 2010 2009 Shs’000 Shs’000At start of year 280,340 253,292Income statement charge (Note 11) 9,287 45,067Overprovision in prior years - (18,019)Currency translation (11,494) -At end of year 278,133 280,340
Deferred tax assets and liabilities and deferred tax charge/(credit) in the income statement are attributable to the following items: (Charged)/credited 1.1.10 to P&L 31.12.10Year ended 31 December 2010 Shs ’000 Shs ’000 Shs ’000Property and equipment:- on historical cost basis 21,683 13,904 35,587Investment property fair value gains (299,832) (44,713) (344,545)Other provisions (2,191) 33,016 30,825Net deferred tax liability (280,340) 2,207 (278,133)
Year ended 31 December 2009Property and equipment: - on historical cost basis 4,920 16,763 21,683Investment property fair value gains (276,945) (22,887) (299,832)Other provisions 18,733 (20,924) (2,191)Net deferred tax liability (253,292) (27,048) (280,340)
Deferred income tax liabilities are classified as non-current liabilities.
U A P H O L D I N G S L I M I T E D 90ANNUAL REPORT & FINANCIAL STATEMENTS FOR THE YEAR ENDED 31 DECEMBER 2010
Notes to the Financial Statements (continued)
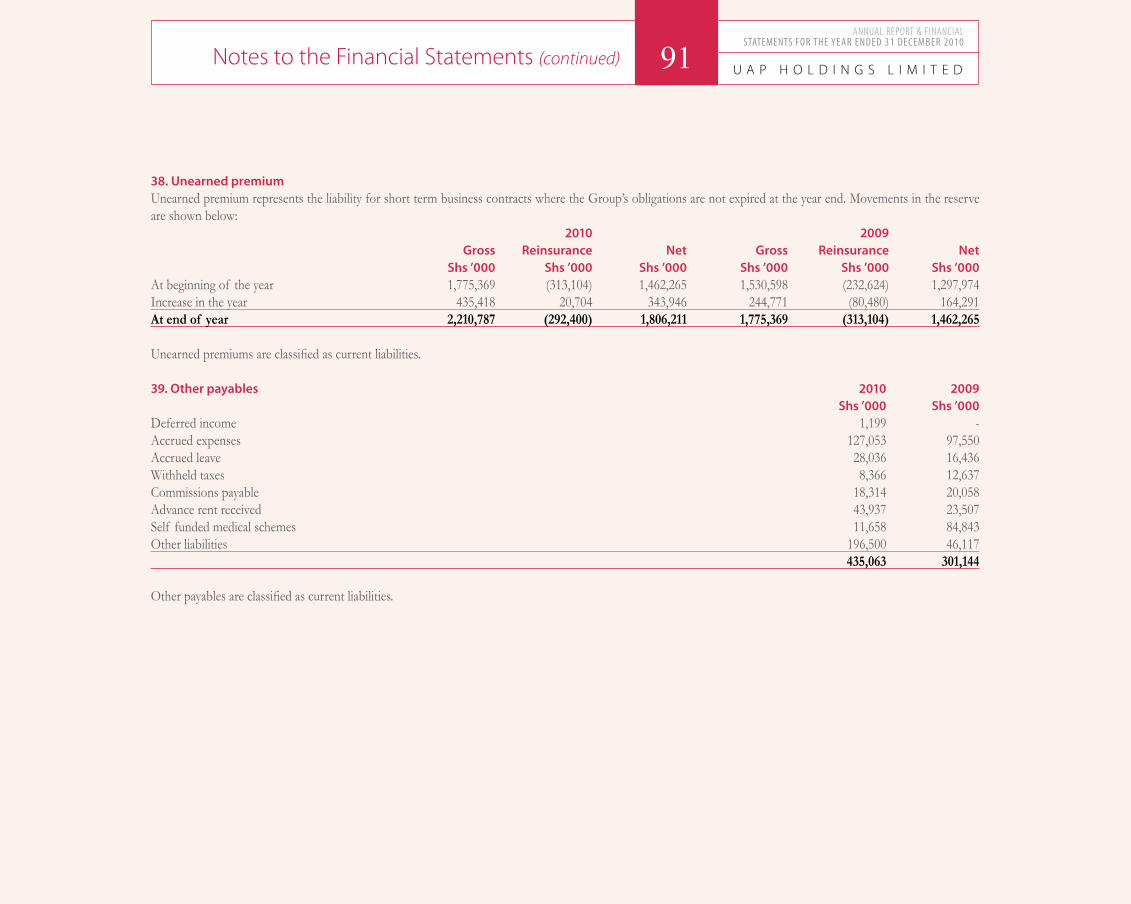
38. Unearned premium Unearned premium represents the liability for short term business contracts where the Group’s obligations are not expired at the year end. Movements in the reserve are shown below: 2010 2009 Gross Reinsurance Net Gross Reinsurance Net Shs ’000 Shs ’000 Shs ’000 Shs ’000 Shs ’000 Shs ’000At beginning of the year 1,775,369 (313,104) 1,462,265 1,530,598 (232,624) 1,297,974Increase in the year 435,418 20,704 343,946 244,771 (80,480) 164,291At end of year 2,210,787 (292,400) 1,806,211 1,775,369 (313,104) 1,462,265
Unearned premiums are classified as current liabilities.
39. Other payables 2010 2009 Shs ’000 Shs ’000Deferred income 1,199 -Accrued expenses 127,053 97,550Accrued leave 28,036 16,436Withheld taxes 8,366 12,637Commissions payable 18,314 20,058Advance rent received 43,937 23,507Self funded medical schemes 11,658 84,843Other liabilities 196,500 46,117 435,063 301,144
Other payables are classified as current liabilities.
U A P H O L D I N G S L I M I T E D91ANNUAL REPORT & FINANCIAL
STATEMENTS FOR THE YEAR ENDED 31 DECEMBER 2010
Notes to the Financial Statements (continued)

40. Cash generated from operationsReconciliation of profit before tax to cash generated from operations 2010 2009 Shs ’000 Shs ’000Profit before tax 789,854 280,489 Adjustments for: Investment income (Note 6) (1,117,939) (508,014)Depreciation (Note 19) 61,832 52,688Amortisation (Note 20) 35,622 5,960Finance costs (Note 36) 53,519 71,290Gain on disposal of property and equipment 400 120Changes in: Insurance contract liabilities (net) (65,445) 431,265Deposit administration contracts 418,640 286,653Unit-linked contracts 256,631 180,168Unearned premium (net) 456,122 164,291Trade and other payables 373,016 (190,948)Trade and other receivables (120,447) 114,086Deferred acquisition costs (72,213) (39,521)Retirement benefit asset (21,229) (48,621)Cash generated from operations 1,047,563 799,666
41. Contingent liabilities In common with the insurance industry in general, the Group’s insurance subsidiaries are subject to litigation arising in the normal course of insurance business. The directors are of the opinion that this litigation will not have a material effect on the financial position or profits of the Group.
42. CommitmentsCapital commitmentsCapital expenditure contracted for at the financial reporting date but not recognised in the financial statements is as follows: 2010 2009 Shs ’000 Shs ’000Investment property 12,273 379,100
Capital expenditure committed but not contracted for at financial reporting date is as follows: 2010 2009 Shs ’000 Shs ’000Capital expenditure 3,500,000 -
The capital expenditure committed but not contracted relates to two major contracts for the construction of investment properties in Kenya and Uganda. These projects are estimated to cost approximately Shs 3.5 billion. They are estimated to take 24 months to complete.
U A P H O L D I N G S L I M I T E D 92ANNUAL REPORT & FINANCIAL STATEMENTS FOR THE YEAR ENDED 31 DECEMBER 2010
Notes to the Financial Statements (continued)

43. Related party transactions
The following transactions were carried out with related parties: 2010 2009i) Administration of staff pension scheme- Group Shs ’000 Shs ’000Contributions paid 21,350 22,024Benefits paid (17,352) (18,112)
ii) Transactions with related parties - GroupTransfer of intangible assets 98,463 -Transfer of property and equipments 23,200 -Transfer of investment in subsidiaries - 370,000
iii) Outstanding balances with related parties - GroupMortgage loans receivable (note 25) 64,103 54,214
Mortgages to staff are fully secured on the mortgage properties and are charged interest at 6% (2009: 6%).
iv) Outstanding balances with related parties - GroupAmount payable to UAP Insurance Company Limited 304,854 473,599Amount payable to UAP Life Assurance Limited 52,202 -At December 357,056 473,599
The amounts payable to UAP Insurance Company Limited have no specific repayment date. No interest is chargeable on the balances.
v) Loans to directors At January 21,851 11,420Loans advanced during the year 7,629 5,038Loans repayments received (5,509) (3,117)At December 23,971 13,341
Loans to directors are fully secured and are charged interest at 6% (2009: 6%).
vi) Directors emolumentsExecutive salaries (included in key management compensation below) 80,008 83,638Fees 32,201 18,608Other remuneration 4,327 1,034 116,536 103,280
vii) Key management compensationSalaries (including executive directors salaries) 172,862 194,513Retirement benefit costs 11,940 12,908 184,802 207,421
U A P H O L D I N G S L I M I T E D93ANNUAL REPORT & FINANCIAL
STATEMENTS FOR THE YEAR ENDED 31 DECEMBER 2010
Notes to the Financial Statements (continued)

U A P H O L D I N G S L I M I T E D 94ANNUAL REPORT & FINANCIAL STATEMENTS FOR THE YEAR ENDED 31 DECEMBER 2010
Notes