ubc faculty pension plan pension forum · mike leslie, executive director, investments may 25, 2016...
TRANSCRIPT

UBC FACULTY PENSION PLAN
PENSION FORUM M R . J OOS T B L OM , C HA I R , B OA R D OF T R US T E E S
M S . OR L A C OUS I NE A U, E X E C UT I V E D I R E C T OR , P E NS I ONS
M R . M I KE L E S L I E , E X E C UT I V E D I R E C T OR , I NV E S T M E NT S
M A Y 2 5 , 2 0 1 6

2
• Introduction Of Trustees
• Plan’s Financial And Membership Update
• 2016 Board Initiatives And Projects
• 2015 Operations Update & 2016
Operations Objectives
• Investment Review For 2015 And First
Quarter 2016
• Questions 2
Agenda

3
3
Mr. Joost Blom, Chair
Professor, Faculty of Law
Dr. Ken Carty
Professor Emeritus, Department
of Political Science
Dr. Robert Heinkel, Vice-
Chair
Professor, Sauder School of
Business
Dr. Joanne Emerman
Professor Emerita, Department of
Cellular and Physiological
Sciences
Dr. Joy Begley
Associate Professor, Sauder
School of Business
Dr. Lorenzo Garlappi
Associate Professor, Sauder
School of Business
Dr. Joyce Boon
Associate Professor Emerita,
Barber Arts & Sciences, UBCO
Mr. Vijay Verma
Researcher Emeritus, TRIUMF
Board of Trustees

4
Plan Statistics December 31,2015
4
Active Deferred Retired Total
Members 3,427 1,480 961 5,868
59% 25% 16% 100%
Assets
(millions)
$1,150 $255 $595 $2,000
58% 13% 29% 100%
5 5
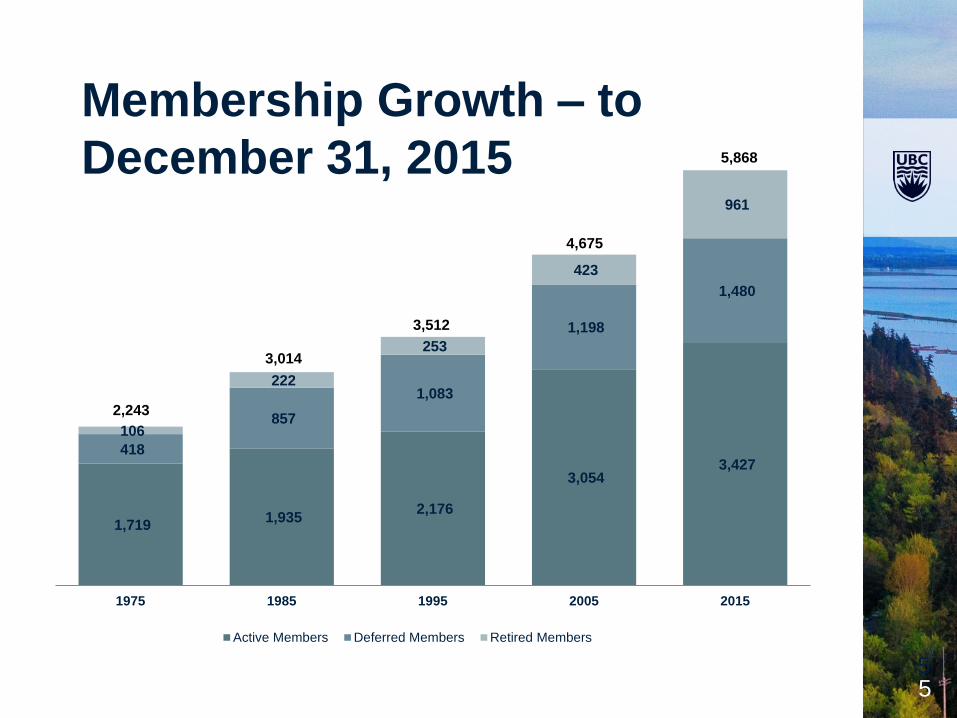
1,719 1,935
2,176
3,054 3,427
418
857
1,083
1,198
1,480
106
222
253
423
961
1975 1985 1995 2005 2015
Active Members Deferred Members Retired Members
5,868
4,675
3,512
3,014
2,243
Membership Growth – to
December 31, 2015

6
Composition of Funds – March 31, 2016
6
Total Plan Assets $2.0 Billion

7 7
2016 Board Initiatives and Projects
• Governance Review
• Investment Structure Review – Foreign Equity
Managers
• Variable Payout Life Annuity Review
• Continuing oversight of the Plan’s investment
manager’s reporting on how they
consider/implement environmental, social and
governance factors (ESG) in their investment
process

8 8
2015 Operations Update
• Successful transition to Sun Life as
recordkeeper and custodian
• Smooth transition to new senior leadership
team for the UBC Pension Administration
Office
• Changes to the Plan documents and forms to
comply with the new BC pension legislation

9
2016 Operations Objectives
• Redesign FPP website
• Member education and communication – Role of Board, UBC Pension Administration
office and Sun Life
– Increase awareness and usage of tools
available through Sun Life
• Change to bi-weekly remittance of
contributions effective January 1, 2017
10
10
Investment Review of 2015

11
11
Agenda
• Plan – Fund Weightings & Asset Mix
• Fund Returns
• Investment Market Update
• Question Period

12
Investment Changes in 2015
1. Moved investment funds to Sun Life recordkeeping
platform
• No changes to investment funds
• No changes to investment managers
2. Hedge Fund: Removed
• Terminated in January 2015 due to continued weakness
• Funds reallocated to two Global Equity managers
• Affected Balanced and Foreign Equity Funds
3. Short Term Investment Fund (“STIF”)
• Changed managers to MFS/Sun Life from bcIMC
12
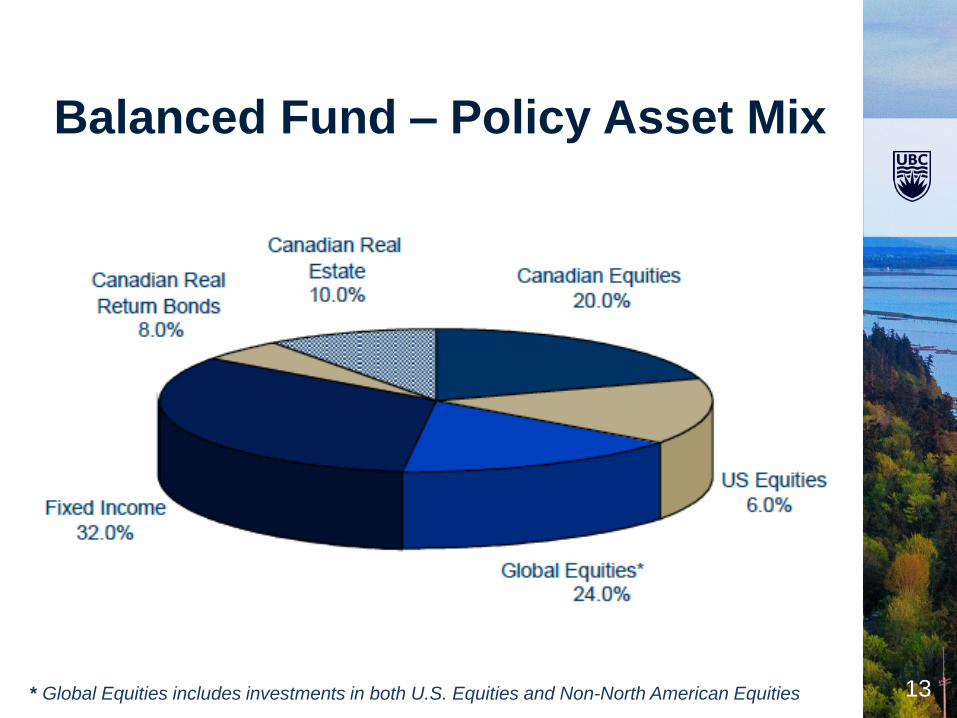
13 * Global Equities includes investments in both U.S. Equities and Non-North American Equities
Balanced Fund – Policy Asset Mix
13

14
2015 Fund Returns / Peer Rankings
Fund Returns (%)
Return Ranking (percentile)*
Risk** Ranking
(percentile)*
1 Yr 5 Yr 10 Yr 1 Year 5 Years 4 Years
Balanced 6.6 9.0 6.9 10th 8th 84th
Bond 3.5 4.8 5.3 33rd 73rd 4th
Canadian
Equity -6.8 5.0 6.1 63rd 43rd 62nd
Foreign Equity 19.
6
16.7 7.3 35th 11th 43rd
Short Term Invt. 1.0 1.2 1.9 20th 17th 4th
Gross returns to Dec. 31/15
* 1st percentile – highest ranking best performance, 100th percentile – lowest ranking
** Risk - as measured by annual standard deviation of returns
- a lower ranking number (say 80th percentile) means less risky
14

15
Review of 2015
Q1 Q2 Q3 Q4 1 Year
Canadian Equities 2.6% -1.6% -7.9% -1.4% -8.3%
U.S. Equities (C$) 10.4% -1.4% 0.5% 10.6% 21.0%
International Equities
(C$) 14.7% -1.0% -3.6% 8.2% 18.3%
Bonds 4.2% -1.7% 0.2% 1.0% 3.5%

16
• Further Collapse in Energy Prices
• WTI – December 31, 2014 $53.27
• WTI – December 31, 2015 $36.60
• Slowdown in Emerging Markets
• China, Brazil, Russia
• Decline in Commodity Prices
• Central banks influence
Key Themes in 2015

17
50
60
70
80
90
100
110
120
130
De
c 2
01
4
Ja
n 2
01
5
Feb
201
5
Ma
r 2
01
5
Ap
r 2
01
5
Ma
y 2
01
5
Ju
n 2
01
5
Ju
l 2
01
5
Au
g 2
01
5
Se
p 2
01
5
Oct 2
01
5
No
v 2
01
5
De
c 2
01
5
WTI Oil Natural Gas Copper Gold Silver
Commodities down
24% on average in 2015
Commodities Prices Have Fallen
Across the Board
18
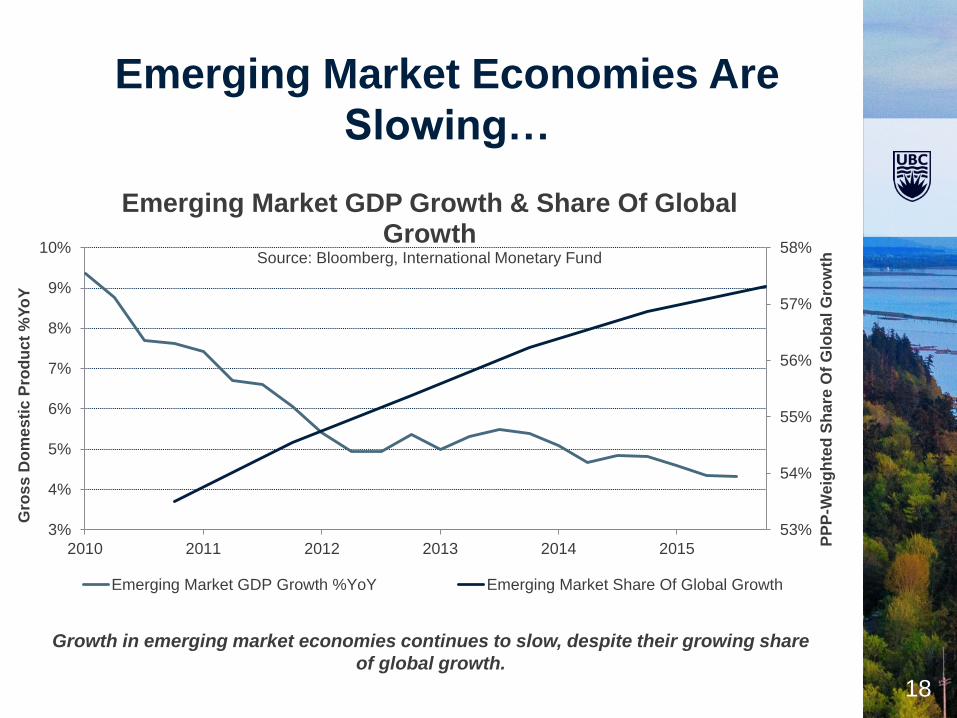
Growth in emerging market economies continues to slow, despite their growing share
of global growth.
Emerging Market Economies Are
Slowing…
53%
54%
55%
56%
57%
58%
3%
4%
5%
6%
7%
8%
9%
10%
2010 2011 2012 2013 2014 2015 PP
P-W
eig
hte
d S
hare
Of
Glo
ba
l G
row
th
Gro
ss
Do
mes
tic P
rod
uct
%Y
oY
Emerging Market GDP Growth & Share Of Global Growth
Source: Bloomberg, International Monetary Fund
Emerging Market GDP Growth %YoY Emerging Market Share Of Global Growth

19
S&P®/TSX® Capped Composite
Index Sector returns vs. sector weights
S&P/TSX Capped
Composite
Index returned
-8.32%
Sector weights
-40%
-20%
0%
20%
InformationTechnology
ConsumerStaples
TelecommServices
ConsumerDiscretionary
Financials Utilities Industrials Health Care Materials Energy
Outperform Underperform
0%
10%
20%
30%
40%
InformationTechnology
ConsumerStaples
TelecommServices
ConsumerDiscretionary
Financials Utilities Industrials Health Care Materials Energy
1 year ending 31 December 2015
Past performance is not necessarily indicative of future performance
Sources: FactSet Research Systems Inc., BlackRock

20
0.7
0.72
0.74
0.76
0.78
0.8
0.82
0.84
0.86
0.88
Dec-1
4
Jan-15
Feb-15
Mar-1
5
Apr-1
5
May-1
5
Jun-15
Jul-1
5
Aug-1
5
Sep-15
Oct-15
Nov-1
5
Dec-1
5The Canadian Dollar
Currency Added Over 19% to the Canadian Dollar S&P 500 Return in 2015.

21
2015 Global Market Performance
Stock Market (YTD) Local
Currency
Canadian
Dollars
Japan 9.9% 30.7%
Europe (Ex. U.K.) 8.3% 18.5%
United States 0.7% 20.1%
United Kingdom -2.2% 10.3%
Canada -9.0% -9.0%
Pacific (Ex. Japan) -1.0% 9.2%
MSCI World 2.1% 18.3%
Emerging Markets -5.8% 1.5%
* Source: MSCI Developed & Emerging Market Indices

22
It Was A Challenging Year For Canadian
Equities
-70.0%
-50.0%
-30.0%
-10.0%
10.0%
30.0%
50.0%
De
nm
ark
Ire
land
Be
lgiu
m
Au
str
ia
Ita
ly
Fin
land
Ne
the
rla
nd
s
Po
rtu
ga
l
Fra
nce
Ja
pa
n
Germ
any
Ne
w Z
ea
land
Sw
ede
n
Un
ite
d S
tate
s
Sw
itze
rlan
d
No
rway
Au
str
alia
Ho
ng
Ko
ng
United K
ingdom
Sp
ain
Canada
Sin
ga
po
re
Gre
ece
MSCI Country Performance (in LocalCurrency)
Canada was among the worst performing countries in the developed world.

23
Interest Rates Moved
Down Last Year
Canada Bond Yields 2012 2013 2014 2015
Overnight Lending Rate 1.00% 1.00% 1.00% 0.50%
5 Year 1.38% 1.94% 1.41% 0.73%
10 Year 1.80% 2.75% 1.87% 1.39%
30 Year 2.36% 3.23% 2.35% 2.15%

24
1 year ending 31 December 2015
Past performance is not necessarily indicative of future performance
Sources: BlackRock; FTSE TMX Global Debt Capital Markets Inc.
Sector & term returns
Canadian bond market
Sector returns vs. sector weights
FTSE TMX Canada
Universe Bond
Index returned
3.52%
Sector & term weights
0%
1%
2%
3%
4%
5%
6%
Provincials Municipals Federal Corporates Short Mid Long
0%
10%
20%
30%
40%
50%
Provincials Municipals Federal Corporates Short Mid Long
Sector Term

25
2.1%
2.8%
-0.5%
0.0%
0.5%
1.0%
1.5%
2.0%
2.5%
3.0%
3.5%
4.0%
0 5 10 15 20 25 30
Tenor
Spot 1Yr
2Yr 3Yr
4Yr 5Yr
Low yields could be persistent Market pricing less than 1% move over the next 5 years
The markets are saying "lower for longer"
Source: Bloomberg as of 30 September 2015.

26
Long Term Market Returns Investment Results
Growth of $100 from December 1949 to December 2015
U.S. Stocks in $C: $135,661 (11.6%)
Canadian Stocks: $43,194 (9.6%)
Bonds (Long): $11,759 (7.5%)
T-Bills: $3,180 (5.4%)
Inflation: $1,038 (3.6%)
$100
$1,000
$10,000
$100,000
1949 1955 1961 1967 1973 1979 1985 1991 1997 2003 2009 2015

27
Benefits of a Diversified Portfolio
Last 5
Years 2010 2000 1990 1980
TSX Composite 2.3% 4.2% 10.6% 3.7% 9.1%
S&P 500 (C$) 20.3% -4.5% 17.9% 9.0% 5.6%
MSCI EAFE (C$) 10.7% -3.0% 9.4% 13.9% 11.1%
10 Year Annualized Returns As of December 31
Best Performer

28
Summary of 2015
28
• Good results for 2015. Balanced Fund up 6.6%
over 1 year and 6.9% over 10 years.
• Foreign equities had strongest returns, depreciating
dollar helped
• Low oil prices and commodity prices hurt Canadian
returns
• Bond returns were low, reflecting low interest rates
• Central Bank policies continue to have a big impact
on markets throughout the world

29 29
Results to March 31, 2016
30
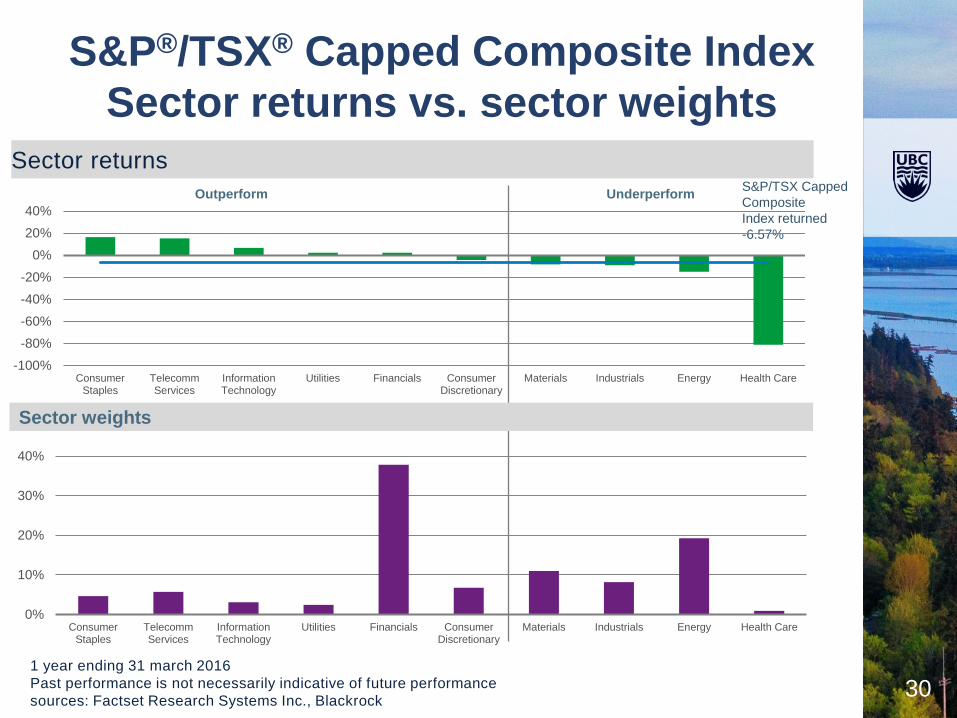
Sector returns
1 year ending 31 march 2016
Past performance is not necessarily indicative of future performance
sources: Factset Research Systems Inc., Blackrock
S&P®/TSX® Capped Composite Index
Sector returns vs. sector weights
S&P/TSX Capped
Composite
Index returned
-6.57%
Sector weights
-100%
-80%
-60%
-40%
-20%
0%
20%
40%
ConsumerStaples
TelecommServices
InformationTechnology
Utilities Financials ConsumerDiscretionary
Materials Industrials Energy Health Care
Outperform Underperform
0%
10%
20%
30%
40%
ConsumerStaples
TelecommServices
InformationTechnology
Utilities Financials ConsumerDiscretionary
Materials Industrials Energy Health Care
31
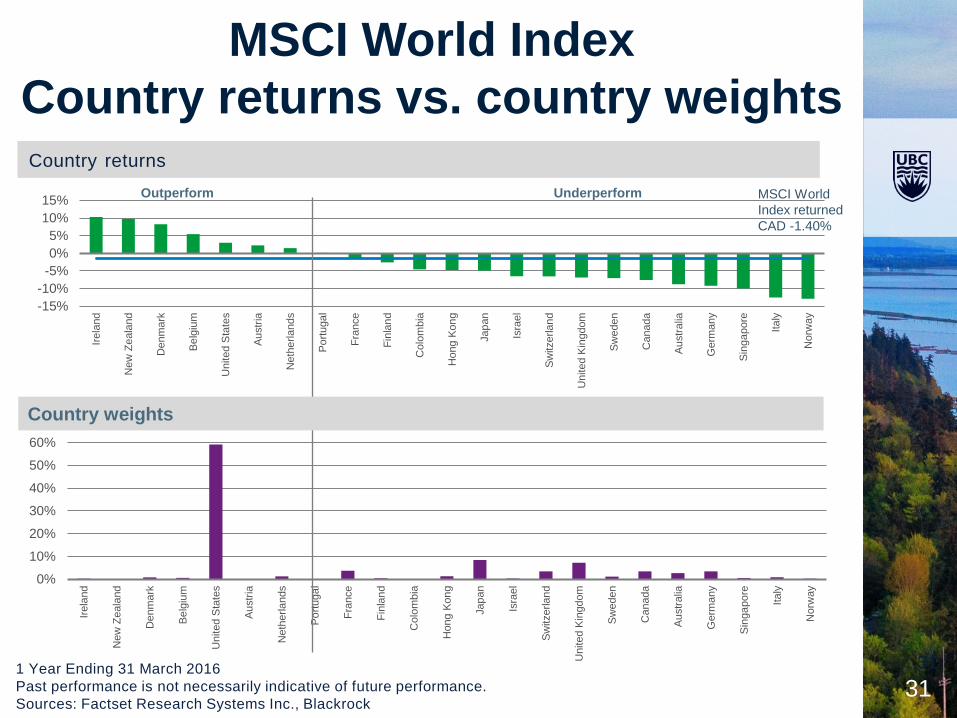
Country returns
1 Year Ending 31 March 2016
Past performance is not necessarily indicative of future performance.
Sources: Factset Research Systems Inc., Blackrock
MSCI World Index
Country returns vs. country weights
31
MSCI World
Index returned
CAD -1.40%
0%
10%
20%
30%
40%
50%
60%
Irela
nd
New
Ze
ala
nd
Denm
ark
Be
lgiu
m
United S
tate
s
Au
str
ia
Neth
erla
nds
Po
rtuga
l
Fra
nce
Fin
lan
d
Colo
mb
ia
Hong K
on
g
Jap
an
Isra
el
Sw
itzerlan
d
United K
ingdom
Sw
eden
Canada
Au
str
alia
Germ
any
Sin
ga
pore
Italy
Norw
ay
Outperform Underperform
-15%
-10%
-5%
0%
5%
10%
15%
Irela
nd
New
Ze
ala
nd
Denm
ark
Be
lgiu
m
United S
tate
s
Au
str
ia
Neth
erla
nds
Po
rtuga
l
Fra
nce
Fin
lan
d
Colo
mb
ia
Hong K
on
g
Jap
an
Isra
el
Sw
itzerlan
d
United K
ingdom
Sw
eden
Canada
Au
str
alia
Germ
any
Sin
ga
pore
Italy
Norw
ay
Country weights

32
32
Fund Rates of Return*
(to March 31, 2016)
* Before investment manager fees
Fund Q1/2016 1 Yr. 5 Yrs. 10 Yrs.
Balanced Fund -0.66% -0.2% 8.33% 6.37%
Bond Fund 1.59% 0.43% 5.10% 5.49%
Canadian Equity Fund 4.23% -5.3% 4.72% 5.71%
Foreign Equity Fund -6.25% 0.06% 14.71% 5.94%
Short Term Investment Fund 0.17% 0.76% 1.19% 1.80%

33
Change in Equity Leadership
Source: Thomson Reuters Datastream
-20%
-15%
-10%
-5%
0%
5%
10%
Energy Materials Canada EM
Select Global Relative Equity Index Returns
Jan 1, 2015 to Feb 11, 2016
Feb 11, 2016 to Mar 31, 2016
34
• Returns have been more muted recently
and volatility remains quite high
• Our large plan size ($2 billion) allows for
lower fees and broader diversification by
asset classes and managers
• The move to Sun Life did not have an
impact on the investment options
currently provided
Conclusions
34

35
35
Thank You!
Questions?

36 36 36
Administrative Staff
Orla Cousineau Executive Director, Pensions
Mike Leslie Executive Director – Investments
Debbie Wilson Associate Director
GV Fragante Systems Analyst
Helena Huynh Systems Analyst
Diana Iampietro Faculty Pension Plan Manager
Lorraine Heseltine Member Services Specialist
Lily Lee Member Services Associate
Louise Mah Pension Clerk
Maricres De Leon Pension Plan Accountant
Kathy Pang Communications Manager
Chelsey Maher Communications Assistant
Shirley Lim Project Coordinator
Claudia Chan Office Administrator

37
37
Plan Considerations
• Lower risk through broad diversification
- 12 Managers, 13 Mandates
• Provide flexibility regarding contribution,
investment, retirement and withdrawal options
• Low cost
• High level of member service
• One part of member’s overall retirement plan