uc act universities economic contribution final
DESCRIPTION
economicsTRANSCRIPT

Higher learning: Economic and social impact of the major universities in the ACT Australian National University and University of Canberra
July 2014

Deloitte Access Economics
Contents Glossary .................................................................................................................................... v
Key points .................................................................................................................................. i
Executive Summary .................................................................................................................. iii
1 Introduction .................................................................................................................... 1
1.1 Background ...................................................................................................................... 1
1.2 Scope and methodological approach ................................................................................. 2
1.2.2 The universities ................................................................................................ 2
1.2.3 Approach .......................................................................................................... 2
1.2.4 Modelling techniques used ............................................................................... 4
1.3 The structure of the report ............................................................................................... 5
2 Regional profile of the ACT .............................................................................................. 6
2.1 Population ........................................................................................................................ 6
2.1.1 Locational benefits ........................................................................................... 7
2.2 Industry ............................................................................................................................ 9
2.2.1 Output by industry ........................................................................................... 9
2.2.2 Employment by industry ................................................................................... 9
2.2.3 Universities as employers ............................................................................... 10
2.2.4 Labour force contribution ............................................................................... 11
2.3 Labour market outcomes ................................................................................................ 12
2.3.1 Graduate destinations .................................................................................... 12
2.3.2 Graduate income ............................................................................................ 13
2.4 Other socio-economic indicators ..................................................................................... 14
3 Economic contribution of ACT universities..................................................................... 16
3.1 Expenditure .................................................................................................................... 17
3.2 Economic contribution of university operations .............................................................. 17
3.2.1 Direct economic contribution of the universities ............................................. 18
3.2.2 Indirect economic contribution of the universities .......................................... 19
3.3 Economic contribution of students at ACT universities .................................................... 20
3.3.1 All students .................................................................................................... 21
3.3.2 Students from outside the ACT ....................................................................... 23
3.4 Visitor expenditure ......................................................................................................... 24
3.5 Total economic contribution of major ACT universities and students ............................... 24
3.5.1 Total contribution ........................................................................................... 25
3.5.2 Additional contribution ................................................................................... 26
3.6 Comparison with other industries in the ACT................................................................... 27

Socioeconomic contribution of major ACT universities
4 Economic impact of expanding university capacity in the ACT ....................................... 29
4.1 Potential expansion of ACT universities ........................................................................... 29
4.1.1 At University of Canberra ................................................................................ 29
4.1.2 At Australian National University .................................................................... 29
4.2 University expansion scenarios ....................................................................................... 30
4.2.1 Scenario 1 - an increase in international students ........................................... 30
4.2.2 Scenario 2 – Expanding university infrastructure ............................................. 33
5 Other economic and social dimensions of the universities’ contribution ........................ 35
5.1 Alignment with Government strategy ............................................................................. 35
5.2 Research and knowledge ................................................................................................ 38
5.2.1 Research output ............................................................................................. 39
5.2.2 Research at ANU ............................................................................................. 40
5.2.3 Research at UC ............................................................................................... 40
5.3 Social and business contribution ..................................................................................... 42
5.3.1 Generating interest in higher education .......................................................... 42
5.3.2 Business linkages ............................................................................................ 42
5.3.3 Responding to structural change ..................................................................... 44
5.4 Other links with the community ...................................................................................... 45
5.4.1 University facilities ......................................................................................... 45
5.4.2 International linkages ..................................................................................... 47
6 Conclusion .................................................................................................................... 50
Appendix A : Higher education in the ACT ............................................................................... 52
Appendix B : Impact of higher education ................................................................................. 58
Research ................................................................................................................................. 58
Income .................................................................................................................................... 59
Productivity ............................................................................................................................ 60
Participation ........................................................................................................................... 60
6.1.1 Graduate unemployment................................................................................ 61
Appendix C : Student expenditure ........................................................................................... 62
Appendix D : Economic contribution studies ........................................................................... 64
Appendix E : CGE modelling .................................................................................................... 68
Appendix F : References .......................................................................................................... 73
Limitation of our work ............................................................................................................... 75

Socioeconomic contribution of major ACT universities
Charts Chart 2.1 : Population by age (2012 – 2050) .............................................................................. 6
Chart 2.2 : Share of total FTE employees, by Industry (2011) ................................................... 10
Chart 2.3 : Education and labour market outcomes ................................................................. 14
Chart 3.1 : Indirect contribution of ACT universities, by industry (2012) .................................. 20
Chart 4.1 : International student numbers, scenario analysis ................................................... 31
Chart 4.2 : Impact on employment and wages of additional international students ................. 33
Chart 5.1 : Projected output shares for the Australian economy, by industry ........................... 44
Chart B.1 : Participation rate ................................................................................................... 61
Tables Table 2.1 : Higher education attendance, % of Population* ....................................................... 7
Table 2.2 : ACT GTP by industry (2013) ...................................................................................... 9
Table 2.3 : Major ACT universities’ employees (FTE staff), 2013 ............................................... 10
Table 2.4 : Student contribution to employment, 2012 (FTE) ................................................... 11
Table 2.5 : University of Canberra graduate destinations (2013) .............................................. 12
Table 2.6 : ANU graduate destinations .................................................................................... 13
Table 2.7 : SEIFA Index scores (2011) ....................................................................................... 15
Table 3.1 : Direct economic contributions of ANU and UC (2012) ............................................ 18
Table 3.2 : Direct economic contribution of ACT universities (2012) ........................................ 19
Table 3.3 : Indirect contribution of ACT universities (2012) ...................................................... 19
Table 3.4 : Total student expenditure (2012) ........................................................................... 21
Table 3.5 : Student expenditure in the ACT (2012) ................................................................... 22
Table 3.6 : Direct contribution of student expenditure (2012) ................................................. 22
Table 3.7 : Indirect contribution of student expenditure (2012) ............................................... 23
Table 3.8 : Contribution of students from outside the ACT (2012). .......................................... 24
Table 3.9 : Total economic contribution of ACT universities to the ACT (2012)......................... 25
Table 3.10 : Total economic contribution of ACT universities to Australia (2012) ..................... 26
Table 3.11 : Additional economic contribution of ACT universities to the ACT (2012)............... 26
Table 3.12 : Industry value added in the ACT (2012-13) ........................................................... 27
Table 4.1 : Economic impact of increased ANU international students..................................... 32
Table 4.2 : Capital expenditure and operational output, $million (2012 – 2024) ...................... 34

Socioeconomic contribution of major ACT universities
Table 4.3 : Economic impact of capital expenditure scenario ................................................... 34
Table 5.1 : Research output (2012) .......................................................................................... 39
Table 5.2 : FTE industries for ANU graduates (2012) ................................................................ 45
Table 5.3 : International students comparison (2012) .............................................................. 48
Table A.1 : Key student population statistics (2012) ................................................................ 52
Table A.2 : Students by country of birth (2013)........................................................................ 53
Table A.3 : Areas of study (2013) ............................................................................................. 53
Table B.1 : Median Incomes of Graduates compared with Completed Year 12 (1986-2006) ..... 60
Table B.2 : Duration of unemployment, by educational attainment ......................................... 61
Table C.1 : ACT university student expenditure by region (FY2013) ......................................... 62
Table C.2 : ACT university students’ expenditure bundle ......................................................... 63
Figures Figure 1.1 : ACT universities’ links to the economy .................................................................... 2
Figure 1.2 : The contribution of universities to the ACT community ........................................... 3
Figure 2.1 : Heat map of where students live ............................................................................. 8
Figure 3.1 : University revenue and student expenditure (2012) ............................................. 17
Figure 5.1 : Case study: Kingsford Smith Homework Centre ..................................................... 36
Figure 5.2 : Case study: ANUgreen........................................................................................... 38
Figure 5.3 : Case study: e-hub Self-Help Programs for Mental Health research ........................ 41
Figure 5.4 : Case study: Australian Regional Partnerships Program .......................................... 42
Figure 5.5 : Case study: Innovation ANU .................................................................................. 43
Figure 5.6 : Case study: University of Canberra Public Hospitals Project................................... 43
Figure 5.7 : Case study: Sporting Commons Project ................................................................. 46
Figure 5.8 : Case study: ANU Exchange .................................................................................... 47
Figure 5.9 : Case study: Ibrahim Ismail..................................................................................... 49
Figure A.1 : Location of ANU primary campus .......................................................................... 54
Figure A.2 : Location of UC primary campus ............................................................................ 55
Figure A.3 : Case study: Weedon Lodge ................................................................................... 57
Figure D.1 : Economic activity accounting framework .............................................................. 65
Figure E.1 : Key components of DAE-RGEM ............................................................................. 68

Socioeconomic contribution of major ACT universities
Glossary ABS Australian Bureau of Statistics
ACU Australian Catholic University
ACT Australian Capital Territory
ADFA Australian Deference Force Academy
ANU Australian National University
ARC Australian Research Council
C-D Cobb-Douglas
CGE Computerised General Equilibrium
DAE Deloitte Access Economics
DAE-RGEM Deloitte Access Economics Regional General Equilibrium Model
EBITDA Earnings Before Interest, Tax, Depreciation and Amortisation
ERA Excellence in Research in Australia
GDP Gross Domestic Product
GOS Gross Operating Surplus
GTP Gross Territory Product
IO Input Output
LGA Local Government Area
NSW New South Wales
PC Productivity Commission
UC University of Canberra

Socioeconomic contribution of major ACT universities
i
Deloitte Access Economics
Key points The combined total economic contribution of the University-related sector to the
Australian Capital Territory (ACT) exceeded $1.7 billion in 2012 and about 11,500 full time equivalent employees (see page 25). This sector contributes through:
• the direct operations of the two major universities ($792 million) and the indirect or flow-on effects to other sectors of the ACT economy ($199 million);
• spending by students enrolled at the universities and spending by persons from outside the ACT visiting students ($713 million); and
• in addition to direct employment of 5,424 FTE staff by the two universities, employment in the university-related sector also includes employment in the sectors supplying the universities, and in sectors where students and their visiting friends and relatives spend money.
Universities contributed 4% of total industry value added in the ACT in 2012, more than financial and insurance services and more than utilities (gas, water, electricity and waste) (page 27). The universities also exported education services, earning income for the ACT from 10,000 international students and 10,500 interstate students (page 23).
The direct university-related sector contribution is significantly larger than the indirect contribution, reflecting the labour intensive nature of education that means much of the sector’s value-added remains in the ACT. Conversely, the ACT economy has a relatively small industrial base so the university-related sector obtains many of its consumer and commercial inputs from other regions of Australia (page 25).
The two major universities in the ACT – Australian National University (ANU) and University of Canberra (UC) – are important to the ACT economy and community. With more than 38,000 students enrolled and just over 5,300 Full-time and Part-time staff, one in nine Territorians work or study at the universities (page 6).
Every dollar of expenditure in the ACT University-related sector is associated with 80 cents of value added to the local economy, which is relatively high (page 25).
The universities help the ACT government to meet strategic and planning policy goals, including key elements of The Canberra Plan pertaining to healthcare; education, teaching and skills; a strong economy; vibrant city and neighbourhoods and a sustainable future (page 35).
Canberra is Australia’s “University Town” with 7.9% of the usual resident population studying full-time or part-time at a higher education institution; well above the next highest, Melbourne and Ballarat with 5.3% each (page 7).
The quality of teaching within the ACT university sector is high compared to other institutions. The ANU was the highest ranked Australian university in the recent QS World University Rankings, and rated 27th overall. UC graduates ranked their university seventh highest ranking nationally in ‘good teaching’ (page 36).
The ACT is home to over 380,000 people and is an economic and social hub for the surrounding Capital Region of New South Wales. The ACT economy is different to the rest of Australia; it is heavily skewed towards service industries. The economy has a relatively high proportion of jobs in public administration, professional services and education. This service orientation means it is well placed to take advantage of longer-
Socioeconomic contribution of major ACT universities
ii
Deloitte Access Economics
term trends in the economy favouring a more highly-skilled workforce. To do so, the ACT’s universities will be expected to play a major role (page 44).
The structure of the ACT economy is changing in the face of long-term technological and demographic trends as well as the recent changes announced by the government relating to budget pressures. Universities provide the types of skills and ideas the ACT will need to be resilient in the face of structural economic change (page 44). The two Universities contribute significantly to tax receipts in the ACT; they paid $41 million in payroll tax (12.6% of the total) to the ACT Government (page 11).
The universities contribute significantly to the supply of labour in the ACT (page 11):
• in 2012, there were about 13,400 FTE jobs filled by students, representing 7% of the total workforce of the ACT; and
• many faculty and other staff travel to the ACT to take up relatively high skilled jobs. Their family members may also contribute to the labour supply.
Deregulation of higher education has encouraged universities to explore ways to expand their core operations and to diversify revenue generation. Their success in these endeavours has a positive impact on the ACT economy:
• ANU’s growth strategy includes bringing additional international students into the ACT. This plan is projected to attract an additional 2,900 international students by 2024. These additional international students are projected to add $267 million (in 2013 dollars NPV) to the local economy over 10 years. About 50 cents in every dollar spent by the students is value added to the ACT economy. By the end of the modelling period the total number of international students in the ACT is projected to be 11,825. UC is also targeting a substantial increase in its international effective full-time student load (EFTSL), to 5,000 by 2018 (page 31).
• UC’s Health Hub could add almost $43 million in NPV over 10 years. About 60 cents in every dollar associated with construction and operation of the Health Hub is value added to the ACT economy. The slightly higher multiplier for the Health Hub reflects the capital expenditure included within the modelling scenario (page 34).
University education increases the lifetime earning capacity of individuals. Median salaries for graduates are around 65% higher than individuals with Year 12 only (Daly and Lewis, 2010). Providing access to higher education is at the core of the universities regional socioeconomic contribution. Around 47% of ACT residents remain in the region after graduation. Overall, more graduates remain in the ACT (46%) than were living there prior to their studies (43%) (page 13).
Research at the universities has led to commercial spin-offs that help industry to grow or become more efficient, as well contributing to the stock of human knowledge (page 39).
• ANU earned over $1.4 million in income in 2009 from active licenses, options and assignments, and $34 million in total gross value of contracts. The income earned by UC for research activities exceeded $17 million in 2011.
• In 2012 the ANU attracted $217 million for research.
The two major ACT universities accounted for 6.5% of published research output in Australia, from a population base of 1.7% of the national population.

Socioeconomic contribution of major ACT universities
iii
Deloitte Access Economics
Executive Summary This report provides an analysis of the key economic and social contributions of the two major universities in the Australian Capital Territory (ACT) – the Australian National University (ANU) and the University of Canberra (UC). The report is being prepared in a climate of deregulation and change within the higher education sector. There will be greater competition in the sector and opportunities for individual universities to expand their share of the higher education market, with implications for the economies of the regions in which the universities operate.
The analysis in this report has been conducted to inform key stakeholders of the two major ACT universities – including the ACT Government, Federal Government and local business – of the nature and dimensions of the impact these institutions have on the Territory now and in the future.
Universities in and of themselves are significant employers of research, teaching and administrative staff. In addition, businesses catering to staff and students are also employers. Universities support innovation and economic development beyond the campus; encourage better employment outcomes for students and the regions they reside in; and promote better socio-economic outcomes for society more broadly. There are well established relationships between education and wellbeing, for example, in terms of health, social cohesion, crime and justice outcomes.
Universities fund their activities from a range of sources; they attract considerable government funding for the services they provide.
This report quantifies the economic contribution of the ACT’s major universities (the Australian National University and the University of Canberra) and the potential impact of expanding their capacity. The report does not attempt to place a dollar value on the two universities’ collaboration with business or engagement with the broader community. As such, the estimates of the economic impact of the universities presented in this report understate the full impact.
The universities in the ACT economy
University students contribute to keeping the ACT young. The median age of ACT residents (35 years) is lower than in any other state, except the Northern territory (NT). A higher proportion of ACT residents are of working age (70%) than in any state in Australia, except the NT. There were more than 38,000 students enrolled at the two major universities in the ACT during 2012. Almost 3% of all students enrolled in higher education in Australia attend university in the ACT; a disproportionate share given that the ACT was home to just 1.7% of the Australian population at the end of 2012.
The ACT economy is different to the rest of Australia in its skew towards service industries. Public administration provides one in three jobs in the ACT, compared to just one in fourteen nationally. Employment in the ACT is more heavily weighted to education and training than elsewhere in the country – providing 8.2% of ACT jobs and 7.5% nationally – which the two major universities have an important role in supporting.

Socioeconomic contribution of major ACT universities
iv
Deloitte Access Economics
In 2012, over 5,400 full-time equivalent staff (including those characterised as casual employees) were employed at the two universities in the ACT.
As one of the large employers in the Territory, the two universities contribute a significant share of payroll tax (12.6%) to the ACT budget. Jointly the two universities paid $41.0 million in payroll tax in 2012. The share of payroll tax is relatively high compared to employment, driven by the high wages paid by universities and the low tax base (i.e. exemption from the tax from the Commonwealth Government).
Additionally, in 2012, students provided an estimated 13,400 FTE workers to the labour force, representing 7% of the total workforce of the ACT. Student workers are particularly important in sectors such as hospitality and retail.
The economic contribution of the ACT University-related sector
For this report, the economic contribution of the universities to the ACT economy is defined as follows:
the total contribution comprising:
• universities operations, which are summarised in the institutions’ financial statements, including wages paid to staff and GOS to the universities; and
• spending by students and their visitors (e.g. family and friends travelling to the ACT from interstate) not captured in the universities’ income statements;
the additional contribution to the economy, (conservatively estimated, by excluding spending by ACT resident students who, in the absence of local universities, may have remained in the ACT but not undertaken higher education ); and
the indirect or flow-on effects of university and student (and their visitors) activity to other sectors of the ACT economy.
The contribution as outlined above, while including payments to staff, does not extend to family members of staff that that have relocated from interstate. These family members are likely to contribute to the labour force in the ACT.
Table i: Economic contribution of the major universities to the ACT, 2012
Direct Indirect Total
University-related sector - Total contribution
Value added ($m) 1,364 340 1,704
FTE 9,604 1,890 11,494
University-related sector -Additional contribution
Value added ($m) 1,074 269 1,343
FTE 7,471 1,504 8,975
Source: DAE
In total, the ACT university sector contributed $1.7 billion of value added to the ACT economy – this represents 4.9% of the $35 billion local economy. This comprises the direct economic effects of the universities operations, student spending and spending by visitors to students; and the indirect or flow-on effects to other sectors of the economy, such as suppliers of laboratory chemicals, cleaning services and student accommodation. Every

Socioeconomic contribution of major ACT universities
v
Deloitte Access Economics
dollar of expenditure related to the university sector is associated with 80 cents of value added.
The operational activities of the universities alone directly contributed over $790 million and 5,424 FTE jobs to the ACT economy.
Student spending makes up a large share of the contribution of the ACT university sector. In 2012 student spending contributed over $700 million and about 5,400 FTE additional jobs. Major components of student spending include rent or mortgage costs, food and house supplies, utilities and transport costs, creating jobs in industries such as retail, accommodation, food and beverage and Utility services.
Half of the contribution of student spending came from interstate and international students. This contribution can genuinely be regarded as additional – without the ACT universities these students would have to study elsewhere.
Finally, people visiting international ACT university students contributed an additional $3.1 million and 27 FTE jobs to the economy. Other visitors to the institution have not been included in the calculations but provide yet further economic value to the ACT. For example, in 2013 ANU had 49 International delegations and 23 Heads of Diplomatic Missions visiting its campus.
The report also outlines the additional contribution does not include the contribution of those students who are originally from the ACT, as they are assumed to spend in the ACT whether they attend university or go directly into the labour force. Some of these students may have actually left the ACT if it wasn’t for the presence of the universities, and therefore making the actual additional contribution even greater, we have provided the lower bound by assuming all local student expenditure would have been in the ACT economy even without the universities.
Impact of expanding the universities
The report outlines the economic impacts of expanding the size and scope of the University sector in the ACT. There are a number of economic and commercial drivers that have encouraged the university sector to expand its economic base. The two scenarios selected reflect the nature of the expansion options being explored by the two major universities in the ACT.
Expanding the number of international students
The universities have been successful in attracting international students to the ACT. In 2012, international students were around 27% of ANU enrolments and 25% of UC enrolments, compared to 26% nationally.
Increases in the number of international students – from 6,592 to 11,825 over 10 years to 2024 – are projected to have a significant positive impact on the ACT economy. By 2024, it is projected that spending by additional international students will increase the gross territory product (GTP) of the ACT by $49 million. There is a minimal impact on the rest of Australia. In 2013 dollars, the present value of the modelled growth in international student numbers is worth $267 million to the ACT economy.

Socioeconomic contribution of major ACT universities
vi
Deloitte Access Economics
Each additional dollar of expenditure associated with additional international students is associated with 50 cents of extra value added in the ACT economy.
Expanding the economic base of Universities
The increased activity associated with the both building new capital stock and operating the Health Hub is projected to have a positive impact on the ACT economy (Table 4.3). The Health Hub is a new development on the Bruce campus of UC that houses a GP Superclinic and is planned to include a number of other health services including specialists and a chemist.
By 2024, it is projected that the additional activity will increase the GTP of the ACT by $4.2 million, with a minimal negative impact on the rest of Australia.
In 2013 dollars, the present value of the modelled growth in output related to the Health Hub is worth almost $43 million to the ACT economy. Employment impacts are relatively modest, with a peak increase in employment of 27 FTE in 2015.
Each additional dollar of expenditure associated with the development, including capital expenditure and operational activity is associated with 60 cents of extra value added in the ACT economy.
Other economic and social contributions
Alignment with government strategy
The ACT government guides the growth and development of Canberra in The Canberra Plan – Towards our Second Century. The report outlined seven key strategic themes reflecting the priorities of the ACT government. Higher education services provided by Universities are an integral part of meeting most of these strategic themes:
quality health care;
excellent education, quality teaching and skills development;
a strong, dynamic economy;
a vibrant city and great neighbourhoods; and
a sustainable future.
Labour force outcomes for individuals
The presence of two major universities in Canberra provides ACT residents with better labour force outcomes by allowing them to upskill and reskill. Individuals with educational attainment of degree level or higher earn relatively higher incomes and have lower rates of unemployment. The ACT has a relatively high level of education attainment compared to the national average; 47% of persons in the ACT aged 25-34 have a bachelor degree, or have completed even further studies. This compares to the national share of 32%.
The relatively large proportion of working age people in the ACT, as well a high level of educational attainment, have resulted in the participation rate in the ACT remaining above the Australian average for more than three decades. During 2013, the female rate was, on average, 9.1 percentage points higher in the ACT than nationally and the male participation rate in the ACT was 5.1 percentage points higher. A study by Daly and Lewis (2010)

Socioeconomic contribution of major ACT universities
vii
Deloitte Access Economics
estimated that the median wage for higher education graduates was almost 65% higher than for individuals with year 12. Modelling of this part of the economic impact is outside the scope of this report, but returns to the individual are an element of the economic contribution and an important motivation for people to go to university.
Research and knowledge
Academic employees at the two universities undertake research which aims to answer important questions facing Australian and indeed global society. The outcome of research undertaken by the universities has been applied in real world situations to address key challenges facing the regional and Australian economies. The national and international media reporting of research at the Universities provides significant exposure to the ACT, contributing to the Territory’s reputation as a regional leader in education and research. The report outlined the universities role in attracting international and interstate student and measures the contribution to the economy. The university also attracts conference attendees from interstate and overseas.
Research at the universities has led to commercial spin-offs that help industry to grow or become more efficient, as well contributing to the stock of human knowledge. In 2009, the ANU had over $1.4 million in income in 2009 from active licenses, options and assignments, and $34 million in total gross value of contracts. Research income generated by UC increased from $11.6 million in 2009 to $17.1 million in 2011.
Given its history and standing in the research community the ANU attracts significant grant money. In 2012, the ANU attracted $217 million for research. This has contributed to local, national and global research activity. In addition, it has also provided a pool of intellectual property.1
During 2012, research output from the major ACT universities accounted for around 6.5% of all the published research of universities in Australia. In terms of the type of research output, ACT researchers produced 11.7% of all the books published by Australian academics during the year and 5.6% of journal articles. By comparison, the ACT accounts for just 1.7% of Australia’s population.
ANU is well known as a centre for research excellence. The 2012 Excellence in Research Australia (ERA) noted that of specific fields of research, ANU had the highest proportion of research above world standard of any Australian institution (84%).2 ERA ranked ANU research well above world standard across all disciplines, including; biological and environmental sciences, economics, studies in human society, philosophy and law.
Research output from UC has increased considerably over recent years, reflecting the commitment by the university to focus on producing high quality research output. Between 2009 and 2011, output of research publications increased by 75.5%.
1 National Survey of Research Commercialisation (2008-2009)
2 Excellence in Research for Australia (2012)

Socioeconomic contribution of major ACT universities
viii
Deloitte Access Economics
Regional economy impacts
The two universities have an important role to play in regional development, generating economic activity, and responding to structural change in the ACT and Capital Region. Providing access to and promoting education attainment of rural, regional and remote students, is core to this regional economic role.
The services share of output of the Australian economy has been rising rapidly and this is likely to continue. Goods production (e.g. manufacturing) has become, and will continue to, be less important relative to service sectors, such as finance and insurance, health care and social assistance, education and professional, scientific and technical services. These high-skill service industries are critical to the ACT economy and are those which require higher education qualifications. Moreover, the major universities in the ACT play a major role producing the highly-skilled workers that the Australian economy will increasingly come to rely on, thereby contributing to the resilience of the region’s industrial base.
Universities will have a critical role in helping regions respond to the changes taking place. Education is fundamental to responding to structural change in an efficient and least disruptive way, by providing workers with the necessary skills to make the transition to new jobs.
Other links with the community
The universities maintain relationships with the community across a broad range of areas, including sporting, music and the arts. Partly, this relationship is developed through encouraging members of the community to use facilities maintained by the universities.
The ANU Sport & Recreation Association caters for users across the community. ANU Sport has 33 affiliated clubs, with 105 teams for people to participate in. For example, the ANU Football club has 15 teams. Similarly, the University of Canberra Union is designed to enrich campus experiences for students and the wider community. The union not only offers thirteen sporting clubs, but also a multitude of other faculty, cultural and social clubs, for example the UC Toastmasters, Rainbow UC and the Commerce Society. The UC also has community partnerships with several ACT sporting teams, most notably the Super Rugby side, the University of Canberra Brumbies and the University of Canberra Capitals WNBL team.
Recently, activities by the ANU at the City West Precinct adjacent to the Canberra CBD have aimed to create a vibrant new area. This area has a mix of university and student activities in the arts, science and education as well as significant new residential and community facilities.
Deloitte Access Economics

Higher learning: Socioeconomic impact analysis of the universities in the ACT
1 Deloitte Access Economics
1 Introduction Deregulation of the higher education sector, uncapping student numbers and allowing flexibility in pricing, is creating challenges and opportunities for suppliers of education services. Cutbacks to higher education funding announced by the government relating to budget pressures will affect universities at a time when competition for students has increased.
In this context, this report provides an analysis of the key economic and social contributions of the two major universities in the Australian Capital Territory (ACT) – the Australian National University (ANU) and the University of Canberra (UC).
The work is being conducted to inform key stakeholders in the universities – including the ACT Government, Federal Government and local business – of the nature and dimensions of the impact these institutions have on the Territory now and in the future.
1.1 Background
Universities are critical institutions in Australian society, contributing to many aspects of economic development and social cohesion. Universities today do much more than provide education services to students and foster academic research, increasingly engaging with government, business and the local community as well as fostering international links. As a result of these activities, universities:
in and of themselves are significant employers of research, teaching and administrative staff. In addition, businesses catering to staff and students are also employers;
support innovation and economic development beyond the campus;
encourage better employment outcomes for students and the regions they reside in; and
promote better socio-economic outcomes for society more broadly. There are well established relationships between education and wellbeing, for example, in terms of health, social cohesion, crime and justice outcomes.
Universities depend on a range of sources for funding of their activities. Public funding of universities reached $12.8 billion in 2011, while private sources including (predominately international) students provided the rest.3
Government has competing claims for funding. It is, therefore, important to be able to demonstrate the value of the investment in higher education and, in particular, the significant flow-on social and economic impacts of universities. Equally, it is important that governments are cognisant of these impacts when assessing funding allocations and business is aware of the various forms that the returns on their investment may take. This paper provides an analytical assessment of the impact of the two universities’ on the ACT economy, to inform the decision makers.
3 Higher Education Base Funding Review, 2011

Higher learning: Socioeconomic impact analysis of the universities in the ACT
2 Deloitte Access Economics
1.2 Scope and methodological approach
This report provides an analysis of the social and economic impacts of universities in the ACT (Figure 1.1). The scope of the study and analytical approach are summarised below.
Figure 1.1: ACT universities’ links to the economy
1.2.2 The universities
There are a number of institutions in the ACT that comprise the higher education sector. This report focusses on the two major universities in Canberra, Australian National University and the University of Canberra. Together, the two universities accommodate a little over 38,000 students or about 92% of the relevant student population and are the major suppliers of higher education services in the ACT and adjacent regions.
Other Universities based in, or with campus in, the ACT include the Australian Catholic University (600 enrolled students), The School of Theology of Charles Sturt University (50-100 students) and The Australian Defence Force Academy administered by the University of New South Wales (2,685 enrolled students). Even without these institutions, this study covers the majority of all higher education activity within the ACT.
1.2.3 Approach
This report provides a quantitative analysis of measures of economic activity associated with the universities, treating them as an industry that produces output, creates
ACT Universities
Government
•Graduates
•Dept. of Education
•Research
•Consultancy
•Service delivery (Health services)
•The Canberra Plan
•Relatively high payroll tax
Students – 38,000
•Education and skills
•Life experience
•Research facilities
•Social environments
Staff – 5,300
•Employment
•Community involvement
•Collaborative learning
Community
•Sporting facilities
•Clubs and societies
•Cultural activities
•Events
•Guest speakers
Industry
•Skills
•Labour supply and internships
•Media engagement
•Universities and student spending
Other Universities
•Research opportunities
•Social and sporting events (University Games)
•Visitors

Higher learning: Socioeconomic impact analysis of the universities in the ACT
3 Deloitte Access Economics
employment and earns export income. This approach produces key metrics including the sector’s contribution to gross territory product (GTP) and full-time equivalent (FTE) employment; flow-on effects on other sectors that provide goods and services to the universities; and multiplier effects of expanding the productive capacity of the universities.
For this report, the economic contribution of the universities is defined to include:
the universities operations, which are summarised in the institutions’ financial statements;
spending by students and their visitors (e.g. family and friends travelling to the ACT from interstate), not captured in the universities’ income statements; and
the flow-on effects of university and student (and their visitors) activity on other sectors of the ACT economy.
The report does not attempt to place a dollar value on the two universities’ collaboration with business or engagement with the broader community. It does not attach a value to the wage premium accruing to university graduates or the impacts of retaining skilled workers to the ACT. Rather, case studies and selected statistics are provided to illustrate the nature and outcomes of these relationships. This is augmented with information from the relevant academic literature on the value of higher education, to the individual and to the community.
As such, the estimates of the economic impact of the universities presented in this report understate the full impact. The approach to measure these aspects of the analysis is outlined in Figure 1.2 below.
Figure 1.2: The contribution of universities to the ACT community
Source: Deloitte Access Economics
Economic impacts Social impacts
• Value added
• Employment
• Wages
• Productivity
• Human capital
• Reduced crime rates
• Cultural exchange
• Community impact
• ABS National Accounts
• ABS regional employment
• Australian Education
International
• Universities’ Annual reports
• ABS Census
• Department of Education
• Productivity Commission
• ACT Government documents
• Universities’ Annual reports
Concepts
Inputs
Concepts
Inputs

Higher learning: Socioeconomic impact analysis of the universities in the ACT
4 Deloitte Access Economics
Figure 1.2 outlines the building blocks for how the higher education sector contributes to the ACT community, economy and social life.
Much of the economic impact analysis was done on data for the 2012 calendar year. The universities provided financial data and summary statistics for their students and staff. This along with information on the ACT economy obtained from various Australian Bureau of Statistics (ABS) publications, statistics from Australian Education International, student spending data from Universities Australia and international visitor spending data from Tourism Research Australia, enabled us to calculate the Universities’ contribution.
1.2.4 Modelling techniques used
There are two modelling techniques used to measure the significance of the ACT University sector to the economy: the economic contribution of current operations, using input output multiplier analysis (IO), or the future impact, using Computable General Equilibrium Modelling (CGE). More information on both can be found in Appendix D and Appendix E.
An economic contribution study provides a snapshot of the contribution of an industry or economic entity to economic measures (such as value added and employment) for a particular point in time. The contribution calculation refers to activity in the ACT university sector in the 2012 calendar year.
Value added is the most appropriate measure of a company’s economic contribution to GDP at the national level or gross state product (GSP) at the state level. Value added measures the value of goods and services created by the labour and capital deployed by that entity. The value of goods and services created is reflected in the income received by labour and capital, namely wages, gross operating surplus and production taxes less subsidies. The sum of value added across all entities in the economy equals GDP.
Wages include employee related expenses and deferred superannuation expenses, while profits or gross operating surplus (GOS) is equivalent to earnings before interest, tax, depreciation and amortisation (EBITDA). Direct value added also includes any net production taxes paid less government subsidies. More information on the methodology used is outlined in Appendix D.
There are two components of the economic contribution. The first is the direct value added contributed by a university through its operations, namely the wages it pays its employees and its gross operating surplus (GOS).
The second component of the economic contribution is the indirect value added as a result of purchasing intermediate inputs from suppliers; for example, payments for office supplies or utilities.
The expenditure of households who derive income from the university sector is not quantified in this report. While this spending may be significant, the wage payments to employees of the university sector already are included in the contribution calculations; inclusion of spending of this income would overstate the contribution of the sector.

Higher learning: Socioeconomic impact analysis of the universities in the ACT
5 Deloitte Access Economics
To measure the economic contribution we have used our in-house regional input-output model – DAE-RIO-M. The model was customised to separate the ACT from the Rest of Australia.
The report also outlines the impact of a number of planned expansion scenarios the two universities are exploring. To model the future impact we have used our in-house CGE model DAE-RGEM.
CGE analysis is an extension of IO analysis, in that it is based on a database that incorporates input output tables and details of transactions between economic agents. In addition, CGE models also incorporate a system of equations and modelling parameters, based on a widely accepted body of economic theory, that model competition for resources (particularly in labour and capital markets) between economic agents. The framework allows for economy-wide modelling impacts incorporating any “crowding-out” impacts of a specific development project on other projects.
The CGE modelling framework used to estimate the economic impact captures the labour resource constraints that operate in a region; if unemployment is low (as in the ACT) additional labour resources may have to be attracted away from other projects – there will be competition for resources that can effectively only be used for one project. This is not a constraint for IO modelling of the economic contribution which is a snapshot of activity associated with an economic entity – and a given amount of labour – at a specific point in time.
Finally, the report benefited from information and insights – including case studies – provided by university officers, including student organisations as well as teaching and administrative staff, and agencies in the ACT government.
1.3 The structure of the report
This report is structured as set out below.
Chapter 2 provides a regional profile of the ACT region, showing how the universities fit in in terms of geography, population and socioeconomic characteristics. The location of ACT universities and their role in servicing the Territory is also discussed in this chapter.
The results of the economic contribution study of ACT’s universities are discussed in Chapter 3.
Examples of the impact on the ACT economy from expanding the universities’ activities are outlined in Chapter 4.
Chapter 5 present estimates of the social impacts of higher education, in terms of benefits to the individual as well as to society.
Chapter 6 summarises the magnitude of the economic and social impacts the universities provide.
Technical details of the economic modelling and other supplementary information are presented in Appendix A through to Appendix F.

Higher learning: Socioeconomic impact analysis of the universities in the ACT
6 Deloitte Access Economics
2 Regional profile of the ACT The economy of the Australian Capital Territory is service-oriented, built on the business of governing the country and relying on the national economy for industry and household expenditure inputs. There are a number of other related sectors, such as professional services and education that also contribute to the ACT economic profile as a place with high wages and, quality of life; a relatively young population and low levels of social disadvantage.
In addition, the ACT is also an economic, services and social hub for the surrounding Capital Region of NSW. These linkages are apparent on a number of levels: for example, children in surrounding regions play sport in the ACT and are educated in ACT schools; households travel to Canberra to buy products in ACT stores and workers commute from NSW to work.
2.1 Population
As at June 2013, the ACT had a population of 382,981, with around 70% of working age – represented by the 16-64 years of age cohort in Chart 2.1. The working age share of total population has been forecast by the ABS to decline to 64% in 2050, with a corresponding increase, to 16%, in the over-65 cohort. Over the same period, the proportion of seniors nationally is expected to increase from 14% to 21%.
Chart 2.1: Population by age (2012 – 2050)
Source: ABS Cat. No. 3222.0
University students contribute to keeping the ACT young. There were more than 38,000 students enrolled at the two major universities in the ACT during 2012.
0%
10%
20%
30%
40%
50%
60%
70%
80%
90%
100%
2012 2022 2032 2042
65+
16-64
0-15

Higher learning: Socioeconomic impact analysis of the universities in the ACT
7 Deloitte Access Economics
Almost 3% of all students enrolled in higher education in Australia attend university in the ACT; a disproportionate share given that the ACT was home to just 1.7% of the Australian population at the end of 2012.4
Canberra is the most “University Town” in Australia with almost 8% of the population studying full-time or part-time at a Higher Education Institution. This may be an indication of the quality of institutions in the ACT and a reflection of the high education attainment required in the ACT labour market.
Table 2.1: Higher education attendance, % of Population*
Population Studying FT/PT in Higher Ed
% of Population
Australian Capital Territory 356,586 28,280 7.9%
Melbourne 3,999,981 213,648 5.3%
Ballarat 91,798 4,865 5.3%
Brisbane 2,065,998 108,345 5.2%
Sydney 4,391,673 229,367 5.2%
Townsville 162,290 8,465 5.2%
Wollongong 268,946 13,624 5.1%
Adelaide 1,225,235 61,677 5.0%
Perth 1,728,866 85,423 4.9%
Newcastle - Maitland 398,768 18,470 4.6%
Hobart 211,656 9,659 4.6%
Bendigo 86,075 3,564 4.1%
Darwin 120,587 4,962 4.1%
Gold Coast - Tweed Heads 557,822 9,659 1.7%
Geelong 173,449 6,837 3.9%
Albury - Wodonga 82,083 2,725 3.3%
Sunshine Coast 270,771 8,541 3.2%
Cairns 133,911 4,081 3.0%
Source: ABS Census, 2011 * Population and student population are based on place of usual residence
2.1.1 Locational benefits
Figure 2.1 is a student residence heat map, by postcode for UC and ANU. The size of each point represents the number of students that live in that postcode, and the shading represents the share of students to total population. The dark blue point represents the city centre, which includes the ANU. Students make up 70% of the total resident population in this area.
4 Source: ABS Cat. No. 3101.0

Higher learning: Socioeconomic impact analysis of the universities in the ACT
8 Deloitte Access Economics
Figure 2.1: Heat map of where students live
Source: ACT Universities
Nearly 90% of the staff at the ACT universities live in the ACT and another 10% travel to work from surrounding regions, including Queanbeyan, Yass, Goulburn, Moss Vale and Bungendore. A small portion of university staff spend Monday to Friday in the ACT then travel on their weekends, and as a result have their residence status as their weekend home, which may be outside this region. The universities also have offices in other capital cities, such as Sydney and Melbourne, but relatively few staff work there.
Higher learning: Socioeconomic impact analysis of the universities in the ACT
9 Deloitte Access Economics
2.2 Industry
2.2.1 Output by industry
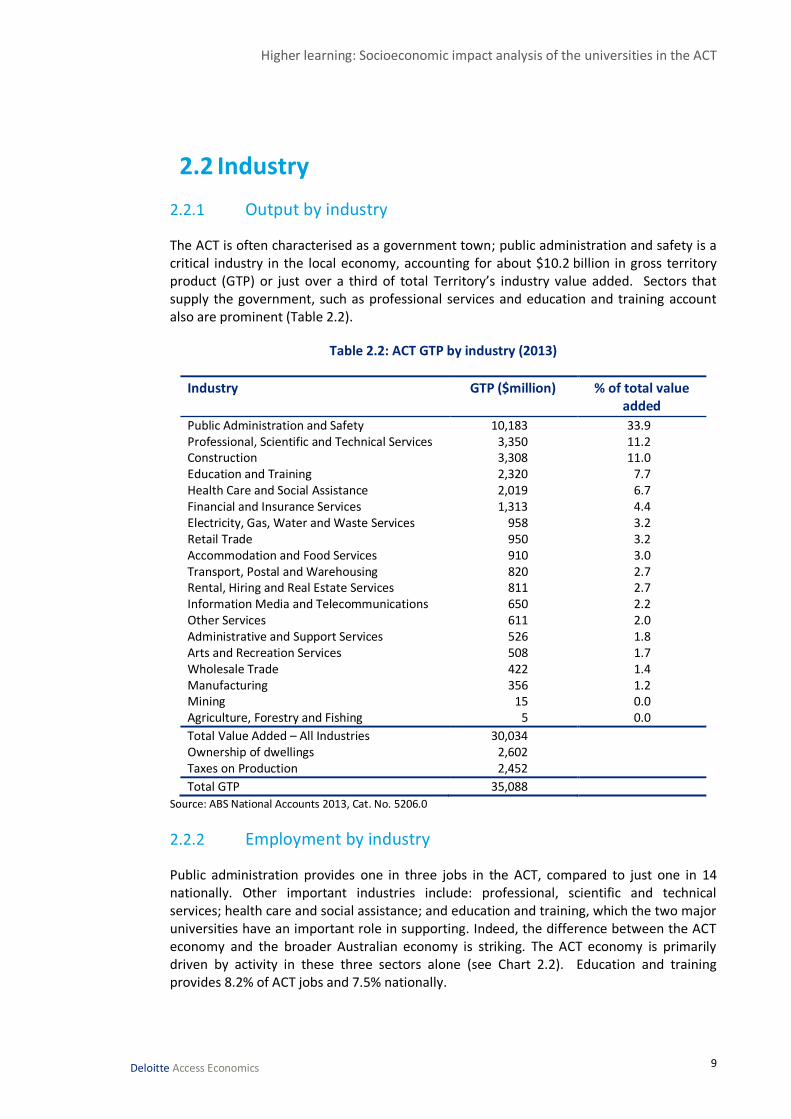
The ACT is often characterised as a government town; public administration and safety is a critical industry in the local economy, accounting for about $10.2 billion in gross territory product (GTP) or just over a third of total Territory’s industry value added. Sectors that supply the government, such as professional services and education and training account also are prominent (Table 2.2).
Table 2.2: ACT GTP by industry (2013)
Industry GTP ($million) % of total value added
Public Administration and Safety 10,183 33.9 Professional, Scientific and Technical Services 3,350 11.2 Construction 3,308 11.0 Education and Training 2,320 7.7 Health Care and Social Assistance 2,019 6.7 Financial and Insurance Services 1,313 4.4 Electricity, Gas, Water and Waste Services 958 3.2 Retail Trade 950 3.2 Accommodation and Food Services 910 3.0 Transport, Postal and Warehousing 820 2.7 Rental, Hiring and Real Estate Services 811 2.7 Information Media and Telecommunications 650 2.2 Other Services 611 2.0 Administrative and Support Services 526 1.8 Arts and Recreation Services 508 1.7 Wholesale Trade 422 1.4 Manufacturing 356 1.2 Mining 15 0.0 Agriculture, Forestry and Fishing 5 0.0
Total Value Added – All Industries 30,034 Ownership of dwellings 2,602 Taxes on Production 2,452
Total GTP 35,088
Source: ABS National Accounts 2013, Cat. No. 5206.0
2.2.2 Employment by industry
Public administration provides one in three jobs in the ACT, compared to just one in 14 nationally. Other important industries include: professional, scientific and technical services; health care and social assistance; and education and training, which the two major universities have an important role in supporting. Indeed, the difference between the ACT economy and the broader Australian economy is striking. The ACT economy is primarily driven by activity in these three sectors alone (see Chart 2.2). Education and training provides 8.2% of ACT jobs and 7.5% nationally.

Higher learning: Socioeconomic impact analysis of the universities in the ACT
10 Deloitte Access Economics
Chart 2.2 : Share of total FTE employees, by Industry (2011)
Source: Census, 2011
2.2.3 Universities as employers
Academic employees of the universities primarily undertake teaching and research activities. Administrative, professional and other staff undertake a broad range of activities, including student admissions, technical functions, research support, facilities management and community liaison.
The number of full-time equivalent staff is slightly less than the total number of employees; most university employees are full time. In 2013, just over 5,400 full-time equivalent staff (including those characterised as casual employees) were employed at the two universities in the ACT (Table 2.3).
Table 2.3: Major ACT universities’ employees (FTE staff), 2013
ANU UC Total FTE
Academic staff 1,864 522 2,386
Non-academic staff 2,464 574 3,038
Total 4,327 1,097 5,424
Source: ACT Universities' data. The figures above include those classified as casual employees.
0% 10% 20% 30% 40%
Public Administration and Safety
Professional, Scientific and Technical Services
Health Care and Social Assistance
Education and Training
Construction
Retail Trade
Accommodation and Food Services
Other Services
Transport, Postal and Warehousing
Administrative and Support Services
Manufacturing
Information Media and Telecommunications
Financial and Insurance Services
Arts and Recreation Services
Wholesale Trade
Rental, Hiring and Real Estate Services
Electricity, Gas, Water and Waste Services
Agriculture, Forestry and Fishing
Mining
Australia
ACT

Higher learning: Socioeconomic impact analysis of the universities in the ACT
11 Deloitte Access Economics
In 2013, the two universities contributed 32% of the 16,600 FTEs employment in the ACT’s education and training sector.
As large employers in the Territory, the two universities contribute a significant amount of payroll tax to the ACT budget. Jointly the two universities contribute $41 million in payroll tax, out of $324.5 million total; or 12.6% of the total. The universities’ share of payroll tax is relatively high compared to employment, reflecting the high wages paid by universities and the low tax base (i.e. exemption from the tax from the Commonwealth Government).
2.2.4 Labour force contribution
The two universities contribute significantly to the supply of labour in the ACT. The universities are the catalyst for international and interstate students and staff members and their family to move to the ACT, and those students who are currently employed represent an increase to the ACT labour supply which would otherwise not have occurred.
In 2012 all university students contributed just over 13,000 FTE employees to the ACT economy, with the largest share coming from domestic students at 10,364.
With a total ACT workforce of just over 200,000 FTEs (Census 2011), students contribute 6.7% to the total workforce in the ACT.
Table 2.4: Student contribution to employment, 2012 (FTE)
Domestic International Total
Contribution – Total student population
Undergraduate 6,649 1,670 8,319 Postgraduate 3,715 1,399 5,114 Total 10,364 3,068 13,433
Contribution – Arrivals to the ACT
Undergraduate 2,476 1,670 4,146 Postgraduate 1,383 1,399 2,782 Total 3,859 3,068 6,927
Source: ACT universities’ data5
The table also shows the contribution to the labour force from those who have travelled to the ACT to undertake study at either ANU or UC; i.e. domestic students from other states and territories and international students. These students have contributed just over 6,900 FTEs to the ACT economy. Student workers are particularly important in sectors such as
5 To estimate the characteristics of the student workforce the following data were utilised.
• Total domestic and international student numbers from the ANU and UC. • The share of graduate and postgraduate students from each of the universities. • The number of students in paid employment and the hours worked provided from ANU. • Hours worked during study periods and outside study periods from Universities Australia.

Higher learning: Socioeconomic impact analysis of the universities in the ACT
12 Deloitte Access Economics
hospitality and retail. These industries are characterised by part-time and non-regular working hours; i.e. outside of business hours. The flexible nature of university contact hours makes these jobs attractive to students.
Staff members also contribute to the labour supply of the ACT, with faculty and other staff travelling to the ACT to take up relatively high skilled jobs. Staff family members may also contribute to the labour supply.
2.3 Labour market outcomes
University education has a large bearing on labour market outcomes for individuals.
2.3.1 Graduate destinations
The universities have an important role in encouraging economic growth in the ACT region. This will primarily be achieved through the university enabling growth in employment in the important industries for the region in the future. International students play an important role here, particularly those who choose to stay within the region following graduation.
The ACT region benefits from graduates who study at the two major ACT universities and then continue to live and work in the region. International students contribute both to the Australian economy more broadly as well as the local ACT economy through increasing the supply of skilled labour.
Table 2.5: University of Canberra graduate destinations (2013)
Origin Share that stay in the ACT after graduating (%)
Share of enrolled students (%)
ACT 89 49
Interstate 5 27
International 24 24
Source: UC
Nearly 50% of the graduates from ANU stay within the ACT region following graduation, with a further quarter living overseas. More graduates remain in the ACT following graduation than were living in the ACT prior; i.e. an additional three percentage points of all graduates live in the Capital Region following graduation that were not previously living there prior to enrolling at university.

Higher learning: Socioeconomic impact analysis of the universities in the ACT
13 Deloitte Access Economics
Table 2.6: ANU graduate destinations
Destination Where graduates originate (%)
Where graduates live after graduation (%)
Australian Capital Territory 43.0 46.1
New South Wales 19.2 13.2
Victoria 4.4 6.5
Queensland 2.0 3.6
Western Australia 1.1 1.8
South Australia 1.4 1.3
Northern Territory 0.4 0.8
Tasmania 0.4 0.3
Overseas 27.3 25.3
Unknown 0.8 1.2
Total 100 100 Source: ANU. Note: ACT includes adjacent regions in NSW.
University graduates have higher average annual income than non-university graduates, contributing to the economic development of the ACT region. Further, the two universities attract human capital to the region if graduates of the two universities who have relocated to the ACT from elsewhere in the world and around Australia continue to live and work within the ACT region.
While it is the case that some students are receiving teaching and training and leaving the city, UC data indicates that almost 90% of students from the ACT continue to live and work in the ACT following the completion of their studies. This is a significant contribution that the universities make to the supply of labour with higher education qualifications in the ACT.
The number of international students who choose to continue to live in the ACT following graduation could be more than 800 each year.
• In 2013 there were 10,463 international students at ACT Universities. Assuming the students complete their studies in three years, almost 3,500 would graduate each year.
• As outlined in the table above, 24% of international students stay in the ACT after graduation. This implies there would be an additional 837 international students joining the workforce each year.
2.3.2 Graduate income
The presence of two major universities in Canberra provides ACT residents with better labour force outcomes by allowing them to upskill and reskill. Individuals with educational attainment of degree level or higher earn relatively higher incomes and have lower rates of unemployment.

Higher learning: Socioeconomic impact analysis of the universities in the ACT
14 Deloitte Access Economics
Chart 2.3 below shows that both employment rates and hourly wage rates are higher for those who have undertaken post-year-12 education. The employment rate and hourly wage are highest for university graduates. This demonstrates the importance of higher education on employment outcomes for individuals and their and lifetime earning capacity.
Chart 2.3: Education and labour market outcomes
Source: Productivity Commission estimates Impacts of COAG Reforms: Business Regulation and VET
In Australia, the private rate of return for an individual completing a bachelor degree, compared to someone who had finished Year 12 was 15.3% higher for males and 17.3% higher for females.6
The ACT has a relatively high level of education attainment compared to the national average; 47% of persons in the ACT aged 25-34 have a bachelor degree, or have completed even further studies. This compares to the national share of 32%.
Residents of the ACT enjoy higher wages and household income on average than elsewhere in Australia. In 2011, the median weekly household income in the ACT was $1,920, compared to $1,234 for the whole of Australia. Hence, the median weekly household income is 56% greater in the ACT.7
2.4 Other socio-economic indicators
The ACT scores highly on socio-economic indexes for areas that rank regions on their level of advantage. Table 2.7 shows the ACT’s scores and ranking compared to the other 564 local government areas (LGA) in Australia, based on information from the 2011 census. The ACT ranks amongst the most well off socio-economic areas in the country, in the top 10%
6 Source: ABS Research Paper (2010). The private rate of return is the economic return to an individual on an investment made earlier. In this case, the investment includes the cost of study and forgone income during that period.
7 Source: ABS Census, 2011, size of average household is 2.6 persons per household

Higher learning: Socioeconomic impact analysis of the universities in the ACT
15 Deloitte Access Economics
for each individual socio economic index for areas (SEIFA) indicator, where the top decile (10) of scores are the most advantaged.
Table 2.7: SEIFA Index scores (2011)
SEIFA index Score Decile
Relative socio-economic advantage and disadvantage 1,090 10
Economic resources 1,051 10
Education and occupation 1,115 10 Source: ABS Socio-economic Indices, 2011

Higher learning: Socioeconomic impact analysis of the universities in the ACT
16 Deloitte Access Economics
3 Economic contribution of ACT universities
This chapter outlines the economic contribution that the major ACT universities make to the Territory economy, comprising:
the universities’ operations, which are summarised in the institutions’ financial statements;
spending by students and their visitors (e.g. family and friends travelling to the ACT from interstate), additional to the spending captured in the universities’ income statements; and
the flow-on effects of university and student (and their visitors) activity on other sectors of the ACT economy.
These elements, as described above, outline the basis for how the ACT university-related sector contributes to the demand-side of the ACT economy. The previous chapter outlined how the universities, their staff members and students contributed to the supply-side of the economy.
The concepts underpinning the economic contribution analysis were introduced in Section 1.2 and are explained in detail in Appendix D.
The direct contribution of the universities to the ACT economy has been estimated from information on their operating revenues and expenditures contained in their annual reports. To measure the indirect contribution, the level of intermediate inputs purchased by the universities from suppliers is estimated and, using IO tables, converted into measures of the value added (to GTP) and FTE employment. The scope of the estimated contribution does not extend to the families of university staff from outside the ACT,
although they also make a contribution to the ACT economy.
To measure the students’ economic contribution to ACT (and associated visitor expenditure), their total expenditure (excluding the expenditure at the universities) was estimated from a variety of sources and the IO tables were used to derive measures of the direct and indirect contribution, which are expressed in terms of value added and employment.
In addition, the economic contribution by type of student – local, interstate and international– has been calculated to provide insight into the amount of export income the universities generate for the ACT.
Economic studies of this nature are a useful tool to estimate the current contribution an entity makes to an economy. They are not intended to provide a counterfactual of the impact the loss of the university sector would have on the ACT economy. That said, in Chapter 4 we explain the impact that expanding the activity in the ACT university sector will have on the local economy.

Higher learning: Socioeconomic impact analysis of the universities in the ACT
17 Deloitte Access Economics
3.1 Expenditure
Figure 3.1 shows the total revenue and student expenditure associated with the ACT university-related sector. It is estimated that the sector contributes $2.14 billion in demand. As shown in the blue circle, the ACT universities receive just under $1.2 billion in total revenue. Students attending the two universities spend a total of $940 million. However, of this amount, $60 million is estimated to be spent at the universities themselves and, hence, is also counted in the universities’ revenue. The contribution analysis also includes $3.1 million of expenditure by friends and relatives visiting international students (VFR spending).
Figure 3.1: University revenue and student expenditure (2012)
Source: Deloitte Access Economics
Of the $940 million spent by students studying at the two ACT universities, $19 million is estimated to be spent in NSW, essentially by students residing outside the ACT. Approximately $513 million is spent by students who come from outside the ACT (or adjacent regions of NSW).
3.2 Economic contribution of university operations
This section quantifies the direct and indirect economic contribution of the universities’ operations (including student spending on campus). The economic contribution of the universities is calculated from information contained in their financial reports for 2012. Section 3.3 examines the economic contribution of student expenditure outside the university.
Universities
VFR spending
$3.1 m $1,195m
Additional spending in
the ACT by all students
$940m Additional university
revenue
Student spending in NSW
$19m
$60m
Student
spend at
universities
Students

Higher learning: Socioeconomic impact analysis of the universities in the ACT
18 Deloitte Access Economics
3.2.1 Direct economic contribution of the universities
The direct economic contribution of the two ACT universities is the value added by labour and capital employed at the universities. This is captured by the wages paid to university staff and the gross operating surplus (GOS) that the universities generate in a given year.
In 2012, ANU paid over $500 million in wages to employees and had nearly $340 million of other operating costs. From total revenue of $955 million, there was $110 million of GOS, reported in Table 3.1.8 UC had operating revenue of $240 million and operating costs of $209 million, resulting in GOS of $31 million.
Table 3.1: Direct economic contributions of ANU and UC (2012)
ANU ($ million) UC ($ million)
Operating revenue 955.5 239.7
Australian Government financial assistance 605.9 99.2
Government Payments 54.6 49.7
HECS-HELP - Student payments 11.4 7.4
State Government financial assistance 2.4 2.6
Fees and charges 179.7 58.4
Consultancy and contracts 60.6 4.7
Construction contract revenue 0.7 2.3
Other revenue 40.1 15.4
Operating Costs 845.9 208.8
Employees 507.8 143.2
Services 338.0 66.8
GOS 109.6 30.9
Wages 507.8 143.2
Direct value added 617.5 174.2 Source: ANU and UC Financial statements – 2012, Deloitte Access Economics
Table 3.2 below summarises the direct economic contribution of the major ACT universities in 2012. They had just under $1.2 billion in operating revenue, paid their employees a total of $651 million in wages and had a combined GOS of $141 million. Adding these two components together, the two ACT universities contributed $792 million in direct value added to the ACT economy in 2012. This economic activity also supported about 5,400 full-time equivalent (FTE) jobs. These jobs include university academic staff, other faculty staff, professional staff not in faculties and maintenance personnel.
8 Gross operating surplus (GOS), or profits, are calculated as earnings before interest, tax, depreciation and amortisation (EBITDA) – see Appendix D. It does not include funds reserved for future costs such as major capital works projects.

Higher learning: Socioeconomic impact analysis of the universities in the ACT
19 Deloitte Access Economics
Table 3.2: Direct economic contribution of ACT universities (2012)
$ million
Operating summary
Operating revenue 1,195
Operating costs 1,055
Value added
Gross operating surplus 141
Wages 651
Total value added 792
Total employment (FTEs) 5,424 Source: ANU, UC, Deloitte Access Economics estimates.
3.2.2 Indirect economic contribution of the universities
In addition to the universities’ direct economic contribution, they also contribute indirectly to the ACT and national economies, through their purchases of intermediate inputs from other sectors. This creates additional economic activity in the industries that supply goods and services to universities. Key intermediate inputs used by universities include consumables and research and training materials, such as chemicals; site maintenance and servicing; travel and utilities. The ANU and UC spent $344 million on inputs in 2012.
Generally these intermediate inputs can be supplied by local and interstate firms. The modelling attempts to measure the contribution using a bespoke input-output table that captures the trade between ACT firms and the rest of Australia.
This expenditure on intermediate inputs contributed $199 million in value added to the ACT economy, consisting of $111 million in additional labour income and $88 million in additional GOS (Table 3.3). The indirect economic activity associated with ACT universities was also estimated to support the employment of 1,124 FTE employees in the ACT.
The indirect economic contribution (value added) of ACT universities to the ACT and the rest of Australia was $288 million in 2012 (Table 3.3). $89 million of value added was contributed to the rest of Australia. Additional to the 1,124 FTE jobs in other sectors in the ACT, there are 796 more FTEs employed in the rest of Australia.
Table 3.3: Indirect contribution of ACT universities (2012)
Contribution to the ACT
($ million)
Contribution to the rest of Australia
($ million)
Total contribution
($ million)
Expenditure on intermediate inputs 344 344
GOS 88 44 132
Wages 111 45 156
Total value added 199 89 288
Total employment (FTEs) 1,124 796 1,920
Source: Deloitte Access Economics.
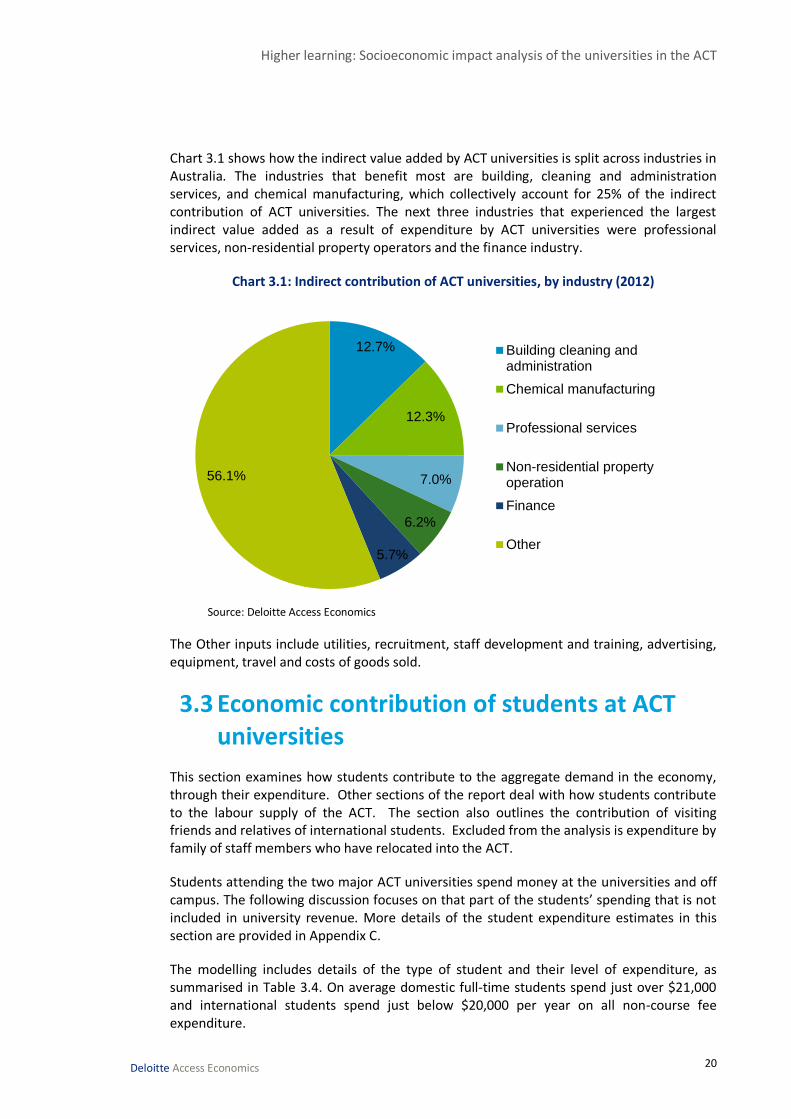
Higher learning: Socioeconomic impact analysis of the universities in the ACT
20 Deloitte Access Economics
Chart 3.1 shows how the indirect value added by ACT universities is split across industries in Australia. The industries that benefit most are building, cleaning and administration services, and chemical manufacturing, which collectively account for 25% of the indirect contribution of ACT universities. The next three industries that experienced the largest indirect value added as a result of expenditure by ACT universities were professional services, non-residential property operators and the finance industry.
Chart 3.1: Indirect contribution of ACT universities, by industry (2012)
Source: Deloitte Access Economics
The Other inputs include utilities, recruitment, staff development and training, advertising, equipment, travel and costs of goods sold.
3.3 Economic contribution of students at ACT universities
This section examines how students contribute to the aggregate demand in the economy, through their expenditure. Other sections of the report deal with how students contribute to the labour supply of the ACT. The section also outlines the contribution of visiting friends and relatives of international students. Excluded from the analysis is expenditure by family of staff members who have relocated into the ACT.
Students attending the two major ACT universities spend money at the universities and off campus. The following discussion focuses on that part of the students’ spending that is not included in university revenue. More details of the student expenditure estimates in this section are provided in Appendix C.
The modelling includes details of the type of student and their level of expenditure, as summarised in Table 3.4. On average domestic full-time students spend just over $21,000 and international students spend just below $20,000 per year on all non-course fee expenditure.
12.7%
12.3%
7.0%
6.2%
5.7%
56.1%
Building cleaning andadministration
Chemical manufacturing
Professional services
Non-residential propertyoperation
Finance
Other

Higher learning: Socioeconomic impact analysis of the universities in the ACT
21 Deloitte Access Economics
Table 3.4: Total student expenditure (2012)
Student type Non-course fee spending per student ($)
Number of students
Total spending ($m)
Domestic Full-Time 21,059 16,171 341
Domestic Part-Time 39,989 11,978 479
International 19,593 10,192 200
Total 38,341 1,019
Source: ANU, UC, Universities Australia 2013, Deloitte Access Economics
In total, ACT university students are estimated to have spent $1,019 million in 2012. Students spend $60 million at the universities on non-course fee costs, including fines; these are excluded from the student contribution because it is included in the university contribution analysis above. In addition, $19 million is spent outside the Territory and excluded here. The starting point for estimating the annual student expenditure contribution to the ACT economy is $940 million.9
3.3.1 All students
Spending by all types of university students makes an economic contribution to the ACT economy of close to $1 billion per year.10 Total student expenditure is estimated by combining data on enrolments provided by ANU and UC with information from Universities Australia about student expenditure.
Some student expenses also are revenue for the universities, including university tuition fees of $269 million, $48 million in accommodation revenue received by the two ACT universities, and an estimated $12 million in study expenses consisting of other university fees, union and sports fees and other study related items which are likely to be purchased on university campuses. After excluding this overlapping revenue to avoid double counting, expenditure of students studying at the two ACT universities is estimated to have totalled $940 million in 2012. The main items of estimated student expenditure are shown in Table 3.5.
9 Part-time students tend to spend nearly twice as much as full-time students given they are more likely to be working and, hence, have more disposable income.
10 Domestic undergraduates, domestic postgraduate coursework students, domestic postgraduate research students, international undergraduate students, international postgraduate coursework students and international postgraduate research students

Higher learning: Socioeconomic impact analysis of the universities in the ACT
22 Deloitte Access Economics
Table 3.5: Student expenditure in the ACT (2012)
Expenditure item $ million
Mortgage/rent 270 Food and house supplies 190
Utilities 48
Medical and health costs 28
Transport costs 88
Personal costs 102
Credit/loan repayments 43
Childcare etc 18
Child support 3
Other expenses 24
Textbooks 18
Stationary 11
PC/laptop purchase 17
Other computer costs 16
Credit/loan (for study) 16
Transport to/from university 36
Other repayments 10
Total 940
Source: Universities Australia 2013, Deloitte Access Economics
In addition to the money spent by students in the ACT, $19 million in student expenditure is estimated to occur outside the ACT. Information from the universities indicated that 4.9% of domestic students and 0.3% of international students resided outside the ACT.11
Given total student expenditure in the ACT of $940 million, this leads to a direct contribution of $570 million in value added, where this value added comes from the gross operating surplus associated with this expenditure, and the wages paid. This student expenditure also supports 4,207 FTEs (Table 3.6).
Table 3.6: Direct contribution of student expenditure (2012)
$ million
GOS 342
Labour Income 228
Total value added 570
Total employment (FTEs) 4,207
Source: Deloitte Access Economics.
In addition to the direct economic contribution, student expenditure also contributes to economic activity indirectly as demand for goods and services by students in the ACT
11 This expenditure is estimated by multiplying the proportion of domestic and international students living outside the ACT by the amount of student expenditure estimated to occur at home. The amount of student expenditure at home is assumed to include mortgage or rent payments, utility payments and half of food and house supplies.

Higher learning: Socioeconomic impact analysis of the universities in the ACT
23 Deloitte Access Economics
contributes to an increase in economic activity along the supply chain. Table 3.7 shows the indirect economic contribution of student expenditure in the ACT in 2012.
Student expenditure is estimated to contribute indirectly $140 million in value added to the ACT and support 762 FTE jobs. In Australia as a whole, it is estimated to support $291 million in value added and 2,699 FTE jobs. The indirect employment impact is larger for Australia than for the ACT because much of the labour that is indirectly associated with student spending (e.g. manufacturing) is located outside the ACT. Note that the employment indirectly associated with student spending in the ACT has relatively higher-paying jobs than for the rest of Australia (as indicated by the ratio of labour income to FTEs).
Data are not available to estimate what spending may have occurred, in the absence of the ACT universities. However, it is possible to estimate the economic contribution to the ACT made by students from interstate and overseas, and this contribution can reasonably be regarded as wholly additional. The expenditure of the latter students can be thought of as a component of the ‘education exports’ provided by the ACT, as the expenditure of these students would not normally occur within the ACT but for the existence of its universities.
Table 3.7: Indirect contribution of student expenditure (2012)
Contribution to the ACT
Contribution to the rest of Australia
Total contribution
GOS ($m) 78 72 150
Labour Income ($m) 62 80 142
Total value added ($m) 140 151 291
Total employment (FTEs) 762 1,937 2,699
Source: Deloitte Access Economics.
3.3.2 Students from outside the ACT
By attracting students from interstate and overseas, the ACT is an exporter of education services. About half of the economic contribution of student expenditure noted in Section 3.3.1 is derived from students who have moved to the ACT to undertake university study.
Information from both universities indicated that 37.5% of domestic students living in the ACT previously lived outside the ACT (or neighbouring regions of NSW). Assuming that all international students previously lived outside the ACT, the total expenditure of students from outside the ACT region was estimated to be $463 million. Some $286 million of this is attributed to interstate students and $178 million to international students.
The total economic contribution of the roughly 10,500 interstate and 10,000 international students was $351 million and 2,450 FTE jobs (Table 3.8).

Higher learning: Socioeconomic impact analysis of the universities in the ACT
24 Deloitte Access Economics
Table 3.8: Contribution of students from outside the ACT (2012).
Interstate students
International students
Total of interstate and international students
Expenditure ($ million) 286 178 463
Value added ($ million)
Direct 173 108 281
Indirect 43 27 69
Total 216 134 351
Employment (FTE)
Direct 1,279 795 2,074
Indirect 232 144 376
Total 1,511 939 2,450 Source: Deloitte Access Economics.
3.4 Visitor expenditure
Students studying in the ACT from overseas may be visited by friends and relatives from their country of origin. The tourism expenditure associated with these visits contributes to additional economic activity within the ACT.
In the year to September 2012, 39,727 visitor nights were attributed to overseas visitors coming to the ACT to visit international students.12 The average expenditure per night for visitors to the ACT was $78. This indicates that total expenditure in the ACT by visitors to international students in 2012 was around $3.1 million.
Visiting friends and relatives are estimated to contribute $1.8 million directly in value added to the ACT and another $0.5 million indirectly, and support 27 FTE jobs in the ACT (23 directly, 4 indirectly), as shown in Table 3.9 below.
The expenditure of other visitors to the Universities has not been included and therefore this underestimated the total value of visitor expenditure. Other visitors to the Universities include international delegations, heads of diplomatic missions, Nobel laureates and other internationally recognised thought leaders. The Universities also host well attended conferences, forums and seminars that attract visitor nationally and internationally.
3.5 Total economic contribution of major ACT universities and students
For this report, the economic contribution of the universities to the ACT economy is defined as follows:
the total contribution comprising:
12
Tourism Research Australia International Visitor Survey (2013)

Higher learning: Socioeconomic impact analysis of the universities in the ACT
25 Deloitte Access Economics
• universities operations, which are summarised in the institutions’ financial statements; and
• spending by students
• and their visitors (e.g. family and friends travelling to the ACT from interstate) not captured in the universities’ income statements;
the additional contribution to the economy, which subtracts spending by students from the ACT that may have occurred even if they did not attend university; and
• alternatively, these individuals may have studied (and spent) interstate, hence the additional contribution effectively represents a lower bound.
the flow-on effects of university and student (and their visitors) activity to other sectors of the ACT economy.
3.5.1 Total contribution
This section presents estimates of the total contribution of the major universities to the economy, including the flow-on effects to other sectors of the economy.
Overall, the university sector was estimated to contribute $1.7 billion in value added to the ACT economy and $1.9 billion to the Australian economy as a whole (Table 3.9 and Table 3.10). Every dollar of expenditure related to the ACT University-related sector is associated with 80 cents of value added. The universities also are estimated to support just over 11,500 FTE jobs in the ACT and almost 14,300 FTE jobs in Australia as a whole.
Based on DAE’s regional ACT IO table the aggregate level of value added associated with the major universities that remains in the ACT compared to other industries is relatively high: Public administration has an ACT total value added multiplier of 0.72; the Accommodation industry multiplier is 0.63; and the Food and Beverage industry multiplier is 0.62.
Table 3.9: Total economic contribution of ACT universities to the ACT (2012)
Universities Students Visitors Total
Value added ($ million)
Direct 792 570 1.8 1,364
Indirect 199 140 0.5 340
Total 991 711 2.3 1,704
Employment (FTE)
Direct 5,424 4,207 23.4 9,655
Indirect 1,124 762 3.6 1,890
Total 6,548 4,969 27.0 11,544 Source: Deloitte Access Economics.
These results are in keeping with an education sector that uses significant direct resources (labour and capital) and uses comparatively less indirect resources, or outputs from other sectors. The ACT economy has a relatively small industrial base and relies on other regions of Australia for many of its consumer and commercial inputs. Much of the value added by

Higher learning: Socioeconomic impact analysis of the universities in the ACT
26 Deloitte Access Economics
the sector remains in the ACT; the sector draws a relatively small amount from outside the ACT.
The total economic contribution of the University sector in the ACT to the Australian economy is outlined in Table 3.10. This summary captures, notably, flow-on or indirect contributions from expenditure associated with the universities that takes place outside the ACT – for example, imports of chemical supplies or accommodation costs of academics attending conferences interstate.
Table 3.10: Total economic contribution of ACT universities to Australia (2012)
Universities Students Visitors Total
Value added ($ million)
Direct 792 570 1.8 1,364
Indirect 288 291 1.1 580
Total 1,080 862 2.9 1,944
Employment(FTE)
Direct 5,424 4,207 23 9,655
Indirect 1,920 2,699 13 4,632
Total 7,344 6,906 36 14,286
Source: Deloitte Access Economics.
3.5.2 Additional contribution
This section presents estimates of the additional contribution of the major universities to the economy, including the flow-on effects to other sectors of the economy. The estimates exclude the contribution of students who resided in the ACT before commencing university. If these individuals remained in the ACT, but did not attend university, their spending should not be included in estimates of the universities’ economic contribution.
Table 3.11 shows that the additional contribution (i.e. excluding students from the ACT) exceeded over $1.3 billion and generated around 9,000 FTEs. A little over $1 billion of this contribution is direct and $270 million is indirect.
Table 3.11: Additional economic contribution of ACT universities to the ACT (2012)
Universities Students Visitors Total
Value added ($ million)
Direct 792 281 1.8 1,075
Indirect 199 69 0.5 269
Total 991 351 2.3 1,344
Employment(FTE)
Direct 5,424 2,074 23 7,521
Indirect 1,124 376 4 1,504
Total 6,548 2,450 27 9,025
Source: Deloitte Access Economics.

Higher learning: Socioeconomic impact analysis of the universities in the ACT
27 Deloitte Access Economics
The contribution in Table 3.11 does not include the contribution of those students who are originally from the ACT, as their spending is assumed to have taken place, and can be thought of as addition contribution. It is likely this contribution is even greater as many of these students may have actually left the ACT if it wasn’t for the presence of the universities, we have provide the lower bound by assuming all local student expenditure would have been in the economy even without the universities.
3.6 Comparison with other industries in the ACT
The ACT university sector makes a sizeable contribution to the ACT economy. Table 3.12 compares the direct economic contribution of the major ACT universities to that of the seven largest industries in the ACT. As universities are not designated a separate sector by the ABS, in practice their value added would be included in the contribution of other categories such as education, health care, ownership of dwellings. Also, values associated for ACT universities are measured in 2012 calendar year, while other industry figures are 2012/2013 financial year.
The direct value added associated with the ACT universities in 2012 (including university operations, student spending and visitor spending) made up around 4.5% of the $30 billion of ACT industry valued added or 3.9% of the $35 billion total ACT Economy. The contribution of the universities’ operations alone account for 2.6% of the Industry valued added.
Employment associated with the ACT universities in 2012 (including university operations, student spending and visitor spending) made up 5.9% of ACT employment, university operations providing 3.8% of jobs.
Table 3.12: Industry value added in the ACT (2012-13)
Industry Value added ($m) Share of total ACT Value Added
Public administration and safety 10,183 33.9%
Construction 3,308 11.0%
Professional services 3,350 11.2%
Education (all sectors) # 2,320 7.7%
Health care 2,019 6.7%
ACT universities * 1,364 4.5%
Financial and insurance services 1,313 4.4%
Utilities (electricity, gas, water and waste services)
958 3.2%
Source: ABS 2014, 'Australian National Accounts: State Accounts, 2012-13' - Current Prices, Deloitte Access Economics. # Education (all sectors) includes the operations revenue associated with the ACT universities.
* ACT University-related sector direct contribution is measured in 2012 calendar year.
Higher learning: Socioeconomic impact analysis of the universities in the ACT
28 Deloitte Access Economics
Non-ACT domestic students’ expenditure in the ACT, including on food, housing and entertainment, benefits the ACT economy as this is generates economic activity that would otherwise not have occurred. In 2012, 37% of domestic undergraduate students at ANU came from outside the Canberra Region. In this sense, interstate student expenditure is a form of exports from the ACT economy. This is important, as the activity generated by the main industries in the region do not generally include gains from trade with other states.

Higher learning: Socioeconomic impact analysis of the universities in the ACT
29 Deloitte Access Economics
4 Economic impact of expanding university capacity in the ACT
This chapter illustrates how the contribution of the university sector may change as the business and operational focus of the universities change and expand. Universities are evolving from the core operations of education into business, innovation, social and sporting hubs. This has been driven by business and community demands, and the commercial funding realities.
4.1 Potential expansion of ACT universities
Going forward, both universities are exploring various opportunities to expand their core operations and to diversify revenue generation. These include attracting additional international student to the ACT and growing the infrastructure on the main campuses.
4.1.1 At University of Canberra
The University of Canberra is currently in the process of developing the Bruce Campus to attract sporting teams, medical/health facilities and accommodation to boost revenue and activity on the site. This includes the new Sports Hub that has attracted the administration, training and medical operations of the ACT Brumbies to Bruce.
On the accommodation front, the University and third party investors have invested in Weeden and Cooper Lodges and The Village. The Weeden and Cooper Lodges are large-scale developments with over 400 beds each, where The Village includes smaller buildings of apartments and townhouses.
These developments have allowed the University to offer an accommodation guarantee to international students and first-year domestic students. In addition, the developments have provided students with a diverse range of accommodation to choose from.
The University of Canberra has also provided space on the campus for enhanced medical services. The GP Super Clinic was opened in February 2014 operated by Ochre Health. The new development also includes space for a student-led clinic, optical and other ancillary health services and commercial space. More detail on this development is outlined below in the modelling section.
4.1.2 At Australian National University
In recent times ANU, through ANUExchange, has undertaken a significant redevelopment of “The Rocks” district on the eastern fringe of the city. The redevelopment of Childers Street was conducted in partnership with private investors and includes student accommodation, faculty buildings, commercial and cultural spaces, and retail and restaurants.

Higher learning: Socioeconomic impact analysis of the universities in the ACT
30 Deloitte Access Economics
In addition to this, the ANU also has plans to increase the share of international students at the university. As outlined in the modelling below increasing the number of students has the impact of increasing expenditure, output and employment in the Territory over the next 10 years.
4.2 University expansion scenarios
This section illustrates the impact specific developments could have on the ACT economy. The two scenarios were selected in consultation with the two universities in keeping with the broader strategies. These impacts include:
higher numbers of international student at the ANU; and
infrastructure development at UC.
To model the economic impacts we have used our in-house General Equilibrium Model (DAE-RGEM), for which more detail can be found in Appendix E. The model has been customised for this analysis to incorporate two distinct Australian modelling regions, the ACT and the Rest of Australia.
4.2.1 Scenario 1 - an increase in international students
The ANU aims to increase its international student cohort in the coming years. The objective is to increase the current international share of undergraduate students from 21% to 28%, and the current international share of postgraduate students from 43% to 49%, both by 2017. After 2017 the shares of international undergraduate and postgraduate students are modelled to remain at 28% and 49% respectively. Over the whole modelling period domestic students are assumed to grow at historical rates. The increase of international students in the ACT has the effect of increasing expenditure and aggregate demand in the Territory.
Under the baseline growth assumptions the number of international students is modelled to grow from about 6,600 in 2014, to 7,200 in 2017 and to almost 9,000 in 2024. Under the policy scenario, the new international students is modelled to grow from 6,600 in 2014 to about 9,600 in 2017 and just over 11,800 in 2024.
Chart 4.1 illustrates the additional international students above the baseline projections.

Higher learning: Socioeconomic impact analysis of the universities in the ACT
31 Deloitte Access Economics
Chart 4.1: International student numbers, scenario analysis
Source: Deloitte Access Economics estimates
The modelling scenario does not include any capital expenditure that may be required to accommodate these additional students - the simulation is intended to capture the expenditure of additional international students only. This approach was taken because of the uncertain net additional capital required (or any crowding out of existing housing) to meet demand. We also note the current high vacancy rates in Canberra suggest significant additional construction may not be required to accommodate the anticipated increase in international students, particularly in the early years.
Any associated capital works – e.g. construction of additional accommodation – associated with the increased international student intake would have an additional impact on the economy. Given this, the results below can be seen as conservative.
4.2.1.1 Results
The expenditure (comprising education fees and student spending) associated with each additional student is estimated to be $35,078. The per-student figure is consistent with the information used in the contribution analysis in Chapter 3.
The ANU’s strategy would result in additional student spending of $23 million in the first year growing to over $101 million by 2024. Over the modelling period 2015 to 2024 total student expenditure is modelled to increase by $542.5 million in net present value terms, adding to the ACT economies aggregate demand
-
2,000
4,000
6,000
8,000
10,000
12,000
14,000
2014 2015 2016 2017 2018 2019 2020 2021 2022 2023 2024
Policy
Baseline

Higher learning: Socioeconomic impact analysis of the universities in the ACT
32 Deloitte Access Economics
Increases in the number of international students are projected to have a significant positive impact on the ACT economy (Table 4.1). GTP is modelled to increase by $267 million (in NPV terms) over the same period.
In the first year the additional student expenditure is modelled to increase GTP by $23 million over the reference case. By the end of the modelling period, in the year 2024, GTP is modelled to be $49 million above the reference case.
Based on the information in Table 4.1 it can be inferred that each additional dollar of expenditure associated with additional international students is associated with about 50 cents of extra value added in the ACT economy.
Table 4.1: Economic impact of increased ANU international students
NPV 2015 2017 2024
Expenditure ($m) 542.5 23.0 83.6 101.7
GRP ($m)
ACT (GTP) 267.2 11.6 41.2 49.1
Australia (GDP) 271.6 12.5 43.5 47.3
Source: Deloitte Access Economics estimates All values are in 2013 dollars, and the real discount rate used is 7%.
Increases in the number of international students will place upward pressure on factors of production, including labour. There will be an initial spike in the level of employment in 2015, with 63 additional FTE jobs increasing to about 210 in 2017. This is due to the relatively large and swift number of additional students anticipated as part of the ANU’s marketing program.
Because of the ACT’s relatively tight labour market, even slight increases in employment in the ACT (in the range of 63 to 210 over the sample period) are associated with marginal increases in wages of between 0.17% in 2017 to 0.14% by 2024 above the reference case.

Higher learning: Socioeconomic impact analysis of the universities in the ACT
33 Deloitte Access Economics
Chart 4.2: Impact on employment and wages of additional international students
Source: Deloitte Access Economics estimates
4.2.2 Scenario 2 – Expanding university infrastructure
The University of Canberra is undertaking a number of infrastructure developments at the Bruce Campus, including the Health Hub, the Sporting Commons and a number of accommodation sites. This section outlines the economic impact of the Health Hub. The Health Hub opened its doors in February 2014 and includes 3,400 square metres of health services and other commercial activity. More specifically the Hub includes:
Level 1: Health ancillary services including imaging, hearing, chemist and a café
Level 2: OCHRE Health GP Super Clinic
Level 3: Student-led clinics
Level 4: Commercial space.
4.2.2.1 Measuring the impacts
The modelling takes into account the two phases of the development, the capital intensive construction activity and the operational phase. The capital expenditure totalled $15.8 million (in 2012 dollars) over the period 2012 – 2013.
The operational phase was accounted for in the CGE modelling by an increase in revenue for tenants of the building. There are a number of steps taken to measure the additional increase in output in the economy. These steps are outlined below:
1. Take the rentable space by type of commercial activity 2. Estimate the number of workers (measured in FTE) 3. Estimate the level of revenue per worker 4. Model the additional revenue generated in the region
-
50
100
150
200
250
-
0.02
0.04
0.06
0.08
0.10
0.12
0.14
0.16
0.18
0.20
2015 2016 2017 2018 2019 2020 2021 2022 2023 2024
FTE% Wage increase
FTE
Wages

Higher learning: Socioeconomic impact analysis of the universities in the ACT
34 Deloitte Access Economics
To understand the proportion of each business in the Health Hub activity that can be treated as an impact to the ACT economy, the additionality of the economic activity on each site needs to be assessed.
In other words, this is the amount of activity that would not have occurred elsewhere in the ACT in the absence of the capacity provided by the Health Hub. As the Health Hub is in the early stages of operation, it is only possible to determine a stylised level of additionality for the Hub, in some cases estimated indirectly. To model this, a simplifying assumption has been made that 50% of the activity on the site would have been additional and is included in the modelling.
4.2.2.2 Modelling inputs
The increased activity associated with the Health Hub was modelled over the period 2012 -2024. Capital expenditure takes place between 2012 and 2013 with the operational phase starting from 2014 with additional expenditure of $7.6 million per year.
Table 4.2: Capital expenditure and operational output, $million (2012 – 2024) NPV 2012 2013 2014 - 2024
Construction capex 17.7 6.5 9.3
Operational revenue 53.2 7.6
Source: Deloitte Access Economics estimates Note: All values are in 2013 dollars, and the real discount rate used is 7%.
4.2.2.3 Results
The increased activity associated with the Health Hub is projected to have a positive impact on the ACT economy (Table 4.3). By 2024, it is projected that the additional activity will increase the gross state product (GSP) of the ACT by $4.2 million, with a minimal negative impact on the rest of Australia. In 2013 dollars, the present value of the modelled growth for this investment is worth almost $43 million to the ACT economy. Employment impacts are relatively modest, with a peak increase in employment of 27 FTE in 2015.
Table 4.3: Economic impact of capital expenditure scenario
NPV 2012 2013 2015 2020 2024
GSP ($m)
ACT 42.6 2.5 4.2 5.0 4.5 4.2
FTE 10 14 27 25 23
Note: all values are in 2013 dollars, and the real discount rate used is 7%.
Based on the information in Table 4.3 it can be inferred that each additional dollar of expenditure associated with additional international students is associated with 60 cents of extra value added in the ACT economy. The multiplier is slightly higher than the student expenditure scenario outlined above. One important driver for this is that the scenario also incorporates capital expenditure, adding to the productive base of the Territory and potentially reducing crowding out in factor markets.

Higher learning: Socioeconomic impact analysis of the universities in the ACT
35 Deloitte Access Economics
5 Other economic and social dimensions of the universities’ contribution
Individuals and society reap benefits from universities. There is a large body of evidence showing that universities are fundamental to promoting innovation and economic development; encourage better employment outcomes for students and the regions they service; and promote better socio-economic outcomes not only for students but for society more broadly – there are well established relationships between education and wellbeing, in terms of improved health, employment, housing, crime and justice.
This chapter outlines the broader economic and social contributions of the universities in the ACT. The analysis presented in this chapter is based on data provided by the universities and through consultations with key stakeholders. The impact of the activities of the two major universities in the ACT is significantly broader than through educating students alone.
In addition the chapter outlines the contribution the sector makes to advancing ACT Government strategic objectives.
5.1 Alignment with Government strategy
Universities also allow government to meet a range of strategic and planning policy goals. The two major universities in the ACT directly align with the objectives of a number of key Government strategic plans. The activities of the universities’ reinforce many key government priorities.
The ACT government guides the growth and development of Canberra in The Canberra Plan – Towards our Second Century. The report outlined seven key strategic themes reflecting the priorities of the ACT government. Higher education services provided by Universities are an integral part of meeting a number of these strategic themes:
quality health care;
excellent education, quality teaching and skills development;
a strong, dynamic economy;
a vibrant city and great neighbourhoods; and
a sustainable future.
At its most basic level, the purpose of higher education institutions is the development of an informed, educated population of individuals who are able to proceed in careers which are both personally fulfilling but also beneficial to the development of economies. In this sense, the fundamental activities of the universities achieve the ACT government goals of excellent education, quality teaching and skills development and a strong, dynamic economy.

Higher learning: Socioeconomic impact analysis of the universities in the ACT
36 Deloitte Access Economics
Further to The Canberra Plan, the Canberra Social Plan also prioritises education. The Social Plan has aims to position Canberra as the education capital of Australia and highlights Canberra’s importance as an education centre for the region.
ANU is ranked as a top Australian university achieving excellent in both education and teaching provision.
• ANU ranked 37 in the world in the 2012 Times Higher Education’s World University Rankings.
• ANU ranked top Australian university in the 2013 QS World University Rankings and 27th overall.
UC has also achieved excellence in teaching standards.
• UC graduates ranked the University highly in ‘good teaching’ achieving the seventh highest ranking nationally.
ANU initiatives are further contributing to improving education outcomes for the ACT region by establishing Homework centres (Figure 5.1). Further to the impact on education outcomes, these programs strengthen the ties between the university and the community.
Figure 5.1: Case study: Kingsford Smith Homework Centre
The Kingsford Smith Homework Centre includes participants across the ACT education system including:
Kingsford Smith School Students,
Kingsford Smith School Staff, and
ANU staff and students.
While the specific aim of the program was to provide homework support to students, more broadly it was to raise aspirations of disadvantaged students and expose students to higher education.
The program delivers homework support to Kingsford Smith Students who opt into the program. ANU students work with students to help them with their homework and assessments while at the same time raising awareness of the tertiary education.
The results of the program support these aims with 53% of respondents stating that as a result of their participation in the program they were more interested in University education.
Source: ANU
Employment in Canberra has traditionally been centred on the public services and associated industries. ACT government strategies to develop the ACT as a knowledge centre would be enhanced by graduates from the universities continuing to live in the ACT and work in higher education themselves. Indeed following graduation, 9% of graduates from ANU will go on to work in the tertiary education sector.

Higher learning: Socioeconomic impact analysis of the universities in the ACT
37 Deloitte Access Economics
At the same time the universities’ directly promote a sustainable and dynamic ACT economy through the development of initiatives and programs.
As a result of their size relative to the population of the ACT, (41,477 combined students and staff), activities to promote environmental sustainability at the universities go a long way towards achieving the ACT governments objective of a ensuring a sustainable future.
At the same time, programs can be the catalyst for developing relationships with the broader community and skills and knowledge transfer which are wider than the direct activities which take place on campus alone. Indeed, community engagement was identified as a key element of ANU’s environmental program in 2012 (ANU AR 2013). A number of initiatives were aimed at informing, empowering and utilising the knowledge of staff and students towards campus sustainability. Ongoing collaboration between ANU with other local and domestic institutions, through networks such as the Group of Eight and the International Alliance of Research Universities, demonstrates how skills and knowledge transfer can be achieved. The results of which are greater than what the institutions would be able to achieve on their own, benefiting not only the institutions themselves, but in this instance of environmental sustainability the global economy as well (Figure 5.2).

Higher learning: Socioeconomic impact analysis of the universities in the ACT
38 Deloitte Access Economics
Figure 5.2: Case study: ANUgreen
ANU established ANUgreen in 1999 as part of the universities broader Environment Policy.
The program works directly with the University community, educating and empowering staff and students to have a more active role in reducing the environmental impact of their activities.
ANUgreen strives for ANU to be an international leader in campus sustainability and provide ANU graduates with practical knowledge and skills needed to realise a more sustainable society. Targets include:
35 per cent reduction in energy use and greenhouse gas emissions by 2020;
50 per cent reduction in potable water use by 2020 (including removing all potable water use from the landscape by 2015);
70 per cent reduction in waste to landfill by 2020; and
100 per cent off-set of carbon dioxide equivalent load from air travel by 2015;
The program has been recognised for its contribution to the ACT community winning, the ACT Sustainable Cities Awards six times since 2007 and the Australasian Campuses Towards Sustainability Green Gown Awards three times since 2009.
ANUgreen promotes global change by demonstrating leadership and innovation of new policies and projects with the broader community. As a member of several national and global university sustainability networks, ANU is engaged in sharing best-practice knowledge with other leading institutions and collaboration to develop a culture of sustainability across the sector. Source: ANU
The two universities employ and educate a diverse range of staff and students, contributing to the cultural and social development of Canberra and the ACT region and help to create a vibrant city. Further, initiatives undertaken by the universities have the capacity to engage with the wider community, including the business community. By encouraging skills and knowledge transfer between the university, businesses and the community engagement generates a wider social benefit to Canberra. These linkages help to promote the development of a more vibrant city.
5.2 Research and knowledge
The nature of the economic benefits that the application of research would first have is on its own industry, often in terms of a reduction in costs or an increase in the size of the industry.
Universities also undertake a number of activities that don’t have a readily quantifiable market impact. Primarily this situation arises when there is no market for a good or service,

Higher learning: Socioeconomic impact analysis of the universities in the ACT
39 Deloitte Access Economics
or, as is the case for many university activities, there is no direct link between the original good or service (social research for example) and a commercialised outcome.
The principal non-market impacts of the major ACT universities include:
Basic/core research – while this type of research rarely has a commercial market, it provides a significant contribution to society by increasing the stock of human knowledge which may, in the future, realise a commercial gain.
Social research – research into social sciences such as art, philosophy, music and history, is valued by society both for its use (by other researchers) and non-use (by people deriving value from the existence of such research). However, with limited commercial (market) use there is rarely a monetary figure attached to social research.
Valuing the core and social research activities of universities is challenging. The benefits of such activities are uncertain, dispersed among the population, and often only experienced in the long term. The core of human knowledge provides a critical base for further research and it is not possible to have a quantifiable economic or social benefit from every piece of research.13
5.2.1 Research output
Academic employees at the two universities undertake research which aims to answer important questions facing Australian and indeed global society. The outcome of research undertaken by the universities has been applied in real world situations to address key challenges facing the regional and Australian economies.
During 2012, research output from the major ACT universities accounted for around 6.5% of all published research in Australia. ACT researchers produced 11.7% of all the books published by Australian academics during the year and 5.6% of journal articles (Table 5.1).
Table 5.1: Research output (2012)
Provider ANU UC Total Australia ACT share
Books 90.0 13.7 884.5 11.7%
Book chapters 453.7 52.5 6,087.0 8.3%
Conference papers 448.7 148.8 9,423.7 6.3%
Journal articles 2,057.6 265.1 41,187.4 5.6%
Total (weighted) 3,409.9 534.8 61,120.7 6.5%
Source: Department of Education, Higher Education Research Data Collection, 2013.14
13 Studies of spillover effects of R&D struggle to provide robust results, reflecting the complex causal pathways through which R&D affects productivity growth; i.e. the potentially long lags from the conduct of the R&D to the ultimate benefit and difficulties in controlling for the other factors that also influence productivity.
14 Research output is weighted according to the number of authors involved in a publication. In this way, publications are individually attributed to individuals and universities. For example, a Journal Article with one author from UNSW and one from UC will have 0.5 attributed to each author and university.

Higher learning: Socioeconomic impact analysis of the universities in the ACT
40 Deloitte Access Economics
5.2.2 Research at ANU
Research at ANU encompasses fundamental basic research through to applied and consultancy-based research. Research output by the university increased between 2010 and 2012.
ANU is well known as a centre for research excellence. The 2012 Excellence in Research Australia (ERA) noted that of specific fields of research, ANU had the highest proportion of research above world standard of any Australian institution (84%).15 ERA ranked ANU research well above world standard across all disciplines, including; biological and environmental sciences, economics, studies in human society, philosophy and law.
ANU researchers were the recipients of a number of awards and prizes demonstrating the capacity of staff at the university to contribute to Australian society in a meaningful way. During 2012 ANU was the recipient of four of the 17 Australian Laureate Fellowships awarded by the Australian Research Council (ARC), the most for any Australian university. Other awards received by the ANU include:
24 Discovery Early Career Researcher Awards – this is the highest success rate of the Group of Eight universities;
16 Future Fellowships aimed at mid-career researchers;
three Discovery Outstanding Researcher Awards; and
five fellowships in the 2012 National Health and Medical Research Council funding round.
A larger share of ANU students are post-graduate students compared to the national average; in 2012; 47% of ANU students enrolled at graduate level compared to the national average of 26%.
5.2.3 Research at UC
Research undertaken at the University of Canberra primarily is focussed on addressing practical challenges facing Australian society. The output of the research aims to have high impact outcomes for the local ACT community, as well as the broader Australian society. There are five primary areas of research undertaken at UC: governance, environment, communication, health and education.
Research output from UC has increased considerably over recent years, reflecting the commitment by the university to focus on producing high quality research output. Between 2009 and 2011, output of research publications increased by 75.5%. During 2012, UC provided over 500 items for the Department of Industry, Innovation, Climate Change, Science, Research and Tertiary Education for the annual Higher Education Research Data Collection (Table 5.1).
Research income generated by the university increased from $11.6 million in 2009 to $17.1 million in 2011. More recently, the number of research students has also increased considerably, rising from 377 in 2010 to 535 in 2012.
15
Excellence in Research for Australia (2012)
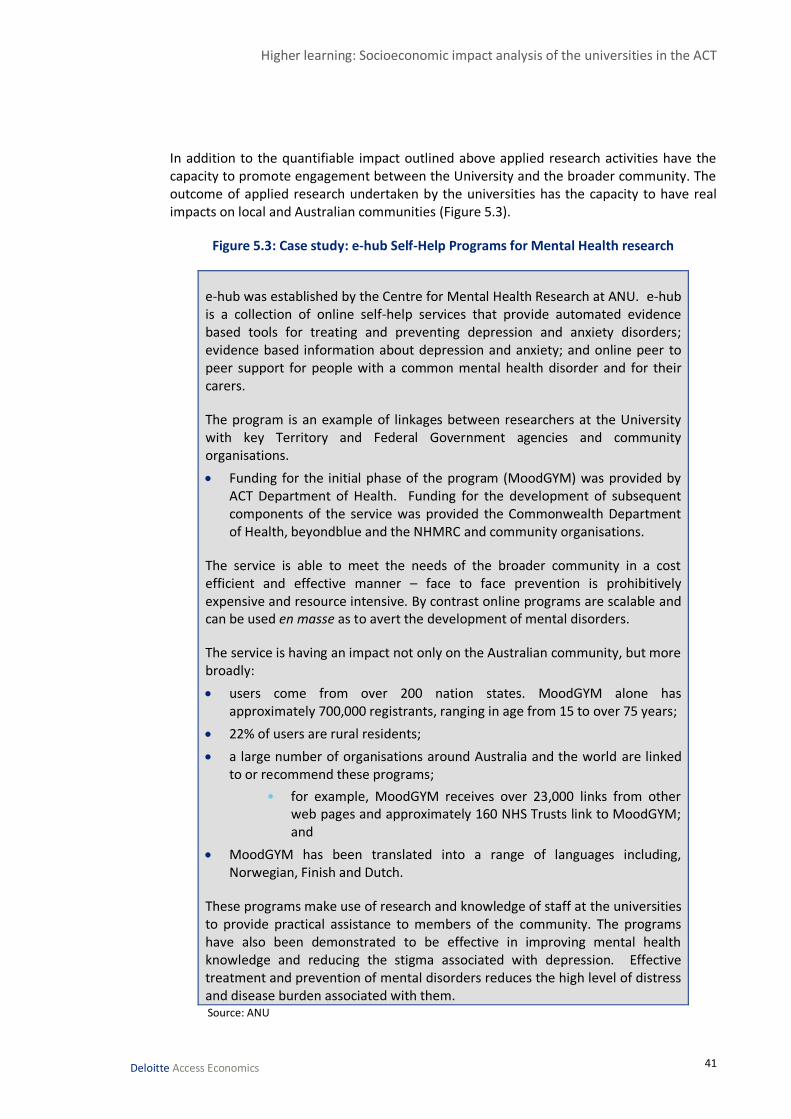
Higher learning: Socioeconomic impact analysis of the universities in the ACT
41 Deloitte Access Economics
In addition to the quantifiable impact outlined above applied research activities have the capacity to promote engagement between the University and the broader community. The outcome of applied research undertaken by the universities has the capacity to have real impacts on local and Australian communities (Figure 5.3).
Figure 5.3: Case study: e-hub Self-Help Programs for Mental Health research
e-hub was established by the Centre for Mental Health Research at ANU. e-hub is a collection of online self-help services that provide automated evidence based tools for treating and preventing depression and anxiety disorders; evidence based information about depression and anxiety; and online peer to peer support for people with a common mental health disorder and for their carers.
The program is an example of linkages between researchers at the University with key Territory and Federal Government agencies and community organisations.
Funding for the initial phase of the program (MoodGYM) was provided by ACT Department of Health. Funding for the development of subsequent components of the service was provided the Commonwealth Department of Health, beyondblue and the NHMRC and community organisations.
The service is able to meet the needs of the broader community in a cost efficient and effective manner – face to face prevention is prohibitively expensive and resource intensive. By contrast online programs are scalable and can be used en masse as to avert the development of mental disorders.
The service is having an impact not only on the Australian community, but more broadly:
users come from over 200 nation states. MoodGYM alone has approximately 700,000 registrants, ranging in age from 15 to over 75 years;
22% of users are rural residents;
a large number of organisations around Australia and the world are linked to or recommend these programs;
• for example, MoodGYM receives over 23,000 links from other web pages and approximately 160 NHS Trusts link to MoodGYM; and
MoodGYM has been translated into a range of languages including, Norwegian, Finish and Dutch.
These programs make use of research and knowledge of staff at the universities to provide practical assistance to members of the community. The programs have also been demonstrated to be effective in improving mental health knowledge and reducing the stigma associated with depression. Effective treatment and prevention of mental disorders reduces the high level of distress and disease burden associated with them. Source: ANU

Higher learning: Socioeconomic impact analysis of the universities in the ACT
42 Deloitte Access Economics
The following section outlines the social contribution the higher education sector has on the regional economy, not captured within the economic contribution. In addition to student expenditure and labour supply in regions surrounding the ACT, the universities have an important role to play in regional development, generating economic activity, and responding to structural change. Providing access to, and promoting education attainment of rural, regional and remote students is core to this regional economic role.
5.3 Social and business contribution
5.3.1 Generating interest in higher education
Figure 5.4: Case study: Australian Regional Partnerships Program
The Australian Regional Partnerships Program (ARRP) commenced as a pilot program across 15 regional schools in NSW in 2009. During 2012 the program was administered to more than 7,000 regional school students from 15 schools in regional NSW (in the vicinity of the ACT).
The program promotes higher education in regional areas. The goals of the program were twofold:
Firstly, to counter the perceptions to residents in those areas that university is not relevant or accessible;
And secondly to improve regional economic education outcomes.
The ARRP has had a noticeable impact on regional students. Indeed 90% of the teachers in targeted schools believe that the program has impacted their students’ aspirations and led to an increase in regional student participation in higher education. Source: ANU
In addition, they are large employers, provide local services (such as cultural events) and, particularly for small regions, can be an important source of local infrastructure (such as swimming pools, libraries, museums and tennis courts).
5.3.2 Business linkages
The universities establish and maintain relationships with a range of businesses. They also maintain relationships with key institutions, locally, nationally and globally. These alliances and partnerships promote the linkages between the university and other institutions which benefit the local community and Australia:
national; including National Alliances; Group of Eight; Universities Australia;
international; including International Alliance of Research Universities; Association of Pacific Rim Universities; Student Exchange Partners; and
government, industry and not-for-profits; including Australian National Institute for Public Policy and Innovation ANU.

Higher learning: Socioeconomic impact analysis of the universities in the ACT
43 Deloitte Access Economics
These relationships have had demonstrated benefits across a broad range of areas which are important to the Australian community including policy development and applied research (Figure 5.5 and Figure 5.6).
Figure 5.5: Case study: Innovation ANU
Innovation ANU brings together ideas, research, government, and business to create value in the community. Innovation ANU aims to:
support and enable transfer of ANU knowledge and expertise for benefits to businesses, government and the wider community;
develop and grow an innovative culture across ANU and the local innovation system;
build enduring and mutually beneficial relationships through collaboration and partnerships; and
integrate innovation activities across campus and develop supporting skills, processes and rewards.
For example ANU researchers together with a Australian-US company and in partnerships with CSIRO, the University of New South Wales and NEP Solar, to develop cutting edge solar energy innovation. The group has improved the market acceptance of hybrid solar-thermal systems and improved the amount of useful energy that can be obtained promoting long term environmental sustainability. At the same time economic efficiency is encouraged by this system facilitating the use of more efficient, low-profile, light and easy to install systems Source: ANU
Figure 5.6: Case study: University of Canberra Public Hospitals Project
The ACT Government announced in 2012 that it will build the University of Canberra Public Hospital on the northwest corner of the campus. The hospital will be a sub-acute facility which will significantly increase capacity within the ACT health system. Students, clinicians and researchers will play an integral role in the services the hospital delivers to the ACT community. This partnership will improve health services to Canberra and the region. It will improve education and research, and make Canberra a more attractive education destination and ultimately boost our local economy.
At the same time the UC is committed to promoting better health outcomes for the ACT community by establishing the university as ‘health precinct’ in the region. UC is partnering with Ochre Health to establish a GP Super Clinic on campus, which will be accessible to the community. Beyond the immediate health impacts, this facility will further benefit the community in terms of greater health education, research and jobs Source: UC annual report (2012)

Higher learning: Socioeconomic impact analysis of the universities in the ACT
44 Deloitte Access Economics
5.3.3 Responding to structural change
Structural change taking place in the economy means that employment in Australia is increasingly shifting away from traditional areas of employment, such as manufacturing, toward faster-growth knowledge industries. The level of skill and knowledge required to undertake work in these professions means that individuals with university qualifications will be in strong demand. Universities play a key role graduating students which have skills in sectors where employment growth will take place in the future.
The services share of output of the Australian economy has been rising rapidly, and this is likely to continue (Chart 5.1). Goods production (e.g. manufacturing) has become and will continue to be less important relative to service sectors, such as finance and insurance, health care and social assistance, education and professional, scientific and technical services. These high-skill service industries are critical to the economy and the ACT universities will play an important role in providing the highly qualified workforce these industries require.
Chart 5.1: Projected output shares for the Australian economy, by industry
Source: Deloitte Access Economics
Universities will have a critical role in helping regions respond to the changes taking place. Education is fundamental to responding to structural change in an efficient and least disruptive way, by providing workers with the necessary skills to make the transition to new jobs. Students at the two major universities of the ACT are enrolled in areas of study that feed into the industries which are important to the ACT economy; creating an adaptable, innovative, agile workforce.
The ANU Graduate Destination Survey indicates that a majority (more than 60% of post graduate and higher degree, and slightly less than half of all undergraduates) full-time employed ANU domestic graduates work in public or government organisations. The top five industries, representing 67% of all employed graduates, employing ANU graduates in 2012 include:
0%
20%
40%
60%
80%
100%
1984 1987 1990 1993 1996 1999 2002 2005 2008 2011 2014 2017 2020 2023
Agriculture Mining sector output Manufacturing output Utilities output Services

Higher learning: Socioeconomic impact analysis of the universities in the ACT
45 Deloitte Access Economics
public administration (29%);
professional, scientific and technical services (except computer system design and related services) (23%);
tertiary education (9%);
defence (3%); and
hospitals (3%).
Graduates of ANU are most likely to be working in public administration and professional scientific and technical services; more than half of all graduates from ANU work within these two industries. Domestic students, in particular, are most likely to be working in public administration and professional, scientific and technical professions.
Table 5.2: FTE industries for ANU graduates (2012)
Domestic (%) International (%)
Public Administration 31 15 Professional, Scientific and Technical Services 23 22 Tertiary Education 8 15 Defence 4 0 Hospitals 4 2 Public Order, Safety and Regulatory Services 3 2 Unknown 3 3 Personal and Other Services 3 3 Computer System Design and Related Services 2 2 Preschool and School Education 2 0 Auxiliary Finance and Insurance Services 0 5 Insurance and Superannuation Funds 0 2 Medical and Other Health Care Services 0 2
Source: 2012 Graduate Destination Report for ANU
Chart 2.2 demonstrated that education and training is one of the major industries in the ACT and at the same time education is fundamental for workers in the two largest local industries. The graduates from universities in the ACT are already, and will continue to, be important workers in these sectors.
5.4 Other links with the community
The two universities are an integral part of the ACT community. The students attending the universities’ fundamentally contribute to the cultural and social diversity of the region. Further to the education services the universities provide the students with a range of other services, including accommodation and personal support.
5.4.1 University facilities
The location and facilities provided on the campuses of the university are a fundamental aspect of university life for students, staff and the local community. The campuses of the university are both located within the Inner Canberra region of the ACT. The campus provided numerous benefits to the local and broader ACT communities.

Higher learning: Socioeconomic impact analysis of the universities in the ACT
46 Deloitte Access Economics
Universities play an important role in their local communities – they are large employers, provide many local services (such as museums, concerts and recitals, and sports clubs) and, can be an important source of local infrastructure, such as providing sporting facilities, libraries, museums and cafes and restaurants.
The universities maintain relationships with the community across a broad range of areas, including sporting, music and the arts. Partly, this relationship is developed through encouraging members of the community to use facilities maintained by the universities.
Given the breadth of knowledge and skills contained within the workforce at the two major universities in the ACT, they are in a position to enter into a range of partnerships with other institutions including governments and community organisations. The development of facilities for university and public use by both universities demonstrate the flexibility of the institutions to respond to challenges in a range of industries, including health, sporting (Figure 5.7) and environmental.
Figure 5.7: Case study: Sporting Commons Project
In 2012, UC, the Brumbies and the ACT Government agreed to establish a sports hub on the UC campus. It is intended that this will provide access to facilities for professional and community sports teams, students, teachers and researchers. Further developing the relationship between the university and elite ACT sporting teams, the Brumbies have also agreed to relocate their headquarters to the UC campus.
Developing and maintaining relationships with high profile organisations builds the profile of UC within the ACT community. These relationships encourage transfer of skills and knowledge between employee of the Brumbies with staff and students of the university. Source: UC annual report (2012)
Recently, activities by the ANU at the City West Precinct adjacent to the Canberra CBD have aimed to create of a vibrant new area. This area has a mix of university and student activities in the arts, science and education as well as significant new residential and community facilities (Figure 5.8).

Higher learning: Socioeconomic impact analysis of the universities in the ACT
47 Deloitte Access Economics
Figure 5.8: Case study: ANU Exchange
ANU Exchange has assisted in establishing numerous partnerships between the ANU and businesses; some of which are being more broadly than within the program itself. Indeed, ANU Exchange is acknowledged as a major new centre of business and residential activity in Canberra. Further, there is the capacity for future expansion and enhancement of the initiative.
ANU Exchange is a new residential, business and cultural centre in Canberra's City West precinct. The new development in the ANU Exchange will create residential accommodation for at least 2,000 students. The community benefits significantly from the new development.
building the exchange will employ more than 10,000 people;
a new bus station and busway associated with the precinct have been established;
the creation of office and retail space and 1,450 parking spaces; and
the replacement of facilities for community organisations.
The overarching aims of the ANU Exchange are to generate new engagement opportunities and research partnerships between the University and business communities, enhance learning outcomes, create an attractive and safe place for students and provide a destination for a vital arts community. The ANU Exchange is also a platform to augment Australia’s leading research-led Seat of Learning. The Precinct is bringing the ANU campus into the city and creating a vibrant zone of on-campus University living, as well as retail activity.
Importantly, ANU Exchange is aligned with a number of important government priorities, providing benefits for students, ANU and the broader communities and business:
building a strong dynamic economy;
promoting a fair and safe community; and
developing a vibrant city and great neighbourhoods. Source: ANU
5.4.2 International linkages
The provision of higher education to international students is an important contribution that the two universities make to the ACT economy. Firstly, expenditure by international students studying in the ACT is essentially an increase in export earnings of the region. This is outlined in more detail in Chapter 3. At the same time, international students provide an ongoing link between the Capital Region and the rest of the world.
The ANU attracts a slightly higher share of international students than the national average (Table 5.3). There is particular interest in ANU by international students; in 2012 32% of higher degree research students at ANU came from overseas (ANU 2012 Annual Report). This is six percentage points higher than the national average of share of international students.

Higher learning: Socioeconomic impact analysis of the universities in the ACT
48 Deloitte Access Economics
Table 5.3: International students comparison (2012)
Measure All universities ANU UC
Enrolments % Enrolments % Enrolments %
Domestic 931,761 74.1 14,655 73.1 12,141 75.1
International 325,961 25.9 5,405 26.9 4,021 24.9
Total 1,257,722 20,060 16,162
Source: Source: Department of Industry, Innovation, Science, Research and Tertiary Education (DIISRTE) Higher Education Statistics Data Cube (uCube) which is based on the student and staff data collections.
The most important source region for both universities is North-East Asia, followed by South-East Asia (ANU and UC 2013). More than half of the students at both ANU and UC (both 53%) of international students are from North-East Asia. With a further 23% of ANU international students and 15% of UC international students originate from South-East Asia.
As has been noted previously, the rise of Asia and in particularly China is critical for future growth of the Australian, and indeed the global economies (Australia in the Asian Century 2011). More than this, the rise of Asia is changing the very nature of activity within the global economy, as activity shifts from traditional western economies towards the growing Asian economies. Australia, as a developed nation in the Asia Pacific region, with cultural and business linkages to both the developed and developing world, is in a unique position to shape, and participate in, this transition.
The capacity for the universities to encourage strong cultural, business and personal linkages between past students within these areas will contribute towards this (Figure 5.9).

Higher learning: Socioeconomic impact analysis of the universities in the ACT
49 Deloitte Access Economics
Figure 5.9: Case study: Ibrahim Ismail
Past students of the ACT’s universities have contributed significantly to international policy and political development around the world.
Ibrahim Ismail spent 6 years as a student at UC. First graduating in 1992 with a Bachelor of Education, he then completed his master’s in 1994.
Ibrahim Ismail was instrumental in bringing about democratic change in the Maldives. He was one of two political leaders to challenge a 30-year dictatorship on the Island which instigated a grassroots movement for democratic change. This lead to the country’s first constitutions and democratic, multi-party election.
At the same time, utilising the skills he developed while at UC, Mr Ismail transformed the Maldives’ education system. Mr Ismail re-designed the country’s school curriculum, changed the exam system and sought better quality education for the children in the country.
In 2013, Mr Ismail received the University of Canberra’s Overall Distinguished Alumni Award.
“The University of Canberra certainly had a huge contribution in making me what I am today…. The things I have learnt from this University have shaped my career and formed what I did for the betterment of humanity - especially in my country.” Source: UC alumni awards.

Higher learning: Socioeconomic impact analysis of the universities in the ACT
50 Deloitte Access Economics
6 Conclusion The ACT university sector makes a significant contribution to the ACT economy. This study investigated contribution of ANU and UC, including their own operational activities and student and visitor spending. Because the ACU and UNSW were not included in the analysis, the economic contribution results likely underestimate the contribution of the sector.
Expenditure of $2.1 billion associated with ANU and the UC contributed over $1.7 billion of value added to the ACT economy in 2012. This means that every dollar of expenditure related to these two universities is associated with 80 cents of value added in the ACT economy. In addition, nearly $150 million was also contributed to the rest of Australia.
This expenditure was associated with about 11,500 FTE jobs. Less than half of that employment was directly associated with university operations – 6,120 FTEs are associated with universities indirectly or related to student or visitor spending in the wider ACT economy.
ANU and the UC are both currently pursuing initiatives that would increase their contribution to the ACT. This includes attracting additional international students to the region, increasing tourism-related expenditure on accommodation, food and beverage services and retail trade.
Over the next decade ANU plans to increase the international cohort of international undergraduate and postgraduate students by 24 and 14 per cent, respectively. By 2024, this would add $267 million to the ACT’s gross state (NPV, measured in 2013 dollars) and between 184 and 167 FTE jobs over the modelled period.
The ACT university sector makes a contribution to the local economy, but has value beyond what is captured in those numbers:
Research – both basic and more applied research generate benefits that are not necessarily easily quantified, and not included in this study. ANU research ranks well above world standard across all disciplines, including biological and environmental sciences, economics, studies in human society, philosophy and law (ERA 2012). From 2009 to 2011 output of research publications from the UC increased by 75.5%.
Business linkages – the universities establish and maintain linkages with a range of businesses and institutions. Many of these are outside the ACT, and create increase the international profile of the territory, including the International Alliance of Research Universities, Student Exchange Partners, and the Association of Pacific Rim Universities. Important links also develop within the ACT - Innovation ANU brings together ideas, research, government and business to create value in the community, and the UC has partnered with the ACT Government to build the University of Canberra Public hospital.
Community linkages – universities maintain important linkages with the community across a broad range of areas, including sport, music and the arts. This relationship is often based around the use of university facilities. The ACT Brumbies, UC and the ACT Government have established a sports hub on the Bruce campus that can also be utilised by community sports teams.

Higher learning: Socioeconomic impact analysis of the universities in the ACT
51 Deloitte Access Economics
Aligning with Government strategy – the ACT university sector make efforts to align themselves with the objectives of a number of key Government strategic plans, including The Canberra Plan – Towards our Second Century and the Canberra Social Plan.
Based on DAE’s regional ACT IO table the aggregate level of value added from expenditure associated with the universities that remains in the ACT compared to other industries is relatively high: for the universities, the total value added multiplier is 0.80; by comparison public administration has an ACT total value added multiplier of 0.72; the accommodation industry multiplier is 0.63; and the food and beverage industry multiplier is 0.62.

Higher learning: Socioeconomic impact analysis of the universities in the ACT
52 Deloitte Access Economics
Appendix A: Higher education in the ACT This section provides additional information of the higher education sector in the ACT.
The students
Table A.1 summarises characteristics of the student populations at the two major ACT universities.
Table A.1: Key student population statistics (2012)
Measure All universities ANU UC
Enrolments % Enrolments % Enrolments %
Postgraduate 328,729 26.1 9,603 47.9 3,783 23.4
Undergraduate 890,877 70.8 10,244 51.1 11,679 72.3
Other 38,116 3.0 213 1.1 700 4.3
Full-time 882,097 70.1 13,840 69.0 11,122 68.8
Part-time 375,625 29.9 6,220 31.0 5,040 31.2
Male 556,540 44.2 9,668 48.2 7,236 44.8
Female 701,182 55.8 10,392 51.8 8,926 55.2
Domestic 931,761 74.1 14,655 73.1 12,141 75.1
International 325,961 25.9 5,405 26.9 4,021 24.9
Total 1,257,722 20,060 16,162
Source: Department of Education, Higher Education Statistics Data Cube (uCube) which is based on the student and staff data collections.
International students
More than half of the international students enrolled at both universities originate from the North-East Asia region which includes Japan, South Korea and China. South-East Asia, which includes Thailand and Indonesia, is the second largest source region for international students (Figure A.2).
This is broadly similar to the pattern more broadly in Australia. Australian Education International reports that slightly more than 40% of international student enrolments in 2012 were from China, with a further 7% from Malaysia.
There is some difference between the source countries of international graduate students compared to undergraduate students. While North-East Asia is the most likely source region both for post-graduate and undergraduate students (55% and 54% respectively), the share of post-graduate students from South-East Asia is greater than for than undergraduates (34% compared to 19%).

Higher learning: Socioeconomic impact analysis of the universities in the ACT
53 Deloitte Access Economics
Table A.2: Students by country of birth (2013)
Region ANU UC
Students % of total Students % of total
North-East Asia 3,614 52.6 2,169 53.2 North Africa & Middle East 125 1.8 280 6.9 Americas 364 5.3 194 4.8 North-West Europe 191 2.8 87 2.1 South-East Asia 1,566 22.8 590 14.5 Southern and Central Asia 540 7.9 519 12.7 Oceania and Antarctica 277 4.0 36 0.9 Southern and Eastern Europe 56 0.8 36 0.9 Sub-Saharan Africa 131 1.9 151 3.7 Unknown - Overseas 9 0.1 13 0.3
Total 6,873 4,075 Source: ACT Universities’ data
Areas of study
While students at the two universities are most likely to undertake studies in either Society and Culture or Management and Commerce, there is a significant difference in the distribution of students across areas of study (Table A.3). Students at UC are more dispersed across the spectrum of study areas. Indeed, more than half of students enrolled in courses at the ANU are studying Society and Culture, while for UC slightly more than a quarter of students are enrolled in this subject area. At the same time students at ANU are more likely to be studying engineering (8% of all students) than UC (less than 1% of students). Students at UC are slightly more likely to be studying Management and Commerce, or Education (27% and 11% respectively) than students at ANU (17% and 1%).
Table A.3: Areas of study (2013)
Region ANU UC
Students % of total Students % of total
Agriculture, Environment Studies 495 2.2 105 0.6 Architecture and Building 0 0.0 666 4.0 Creative Arts 637 2.8 1,177 7.1 Education 229 1.0 1,806 10.9 Engineering, Technologies 1,799 7.8 43 0.3 Health 562 2.4 1,972 11.9 Information Technology 573 2.5 1,154 6.9 Management and Commerce 3,979 17.3 4,937 29.7 Natural and Physical Sciences 2,694 11.7 962 5.8 Society and Culture 12,022 52.3 3,785 22.8 Mixed Field Programmes 7 0.0 - 0.0 Not allocated 259 267
Total 23,256 16,874 Source: ACT Universities’ data. Shares of the total do not include the figure for not allocated.

Higher learning: Socioeconomic impact analysis of the universities in the ACT
54 Deloitte Access Economics
The campuses
The primary ANU campus, where a majority of teaching and academic work takes place, is located in the inner city suburb of Acton (Figure A.1).
Figure A.1: Location of ANU primary campus
Source: Google maps
Other campuses are located throughout Australia.These smaller campuses are predominately used for research, fieldwork and accommodation. The ANU Medical School offers teaching at a number of locations across the ACT, south east New South Wales and the Northern Territory. Smaller campuses include;
Mt Stromlo Observatory in the ACT;
Siding Spring Observatory in NSW;
North Australia Research Unit in the Northern Territory; and
Kioloa Coastal Campus also in NSW.
The primary UC campus is located slightly outside Canberra’s business district in the Belconnen area (Figure A.2).

Higher learning: Socioeconomic impact analysis of the universities in the ACT
55 Deloitte Access Economics
Figure A.2: Location of UC primary campus
Source: Google maps
Schools and institutions
ANU provides students with access to education opportunities across a broad range of academic areas. The different colleges are made up of specialist schools and research institutions which focus on more specific research areas. Some examples are outlined below.
ANU College of Asia & the Pacific
• Australian Centre on China in the World
• Crawford School of Public Policy
• Regulatory Institutions Network
• Research School of Asia & the Pacific
• School of Culture, History & Language
• School of International, Political & Strategic Studies
ANU College of Business & Economics
• Australian National Centre for Audit and Assurance Research
• National Centre for Information Systems Research

Higher learning: Socioeconomic impact analysis of the universities in the ACT
56 Deloitte Access Economics
• Research School of Accounting & Business Information Systems
• Research School of Economics
• Research School of Finance, Actuarial Studies & Applied Statistics
• Research School of Management
ANU Medical School
• Fenner School of Environment & Society
• John Curtin School of Medical Research
• Research School of Biology
• Research School of Population Health
• Research School of Psychology
Similarly, faculties at UC provide education services across the areas of strategic focus of the university. Faculties include: Arts and Design; Education, Science, Technology & Mathematics; Business, Government & Law; and Health. In addition to this the university supports a range of centres for research including:
ANZSOG Institute for Governance;
Institute for Applied Ecology;
Canberra Urban and Regional Futures;
eWater Cooperative Research Centre; and
The Centre for Labour Market Research.
The two major universities which are the focus of this report represent a significant share of the ACT’s higher education sector. Other significant institutions include the Australian Catholic University (ACU) and University New South Wales (UNSW) at the Australian Defence Force Academy (ADFA).
ACU (Signadou) has more than 600 students and is located 5 kilometres from the Canberra CBD in Watson. The school was initially established to educate Sisters from a number of congregations from around Australia as teachers to fill positions in the diocesan Catholic Primary School. Now the school offers a broader curriculum of studies including nursing, child protection and social work.
The UNSW Canberra campus is located at the ADFA. The primary aim of the provision of higher education is to provide with undergraduate qualifications which are necessary for their military service. Further, it is the aim of UNSW at ADFA to provide these students with the skills and capabilities necessary to respond to the challenges of an increasingly complex military environment. Undergraduate students are generally midshipmen of the Royal Australian Navy and officer cadets of the Australian Regular Army or of the Royal Australian Airforce.
Student accommodation
The two universities offer accommodation facilities for students.This is particularly important for ANU considering the number of students who relocate to the ACT from around Australia and the world.

Higher learning: Socioeconomic impact analysis of the universities in the ACT
57 Deloitte Access Economics
More ANU students choose to live in student residences than any other university in Australia. In 2012, 4,814 students were living in student residences.16 Living on campus for ANU students allows them to be within walking distance of the Canberra CBD. This provides access to the shops, cafes and restaurants within the Canberra CBD for students, but also to other important community facilities of the Canberra region including Mount Stromlo and the Parliamentary triangle. This further establishes and strengthens the linkages between the students and the ACT community.
Student accommodation is similarly important for UC, with new student accommodation, both on and off campus, currently under development. The university is particularly focussed on providing accommodation services to the large number of international students enrolled at UC. The university intends that on campus accommodation will be provided for half of the enrolled international students.
Figure A.3: Case study: Weedon Lodge
UC has recently converted a disused office building, Cameron Offices, into student accommodation renamed as Weedon Lodge. The university has contributed to maintaining this heritage-listed building for future use by the student community. Source: UC
16
ANU Annual Report (2012)

Higher learning: Socioeconomic impact analysis of the universities in the ACT
58 Deloitte Access Economics
Appendix B: Impact of higher education The discussion outlined in this section describes the high-level impact of higher education. That is, how the Australian economy and the individuals who participate in higher education benefit. This aim of this section is to demonstrate that there are numerous benefits from higher education. This is supported with Australia wide data. An explanation of the specific benefits to the ACT community is outlined in subsequent chapters.
Higher education institutions provide a range of individual benefits to the students who attend them. Higher education contributes to increasing the knowledge and skills of the individuals which make up a society which has implications for worker productivity, labour force participation and employment.
At the same time, higher education is valuable to society more broadly. This is the primary motivation for investment in higher education by governments and individuals. Society benefits from having a better educated population and the socio-economic flow on implications of this. Higher education contributes to creating more innovative and creative societies which have a lasting positive impact on economies. Thus, Australian universities contribute significantly to the communities that they are located and Australia more broadly.
Higher education also provides significant benefits beyond those accrued to individuals from attaining a degree, there are also wider socio-economic benefits that accrue to the community. Other social returns of higher education include greater equality, better informed citizens, and flow-on benefits of improved health outcomes associated with better education and having children more likely to participate in higher education.
Higher education promotes social equality, contributes to innovation in society and promotes better socio-economic outcomes for participants including in improved health outcomes and having children more likely to participate in higher education. The social benefits of the universities’ in the ACT are explored in more detail in Chapter 5. This chapter examines selected dimensions of the impact of higher education.
Research
Higher education institutions aim to encourage engaged discussion amongst an informed members of the community, research is an essential part of this.
The Australian government recognises the value of research and the importance of establishing defensible and robust measures of value. Research and innovation help to improve economy wide productivity and well-being which are essential to achieving long term sustainable economic growth as well as providing the Australian economy with the skills, knowledge and flexibility to respond to current and future national and international global challenges (Australian Research Council 2011). In response to a feasibility study on possible approaches for measuring the value of publically funded research undertaken

Higher learning: Socioeconomic impact analysis of the universities in the ACT
59 Deloitte Access Economics
during 2012, the Department of Innovation is currently designing and developing a mechanism to assess the public benefits arising from university-based research.
Quantifying the value of research undertaken by universities is not straight forward, the intangible nature of the outcomes of research, for example determining gains to society from a new invention, means that they are not easily valued. Partly, it is difficult because it is not always clear how to define what is valuable about research. That is, is it the quality of the research or the impact of research which should be measured? As such there is limited quantified data available which estimates the monetary value of research undertaken.
The Productivity Commission (PC) also notes the difficulty of estimating a numerical value of research, largely this is the result of numerous measurement and methodological issues. As such the PC was unable to accurately estimate the value of science and innovation (including research) beyond a broad estimate of the return to government investment. However, the PC states that on the basis of the available evidence the benefits of public spending are likely to exceed the costs. This, however, does not provide an estimate of individual pieces of research, or research from the University sector more broadly.
The PC does state that supporting the education and training of scientists and investment in research that is essential to the development of Australia’s innovation system. Indeed, the PC (Page XXVII) found that:
…public support for science and innovation has, by and large, provided widespread and important benefits for Australians.
The PC notes that there exists significant ‘spillovers’ from innovation. These spillovers arise from the development of basic knowledge, or spreading of new ideas. These spillovers are attributed to all publically funded research in Australia including that undertaken by universities.
Income
Corliss et al (2010; 2013) focussed on private rates of return over the business cycle found that the rate of return for individuals from undertaking a Bachelor Degree in Australia was above the real rate of interest.
While the returns for university education were generally found to be high, the authors found significant variations across sectors. The return from undertaking certain fields of study, such as Dentistry, Medicine and Information Technology were particularly high, but the completion of a Visual and Performing Arts degree was less profitable.
The authors found that full-time study for a Masters Degree generated very low and sometimes negative returns, however part-time study for Masters Degree while in paid employment was a profitable investment.
Utilising Census data Daly and Lewis (2010) estimate the median income of higher education Graduates compared with individuals who have Completed Year 12 between 1986 and 2006. The authors found that during 2006 there was a significant income gap between both males and females with bachelor degrees compared to those with Year 12 qualifications only. The median income gap for males was almost double for males in 2001, and almost 80% higher for females. While the wage differential fell between 2011 and
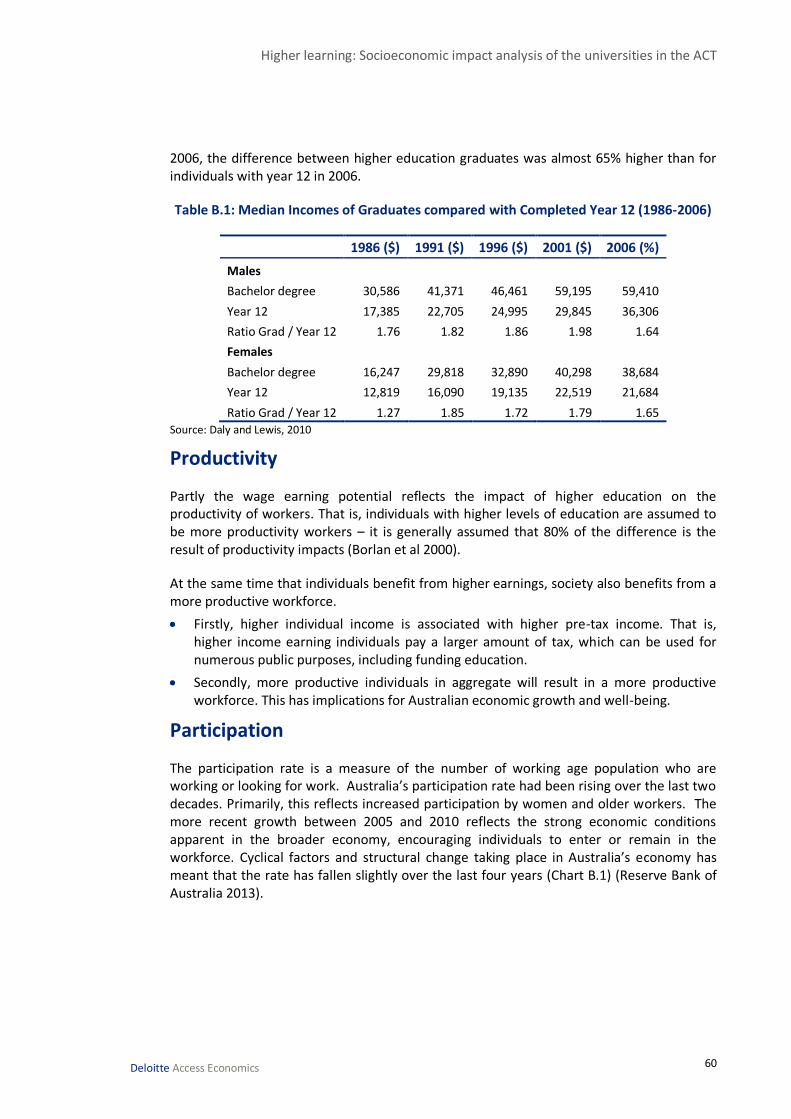
Higher learning: Socioeconomic impact analysis of the universities in the ACT
60 Deloitte Access Economics
2006, the difference between higher education graduates was almost 65% higher than for individuals with year 12 in 2006.
Table B.1: Median Incomes of Graduates compared with Completed Year 12 (1986-2006)
1986 ($) 1991 ($) 1996 ($) 2001 ($) 2006 (%)
Males
Bachelor degree 30,586 41,371 46,461 59,195 59,410
Year 12 17,385 22,705 24,995 29,845 36,306
Ratio Grad / Year 12 1.76 1.82 1.86 1.98 1.64
Females
Bachelor degree 16,247 29,818 32,890 40,298 38,684
Year 12 12,819 16,090 19,135 22,519 21,684
Ratio Grad / Year 12 1.27 1.85 1.72 1.79 1.65 Source: Daly and Lewis, 2010
Productivity
Partly the wage earning potential reflects the impact of higher education on the productivity of workers. That is, individuals with higher levels of education are assumed to be more productivity workers – it is generally assumed that 80% of the difference is the result of productivity impacts (Borlan et al 2000).
At the same time that individuals benefit from higher earnings, society also benefits from a more productive workforce.
Firstly, higher individual income is associated with higher pre-tax income. That is, higher income earning individuals pay a larger amount of tax, which can be used for numerous public purposes, including funding education.
Secondly, more productive individuals in aggregate will result in a more productive workforce. This has implications for Australian economic growth and well-being.
Participation
The participation rate is a measure of the number of working age population who are working or looking for work. Australia’s participation rate had been rising over the last two decades. Primarily, this reflects increased participation by women and older workers. The more recent growth between 2005 and 2010 reflects the strong economic conditions apparent in the broader economy, encouraging individuals to enter or remain in the workforce. Cyclical factors and structural change taking place in Australia’s economy has meant that the rate has fallen slightly over the last four years (Chart B.1) (Reserve Bank of Australia 2013).

Higher learning: Socioeconomic impact analysis of the universities in the ACT
61 Deloitte Access Economics
Chart B.1 : Participation rate
Source: ABS, Cat No 6202.0
6.1.1 Graduate unemployment
Graduate job seekers experience lower levels of unemployment duration than the general population. About 69% of job seekers with a bachelor degree or above find employment within 26 weeks, compared to 63% for the total population (Table B.2).
Table B.2: Duration of unemployment, by educational attainment
Duration of current period of unemployment Bachelor Degree or
above Total
Under 1 year 82.5 79.2
1 and under 8 weeks 37.6 34.0
8 and under 26 weeks 31.5 28.7
26 and under 52 weeks 13.5 16.5
1 year and over 17.5 20.8
Total 100.0 100.0 Source: ABS Cat. No. 6222.0
60
61
62
63
64
65
66
67
1994 1996 1998 2000 2002 2004 2006 2008 2010 2012 2014
%

Higher learning: Socioeconomic impact analysis of the universities in the ACT
62 Deloitte Access Economics
Appendix C: Student expenditure In July 2013, the Centre for the Study for Higher Education released a national report titled ‘University student finances in 2012, 'A study of the financial circumstances of domestic and international students in Australia's universities’. This report broke down average expenditure bundles for domestic and international students, by part time/full time and coursework type. We used these averages and enrolment data to calculate total student expenditure (Table C.1).
Table C.1: ACT university student expenditure by region (FY2013)
Expenditure ($m) ACT Spending at university NSW Total
Living Rent/mortgage 269.9 48.3 13.0 331.2
Food, household supplies 190.4 3.9 194.2 Utilities 48.2 2.2 50.4 Medical and health costs 27.9 27.9 Transport 88.3 88.3 Personal costs 102.3 102.3 Credit/loan commitments 43.4 43.4 Childcare/Child support 21.1 21.1 Other general expenses 24.4 24.4
Study-related Textbooks 17.7 17.7 Stationery and equipment 11.1 11.1 Computer 33.3 33.3 University fees 7.0 7.0 Credit/loan (for study) 15.7 15.7 Transport to/from university 35.8 35.8 HECS repayments 5.0
Other study-related cost 5.0 5.0
Total 939.9 60.4 19.0 1,019.2 Source: Deloitte Access Economics
To estimate the total expenditure by region we apportioned the average student expenditure to each of the modelling regions.
To avoid double counting, money spent at a university is likely to be recorded as revenue of the university (such as textbooks, stationery, library fines and union fees) and has been excluded from the student spending analysis.
Money spent in NSW was calculated by estimating how many students live outside of the ACT, i.e. in Queanbeyan and Yass etc., and attributing certain parts of their spending bundles to spend in home region.
Residential student postcode data, provided by both universities, suggested 5% of domestic students live in NSW. For those living in the NSW, all of their spending on

Higher learning: Socioeconomic impact analysis of the universities in the ACT
63 Deloitte Access Economics
utilities and mortgage/rent, plus half of their spending on food and house supplies, was attributed to spending in NSW.
Some students have not updated their residency address since starting university, so their data suggest they still live in their home before enrolment. Although some students study by distance, around 1% at the ANU, we assumed most students moved to the ACT and its surrounding regions.
Table C.2: ACT university students’ expenditure bundle
Expenditure
Average Domestic Student ($)
Average International Student ($)
Total Domestic ($m)
Total International ($m)
Living Rent/mortgage 9,147 7,233 257.5 73.7 Food, household supplies 5,435 4,043 153.0 41.2 Utilities 1,552 661 43.7 6.7 Medical and health costs 884 302 24.9 3.1 Transport 2,676 1,276 75.3 13.0 Personal costs 3,027 1,673 85.2 17.0 Credit/loan commitments 1,421 337 40.0 3.4 Childcare/Child support 620 356 17.5 3.6 Other general expenses 719 407 20.2 4.1
Study-related Textbooks 488 390 13.7 4.0 Stationery and equipment 281 317 7.9 3.2 Computer 965 600 27.2 6.1 University fees 134 320 3.8 3.3 Credit/loan (for study) 282 759 7.9 7.7 Transport to/from uni 997 764 28.1 7.8 HECS Repayments 366 10.3 Other study-related cost 121 156 3.4 1.6
University fees 29,114 19,593 819.5 199.7 Source: Deloitte Access Economics
The average domestic student spends more on housing and over twice as much on transport (it is more likely that international students live on or close to campus), while the average international student has greater study-related loans and university fees.

Higher learning: Socioeconomic impact analysis of the universities in the ACT
64 Deloitte Access Economics
Appendix D: Economic contribution studies Economic contribution studies are intended to quantify measures such as value added, exports, imports and employment associated with a given industry or firm, in a historical reference year. The economic contribution is a measure of the value of production by a firm or industry.
Value added
The measures of economic activity provided by a contribution study are consistent to those provided by the Australian Bureau of Statistics. For example, value added is the contribution the sector makes to total factor income and gross domestic product (GDP) and gross territory product.
There a number of ways to measure GDP:
Expenditure approach – measures the expenditure; of households, on investment, government and net exports
Income approach – measures the income in an economy by measuring the payments of wages and profits to workers and owners
Below is a discussion measuring the value added by an industry using the income approach.
Measuring the economic contribution – income approach
There are several commonly used measures of economic activity, each of which describes a different aspect of an industry’s economic contribution:
Value added measures the value of output (i.e. goods and services) generated by the entity’s factors of production (i.e. labour and capital) as measured in the income to those factors of production. The sum of value added across all entities in the economy equals gross domestic product. Given the relationship to GDP, the value added measure can be thought of as the increased contribution to welfare.
Value added is the sum of:
• Gross operating surplus (GOS). GOS represents the value of income generated by the entity’s capital inputs, generally measured as the earnings before interest, tax, depreciation and amortisation (EBITDA).
• Tax on production less subsidy provided for production. Note: given the returns to capital before tax are calculated, company tax is not included or this would double count that tax. In addition it excludes goods and services tax, which is a tax on consumption (i.e. levied on households).
• Labour income is a subcomponent of value added. It represents the value of output generated by the entity’s direct labour inputs, as measured by the income to labour.

Higher learning: Socioeconomic impact analysis of the universities in the ACT
65 Deloitte Access Economics
Figure D.1 shows the accounting framework used to evaluate economic activity, along with the components that make up output. Output is the sum of value added and the value of intermediate inputs used by the firm.
The value of intermediate inputs can also be calculated directly by summing up expenses related to non-primary factor inputs.
Figure D.1: Economic activity accounting framework
Source: Deloitte Access Economics.
Contribution studies generally outline employment generated by a sector. Employment is a fundamentally different measure of activity to those above. It measures the number of workers that are employed by the entity, rather than the value of the workers’ output.
Direct and indirect contributions
The direct economic contribution is a representation of the flow from labour and capital in the company.
The indirect contribution is a measure of the demand for goods and services produced in other sectors as a result of demand generated by the universities. Estimation of the indirect economic contribution is undertaken in an IO framework using Australian Bureau of Statistics IO tables which report the inputs and outputs of specific sectors of the economy (ABS 2010).
The total economic contribution to the economy is the sum of the direct and indirect economic contributions.
Other measures, such as total revenue or total exports are useful measures of economic activity but these measures alone cannot account for the contribution made to GDP. These measures overstate the contribution to value added because they include activity by external firms supplying inputs, in addition they do not discount the inputs supplied from outside Australia.
Intermediate inputs
(sourced from other industries)
Labour
Gross operating surplus
Production taxes less subsidies
Value added
(output less
intermediate
inputs)
Output
(total revenue)

Higher learning: Socioeconomic impact analysis of the universities in the ACT
66 Deloitte Access Economics
Limitations of economic contribution studies
While describing the geographic origin of production inputs may be a guide to a firm’s linkages with the local economy, it should be recognised that these are the type of normal industry linkages that characterise all economic activities.
Unless there is significant unused capacity in the economy (such as unemployed labour) there is only a weak relationship between a firm’s economic contribution as measured by value added (or other static aggregates) and the welfare or living standard of the community. Indeed, the use of labour and capital by demand created from the industry comes at an opportunity cost as it may reduce the amount of resources available to spend on other economic activities.
This is not to say that the economic contribution, including employment, is not important. As stated by the Productivity Commission in the context of Australia’s gambling industries:17
Value added trade and job creation arguments need to be considered in the context of the economy as a whole … income from trade uses real resources, which could have been employed to generate benefits elsewhere. These arguments do not mean that jobs, trade and activity are unimportant in an economy. To the contrary they are critical to people’s well-being. However, any particular industry’s contribution to these benefits is much smaller than might at first be thought, because substitute industries could produce similar, though not equal gains.
In a fundamental sense, economic contribution studies are simply historical accounting exercises. No ‘what-if’, or counterfactual inferences – such as ‘what would happen to living standards if the firm disappeared?’ – should be drawn from them.
The analysis – as discussed in the report – relies on a national input-output (IO) table modelling framework and there are some limitations to this modelling framework. The analysis assumes that goods and services provided to the sector are produced by factors of production that are located completely within the state or region defined and that income flows do not leak to other states.
The IO framework and the derivation of the multipliers also assume that the relevant economic activity takes place within an unconstrained environment. That is, an increase in economic activity in one area of the economy does not increase prices and subsequently crowd out economic activity in another area of the economy. As a result, the modelled total and indirect contribution can be regarded as an upper-bound estimate of the contribution made by the supply of intermediate inputs.
Similarly the IO framework does not account for further flow-on benefits as captured in a more dynamic modelling environment like a CGE model.
17
Productivity Commission (1999), Australia’s Gambling Industries, Report No. 10, AusInfo, Canberra, (page 4.19).

Higher learning: Socioeconomic impact analysis of the universities in the ACT
67 Deloitte Access Economics
Input-output analysis
Input-output tables are required to account for the intermediate flows between sectors. These tables measure the direct economic activity of every sector in the economy at the national level. Importantly, these tables allow intermediate inputs to be further broken down by source. These detailed intermediate flows can be used to derive the total change in economic activity associated with a given direct change in activity for a given sector.
A widely used measure of the spill-over of activity from one sector to another is captured by the ratio of the total to direct change in economic activity. The resulting estimate is typically referred to as ‘the multiplier’. A multiplier greater than one implies some indirect activity, with higher multipliers indicating relatively larger indirect and total activity flowing from a given level of direct activity.
The IO matrix used for Australia is derived from the ABS 2005-06 IO tables (2010). The industry classification used for IO tables is based on ANZSIC, with 109 sectors in the modelling framework.

Higher learning: Socioeconomic impact analysis of the universities in the ACT
68 Deloitte Access Economics
Appendix E: CGE modelling The Deloitte Access Economics – Regional General Equilibrium Model (DAE-RGEM) is a large scale, dynamic, multi-region, multi-commodity computable general equilibrium model of the world economy. The model has been customised to include the ACT and the Rest of Australia.
The model allows policy analysis in a single, robust, integrated economic framework. This model projects changes in macroeconomic aggregates such as GDP, employment, export volumes, investment and private consumption. At the sectoral level, detailed results such as output, exports, imports and employment are also produced.
The model is based upon a set of key underlying relationships between the various components of the model, each which represent a different group of agents in the economy. These relationships are solved simultaneously, and so there is no logical start or end point for describing how the model actually works.
Figure E.1 shows the key components of the model for an individual region. The components include a representative household, producers, investors and international (or linkages with the other regions in the model, including other Australian States and foreign regions). Below is a description of each component of the model and key linkages between components. Additional technical detail is also provided.
Figure E.1: Key components of DAE-RGEM

Higher learning: Socioeconomic impact analysis of the universities in the ACT
69 Deloitte Access Economics
DAE-RGEM is based on a substantial body of accepted microeconomic theory. Key assumptions underpinning the model are:
The model contains a ‘regional consumer’ that receives all income from factor payments (labour, capital, land and natural resources), taxes and net foreign income from borrowing (lending).
Income is allocated across household consumption, government consumption and savings so as to maximise a Cobb-Douglas (C-D) utility function.
Household consumption for composite goods is determined by minimising expenditure via a CDE (Constant Differences of Elasticities) expenditure function. For most regions, households can source consumption goods only from domestic and imported sources. In the Australian regions, households can also source goods from interstate. In all cases, the choice of commodities by source is determined by a CRESH (Constant Ratios of Elasticities Substitution, Homothetic) utility function.
Government consumption for composite goods, and goods from different sources (domestic, imported and interstate), is determined by maximising utility via a C-D utility function.
All savings generated in each region are used to purchase bonds whose price movements reflect movements in the price of creating capital.
Producers supply goods by combining aggregate intermediate inputs and primary factors in fixed proportions (the Leontief assumption). Composite intermediate inputs are also combined in fixed proportions, whereas individual primary factors are combined using a constant elasticity of substitution (CES) production function.
Producers are cost minimisers, and in doing so, choose between domestic, imported and interstate intermediate inputs via a CRESH production function.
The model contains a more detailed treatment of the electricity sector that is based on the ‘technology bundle’ approach for general equilibrium modelling developed by ABARE (1996).
The supply of labour is positively influenced by movements in the real wage rate governed by an elasticity of supply.
Investment takes place in a global market and allows for different regions to have different rates of return that reflect different risk profiles and policy impediments to investment. A global investor ranks countries as investment destinations based on two factors: global investment and rates of return in a given region compared with global rates of return. Once the aggregate investment has been determined for Australia, aggregate investment in each Australian sub-region is determined by an Australian investor based on: Australian investment and rates of return in a given sub-region compared with the national rate of return.
Once aggregate investment is determined in each region, the regional investor constructs capital goods by combining composite investment goods in fixed proportions, and minimises costs by choosing between domestic, imported and interstate sources for these goods via a CRESH production function.
Prices are determined via market-clearing conditions that require sectoral output (supply) to equal the amount sold (demand) to final users (households and government), intermediate users (firms and investors), foreigners (international exports), and other Australian regions (interstate exports).

Higher learning: Socioeconomic impact analysis of the universities in the ACT
70 Deloitte Access Economics
For internationally-traded goods (imports and exports), the Armington assumption is applied whereby the same goods produced in different countries are treated as imperfect substitutes. But, in relative terms, imported goods from different regions are treated as closer substitutes than domestically-produced goods and imported composites. Goods traded interstate within the Australian regions are assumed to be closer substitutes again.
The model accounts for greenhouse gas emissions from fossil fuel combustion. Taxes can be applied to emissions, which are converted to good-specific sales taxes that impact on demand. Emission quotas can be set by region and these can be traded, at a value equal to the carbon tax avoided, where a region’s emissions fall below or exceed their quota.
The representative household
Each region in the model has a so-called representative household that receives and spends all income. The representative household allocates income across three different expenditure areas: private household consumption; government consumption; and savings.
Going clockwise around Figure E.1, the representative household interacts with producers in two ways. First, in allocating expenditure across household and government consumption, this sustains demand for production. Second, the representative household owns and receives all income from factor payments (labour, capital, land and natural resources) as well as net taxes. Factors of production are used by producers as inputs into production along with intermediate inputs. The level of production, as well as supply of factors, determines the amount of income generated in each region.
The representative household’s relationship with investors is through the supply of investable funds – savings. The relationship between the representative household and the international sector is twofold. First, importers compete with domestic producers in consumption markets. Second, other regions in the model can lend (borrow) money from each other.
Some detail
The representative household allocates income across three different expenditure areas – private household consumption; government consumption; and savings – to maximise a Cobb-Douglas utility function.
Private household consumption on composite goods is determined by minimising a CDE expenditure function. Private household consumption on composite goods from different sources is determined by a CRESH (utility function.
Government consumption on composite goods, and composite goods from different sources, is determined by maximising a Cobb-Douglas utility function.
All savings generated in each region are used to purchase bonds whose price movements reflect movements in the price of generating capital.

Higher learning: Socioeconomic impact analysis of the universities in the ACT
71 Deloitte Access Economics
Producers
Apart from selling goods and services to households and government, producers sell products to each other (intermediate usage) and to investors. Intermediate usage is where one producer supplies inputs to another’s production. For example, coal producers supply inputs to the electricity sector.
Capital is an input into production. Investors react to the conditions facing producers in a region to determine the amount of investment. Generally, increases in production are accompanied by increased investment. In addition, the production of machinery, construction of buildings and the like that forms the basis of a region’s capital stock, is undertaken by producers. In other words, investment demand adds to household and government expenditure from the representative household, to determine the demand for goods and services in a region.
Producers interact with international markets in two main ways. First, they compete with producers in overseas regions for export markets, as well as in their own region. Second, they use inputs from overseas in their production.
Some detail
Sectoral output equals the amount demanded by consumers (households and government) and intermediate users (firms and investors) as well as exports.
Intermediate inputs are assumed to be combined in fixed proportions at the composite level. As mentioned above, the exception to this is the electricity sector that is able to substitute different technologies (brown coal, black coal, oil, gas, hydropower and other renewables) using the ‘technology bundle’ approach developed by ABARE (1996).
To minimise costs, producers substitute between domestic and imported intermediate inputs is governed by the Armington assumption as well as between primary factors of production (through a CES aggregator). Substitution between skilled and unskilled labour is also allowed (again via a CES function).
The supply of labour is positively influenced by movements in the wage rate governed by an elasticity of supply (is assumed to be 0.2). This implies that changes influencing the demand for labour, positively or negatively, will impact both the level of employment and the wage rate. This is a typical labour market specification for a dynamic model such as DAE-RGEM. There are other labour market ‘settings’ that can be used. First, the labour market could take on long-run characteristics with aggregate employment being fixed and any changes to labour demand changes being absorbed through movements in the wage rate. Second, the labour market could take on short-run characteristics with fixed wages and flexible employment levels.
Investors
Investment takes place in a global market and allows for different regions to have different rates of return that reflect different risk profiles and policy impediments to investment. The global investor ranks countries as investment destination based on two factors: current economic growth and rates of return in a given region compared with global rates of return.

Higher learning: Socioeconomic impact analysis of the universities in the ACT
72 Deloitte Access Economics
Some detail
Once aggregate investment is determined in each region, the regional investor constructs capital goods by combining composite investment goods in fixed proportions, and minimises costs by choosing between domestic, imported and interstate sources for these goods via a CRESH production function.
International
Each of the components outlined above operate, simultaneously, in each region of the model. That is, for any simulation the model forecasts changes to trade and investment flows within, and between, regions subject to optimising behaviour by producers, consumers and investors. Of course, this implies some global conditions must be met such as global exports and global imports are the same and that global debt repayments equal global debt receipts each year.

Higher learning: Socioeconomic impact analysis of the universities in the ACT
73 Deloitte Access Economics
Appendix F: References Australian Bureau of Statistics (2013) Category Number 3101.0, Australian Demographic Statistics, Jun 2013.
Australian Bureau of Statistics (2013) Category Number 3222.0, Population Projections, 2012 to 2101.
Australian Bureau of Statistics (2013) Category Number 5206.0, Australian National s, Dec 2013.
Australian Bureau of Statistics (2013) Category Number 6202.0, Labour Force, Apr 2014.
Australian Bureau of Statistics (2013) Category Number 6220.0, Persons Not in the Labour Force, Sep 2013.
Australian Bureau of Statistics (2011) National Census.
Australian Bureau of Statistics (2010) Research Paper: Measuring Economic Returns to Post-School Education in Australia, Aug 2010.
Australian National University (2013) 2012 Annual Report
Australian National University (2013) 2012 Graduate Destination Report for ANU
Borland J, Dawkins P, Johnson D and Williams R (2000) “Returns to investment in higher education” Melbourne Institute Report No. 1.
Corliss M, Lewis P, and Daly A, (2013) “The Rate of Return to Higher Education Over the Business Cycle” Australian Journal of Labour Economics: 16(2).
Daly A, Lewis P, Corliss M and Heaslip T (2010) “The Private Rate of Return to a University Degree in Australia” The University of Canberra.
Department of Education (2013) “uCube Higher Education Statistics” - http://www.highereducationstatistics.deewr.gov.au/
Department of Education (2012) “Higher Education Research Data Collection” - https://education.gov.au/higher-education-research-data-collection
Department of Industry (2008-2009) “National Survey of Research Commercialisation” http://www.innovation.gov.au/innovation/reportsandstudies/Pages/NationalSurveyofResearchCommercialisation.aspx
Department of Innovation Industry, Science and Research (2011) “Focussing Australia’s publically funded research review: maximising the innovation dividend review key findings and future directions”. October, 2011.

Higher learning: Socioeconomic impact analysis of the universities in the ACT
74 Deloitte Access Economics
Productivity Commission (2012) “Impacts of COAG Reforms: Business Regulation and VET”
Productivity Commission (2012) “Looking Back on Structural Change in Australia: 2002-2012”. http://www.pc.gov.au/annual-reports/2011-12/supplement
Tourism Research Australia, 2013 International Visitor Survey, http://www.tra.gov.au/publications/latest-ivs-report.html
University of Canberra (2013) 2012 Annual Report
Universities Australia, University Student Finances in 2012 (July 2013)

Limitation of our work
General use restriction
This report is prepared solely for the use of Australian National University and the University of Canberra. This report is not intended to and should not be used or relied upon by anyone else and we accept no duty of care to any other person or entity. The report has been prepared for the purpose of increasing the understanding of the university sector in the ACT. You should not refer to or use our name or the advice for any other purpose

Contact us
Deloitte Access Economics ACN: 149 633 116 Level 1 9 Sydney Avenue Barton ACT 2600 PO Box 6334 Kingston ACT 2604 Australia Tel: +61 2 6175 2000 Fax: +61 2 6175 2001 www.deloitteaccesseconomics.com.au
Deloitte Access Economics is Australia’s pre-eminent economics advisory practice and a member of Deloitte's global economics group. The Directors and staff of Access Economics joined Deloitte in early 2011.
About Deloitte
Deloitte refers to one or more of Deloitte Touche Tohmatsu Limited, a UK private company limited by guarantee, and its network of member firms, each of which is a legally separate and independent entity. Please see www.deloitte.com/au/about for a detailed description of the legal structure of Deloitte Touche Tohmatsu Limited and its member firms.
Deloitte provides audit, tax, consulting, and financial advisory services to public and private clients spanning multiple industries. With a globally connected network of member firms in more than 150 countries, Deloitte brings world-class capabilities and deep local expertise to help clients succeed wherever they operate. Deloitte's approximately 200,000 professionals are committed to becoming the standard of excellence.
About Deloitte Australia
In Australia, the member firm is the Australian partnership of Deloitte Touche Tohmatsu. As one of Australia’s leading professional services firms. Deloitte Touche Tohmatsu and its affiliates provide audit, tax, consulting, and financial advisory services through approximately 6,000 people across the country. Focused on the creation of value and growth, and known as an employer of choice for innovative human resources programs, we are dedicated to helping our clients and our people excel. For more information, please visit our web site at www.deloitte.com.au.
Liability limited by a scheme approved under Professional Standards Legislation.
Member of Deloitte Touche Tohmatsu Limited
© 2014 Deloitte Access Economics Pty Ltd