uca.eduuca.edu/geography/files/2015/08/using-gis-and-remote... · web viewusing gis and remote...
TRANSCRIPT
USING GIS AND REMOTE SENSING TO FACILITATE HUMAN EXPOSURE
ESTIMATION AND AGRICULTURAL PESTICIDE APPLICATION
by
XXXX XXXXXXX
Thesis ProposalDepartment of Geography and the Graduate School of University of Central Arkansas
Master of Geographic Information Systems
Conway, Arkansas Spring – 2015

Draft Thesis Proposal
TABLE OF CONTENTS (Partial)
CHAPTER 1 – INTRODUCTION
A. Background……. ………………………………………………………………………... 1
B. Statement of the Problem………….. ……………………………………………………. 2
C. Significance of the Problem …………..…………………………………………………. 3
D. Statement of the Purpose ………… …………………………………………………...... 5
E. Theoretical/Conceptual framework .……………… ………………………………......... 6
F. Objectives, Hypothesis & Research Questions ...…………….. ……………………….... 9
G. Assumptions/Theoretical Limitations …………….. ……………………………………11
CHAPTER 2 – LITERATURE REVIEW
A. Agricultural Pesticide Risk in Environmental Health …………………………………...12
B. Using GIS for Estimating Human Exposure to Environmental Health Hazards ………. 15
C. Remote Sensing in Agriculture and Exposure Estimation ..……………………………. 19
D. GIS Based Dispersion Modeling for Evaluating Exposure Risk ………………………. 23
E. Summary ……………………………………………………………………………….. 25
CHAPTER 3 – METHODOLOGY
A. Population and Sample ………………………………………………………………… 29
B. Setting ………………………………………………………………………………….. 31
C. Measurement Methods ………..………………………………………………………... 32
D. Plan for Data Collection ...……. ….……………………………………………………..34
E. Plan for Data Analysis .………………………………………………………………….35
F. Limitations ……………………………… …………………………………………….. 38
Draft Thesis Proposal
Chapter 1
INTRODUCTION
A. Introduction/Background
In the fields of environmental and spatial epidemiology (an integration of techniques from
the disciplines of geographic information systems (GIS) and environmental health), promising
new approaches have emerged to study and respond in an effective manner to detrimental
environmental health impacts. For example, due to their emphasis on space and location, the
application of geospatial information technologies such as GIS and remote sensing are uniquely
suited to the investigation and analysis of environmental health hazards and to the minimization
of environmental contamination. Additionally, since agriculture is inherently a spatial and
temporal activity, the use of geospatial technologies by farmers are providing tangible benefits
by minimizing operational risks and increasing harvest production.
This study focuses on the use of geo-technologies for examining the geographical
relationship between pesticides used on crops grown near rural and peri-urban elementary
schools within the Central Valley of California. Proximity to crops and residential exposure to
agricultural pesticides have been the subject of numerous studies with results indicating the
presence of increased pesticide concentration adjacent to rural residential neighborhoods
(Maxwell, Meliker, & Goovaerts, 2010).
Additionally, elementary schools proximate to agricultural fields are known to be directly
vulnerable to high levels of environmental hazards such as pesticide spray drift, which could
potentially increase the risk of adverse health effects in children (Owens & Feldman, 2004).
However, there appears to be a paucity of research and lack of environmental health
1
Draft Thesis Proposal
investigations in connection with school proximity to industrial agricultural pesticide application
(Wishtoyo Foundation, 2003). Therefore, a primary emphasis of this paper is to investigate the
integration of geospatial related technologies to environmental health research concerning
agricultural pesticide use near public elementary schools, and to recommend improvements for
supporting agricultural pesticide application and exposure assessment.
B. Statement of the Problem
Some of the most restrictive policies in the nation for limiting the use of agricultural
pesticides near schools are in California (California Environmental Health Tracking Program
[CEHTP], 2014). County policies related to application of agricultural pesticides of public health
concern near elementary schools are primarily intended to prevent risks of acute pesticide
exposure, not risks of chronic pesticide exposure (i.e., repeated exposure over a long period of
time, even in minor amounts). Even though many regulatory policies dictate pesticide
applications to be conducted before and after ordinary school hours, many agricultural pesticides
or their byproducts may remain in the environment after they are applied. Because of this
chemical persistence near vulnerable populations, there may be implications for chronic
exposure risks (also known as chronic or persistent effects) and delayed adverse health outcomes
in children (Roberts & Karr, 2012). Therefore, school children proximity to agricultural chemical
hazards and the possibility of disproportionate or mis-specified environmental health impacts
due to risks of spray drift and persistent low-level exposure from agrochemicals is a problem
facing many rural and peri-urban schools in the Central Valley.
In addition to potential pesticide exposure risk near school populations, identifying the
location of pesticide applications on crops through yearly county section-level (Public Land
2
Draft Thesis Proposal
Survey System) maps is a geographic scale too coarse or not optimal for exposure analysis
(Maxwell, Airola, & Nuckols, 2010). Researchers also note that comprehensive state land use
maps that can be used to link pesticide use to specific crop fields are temporally intermittent
(e.g., produced every 5-7 years) and do not adequately identify idle or multi-cropped fields and
crop field extent (Maxwell, Airola, & Nuckols, 2010). Consequently, a common problem that
current agricultural focused exposure models encounter is that they do not consider pesticide
applied to all crops grown over the entire year and/or properly delineate the crop field exposure
boundaries which may underestimate or overestimate modeled pesticide assessment.
Ultimately, as a means to better assess the use of pesticides near sensitive populations,
such as elementary school children, improved efforts for monitoring of agrochemical
applications and exposure assessment are needed. Better knowledge of the problems dealing with
agricultural pesticide use using geo-technologies can improve information and understanding for
evaluating ways to minimize potential exposure from industrial agricultural pesticide application
near public school sites.
C. Significance of the Problem
The proximity of schools to pesticide use puts children at risk of exposure to airborne
pesticides in many California agricultural areas (CEHTP, 2014). Studies have shown that much
of the occurrence of pesticides in the atmosphere can be attributed to agricultural use because of
the large acreage involved and the large chemical quantities used (Majewski & Capel, 1995).
Drift is the unintentional airborne movement of pesticides to non-target areas such as residential
areas, schools, and other spaces (Harrison, 2011). Atmospheric pesticide inputs typically occur
during the agricultural application process (e.g., spraying) through evaporation and drift, and
3
Draft Thesis Proposal
post-application through volatilization and wind erosion. Volatilization is a common pathway for
pesticides to enter the environment (Majewski & Capel, 1995). Because of environmental
conditions, volatilization transpires when pesticide surface residues change from a solid or liquid
to a gas or vapor after application (Gao, et al., 2012). Consequently, volatilization of pesticides
from agricultural fields composes a large source of potential human exposure with some
pesticides having up to a 90% volatilization rate (Harnly, et al., 2005). For example, pesticides
such as heptachlor and trifluralin when surface applied can have 90% loss by volatilization
within six or seven days (Majewski & Capel, 1995).
In some observational epidemiological studies, chronic health outcomes in school-age
children may be associated with persistent, low-level or sub-acute pesticide exposure over time
(Roberts & Reigart, 2013). Pesticide exposure, whether from acute poisoning or
persistent/chronic effects, may induce chronic health complications in children, including
neurodevelopmental or behavioral problems, birth defects, asthma, and cancer (Roberts & Karr,
2012). Children are particularly vulnerable and at risk to the adverse health effects of pesticide
exposure due to their size, their rapidly growing bodies, and the special ways they physically
interact with their school environment and other students such as spending more time outdoors,
playing on the ground, and putting objects in their mouths (CEHTP, 2014).
The magnitude of the problem is also characterized by the need for environmental health
researchers to have accurate, unbiased exposure estimates since teachers and especially children
are often unaware they have been exposed to pesticides during the school year (Oregon Toxics
Alliance [OTA], 2008). Moreover, an important weakness of many epidemiological studies is
adequacy and reliability of exposure assessment (U. S. Environmental Protection Agency [EPA],
4
Draft Thesis Proposal
2013). As expressed by Maxwell (2011), measuring pesticide exposures directly are often
expensive, difficult, or impossible to acquire, especially for retrospective studies where data are
collected only after enrollment (i.e., post-diagnosis), and for this reason, epidemiologists are
employing GIS technology to estimate pesticide exposures.
Finally, since crops planted can change from year to year, more precise crop maps for every
year are needed to accurately identify more precise locations for pesticide use. Identifying more
accurate crop fields and boundary conditions at the time of pesticide application utilizing satellite
images with high resolution (30 meters) could potentially improve prediction of chemical
movement in the environment, minimize the application of agricultural chemicals, and fine-tune
pesticide exposure estimates (Maxwell, Airola, & Nuckols, 2010). For these reasons, using GIS
and RS image time series to characterize crop management practices has the ability to enhance
the adequacy and reliability of pesticide exposure assessment.
D. Statement of the Purpose
The study’s purpose consists of two goals. The first goal is to investigate using geospatial
technology which industrial agricultural areas in the county are in close proximity to public
elementary school sites, and have the most potential for spray drift onto school property with
potential exposure to pre-adolescent children. As part of this geospatial investigation, attention
will be focused on agrochemical spatial distribution and possible off-target transport of
atmospheric pesticide clouds near public elementary schools. This initial examination involves
using a combination of geo-technologies and public data from the California Pesticide Use
Reporting (PUR) system, U. S. Census Bureau, County of Kern and the California Department of
Education for estimating potential public school children (K – 8th) exposure. The second goal is
5
Draft Thesis Proposal
to explore the potential for using satellite imagery and GIS to support pesticide exposure
assessment and agricultural operations in Kern County by evaluating temporal (multi-year)
variability of agricultural crop characterization for a select sample of major farm commodities.
As part of this examination, crop signatures validated or supported by California Department of
Water Resources (CDWR) land use (crop) survey maps will be integrated into a crop signature
library for future use in performing crop field matching and estimating crop maps in non-CDWR
land use survey years for the study area. This research involves integrating data from CDWR, the
California Pesticide Use Reporting (PUR) system and public domain satellite and aerial imagery
for Kern County.
E. Theoretical/Conceptual Framework
The U.S. Environmental Protection Agency (EPA) is the federal agency whose goal is to
safeguard public health and the environment from environmental stressors which are any
biological, physical, or chemical agent that can potentially lead to adverse environmental and
health impacts to ecosystems and humans (Zartarian & Schultz, 2010). EPA’s legislative
authority for protecting human health and the environment from unintended negative effects of
chemical and toxic substances stems from federal legislation such as the Federal Insecticide,
Fungicide, and Rodenticide Act of 1947 and the Toxic Substances Control Act of 1976 (U. S.
Environmental Protection Agency [USEPA], 1988). For this agency to meet its mission it has
established a general framework for exposure science and research (U.S. Environmental
Protection Agency [USEPA], 2009).
The USEPA has defined that vulnerability within the exposure research framework refers
to characteristics of a receptor (e.g., an individual, population or ecosystem) that places them at
6
Draft Thesis Proposal
increased risk of an adverse effect by a chemical, physical, or biological stressor (USEPA, 2009).
For evidence of an exposure, there needs to be contact (e.g., air, soil, water, food) between the
stressor and the receptor in both space and time (Zartarian, Bahadon, & McKone, 2005).
Typically, this involves contact with the visible exterior of a person such as the skin, and body
openings such as orifices and lesions (USEPA, 2009).
The patterns of pesticide exposure take the form of either direct or indirect routes. A direct
exposure typically occurs to persons who personally apply pesticides in agricultural,
occupational, or residential settings, and an indirect exposure is likely to occur through water,
air, dust, and food and represents routes of long-term, generally low-level exposures (Alavanja,
Hoppin, & Kamel, 2004).
A pesticide may be a chemical or biological substance used for preventing, destroying, or
repelling pests such as insects, animals and weeds by interfering with their metabolic processes
(Alavanja, Hoppin, & Kamel, 2004). Environmental hazard assessments in intensive agricultural
practices are profoundly shaped by the use and application of pesticides near vulnerable, receptor
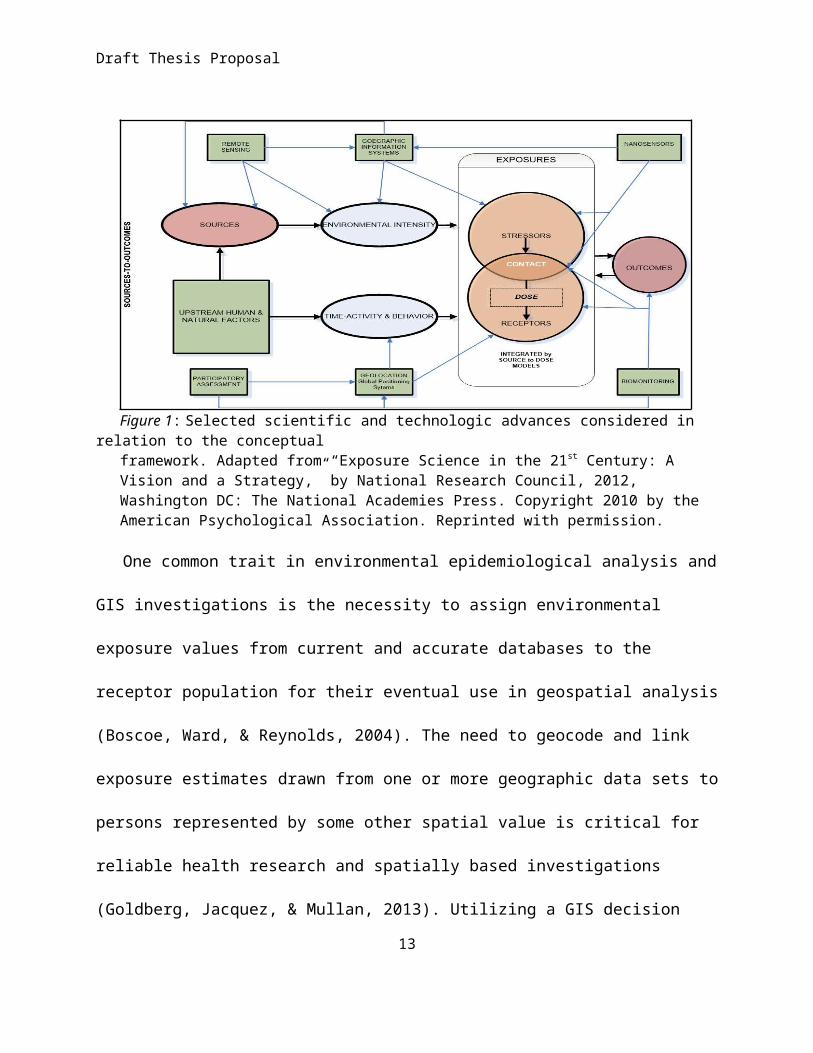
populations. The three major types of agrochemicals that contribute to atmospheric pesticide
contamination are herbicides, insecticides, and fungicides, and the atmosphere is considered as
the major pathway by which pesticides are transported and deposited in off-target areas
(Majewski & Capel, 1995). Figure 1 is an example of the receptor-based approach used in
exposure science which looks at different contaminants and concentrations that reach people
(National Research Council, 2012). In this source-to-outcome framework, GIS technologies can
be used in many steps from geographically identifying receptors exposed to agents in time and
7
Draft Thesis Proposal
space, to mapping agent sources, analyzing environmental intensity, and displaying patterns of
adverse health outcomes.
Figure 1: Selected scientific and technologic advances considered in relation to the conceptual framework. Adapted from “Exposure Science in the 21st Century: A Vision and a Strategy,” by National Research Council, 2012, Washington DC: The National Academies Press. Copyright 2010 by the American Psychological Association. Reprinted with permission.
One common trait in environmental epidemiological analysis and GIS investigations is the
necessity to assign environmental exposure values from current and accurate databases to the
receptor population for their eventual use in geospatial analysis (Boscoe, Ward, & Reynolds,
2004). The need to geocode and link exposure estimates drawn from one or more geographic
data sets to persons represented by some other spatial value is critical for reliable health research
and spatially based investigations (Goldberg, Jacquez, & Mullan, 2013). Utilizing a GIS decision
support approach in the environmental exposure assessment provides improvements in relation
to the conceptual framework such as the flexibility in the terms of the number and types of
exposure data the model can employ, the diversity of geographic objects that can be used with
the spatial intersection operations, the complex operations that can be utilized to generate
8
Draft Thesis Proposal
exposure estimates based on disparate criteria, and the array of options of combining per-area
spatial exposures into a single exposure for the individual (Goldberg, Cockburn, & Naito, 2013).
In addition to using GIS technology for tracking pesticide sources, concentrations and human
receptors, remote sensing (RS) has emerged as a vital technology in human health exposure
research. A primary contribution to the conceptual framework stemming from RS is its ability to
provide real-time information that can be used for crop management during the course of a
growing season. Examples of types of RS image analysis includes identifying crop field
boundaries and condition, crop classification, crop yield, and biophysical characterization
(Nellis, Price, & Rundquist, 2009). The environmental characterization of single and multiple
crop areas using RS before and after pesticide applications can enhance the exposure assessment
process and provide real-time knowledge for minimizing potential exposure effects within the
guidelines of the EPA source-to-outcome framework.
In short, the source-to-outcome framework reflects that chemical and biological agents are
primary stressors of concerns near sensitive and vulnerable populations, and human exposure
may differ based on various factors such as receptor population density, degree and source of
environmental intensity, and receptor time-activity and behavior. The geo-technology component
of this framework aids decision makers in many ways by ascertaining: geographical areas of
exposure, types of source contamination, the agrochemical fate and transport, environmental
hazard concentration, crop area characterization; and more effective agricultural surveillance
strategies.
F. Objectives, Hypothesis & Research Questions
9
Draft Thesis Proposal
The primary objective of this study is to improve scholarly understanding of pesticide
exposure from common farm chemical species applied to agricultural crops near sensitive and
vulnerable populations. This will be conducted by investigating industrial agricultural
applications near public elementary schools in the vicinity of Kern County, California by
estimating potential chemical exposure based on proximity to school sites and the integration of
crop specific land use coverage and PUR data for geospatial and agrochemical diffusion analysis.
The purpose of this objective is to develop a geospatial methodology for evaluating the
environmental risk of harmful agrochemical substances released from industrial agricultural
acreage in close proximity to public elementary schools. The research for this objective will
address the following questions. Which public elementary schools in a given year have had
agrochemicals of public health concern applied within the geography of risk zones, and which
school sites may have had human exposure to industrial agricultural pesticide applications?
The secondary objective is to determine the feasibility of integrating CDWR land use maps
(over 70 different crops or crop categories) and satellite data to derive Kern County crop maps
located in the vicinity of public elementary schools in time periods where public maps
identifying actually planted or cultivated crops are not generally available, which will allow for
appreciable improvements to chemical exposure estimation. The ensuing geo-technology
analysis will be used to mitigate the gaps in exposure assessment found in the spatial
epidemiological literature, specifically as it relates to exposure misclassification and crop
pesticide applications near schools. The purpose of this objective is to demonstrate the feasibility
of GIS and RS to provide improved agricultural surveillance and spatial resolution refinement
for pinpointing pesticide application areas (catchment delimitation) and land cover condition at
10
Draft Thesis Proposal
the crop field level. The research for this objective will address the following questions. Does
geospatial technology allow for integrating intermittent CDWR land use maps and satellite data
to derive crop maps in locations and time periods where intermittent state crop maps are
generally not available, and for downscaling crop-specific CPUR data from section-level to the
crop field-level?
G. Assumptions/Theoretical Limitations
The geographic scale for the study is focused at the valley portion of the county and school
site boundaries, and not necessarily at the individual census tract level. These geographies are
assumed as the appropriate scale of analysis for this study. The Euclidean distances used in this
study assume direct and/or indirect exposure to industrial agricultural pesticides primarily from
atmospheric deposition and inhalation by receptors (elementary school children). Pesticide
application restrictions for Kern County prevent applications of restricted materials (restricted
materials are pesticides deemed to have a higher potential to cause harm to public health, farm
workers, domestic animals, honeybees, the environment, wildlife, or other crops compared to
other pesticides) within a ¼ mile of schools that are in session or during school sponsored
activities when children are present (CEHTP, 2014).
11
Draft Thesis Proposal
Chapter 2
LITERATURE REVIEW
A. Agricultural Pesticide Risk in Environmental Health Research
Over the past decade, California’s multibillion-dollar irrigated agriculture has become more
environmentally sustainable with its regulatory leadership, reporting and state’s pesticide laws
formulated to reduce pesticide risks. However, problems relating to application of agricultural
chemicals and resulting drift residues still occur. Large-scale pesticide drift incidents have
transpired with disturbing regularity in recent years, frightening and sickening thousands of
Californians near agricultural fields (Harrison, 2011).
The problematic use of pesticides is firmly emphasized by Caroline Cox (1995), who
maintains that the management of pesticides threatens the quality and health of the environment
and is an ethical issue that farmers must confront. The costs of chemical poisoning and the
diversity of pesticide problems from aerial and ground applications are staggering, and spray
drift incidents over the years have subjected enormous numbers of people to toxic hazard
exposure without their consent and often without their knowledge.
Agricultural pesticide use in California is a common practice throughout the state’s
agricultural areas (Californians for Pesticide Reform, Pesticide Watch, and Center for
Environmental Health [CPR], 2010). The state’s high-value agriculture illustrates an industrial
approach to cropland production, which is notably evident in terms of its pesticide use.
California accounts for only 2 to 3 percent of all U.S. farmland, but historically utilizes
approximately 25 percent of the nation’s agricultural pesticides (Harrison, 2011).
12
Draft Thesis Proposal
Pesticide and volatilization drift can occur hours or even days following the initial
application (Majewski & Capel, 1995). When this happens, it can easily spread into the
environment where it can detrimentally affect human health through the contamination of the
atmosphere, soil, and water. Modeling of spray drift suggests that most deposition occurs within
five hundred meters (or about 1/3 mile) of the target application (Nuckols et al., 2007).
Regarding operational application of pesticides, aerial application has decreased due to
governmental restrictions as the potential for spray drift is greater than ground-based boom
sprayers (Matthews, 1999). Majewski and Capel (1995) recognizes that the highest pesticide
atmospheric concentrations usually are connected with locally used agrochemicals and are
seasonal in nature, and during these high-use periods, any regional and long-range atmospheric
inputs are typically insignificant in comparison and lost in the background.
There have been recent risk assessment studies demonstrating the association between
regional agricultural application quantities of organophosphates (toxic bug pesticide) and
measured air concentrations (Harnly et al., 2005). Pesticide volatilization from agricultural fields
constitutes a large source of potential human exposure, especially in children who are
particularly vulnerable to this type of inhalation which can lead to adverse effects in the
neurobehavioral development of fetuses and children (Harnly et al., 2005). Due to a child’s
developing physiological and metabolic systems, scientific evidence indicates that children are
the most susceptible to chemical toxicity from pesticides and the most likely to suffer irreparable
harm from exposure (Meade & Emch, 2010). Additionally, since 1998, numerous case-control,
cohort and ecological studies dealing with pesticide exposure have been published and the
13
Draft Thesis Proposal
majority of them have reported statistically significant increased risks between childhood
pesticide exposure and childhood cancer (Infante-Rivard & Weichenthal, 2007).
Pesticide investigations on the impacts of human health depend on good measures of
exposure to study health outcomes such as cancer. Zartarian et al. (2005) describes exposure
assessment as a process that determines the magnitude, frequency and duration of exposure to an
agent, along with the number and characteristics of the population exposed. This process is
normally a component of an overall human health risk assessment which is defined as the
characterization of the potential adverse health effects associated with human exposures to
chemical hazards (Asante-Duah, 2002).
Two important observations for environmental health investigations regarding large-scale
pesticide applications are that exposures may be from inhalation, dermal contact with soil or
dust, or ingestion via food or drinking water, and long-term health effects of residential
exposures to large-scale pesticide application is important to understand because it may identify
preventable causes of disease (Brody et al., 2002). Direct measurement of external pesticide
exposure from the air or from biological markers in the body are common methods for deriving
metrics for quantification of dose (Alavanja, Ward, & Reynolds, 2007). Moreover, bio-
monitoring or the measurement of pesticide metabolites in urine samples collected over multiple
24-hour time periods is considered the gold standard approach for estimating human exposure to
pesticides and other environmental contaminants (Meeker et al., 2005).
A common concern with human bio-monitoring is the fact that individuals usually do not
self-report pesticide exposures (Brody et al., 2002). Another concern is that environmental and
biological exposure measurements are expensive, and if there is noncompliance with study
14
Draft Thesis Proposal
protocols, population bio-monitoring may provide inadequate exposure assessment or
misclassification of dose concentration during the etiologic period of disease (Fortin, Carrier, &
Bouchard, 2008). Consequently, environmental assessments of possible long-term health effects
from exposures to historical large-scale pesticide use from agricultural applications in populated
land use areas pose unique difficulties. Faced with these assessment challenges, epidemiologists
often have relied on geographical proximity as a basic exposure surrogate indicating potential
contamination from chemically treated agricultural land without consideration for influencing
factors such as meteorology or topography.
B. Using GIS for Estimating Human Exposure to Environmental Hazards
As part of the geospatial technology approach to estimating pesticide exposure, a central goal
in spatial and environmental epidemiology research is to identify and describe locations of
populations at risk for increased exposure to a suspected environmental hazard that may lead to
an adverse health outcome (Cromley & McLafferty, 2012). The basic exposure assessment
process for quantifying pesticide exposures includes the following steps: defining the study
population, characterizing temporal variability in pesticide use patterns (especially in the event a
receptor (individual) was potentially exposed to more than one active ingredient), determining
the source of exposure which includes comprising the rate and method of application, and
identifying key factors of human exposure such as the distance from the person’s residence to the
chemical hazards (Nuckols et al., 2004; Franklin & Worgan, 2005; Lu et. al., 2000).
Different geographical contexts exist when analyzing environmental hazards with GIS for
exposure modeling. Cromley and McLafferty (2012), contributed to exposure science research
by offering the notion that there is a geographical variation in the distribution of pollution
15
Draft Thesis Proposal
sources and environmental quality, which means that conditions in these zones differentially
expose people to contaminants. Jerrett & Finkelstein (2005) suggest that the geography of risk is
the intersection of the geography of susceptibility (i.e., location of receptor population) and the
geography of exposure (i.e., location of source hazards). Consequently, a geo-technology
approach to agricultural pesticide exposure assessment concerning the geography of exposure
allows for integration of a variety of spatiality variables that can positively impact the estimation
exposure process including: historical reconstruction of pesticide use, current record of
exposures from hazardous chemicals, and crop-specific delineation of agricultural fields.
To facilitate historical research and public access to pesticide use data for health risk
assessments, the California Department of Pesticide Regulation (CDPR) began the PUR system
in 1990, legally requiring growers and applicators to report all agricultural pesticide use (Gunier
et al., 2001).The PUR data consists of active ingredient, pounds of pesticide applied, number of
acres and application date, type of crops farmed, application methods, and location (in square
mile sections) based on the Public Land Survey System (Reynolds et al., 2002). Since the
California PUR system is quite detailed and surpasses almost any other database in determining
the location of pesticide use, this database can be integrated into a GIS with crop maps to
estimate pesticide exposure within a user-specified buffer around a receptor location such as a
residence (Nuckols et al., 2007).
Methods were developed in the early 1990’s to quantify agricultural pesticide use density for
census-block groups using the annual California PUR data and GIS (Gunier et al., 2001). Gunier
et al. (2001) mapped the geographic distribution of pesticide use density by block groups using
the percentiles of the statewide distribution for all probable carcinogens, and indicated the
16
Draft Thesis Proposal
highest use areas were primarily in the Central Valley areas which correspond well with the
heaviest agricultural counties in the state based on farm revenue. Typical GIS steps required for
exposure estimation generally includes: creating catchment areas, obtaining exposure areas
(geographies of risk), calculating exposure per area, and combining each individual exposure
into a total exposure (Goldberg, Cockburn, & Naito, 2013). The generalized GIS processes for
completing many of these basic actions are geocoding, buffering, and intersection spatial overlay
operations.
The PUR data has also been used by researchers Bell, Hertz-Picatto, and Beaumont (2001) to
calculate exposure estimates for a case-control study of pesticides and fetal death due to
congenital anomalies. Bell, Hertz-Picatto, and Beaumont (2001) used two independent data sets
for this analysis. One set contained birth/fetal death certificates obtained from the California
State Vital Statistics Registry, including mother's address, cause of death, data on the pregnancy
and the parents, etc. The second set used California PUR data such as specific chemicals used,
amount applied, date and location for each application. By focusing on the period of fetal
development during the second trimester which is critical to determining the health outcome,
Bell, Hertz-Picatto, and Beaumont (2001) added a more refined approach to the timing of
exposure and vulnerability. This method provides an assessment of the likelihood of exposure
that is independent of the mother's recall and is specific to a time and place.
Rull et al. (2001) and Rull & Ritz (2003) derived a basic modeling approach for historical
exposures from residential proximity to pesticide applications based on the proportion of crop
acres treated, the application rate, and the application frequency. The model utilized two
datasets. One set was pesticide use data from the California PUR system, and the other set was
17
Draft Thesis Proposal
publicly available detailed California county land-use (LU) maps from the California
Department of Water Resources (CDWR). LU maps from CDWR have better resolution than
data maintained by CDPH since PUR data is only recorded at the coarse geographic scale of
approximately 2.6 km2 (one section mile in the PLSS). The LU maps provide better resolution for
identifying the actual spatial geometry of croplands in terms of which crops are grown within the
county, and from these maps which are generated every 5 to 7 years it can be determined which
pesticides were applied. LU maps were used by Rull et al. (2001) and Rull and Ritz (2003) to
increase the credibility of the modeling pesticide exposure estimates by providing finer spatial
and temporal resolution in the spatial overlay operations used for generating exposure estimates.
In addition to spatial overlay operations for estimating exposures, Nuckols et al. (2007)
introduced a novel buffer-based approach around a residence for pesticide exposure calculation
in conjunction with LU crop polygons and CPUR data. The densities used to generate exposure
estimates were calculated as proportions of the total LU polygon sections. Results from this
integrated crop map and CPUR exposure assessment study approach revealed the pesticide use
estimates differ greatly depending on the exposure metric (size of buffer) used and the spatial
scale at which exposure is estimated (Nuckols et al., 2007).
Zandbergen and Chakraborty (2006) advanced the buffer-based analysis by analyzing the
limitations of discrete buffer distances in proximity-based exposure analysis and noted that this
approach could introduce substantial bias in terms of determining the potentially exposed
population, since the results are strongly dependent on the chosen buffer distances which are
frequently arbitrarily designated. The use of multiple discrete buffer distances and cumulative
distribution functions (CDF) provide a more relevant representation of potentially exposed
18
Draft Thesis Proposal
populations, and does not a-priori assume that any particular distance is more pertinent than
another. The CDF research supports the notion that the use of aggregated data or the lack of
individual geocoded locations for potentially exposed populations may not necessarily lead to
uncertainty or error bias in exposure assessment.
C. Remote Sensing in Agriculture and Exposure Estimation
Nellis, Price, & Rundquist (2009) reveals that satellite remote sensing has been used in
agriculture since the 1920’s for crop inventory monitoring. By detecting electromagnetic
radiation, remote sensors can collect remotely sensed data via satellite and aircraft platforms that
can be used for crop condition estimates, yield forecasts, acreage estimates, crop
insect/pest/disease detection, crop biophysical characterization, irrigation management and
precision agriculture (Nellis, Price, & Rundquist, 2009). Remote sensing scientists have
developed vegetation indices (VI) as measures of canopy biophysical properties for evaluating
vegetative covers using spectral measurements (Jones & Vaughan, 2010). These indices
primarily make use of the fact that vegetation displays large differences in reflectance between
the near infrared and the visible bands, and monitoring the reflectance from these bands is one
way that researchers can determine vegetation health.
With public access to satellite imagery data such as Landsat or Aster, researchers can utilize
VI to ascertain the condition of agricultural land cover (e.g., bare soil, vegetation) at or near the
time of pesticide application which can potentially influence pesticide drift reduction practices
(Maxwell, Airola, & Nuckols, 2010). One common type of vegetation index to enhance spectral
response and image appearance is the normalized difference vegetation index (NDVI) which is a
numerical indicator that uses the visible and near-infrared bands of the electromagnetic spectrum
19
Draft Thesis Proposal
for analyzing remote sensing measurements, and for assessing whether the target being observed
contains live green vegetation or not (Jones & Vaughan, 2010). To classify different types of
vegetative cover, researchers generally rely on the use of spectral reflectance libraries for
discriminating between different types of vegetative canopies (Howard, Wylie, & Tiezen, 2013).
Land surface phenology which refers to the spatio-temporal development of the vegetative land
surface as revealed by satellite sensors, can provide metrics based on image time series of VI
such as onset of greening, onset of senescence, and growing season length (Hudson & Keatley,
2010).
Some of the most common satellites ranging in pixel resolutions from 15 meters to 500
meters are the Advanced Very High Resolution Radiometer also known as AVHRR (Satellite –
NOAA), Landsat Enhanced Thematic Mapper Plus also known as ETM+ (Satellite – Landsat 7),
Landsat Operational Land Imagery also known as OLI (Satellite – Landsat 8), Moderate
Resolution Imaging Spectroradiometer also known as MODIS (Satellite –Terra/Aqua), and
Advanced Spaceborne Thermal Emission and Reflection Radiometer also known as ASTER
(Satellite –Terra) (Reed, Schwartz, & Ziao, 2009). With these sensors, various methods of
classifying disparate land covers and uses within a sensed scene has been beneficial in land cover
classification in diverse areas such as agricultural land and the urban environment. Harris (2003)
presents evidence that by using a seven-vegetative-class scheme and the supervised classification
technique different crops could be effectively separated out for revealing agricultural land use
change in Oman.
Ward et al. (2000) demonstrates that remote sensing data and historical records on crop
location can be used to create historical crop maps in a feasibility study using U.S. Department
20
Draft Thesis Proposal
of Agriculture Farm Service Agency records as a source of ground reference data for classifying
a late summer south central Nebraska 1984 Landsat image into crop species within a three-
county area. The feasibility study identified general land cover types (rangeland and bare soil)
and four major crop types (corn, sorghum, soybeans, and alfalfa) with an overall accuracy of
78% for crops and 68% to 96% accuracy for land cover. Ward et al. (2000) revealed that crop
pesticides that were likely to have been applied can be estimated when information about crop-
specific pesticide use is available, and that by using a GIS, zones of potential exposure to
agricultural pesticides and proximity measures can be determined for residences.
Howard et al. (2013) developed a model for classifying major crops by identifying annual
spatial distributions and area totals of corn, soybeans, wheat and other crops over a nine year
period. Ten 250 meter resolution annual crop classification maps were produced for the Greater
Platte River Basin (covering parts of eight agricultural states) and evaluated from 2000 to 2009.
Using remotely sensed data sets from MODIS and other supporting environmental information,
Howard et al. (2013) showed that the model produced crop classification maps that closely
resembled the spatial distribution trends observed in the Federal National Agricultural Statistics
Service (NASS) Cropland Data Layer (CDL), and exhibited a strong statistical association with
county-by-county crop area totals from the U.S. Department of Agriculture census data.
Methodologies for reconstructing historical individual-level exposures to environmental
contaminants were developed for addressing the technical obstacle of linking space-time data
sets by using remotely sensed imagery with land use maps for assisting the study of adverse
health outcomes with long latency (Maxwell, Meliker, Goovaerts, 2010). Maxwell, Airola, and
Nuckols (2010) expanded the use of Landsat satellite data to support chemical exposure
21
Draft Thesis Proposal
assessment in California by defining the phenological characteristic of 17 major crop types and
for validating land use crop maps. The examination focused on the relationship between
pesticides used on crops grown near individual residences and potential adverse health outcomes
by intersecting Landsat time series with CDWR land use maps and selecting field samples to
define the phenological characteristics of major crop groups.
The combination of Landsat 5 and 7 image data benefits pesticide exposure assessment by
providing information on crops field condition at or near the time when pesticides are applied,
and furnishing information for validating the intermittent CDWR map for agricultural counties
(Maxwell et al., 2010). Landsat 8 imagery benefits crop monitoring with an improved duty cycle
that allows collection of a significantly greater number of images per day (Roy et al., 2014).
Using high resolution satellite imagery to ascertain the condition of agricultural land cover (e. g.,
bare soil, vegetation) at or near the time of chemical application is helpful in improving
efficiency of agricultural practices, and minimizing chemical applications and anticipating
potential pesticide drift.
Maxwell (2011) advanced pesticide exposure estimation by using RS and GIS technology to
downscale pesticide use data to crop field level in California instead of through direct bio-
measurement which is often expensive, difficult, or impossible to obtain, especially for
retrospective studies where data are collected only after study enrollment (i.e., post-diagnosis).
This was demonstrated by using a time series of Landsat imagery (resolution 30m) to establish
crop field boundaries and to acquire measures of vegetation greenness over the growing season
for each crop field within the PUR designated Section. The results were compared to a crop
signature library which was used to identify the specific field or fields where paraquat (highly
22
Draft Thesis Proposal
toxic herbicide) was applied to vineyard and cotton fields, thereby allowing for significant
improvements in rural residential-scale pesticide exposure estimation (Maxwell, 2011).
D. GIS Based Dispersion Modeling for Evaluating Exposure Risk
With the exception of persistent pesticides, the greatest pesticide concentration, both in air
and in rainwater, will typically be located in the immediate surroundings of the application area,
and the fate and transport of the pesticides is generally shaped by the meteorology and
physicochemical properties of the pesticide itself (Rathore & Nollet, 2012). Pistocchi (2014)
illustrates that since pesticides are applied once or a few times per year on a specific crop, the
total emission is concentrated in a short period and chemical mass in the environment tends to
disappear as time elapses from the period of emission (emissions or removal rates occur
cyclically in time and at sufficient time intervals for the chemical not to generally accumulate in
the environment). Additionally, Pistocchi (2014) notes that diffusion can be characterized as a
process by which a chemical tends to move from regions at higher concentration to regions of
lower concentration, and in the case of the atmosphere, the chemical is partitioned between a gas
phase and a particle phase.
Since industrial agrochemical pollution is derived from specific sources and usually spreads
out with progressively lower concentrations, showing considerable systematic spatial variation, a
GIS-based approach can be used to model and assess potential levels of exposure to
agrochemicals. Dispersion can often be modeled as a plume that typically shows a normal or
Gaussian distribution of concentration in the vertical and horizontal directions and is appropriate
when modeling in the near field (0-100km), since the plume imparts a lot of information about
23
Draft Thesis Proposal
the distribution of pollutant concentrations in the environment downwind of the source (Maantay
& McLafferty, 2011).
Geospatial analysis of chemical fate and transport data with a GIS may be vector or raster-
based and the correspondence between the distribution of chemicals (concentrations) and other
spatial data may be explored with three possible levels of GIS integration (Chang, 2014). For
example, one way to link GIS with another computer program is a loose coupling which involves
transfer of data fields between the GIS and other modeling (dispersion) programs. Another
approach to integrate GIS with another modeling program is a tight coupling which gives the
GIS and other programs a common user interface. Finally, an embedded system which bundles
the GIS and an extension program with shared memory and a common interface is the third
scenario for coupling GIS with another program.
An example of a loose coupling integration pollution modeling program is AERMOD (air
dispersion (empirical) modeling system) which has been used in conjunction with a GIS to study
air contaminants (Maantay & Maroko, 2009).Typical model data inputs for AERMOD include
source, receptor, site, meteorological, terrain, and dispersion (downwash related information).
An example of a tight coupling integration with GIS for modeling spray drift deposition is
AgDrift (mechanistic modeling program) in conjunction with Spraytran (a combined source-term
and air dispersion model to simulate regional transport of aerially applied pesticides) which has
the ability to assess and compute the downwind drift and deposition of pesticides and the
magnitude of buffer zones needed to protect sensitive receptor populations (Thistle, et al., 2005).
Common model data inputs for Ag Drift and Spraytran includes similar inputs to AERMOD, as
well as flight path, spray nozzles, drop size distributions, and spray material properties. An
24
Draft Thesis Proposal
example of embedded GIS functionality for possible use with chemical pollution modeling
includes ArcGIS extensions such as spatial analyst, geostatistical analyst, and Spray Advisor.
Typical model data sources for using embedded GIS functions for atmospheric pesticide
pollution modeling are source emissions, release height, ambient meteorology, surface area,
vegetation, spray droplet sizes, estimated swath width, elevation/terrain, hydrological and land
use (Pistocchi, 2014; Strager, 2005).
E. Summary
The literature provides support that GIS and RS are well suited for examining spatially
related environmental health issues from many different perspectives. It indicates the necessity
and practicality for using geospatial methodologies in environmental health research, and more
importantly in supporting pesticide application and exposure surveillance/estimation when
dealing with potential adverse health impacts affecting vulnerable populations such as
elementary school children. California stands out as an excellent laboratory for conducting this
type of future research since the state collects monthly PUR data from each county. The PUR
data which is provided by growers and applicators through the County Agricultural
Commissioner (CAC) is uniquely applicable for pesticide health risk assessments (Gunier et. al.,
2001).
The interest for geospatial technologies in environmental epidemiology is emerging based on
the various studies conducted to date that have shown to improve the exposure assessment
process (Zandbergen & Chakraborty, 2006). This interest is also attributed to the capabilities
exhibited in geospatial technologies such as: the integration of multiple data sources (e.g.,
location of pollution sources and population characteristics), representation of geographic data in
25
Draft Thesis Proposal
map form, geostatistical analysis and modeling (e.g., linking exposure with health data for
surveillance), and the application of various techniques (e.g., buffering, overlay) for proximity
analysis (Zandbergen & Chakraborty, 2006).
GIS coupled with diffusion modeling which takes into account meteorological conditions,
characteristics of the emission sources, and the effect of the surrounding built environment is a
logical evolving approach for assessing potential agrochemical exposure. GIS can be used in
combination with dispersion models to simulate the ways in which agrochemical contaminants
propagate in the environment, and maps of iso-risk contours, environmental characteristics and
receptors can be displayed for more refined geospatial analysis (Maantay & McLafferty, 2011).
Moreover, the innovative use of RS by researchers to define phenological characteristics of
major types of crop groups, reconstructing individual-level exposures to environmental
contaminants, and downscaling pesticide use data to the crop field level has created new
opportunities to conduct this type of advanced research without direct human receptor
measurement which is often expensive (Maxwell, 2011).
The exposure science literature reflects that pesticide exposure investigation and assessment
are being successfully undertaken with emerging and innovative geospatial methods within
spatial epidemiological research. However, a major gap in the geospatial health assessment
research literature is the lack of epidemiological information on school proximity to potential
agricultural pesticide exposures and its health effects. There is a need to understand what kinds
of pesticides are being applied near schools and their cumulative health risks, which in turn may
inform future decision-making around school siting, pesticide permitting regulations, or other
policies with the potential to affect public health (CEHTP, 2014). A geo-technology based
26
Draft Thesis Proposal
evaluation method for assessing pesticide exposure near public school sites and minimizing
pesticide spray drift through better crop surveillance/monitoring can help alleviate this gap.
Chapter 3
27
Draft Thesis Proposal
METHODOLOGY
The general strategy for conducting this geospatial study within Kern County, California is
composed of multiple steps. These steps include: 1) identifying a subset of public elementary
school sites with nearby high agricultural pesticide use that are within the geographies of risk
(school sites within discrete buffers/zones are assumed to be associated with potential
agricultural pesticide exposure); 2) identifying groupings of agrochemicals likely to be
environmentally detrimental to children’s health connected to the geographies of risk; and 3)
linking the PUR results with geographically-enhanced school location data (e. g., pounds of
active ingredients of agricultural pesticide potentially applied within the school site boundaries)
including school site demographics (e. g., total number of enrolled students, racial/ethnic
distribution, and percentage of students eligible to participate in the Free and Reduced Price
Meals Program) for modeling and mapping of school populations within the geographies of risk
(the intersection of the location of receptor populations and the location of source hazards). At
least two buffer zones of risk will be used for selecting receptors from school sites for pesticide
dispersion modeling.
Additional actions required for this GIS temporal-spatial study involves using publicly
available Landsat or ASTER satellite-borne imagery in conjunction with CDWR land use
(ground reference crop) maps, PUR data, and aerial photography for the feasibility of deriving
properly delineated crop field exposure boundaries and crop area (land cover) conditions for
facilitating industrial agricultural pesticide application near schools. The RS research conducted
for this portion of the study will cover land characterizing and downscaling of sample crop
populations from at least two distinct growing seasons in non-sequential years.
28
Draft Thesis Proposal
A. Population and Sample
The initial group population for pesticide risk mapping and diffusion modeling will consist of
public elementary school sites with enrolled students during the 2010 school year (kindergarten
through 8th grade) in the valley portion of Kern County. The sample student population and
school sites for agrochemical risk mapping and diffusion prediction will be from schools that had
pesticide active ingredients applied within the geography of restricted zone (1/4 mile or 400 ±
meters). An additional sample of student population and school sites for agrochemical risk
mapping and diffusion prediction will be from schools that had pesticide active ingredients
applied within 2/3 miles (1000 ± meters) of a classroom area since most aerial pesticide
applications can drift between 500 and 1,000 meters and boom-sprayers can drift between 300 to
800 meters (Ward et al. 2000).
Additional geography risk zone parameters, depending on circumstances, may be identified
by discrete buffer analysis using Euclidean distances for determining sample sites/populations
for diffusion modeling. Figure 2 depicts the geographical school boundaries for the county.
29
Draft Thesis Proposal
Figure 2: Kern County Public Elementary School Boundaries
A second population used in this geospatial study will be for demonstrating the feasibility for
downscaling California pesticide use data to the crop field-level which will be composed of
specific Kern County agricultural commodities grown in 1998 and 2006. Using the 1998 and
2006 CDWR land use (crop) maps for Kern County, Landsat or ASTER imagery, and results
from the school proximity risk analysis, the sample population target area will be irrigated crops
that are grown within the geography of risk of a public elementary school that is potentially
exposed to pesticides with active ingredients. A stratified random sample approach will be
undertaken to select about 15 to 30 polygons designated as single cropped or multi-cropped as
representative of the possible crops grown near elementary schools impacted with potential
pesticide drift deposition. Focus will be on polygons at least 200 feet in width and about10 acres
in area and considered a specific crop type (e. g., vineyard, cotton, or citrus). Based on the 1998
and 2006 CDWR crop maps, polygons labeled with a general crop class (e. g., field crop), or
30
Draft Thesis Proposal
labeled as double-cropped, inter-cropped, or mixed land use will not be used. For practical
application and illustrative purposes, a comparable crop characterization analysis and
downscaling of 2010 PUR data to sample crop (field- level) sites near public elementary schools
with potential pesticide exposure will be undertaken using satellite imagery, County of Kern
aerial photography and agricultural maps from the County of Kern Agricultural Commissioner.
B. Setting
Located at the southern end of California’s fertile Central Valley, Kern County is 8,131
square miles of valley, high desert, and mountain communities. Kern County is a leading
petroleum-producing county and consistently ranks among the most-productive agricultural
counties in the United States. Total agricultural production was valued over $6.2 billion in 2012
(Kern County Agricultural Crop Report, 2012) (Figure 3).
31
Draft Thesis Proposal
Figure 3: Study Area - Kern County, CA
In 2011, Kern County had about 851,710 residents. Also, there were about 156 public
elementary schools and 45 middle schools (a total of 201 schools), serving a total of about
119,529 students in 2011 (CAPK, 2013). About 54% of these public elementary schools (109 ±)
are located in the valley portion of the county.
C. Measurement Methods
As part of the procedures and measurement methods for analyzing the potential pesticide
exposure from spray drift on nearby elementary school populations, geo-referencing and geo-
coding will be performed to confirm spatial and demographic characteristics assigned to
elementary school sites which will allow for geography of risk analysis in conjunction with PUR
data. School site boundaries and centroids will be acquired for location accuracy to be used in
conjunction with proximity/buffer and dispersion analysis for determining potential sources of
adjacent industrial agricultural spray drift emissions and zones of risk.
32
Draft Thesis Proposal
Agricultural county parcel, meteorological, topographical and land use data will also be
downloaded for diffusion prediction and spatial overlay analysis. Integrated air dispersion and
spray drift modeling software for predicting near-field spraying deposition and plume buffers in
conjunction with ArcGIS extensions such as spatial and geostatistical analysts will be utilized as
needed for ascertaining the amount of diffusion/concentration of spray deposition to nearby non-
target (school) sites. Key model input characteristics for measuring the degree of potential spray
drift will be determined by topography (terrain, buildings), and application method (ground spray
boom, aerial). In addition, meteorology will be incorporated into the analysis as needed using an
empirical or mechanistic atmospheric dispersion model with data from National Oceanic and
Atmospheric Administration’s (NOAA) Climatic Data Center and its weather and climate toolkit
(independent platform software with output formats compatible with ArcGIS).
For measuring the ability of using satellite data to support pesticide exposure assessment
such as identifying potential pesticide use at the crop field-level, the study will analyze PUR, and
satellite image time series (30m) data, and establish a crop signature library. Since Landsat
imagery is available free of charge and is very robust, it is ideally suited for agricultural and
epidemiological studies requiring frequent measures of land cover conditions at 30 meter
resolution. ASTER imagery is available at no cost (continental U.S. and territories) with similar
high resolution and has ten spectral bands but may be limited in certain instances (not as many
scenes) for historical use (Gao, 2009). Remotely sensed imagery in conjunction with ERDAS
Imagine/IDRISI Selva, and ArcGIS software, will be used to identify and measure sample
cultivated agricultural boundaries and acquire measurements of vegetation greenness over the
growing season for specified crop fields identified at the crop section-level PUR boundary.
33
Draft Thesis Proposal
Satellite imagery typically containing cloud cover will not be used which normally coincides
with winter months in the County such as November through February. NDVI typically derived
from the red visible Band 3 and near infrared Band 4 will be used to measure and characterize
crop phenology. Lastly, to verify satellite image processing results, CDWR land use surveys and
California PUR data for the county will also be used for historical ground reference measurement
of sample cultivated crops and/or crop categories grown in 1998 and 2006.
D. Plan for Data Collection
Selection of school sites will be public elementary schools (kindergarten through 8th grade) in
Kern County. School boundaries, school centroids, and census demographics, are publicly
available from the CDE in a database format and from the county and federal governments in a
GIS format. However, the school point and polygon location data may be occasionally
problematic, attributable to geocoding or address reporting errors. Enhancement of school
boundary data via geocoding addresses and by visual verification and by importing geocoded
points into ArcGIS and overlaid with county assessors’ parcel data is planned. Google Street
View in conjunction with basemap and satellite imagery from Google and Bing as well as
County aerial photography will be used to quality control check school properties and
boundaries. In the event school boundary editing is needed, it will be reviewed in conjunction
with county assessor parcel data before finalizing school property locations.
Publicly available PUR data and agricultural crop information will be electronically retrieved
from the State of California Department of Pesticide Regulation and the County of Kern
Department of Agriculture and Measurement for the years 1998, 2006, and 2010. County street
centerline and parcel boundary data will be digitally acquired from the County of Kern Public
34
Draft Thesis Proposal
Works Department. After school boundary and PUR data are downloaded and finalized for the
study area (valley portion of the county), they will be linked geographically to determine what
kinds and how many pounds of pesticides were applied near public schools that are in the
geography of risk zones. In addition, environmental media data such as meteorological,
topographical/terrain, and land use/land cover, will be collected from public data sources
(county, state, and federal governments) for use in dispersion modeling and buffer analysis of
pesticide deposition for exposure estimation .
Finally, state CDWR land use maps for Kern County will be electronically retrieved for
ground referencing in addition to County aerial photography from the Kern County Council of
Governments. Kern County satellite imagery such as Landsat 5, 7, 8 and/or ASTER images for
the years 1998, 2006 and 2010 will be reviewed and analyzed for possible downloading from the
U.S. Geological Survey (USGS). School data collected in the previous components of this study
will be integrated as needed with imagery data collection for crop map derivation and
characterization. Lastly, the author of this study will be solely responsibility for collecting and
examining this data.
E. Plan for Data Analysis
Modeled exposure rates for relative risk of agrochemical contamination will be analyzed
using GIS in conjunction with dispersion software. Agricultural pesticide use data and respective
school location data will be analyzed using exploratory spatial data analysis with ArcGIS Model
Builder, ArcGIS spatial and geostatistical analyst’s toolset, and SPSS/Excel. Exploratory data
analysis will also investigate for spatial autocorrelation (Moran I), hotpot analysis (Getis-Ord
35
Draft Thesis Proposal
Gi*), cluster and outlier analysis (Anselin local Moran’s I), and spatial pattern (smoothing/trend
surface analysis).
Figure 4 is an evaluation method procedure for analyzing geospatial data for this portion of
the research design.
Figure 4: Dispersion evaluation method procedure
For the agricultural remote sensing analysis of the study, satellite imagery for two respective
time periods (1998 and 2006) will be clipped to the study area boundaries. Specific targeted
school sites with nearby agrochemical emission sources will be merged and examined for
sampling. An unsupervised and/or calculating supervised classification will be conducted on
designated satellite imagery scenes within the agricultural portion (valley) of the county for
certain selected crops. Comparing 1998 and 2006 California DWR's land use (crop) surveys
(GIS format) against satellite imagery for the same time period and location, training samples for
36
Draft Thesis Proposal
a known crop will be identified and collected. Training samples for each respective year for a
sample of specific farm commodities will be analyzed through histograms, scatterplots, and band
statistics. Using an interactive supervised classification the digital mage will be classified
including post-classification processing. Finally, a maximum likelihood classification based on
spectral signatures will be created.
To distinguish between the types of vegetative crops, greenness and brightness of vegetation
will be assessed in the designated RS scenes. The tasseled cap transformation and multiple
NDVI’s will be considered for calculating, analyzing and mapping vegetation and creating a
measure of greenness. NDVI from various study years will be qualitatively and quantitatively
compared using image statistics. Vegetation types will be isolated and NDVI from different crop
types will be compared. Lastly, crop signatures validated or supported by CDWR land use maps
will be integrated into the crop signature library for future use in performing crop field matching
and deriving crop maps in non-CDWR land use survey years. `In addition, validated crop field
signatures will be reviewed for estimating and characterizing land cover condition at the time of
pesticide application which could be helpful in facilitating efficient pesticide application near
schools with the most potential for spray drift onto school property.
Figure 5 is an evaluation method procedure for analyzing geospatial data for this portion of
the research study.
37
Draft Thesis Proposal
Figure 5: Crop field downscale evaluation method procedure
F. Limitations
The pesticide off-target spray/volatilization drift exposure results by discrete buffer/plume
analysis and dispersion prediction are assumed as adequate proxies for estimating potential
exposure to the target population. However, this study does not actually determine if school
children were actually exposed in these areas. Human bio-monitoring of impacted school
populations following approved public health protocols would be the proper mechanism to
validate the actual research findings concerning pesticide risk zones and exposed receptors.
Additionally, the methodology for dispersion modeling had the following limitations: 1)
pesticide transport pathway for this study is generally limited to atmospheric (air), and other
environmental media (e. g., soil, water, ingestion via food, etc.) contamination pathways was not
38
Draft Thesis Proposal
directly programmed into the modeling and analysis; 2) meteorology and source emissions were
simplified with no significant turbulence distance downwind prediction; 3) dry weather
agrochemical application (no pesticide spraying during inclement weather); and 4) generally
smooth (minor relief) surface (valley terrain) agricultural planting schemes for irrigated row
crops.
39
Draft Thesis Proposal
Works Cited
Alavanja, M. C., Hoppin, J., & Kamel, F. (2004). Health effects of chronic pesticide exposure:
Cancer and neurotoxicity. Annual Review of Public Health, 25, 155-197.
Alavanja, M. C., Ward, M. H., & Reynolds, P. (2007). Carcinogenicity of agricultural pesticides
in adults and children. Journal of Agromedicine, 12(1), 39-56.
Asante-Duah., K. (2002). Public Health Risk Assessment for Human Exposure to Chemicals (1st
ed.). Dordrecht, Netherlands: Kluwer Academic Publishers.
Bell, E. M., Hertz-Picciotto, I., & Beaumont, J. J. (2001, September). A case-control study of
pesticides and fetal death due to congenital anomalies. American Journal of
Epidemiology, 148-156.
Boscoe, F. P., Ward, M. H., & Reynolds, P. (2004, December1). Current practices in spatial
analysis of cancer data: data characteristics and data sources for geographic studies of
cancer. International Journal of Health Geographics, 3(28).
Brody, J. G., Vorhees, D. J., Melly, S. J., Swedis, S. R., Drivas, P. J., & Rudel, R. A. (2002).
Using GIS and historical records to reconstruct residential exposure to large-scale
pesticide application. Journal of Exposure Science and Environmental Epidemiology,
12(1), 64-80.
California Environmental Health Tracking Program. (2014). Agricultural Pesticide Use Near
Public Schools in California. Retrieved from http://cehtp.org/page.jsp?page_key=1040
Californians for Pesticide Reform, Pesticide Watch, Center for Environmental Health. (2010).
Pesticide Protection Zones: Keeping Kids Safe at School [Policy Report]. Retrieved from
http://www.pesticidereform.org/downloads/SchoolProtectionZones.pdf
40
Draft Thesis Proposal
Chang, K., (2012). Introduction to Geographic Information Systems (6th ed.). New York, New
York: The McGraw-Hill Companies.
Community Action Partnership of Kern (CAPK). (2013). Head Start & Early Head Start
Program 2013 Community Assessment Update [Annual Report]. Retrieved from
http://www.capk.org/store/files/145.pdf
Cox, C. (1995, Spring). Indiscriminately from the skies. Journal of Pesticide Reform, 15(1), 2-7.
Cromley, E. K., & McLafferty, S. L. (2012). GIS and Public Health (2nd ed.). New York, New
York: The Guilford Press.
Fortin, M. C., Carrier, G., & Bouchard, M. (2008, November 8). Concentrations versus amounts
of biomarkers in urine: a comparison of approaches to assess pyrethroid exposure.
Environmental Health, 7, 55-68. Retrieved from http://dx.doi.org/doi:10.1186/1476-
069X-7-55
Franklin, C. A., & Worgan, J. P. (Eds.). (2005). Occupational and residential exposure
assessment for pesticides. Chichester, UK: John Wiley & Sons, Ltd.
Gao, J. (2009). Digital Analysis of Remotely Sensed Imagery. New York, NY: McGraw-Hill
Companies, Inc.
Gao, J., Wang, Y., Gao, B., Wu, L., & Chen, H. (2012). Pesticides - Evaluation of
Environmental Pollution. H. S. Rathore, & L. M. Nollet (Eds.). Bacon Raton, FL: CRC
Press.
Goldberg, D. W., Cockburn, M. G., & Naito, A. T. (2013). Spatial Overlays. In F. P. Boscoe
(Ed.), Geographic Health Data - Fundamental Techniques for Analysis (pp. 87-104).
Oxfordshire, UK: CABI.
41
Draft Thesis Proposal
Goldberg, D. W., Jacquez, G. M., & Mullan, N. (2013). Geocoding and Health . In F. P. Boscoe
(Ed.), Geographic Health Data - Fundamental Techniques for Analysis (pp. 51-71).
Oxfordshire, UK: CABI.
Gunier, R. B., Harnly, M. E., Reynolds, P., Hertz, A., & Behren, J. V. (2001). Agricultural
pesticide use in California: Pesticide prioritization, use densities, and population
distributions for a childhood cancer study. Environmental Health Perspectives, 109(10),
1071-1078.
Harnly, M., McLaughlin, R., Bradman, A., Anderson, M., & Gunier, R. (2005). Correlating
agricultural use of organophosphates with outdoor air concentrations: A particular
concern for children. Environmental Health Perspectives, 113(9), 1184-1189.
Harris, R. (2003). Remote sensing of agricultural change in Oman. International Journal of
Remote Sensing, 24(23), 4835-4852.
Harrison, J. L. (2011). Pesticide drift and the pursuit of environmental justice (1st ed.). London,
England: The MIT Press.
Howard, D. M., Wylie, B. K., & Tiezen, L. L. (2013). Crop classification modelling using
remote sensing and environmental data in the Greater Platte River Basin, USA.
International Journal of Remote Sensing, 33, 6095-6108.
Hudson, I. L., Keatley, M. R. (2010). Phenological Research: Methods for Environmental and
Climate Change Analysis. New York, New York: Springer
Infante-Rivard, C., & Weichenthal, S. (2007). Pesticides and childhood cancer: an update of
Zahm and Ward’s 1998 review. Journal of Toxicology and Environmental Health, 10,
81-99.
42
Draft Thesis Proposal
Jerrett, M., & Finkelstein, M. (2005). Geographies of risk in studies linking chronic air pollution
exposure to health outcomes. Journal of Toxicology and Environmental Health, Part A,
68(13-14), 1207-1242.
Jones, H. G., & Vaughan, R. A. (2010). Remote Sensing of Vegetation (1st ed.). New York, New
York: Oxford University Press.
Kern County Department of Agriculture and Measurement Standards. (2012). 2012 Kern County
Agricultural Crop Report [Annual Report]. Retrieved from
http://www.kernag.com/caap/crop-reports/crop10_19/crop2012.pdf
Lu, C., Fenske, R. A., Simcox, N. J., & Kalman, D. (2000). Pesticide exposure of children in an
agricultural community: Evidence of household proximity to farmland and take home
exposure pathways. Environmental Research, 84, 290-302.
Maantay, J. A., & McLafferty, S. (2011). Geospatial analysis of environmental health (1st ed.).
New York, New York: Springer.
Maantay, J. A., Tu, J., & Maroko, A. R. (2009, February). Loose-coupling an air dispersion
model and a geographic information system (GIS) for studying air pollution and asthma
in the Bronx, New York City. International Journal of Environmental Health Research,
19(1), 59-79.
Majewski, M. S., & Capel, P. D. (1995). Pesticides in the Atmosphere. Chelsea, Michigan: Ann
Arbor Press, Inc.
Matthews, G. A., (1999). Application of Pesticides to Crops. Covent Garden, London: Imperial
College Press.
43
Draft Thesis Proposal
Maxwell, S. K. (2011, August 25). Downscaling pesticide use data to the crop field level in
California using Landsat satellite imagery: Paraquat case study. Remote Sensing, 3(9),
1805-1816.
Maxwell, S. K., Airola, M., & Nuckols, J. R. (2010, September 16). Using Landsat satellite data
to support pesticide exposure assessment in California. International Journal of Health
Geographics, 9(46), 1-14.
Maxwell, S. K., Meliker, J. R., & Goovaerts, P. (2010, February 25). Use of land surface
remotely sensed satellite and airborne data for environmental exposure assessment in
cancer research. Journal of Exposure Science and Environmental Epidemiology, 20(2),
176-185.
Meade, M. S., & Emch, M. (2010). Medical geography (3rd ed.). New York, New York: The
Guilford Press.
Meeker, J. D., Barr, D. B., Ryan, L., Herrick, R. F., Bennett, D. H., Bravo, R., & Hauser, R.
(2005, September 1). Temporal variability of urinary levels of nonpersistent insecticides
in adult men. Journal of Exposure Analysis and Environmental Epidemiology, 15, 271-
281.
National Research Council. (2012). Exposure Science in the 21st Century: A Vision and a
Strategy. Washington, DC: The National Academies Press.
Nellis, M. D., Price, K. P., & Rundquist, D. (2009). Remote sensing of cropland agriculture. In
T. A. Warner, M. D. Nellis, & G. M. Foody (Eds.), The Sage handbook of remote sensing
(1st ed., pp. 368-380). London, England: SAGE Publications Ltd.
44
Draft Thesis Proposal
Nuckols, J. R., Gunier, R. B., Riggs, P., Miller, R., Reynolds, P., & Ward, M. H. (2007, May).
Linkage of the California pesticide use reporting database with spatial land use data for
exposure assessment. Environmental Health Perspectives, 115(5), 684-689.
Nuckols, J. R., Ward, M. H., & Jarup, L. (2004, June 2004). Using geographic information
systems for exposure assessment in environmental epidemiology studies. Environmental
Health Perspectives, 112(9), 1007-1015.
Oregon Toxics Alliance. (2008). Warning! Hazards to Children - Pesticides in Our Schools.
Retrieved from
http://www.beyondtoxics.org/wp-content/uploads/2011/11/PesticidesInOurSchools_Repo
rtWithMaps_2008.pdf
Owens, K., & Feldman, J. (2004). Getting the Drift on Chemical Trespass [Entire issue].
Pesticides and You, 24(2).
Pistocchi, A. (2014). GIS Based Chemical Fate Modeling (1st ed.). Hoboken, New Jersey: John
Wiley & Sons, Inc.
Rathore, H. S., & Nollet, L. M. (2012). Pesticides: Evaluation of Environmental Pollution (1st
ed.). Boca Raton, Florida: CRC Press.
Reed, B. C., Schwartz, M. D., & Xiao, X. (2009). Remote sensing phenology: status and the way
forward. In A. Noormets (Ed.), Phenology of Ecosystem Processes (1st ed. (pp. 231-246).
London, England: Springer.
Reynolds, P., Behren, J. V., Gunier, R. B., Goldberg, D. B., Hertz, A., & Harnly, M. E. (2002,
February 14). Childhood cancer and agricultural pesticide use: An ecologic study in
California. Environmental Health Perspectives, 110(3), 319-324.
45
Draft Thesis Proposal
Roberts, J. R., & Karr, C. J. (2012, December 6). Pesticide exposure in children. Pediatrics, 130,
1764-1788.
Roberts, J. R., & Reigart, J. R. (2013). Recognition and Management of Pesticide Poisonings.
Retrieved from http://www2.epa.gov/pesticide-worker-safety/pesticide-poisoning-
handbook-table-contents
Roy, D. P., Wulder, M. A., Loveland, T. R., Woodcock, C. E., Allen, R. G., Anderson, M. C., …
Zhu, Z. (2014, April). Landsat-8: Science and product vision for terrestrial global change
research. Remote Sensing of the Environment, 145, 154-172.
Rull, R. P., & Ritz, B. (2003, October). Historical pesticide exposure in California using
pesticide reports and land-use surveys: an assessment of misclassification error and bias.
Environmental Health Perspectives, 111(13), 1582-1589.
Rull, R. P., Ritz, B., Krishnadasan, A., & Maglinte, G. (2001, July 9-13). Modeling historical
exposures from residential proximity to pesticide applications. In: Proceedings of the
Twenty-First Annual ESRI User Conference, San Diego, California.
Strager, J., (2005, October). Spray Advisor. Paper presented at the Deposition Modeling for Risk
Assessment and Decision Support Workshop, Waikoloa, HI.
Thistle, H. W., Teske, M. E., Droppo, J. G., Allwine, J. A., Bird, S. L., Londergan, R. J. (2005,
July). AGDISP as a source term in far field atmospheric transport modeling and near
field geometric assumptions. Paper presented at the American Society of Agricultural and
Biological Engineers Annual Meeting, Tampa, FL.
U.S. Environmental Protection Agency . (2013). Recognition and Management of Pesticide
Poisonings (735K13001). Retrieved from
46
Draft Thesis Proposal
http://www2.epa.gov/pesticide-worker-safety/recognition-and-management-pesticide-
poisonings
U.S. Environmental Protection Agency. (1988). Environmental Progress and Challenges: EPA’s
Update. Berkley, California: University of California Libraries.
U.S. Environmental Protection Agency. (2009). A Conceptual Framework for U.S. EPA’s
National Exposure Research Laboratory (NTIS PB2010-103951). Retrieved from
http://cfpub.epa.gov/si/si_public_record_report.cfm?
dirEntryId=203003&fed_org_id=770&SIType=PR&TIMSType=Published+Report&sho
wCriteria=0&address=nerl/
pubs.html&view=citation&sortBy=pubDateYear&count=100&dateEndPublishedPresent
ed=12/31/2009a
Ward, M. H., Nuckols, J., Weigel, S. J., Maxwell, S. K., Cantor, K. P., & Miller, R. S. (2000,
January). Identifying populations potentially exposed to agricultural pesticides using
remote sensing and a geographic information system. Environmental Health
Perspectives, 108(1), 5-12.
Wishtoyo Foundation. (2003). Agritoxins: Ventura County’s Toxic Time Bomb [Research paper].
Retrieved from http://www.environmentnow.org/pdf/Wishtoyo-Agritoxins-Report.pdf
Zandbergen, P. A., & Chakraborty, J. (2006, May 25). Improving environmental exposure
analysis using cumulative distribution functions and individual geocoding. International
Journal of Health Geographics, 5(23).
Zartarian, V., Bahadon, T., & McKone, T. (2005). Adoption of an official ISEA glossary.
Journal of Exposure Analysis and Environmental Epidemiology, 15, 1-5.
47
Draft Thesis Proposal
Zartarian, V. G., & Schultz, B. D. (2010, June). The EPA’s human exposure research program
for assessing cumulative risk in communities. Journal of Exposure Science and
Environmental Epidemiology, 20(4), 351-358.
48