ucla thesis_vrsalovich_condensed
TRANSCRIPT

An evaluation of the potential for concurrent droughts on Southern California’s imported water supplies
By John P. Vrsalovich
Abstract In this paper, the potential effects of concurrent droughts on Southern California’s imported water supplies is discussed. This potential for concurrent droughts is examined statistically comparing the historical streamflow of the three major imported water sources: the Sacramento River Basin in Northern California , the Colorado River, and the Mono / Owens River Basins. The intent is to determine, utilizing a cross correlation approach, whether or not historical drought events coincide over these three sources. The results of this cross correlation lay the framework for a projected water balance for the region for the years 2001 through 2025. Introduction
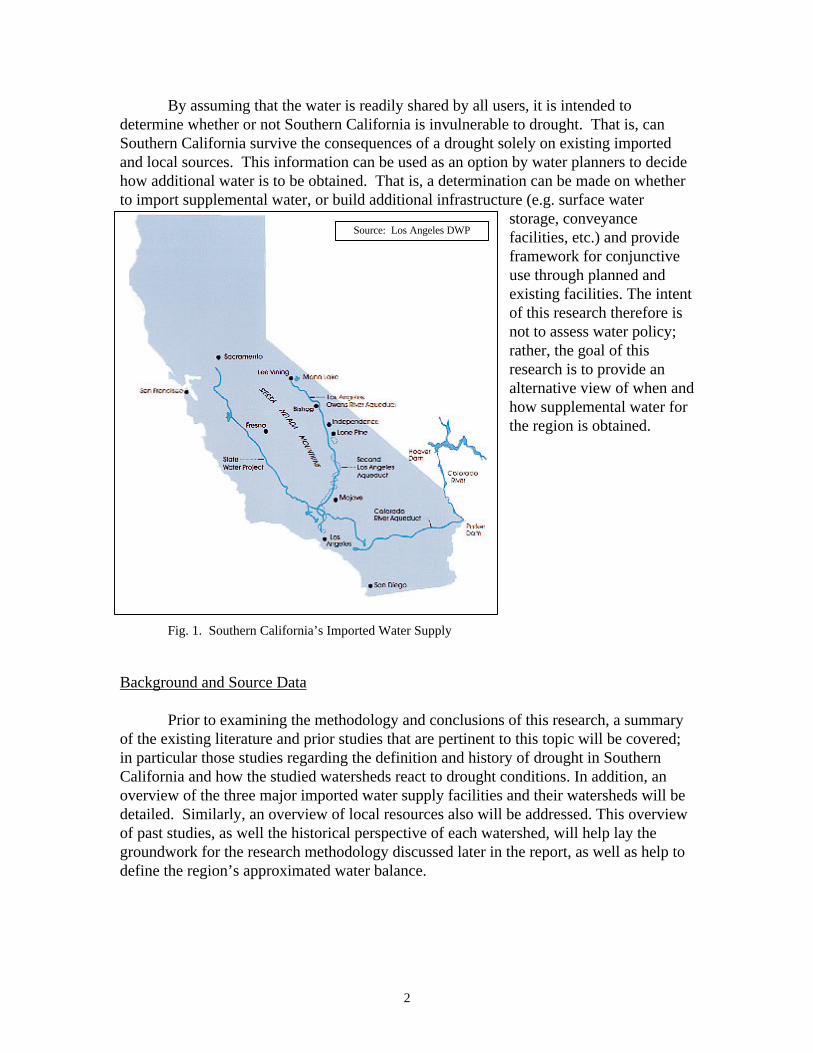
The intent of this research paper is to assess the capability of the regions water supply over the next 25 years in response to severe droughts. For the purpose of this study the regional water supply is assumed to be readily shared amongst all users. The likelihood of concurrent droughts is determined statistically, with a variety of drought scenarios superimposed against the demand function of a water balance to assess the dependable supply through the year 2025. The background data is taken from the three major imported sources of water: the Colorado River (MWD – Colorado River Aqueduct), Northern California (DWR – State Water Project), Mono Basin (DWP – Los Angeles Aqueducts), as well as local supplies (see Fig. 1); a historical perspective of these sources is given, as well as a prospectus of future supplies. To emulate the demand function, the projected population growth for the region is also offered.
The sources of water supply for Southern California have long been a highly
debated, exceedingly scrutinized entity. The fact that Southern California has developed beyond the means of its local water supply exacerbates the problematic mission of the area’s water agencies in providing an annual dependable supply. The regions major water suppliers, the State Water Contractors via the California Department of Water Resources (DWR), the Metropolitan Water District of Southern California (MWD), and the Los Angeles Department of Water and Power (DWP) all import water from differing sources. As a whole, these supplies have historically met the regions demands. However, these supplies are in general disconnected; that is, all of the water imported, stored, and supplied in the region is not readily shared or distributed to the region as a whole. This disconnected water supply, combined with the regions inherent population growth and the potential for severe drought(s) on the various sources drawn upon by the aforementioned agencies, could exude severe consequences upon the regions dependable water supply.
2
By assuming that the water is readily shared by all users, it is intended to determine whether or not Southern California is invulnerable to drought. That is, can Southern California survive the consequences of a drought solely on existing imported and local sources. This information can be used as an option by water planners to decide how additional water is to be obtained. That is, a determination can be made on whether to import supplemental water, or build additional infrastructure (e.g. surface water
storage, conveyance facilities, etc.) and provide framework for conjunctive use through planned and existing facilities. The intent of this research therefore is not to assess water policy; rather, the goal of this research is to provide an alternative view of when and how supplemental water for the region is obtained.
Fig. 1. Southern California’s Imported Water Supply Background and Source Data
Prior to examining the methodology and conclusions of this research, a summary of the existing literature and prior studies that are pertinent to this topic will be covered; in particular those studies regarding the definition and history of drought in Southern California and how the studied watersheds react to drought conditions. In addition, an overview of the three major imported water supply facilities and their watersheds will be detailed. Similarly, an overview of local resources also will be addressed. This overview of past studies, as well the historical perspective of each watershed, will help lay the groundwork for the research methodology discussed later in the report, as well as help to define the region’s approximated water balance.
Source: Los Angeles DWP

3
Previous studies Definitions In addition to providing the background on the major sources, the goal of the literature review was threefold: 1) to determine the definition of drought; 2) to determine prior statistical methods and/or studies pertaining to drought in Southern California; and 3) to obtain information and projections on drought occurrences on the three major sources of imported water. Regarding the definition of drought, a variety of definitions were revealed. One of the earliest and most popular definitions of drought is known as the Palmer Drought Index . Palmer [1965] stated that drought is “…a prolonged and abnormal moisture deficiency”, and he used a weekly or monthly water balance to describe drought and construct the Palmer Drought Index. The Palmer Drought Index assigns values to the water balance to describe the drought, from a -4 for extreme drought to a +4 for extreme wet periods. A value of 0 would therefore describe normal conditions. The Palmer Index computes the water balance based upon several factors, including evaporation, runoff, percolation, and soil-water levels.
Dracup, et al [1980] quantifies hydrologic droughts by observed historical data, and states that drought events are considered to be composed of three separate entities: duration, magnitude, and severity. The magnitude of the drought event can be observed by the average water deficiency and the severity by the cumulative water deficiency. Thus, the severity of the drought is approximated by the expression S = M * D, where S is the severity and M and D are the magnitude and duration respectively. In the context of water supply and demand, where supply is defined over the long term and water budgets entail a global perspective, this definition seems appropriate.
Wilhite and Glantz [1985] define drought as being grouped into the following types: meteorological, agricultural, hydrological, and socioeconomic. Meteorological and agricultural droughts refer to the lack of rainfall or shortage of soil moisture respectively, while hydrologic drought employs examination of streamflow or groundwater levels relative to long-term averages.
Frick, et al [1990] produced a comprehensive overview on drought definitions,
citing Palmer’s [1965] definition, as well as previous studies pertaining to drought definition in Great Britain and Australia. Moreover, Frick, et al defines drought in very general terms, referring to Warrick’s [1975] definition that “drought is a condition of moisture deficit sufficient to have an adverse effect on vegetation, animals, and man over a sizable area”. Furthermore, in respect to the statistical analysis of drought events, several studies by Yevjevich [1967, 1970, 1971, 1975] are identified as those which, by the use of statistics, have expanded upon the definition of drought.
Recent studies support the views of Dracup’s research, as well as that of Wilhite
and Glantz. Young [1995] further corroborates Dracup’s [1980] definition, stating that

4
“…drought is a situation of scarcity relative to “normal” conditions of precipitation, evapotranspiration, or river flow.” Wilhite [1997] further quantifies his own earlier definition by stating that hydrologic droughts are out of phase with meteorological and agricultural droughts, and that hydrologic droughts are a “creeping phenomenon”, making their onset and end difficult to determine.
Of the above definitions, the one most pertinent to this research is hydrologic
drought, that which employs the examination of streamflow records over time and compares various periods of flow to the mean. Therefore, in the context of this research, historic streamflow records are used.
Statistical Methods Several studies pertaining to statistical examinations of drought have been done as
well. Dracup, Lee, and Paulson [1980] suggested four basic statistical tests to characterize drought events in terms of the three parameters (severity, magnitude, and duration) earlier proposed by Dracup: stationarity of each parameter in terms of their linear trend, randomness of each parameter in terms of a lag-1 serial correlation, correlation between two or three of the parameters for a single event, and cross correlation between the parameters of a successive high-flow and drought event pair.
In Dracup et al’s [1980] paper entitled ‘On the Definition of Drought”, it is also
suggested that although the averaging period for the study of drought events may vary from months to seasons to years, the use of monthly streamflow data may be preferred. In the paper it is stated that on average, the use of annual streamflow data yields only about one-sixth the drought events of those from monthly streamflow data. Furthermore, it suggests that when the averaging period is set at an annual interval, obtaining an adequate sample size may present significant problems.
The use of cross correlation was also suggested and used by Tarboton [1995] in
regards to predicting the correlation between observed and reconstructed flows at Lee Ferry. In the study, Tarboton utilized the cross correlation equation to predict whether synthetically generated (reconstructed) flows from tree ring records could be used to prolong the historic flows (1906-1985) at Lee Ferry, thus providing an increased record from which to predict record droughts.
The historic records for Southern California’s imported sources only go back to the early 1900’s. Although many researchers prefer to prolong these records via the Index Sequential Method proposed by Kendall and Dracup [1991], which synthesizes the same number of sequences as there are years in the historic record, or via the utilization of tree ring stochastic hydrology, neither of these methods is employed here because of the uncertainty associated with each. Rather, an examination of a much larger historic record is approximated by observing monthly streamflow records as opposed to annual records, a twelvefold increase in record size.

5
By utilizing the cross correlation equation, and comparing the results of cross
correlation on the various imported sources for both annual and monthly historic streamflow records, it is the intent of this research to predict when and if concurrent droughts occur.
Information on droughts and water supply projections Studies similar to this research, evaluating water supply and demand, have been
performed by a variety of researchers, academia, and governmental entities over the years. Harris [1990] produced a comprehensive assessment of Southern California’s
water resources, examining supply and demand in response to drought effects. In this document, Harris projected a water balance from the years 1990 to 2010, assessing the response of the demand to normal, dependable (repeat of 1928-34 drought), and minimal (repeat of 1976-77 drought) supply conditions. Harris’ conclusions stated that under normal supply conditions with conservation, surplus water would be projected through the year 2010. Under dependable and minimal supply conditions, shortages would occur as soon as the year 2000.
Several governmental entities provide oversight and management of California’s
water resources. In particular, DWR [1993, 1998] publishes the “California Water Plan Update” approximately once every five years. The “California Water Plan Update” is a comprehensive look at the entire State’s water resources, and it evaluates the historical and projected water supplies and demands for all of California. Additionally, DWR produces publications pertaining to management of the State Water Project [DWR, 1997], which details historic and projected supplies, and publications pertaining to prior periods of drought within the state, such as California’s 1987-1992 drought [DWR, July 1993].
Similarly, MWD publishes an annual report that summarizes operational (supply
and demand) issues, as well litigation, engineering, and water quality issues [MWD, 1994, 1997]; MWD also publishes an “Urban Water Management Plan” [MWD, 1995], which evaluates water supply and demand for MWD’s service area. The LADWP publishes annual reports as well, examining the historic and projected supplies for the City of Los Angeles [LADWP, 1971-1995].
As outlined earlier, Tarboton [1994, 1995] specifically examined droughts on the
Colorado River at Lee Ferry, and suggested what he termed the “Colorado River Basin Severe Drought” and ‘Colorado Drought in Historic Record”. The Severe Drought was proposed to have occurred from the years 1579 to 1600, with a 22-year mean annual streamflow of 11.1 million acre-feet. The Historic Record Drought was proposed to have occurred from the years 1943 to 1964, with a 22-year mean annual streamflow of 13.4 million acre-feet. Harding, et al. [1995] further expanded upon Tarboton’s research, suggesting the impacts to Colorado River resources in response to the Severe Drought. It
6
was postulated in Harding’s paper that although the Upper Basin states would experience a depletion of almost 59%, the Lower Basin states would be minimally affected, experiencing a shortfall of only 3%. Furthermore, Harding, et al. states that the California entitlements would not be affected, with all of the Lower Basin shortages occurring in Nevada and Arizona. Source Data Imported supplies Colorado River Of the three major imported supplies, the Colorado River is arguably the backbone and workhorse of the region, having historically met demands to Southern California effectively over the past 60 years. This supply is used for both agricultural and potable purposes, with the majority of potable use by the Metropolitan Water District of Southern California, which in turn wholesales the water to 27 member agencies throughout Southern California.
Containing a watershed of approximately 243,000 square miles, the Colorado River traverses an approximate 1400-mile long course and drains portions of seven states (Colorado, Wyoming, Utah, New Mexico, Nevada, Arizona, and California) as well as the country of Mexico. The basin is divided into the Upper Colorado River Basin and Lower Colorado River Basin at Lee Ferry, which is defined as the gauging point for historic Colorado River flows [MWD Annual Report, 1989]. Historic flows at Lee Ferry have averaged 15.2 million acre-feet per year over it’s measured period of record (from 1906 through current) [Tarboton, 1995] , although the normal hydrology is considered to be less because of a handful of extremely wet years that are considered rare compared to the mean [Harding, et al, 1995]. Annual recorded flows have ranged from a high of 24 million acre-feet in 1917 to a low of 5 million acre-feet in 1977. Harding, et al (1995) reported the normal hydrology to approximate 14.1 million-acre per-year, representative of the 38-year period from 1938 to 1975. Storage facilities along the river are numerous and massive as well, and the two major storage facilities, Lakes Powell and Mead have a combined storage capacity of over 50 million acre-feet. These facilities, along with other ancillary reservoirs constructed along the river by the U.S. Bureau of Reclamation, contain a total active storage of over 60 million acre-feet [Harding, et al, 1995], allowing storage of nearly four times the annual Colorado River flows [Young, 1995].
Lee Ferry is also the point where the watershed is governed and water allocated through a series of agreements and compacts known as the “Law of the River”. One of the main agreements is called the Colorado River Compact (1922), which allocates water to the seven basin states [MacDonnell, et al, 1995]. The total allocation

for the seven states is 15 million acre-feet per year, with 7.5 million acre-feet per year allocated to the Upper Basin and 7.5 million acre-feet per year to the Lower Basin. The Lower Basin also has the option, when excess water is available, to procure an additional 1 million acre-feet per year. Moreover, the Compact has a provision that commits the Upper Basin to deliver at Lee Ferry 75 million acre-feet every 10 years, or the equivalent of a moving ten-year average of 7.5 million acre-feet per year [MacDonnell, et al, 1995]. Additionally, the amount of river water guaranteed to Mexico, as outlined in the 1944 “Treaty with Mexico Respecting Utilization of Waters of the Colorado and Tijuana Rivers and of the Rio Grande”, is 1.5 million acre-feet per year [MacDonnell, et al, 1995]. However, this may be less if severe drought conditions exist. In MacDonnell, et al’s 1995 paper, it is stated that the 1944 Treaty with Mexico explicitly addresses the impacts of a severe drought, indicating that “...in the event of extraordinary drought..., thereby making it difficult for the United States to deliver the quantity of 1.5 million acre-feet per year...the water allocated to Mexico will be reduced in the same proportion as consumptive uses in the United States are reduced.”
The U.S. Bureau of Reclamation is the governing faction that allocates this water to the Upper and Lower Basins; the Bureau’s “Annual Operating Plan for Colorado River Reservoirs” dictates the amount released for both basins [U.S. Bureau of Reclamation, 1999]. In the event of drought conditions, the allocation to each of the Upper and Lower Basins, as well as that to Mexico, may be less than that mentioned above. A similar agreement entitled the California Seven Party Agreement (1931) further allocates the Lower Basin water within California [MWD Annual Report, 1989]. Under the priorities of the Seven Party Agreement, over 5.3 million acre-feet of Colorado River water was allocated to California. Agricultural agencies, such as the Palo Verde Water District, Imperial Irrigation District, and Coachella Valley Water District receive the majority of this water. In return for agreeing to a lower priority, MWD received the right, yet to be implemented to date by the Federal Government, to accumulate up to 5 million acre-feet of water in Lake Mead. Additionally, any surplus water left over from the agricultural agencies can be used by MWD [MWD Annual Report, 1997]. The priorities under the Seven Party Agreement are shown graphically in Fig. 2.
In 1963, the U.S. Supreme Court further reduced California’s annual allotment to 4.4 million acre-feet in order to offset increased demands in the burgeoning states of Nevada and Arizona [Hundley, 1992]. Under this 1964 decree, if Nevada and Arizona use their full allotment, and the agricultural agencies listed under priorities 1-3 also use their full allotment, MWD’s annual dependable supply could be reduced to 550,000 acre-feet, approximately 42% of the annual capacity of the Colorado River Aqueduct [MWD Annual Report, 1997]. State Water Project
Based with increasing demands and a potentially undependable supply, Californians
approved a $1.75 billion bond issue in 1960 to begin building the State Water Project. In 1973, after a lengthy design and construction period, the initial facilities were completed and water delivery to Southern California began. However, the State Water Project was not constructed for

Fig. 2 Priorities of the Seven Party Agreement

Southern California alone. The completed State Water Project is a water storage and delivery system of reservoirs, aqueducts, powerplants and pumping plants for nearly all of California. Its main purpose is to store water and distribute it to 29 urban and agricultural water suppliers in Northern California, the San Francisco Bay Area, the San Joaquin Valley, and Southern California. Approximately 40 percent of the delivered water is used to irrigate farmland, and 60 percent goes to meet the needs of the State's growing population; overall, the State Water Project makes deliveries to two-thirds of California's population [DWR, 1997].
Water for the State Water Project is supplied via runoff from several rivers within the
Sacramento Valley Basin [DWR, 1997]. The basin drains an area of nearly 27,000 square miles (approximately 9% of the Colorado River Basin), yet has a historic annual yield of approximately 18.4 million acre-feet (approximately 130% of the Colorado River Basin)[DWR, 1993]. The yield from this basin is based upon the measured unimpaired streamflows of the upper Sacramento River and it’s three main tributaries, the American, Feather, and Yuba Rivers. The combination of these four rivers is known as the Four Rivers Index (sometimes referred to as the Sacramento River Index). Annual recorded streamflow for the Four Rivers Index has ranged from a high of 41.8 million acre-feet in 1983 to a low of 6.4 million acre-feet in 1924 [DWR, 1993].
The California Department of Water Resources (DWR) regulates the allocation of water
from the Four Rivers Index [DWR, 1993]. Each year in December the DWR publishes a preliminary forecast of runoff conditions for the water year (October 1 - September 30), with a final forecast in May. The forecast classifies the water year into various indices, as shown in Table 1. The final forecast published by DWR has major implications regarding the allocation of water from the State Water project.
Four River's Index Classification
Year Type Classification Index based on flow in million acre-feet
Wet Year Equal to or greater than 3.8 maf Above normal year Greater than 3.1, less than 3.8 maf Below normal year Greater than 2.5, less than 3.1 maf Dry Year Greater than 2.1, less than 2.5 Critical Year Equal to or less than 2.1 maf
Source: DWR
TABLE 1. Four River Index Classification Deliveries from the State Water Project are divided amongst several water agencies, known as contractors to the Project. In Southern California, the MWD is the most visible State Water Contractor, and the largest in terms of water procured from DWR. Additional State Water Contractors for Southern California include: Antelope Valley-East Kern Water Agency, Castaic Lake Water Agency, Crestline-Lake Arrowhead Water Agency, Desert Water Agency, Mojave
10
Water Agency, Palmdale Water District, San Gabriel Valley Municipal Water Agency, San Bernardino Valley Municipal Water District, and San Gorgonio Pass Water Agency.
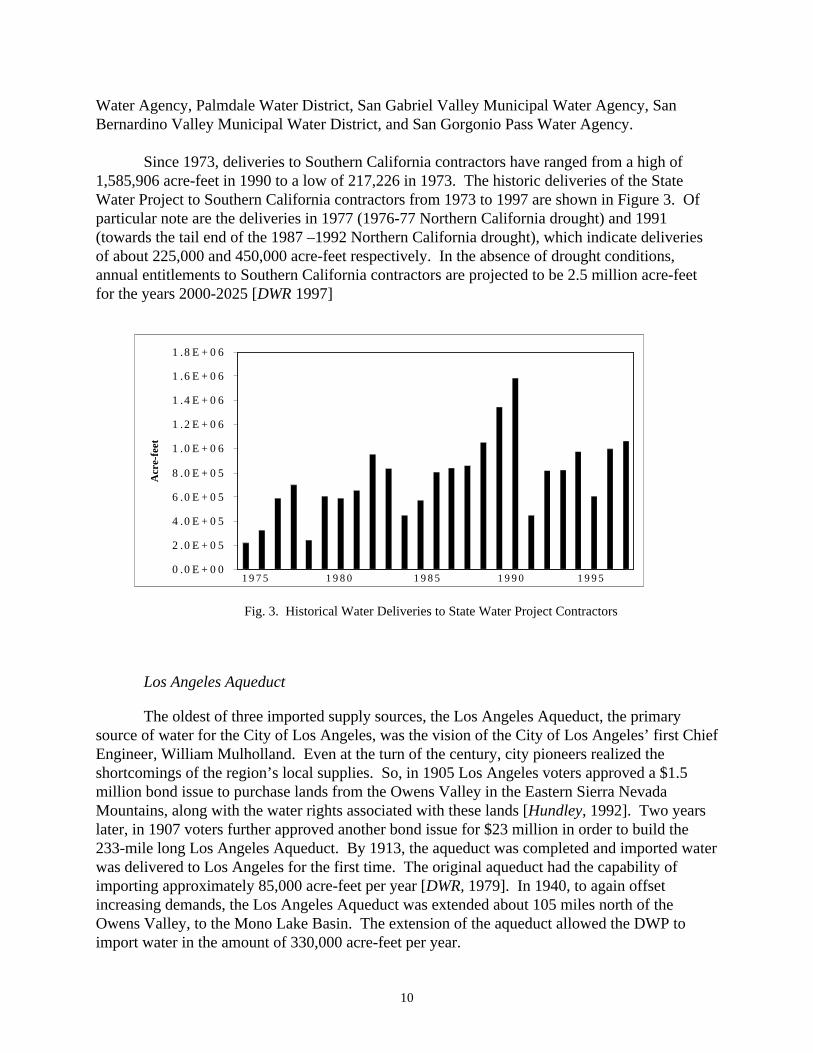
Since 1973, deliveries to Southern California contractors have ranged from a high of 1,585,906 acre-feet in 1990 to a low of 217,226 in 1973. The historic deliveries of the State Water Project to Southern California contractors from 1973 to 1997 are shown in Figure 3. Of particular note are the deliveries in 1977 (1976-77 Northern California drought) and 1991 (towards the tail end of the 1987 –1992 Northern California drought), which indicate deliveries of about 225,000 and 450,000 acre-feet respectively. In the absence of drought conditions, annual entitlements to Southern California contractors are projected to be 2.5 million acre-feet for the years 2000-2025 [DWR 1997]
Fig. 3. Historical Water Deliveries to State Water Project Contractors
Los Angeles Aqueduct
The oldest of three imported supply sources, the Los Angeles Aqueduct, the primary source of water for the City of Los Angeles, was the vision of the City of Los Angeles’ first Chief Engineer, William Mulholland. Even at the turn of the century, city pioneers realized the shortcomings of the region’s local supplies. So, in 1905 Los Angeles voters approved a $1.5 million bond issue to purchase lands from the Owens Valley in the Eastern Sierra Nevada Mountains, along with the water rights associated with these lands [Hundley, 1992]. Two years later, in 1907 voters further approved another bond issue for $23 million in order to build the 233-mile long Los Angeles Aqueduct. By 1913, the aqueduct was completed and imported water was delivered to Los Angeles for the first time. The original aqueduct had the capability of importing approximately 85,000 acre-feet per year [DWR, 1979]. In 1940, to again offset increasing demands, the Los Angeles Aqueduct was extended about 105 miles north of the Owens Valley, to the Mono Lake Basin. The extension of the aqueduct allowed the DWP to import water in the amount of 330,000 acre-feet per year.
0 .0 E + 0 0
2 .0 E + 0 5
4 .0 E + 0 5
6 .0 E + 0 5
8 .0 E + 0 5
1 .0 E + 0 6
1 .2 E + 0 6
1 .4 E + 0 6
1 .6 E + 0 6
1 .8 E + 0 6
Acr
e-fe
et
1 9 7 5 1 9 8 0 1 9 8 5 1 9 9 0 1 9 9 5
11
As demand grew, particularly in the 1950’s and 1960’s, the DWP realized once again that
additional water would be required to meet the city’s needs. Therefore, the city designed and constructed the Second Los Angeles Aqueduct, which was completed in 1970. By constructing this second aqueduct, the city now had the capability to import approximately 500 million gallons per day, or about 560,000 acre-feet per year. Although the importation of water from the Mono Basin and Owens Valley has provided appropriate supplies for the City of Los Angeles, it has also significantly impacted the environment within the Mono Basin and Owens Valley. Owens Lake has periodically become a dry lakebed and Mono Lake has had its surface level drop approximately 45 feet, thereby increasing it’s salinity increased beyond acceptable levels [State of California Water Resources Control Board, 1994]. Because of these impacts, several lawsuits have been filed, resulting in a ruling by the State of California Water Resources Control Board, which essentially reduces the dependable water supply for Los Angeles [DWR, 1998]. Under the ruling, the DWP can import a maximum of 30.8 thousand acre-feet per year once Mono Lake reaches a level of 6,391 feet above sea level; it is projected that this will ultimately occur by the year 2005 [LADWP, 1997]. Although this reduces Los Angeles’ water supply, it should be noted that as recently as 1997, only 5% of the city’s supplies were from Mono Basin [LADWP, 1997]. Historically over the years 1971 to 1995, the DWP imported an average of 440,000 acre-feet per year, with a high of 560,000 in 1995 and a low of 200,000 in 1991. Local Supplies Local water supplies for Southern California include surface water, groundwater, and reclaimed water. This water is for a variety of uses, including potable water supply, groundwater recharge (and subsequently potable groundwater use), and agricultural purposes.
Although Southern California has several major rivers (i.e. Los Angeles, San Gabriel, Santa Ana, Santa Margarita, and San Luis Rey), these rivers do not generally serve as a major source of water for the local population. Natural runoff from the region’s rivers approximates 1.2 million acre-feet annually [LADWP, 1995]. Approximately 25 major reservoirs (4000 acre-feet or greater) store water from these rivers, with an approximate total storage capacity of 707,000 acre-feet. However, the historic annual average yield from these reservoirs is only about 130,000 acre-feet [MWD, 1995]. A portion of the water from the region’s rivers does help to recharge the local groundwater supplies. Groundwater sources account for approximately 90% of the natural local water supplies. These supplies are from a variety of groundwater basins, and on average provide an annual total production of about 1.4 million acre-feet [MWD, 1995]. There are no estimates of the total storage capacity of the region’s basins, however it is known that several have capacities exceeding 10 million acre-feet [DWR, 1995]. Because of this, and for the purpose of this study, overdrafting is not anticipated during drought conditions. Extractions may be limited though if safe yield conditions are being exceeded, for instance if water quality deteriorates or seawater intrusion is observed.

12
Reclaimed water can help offset the use of potable water for many functions. Direct use of this water is primarily for irrigation of golf courses, cemeteries, parks, and schoolyards, as well as groundwater recharge and industrial applications. Currently, there are more than 100 wastewater treatment facilities in Southern California. According to the 1995 U.S. Bureau of Reclamation study, about 1.4 million acre-feet is currently being treated, and this amount is projected to increase to 2.35 million acre-feet by the year 2010. Methodology
Fig. 4. Study Area
The study area for this research was chosen as the five county area of Southern California that includes Los Angeles, Orange, Riverside, San Bernardino, and San Diego counties (see Fig. 4). This area was chosen because it represents some of most rapidly growing communities in the nation [U.S. Census Bureau Projection, 1998], as well as being the location where most Southern Californians reside. Currently, approximately 50% of California’s total population of 32 million live in this five county region, and by the year 2025 it is expected that the five county population will reach nearly 25 million, an increase of about 360,000 people per year [SCAG, 1998; SANDAG, 1995].Considering that the average
family of four consumes approximately 160,000 gallons per year, or one-half of an acre-foot [MWD, 1994], it follows logically that on a rough order of magnitude an additional 1,000,000 acre-feet will be required by the year 2025. This area was further chosen because it represents that portion of Southern California that by and large survives on a combination of the three imported water supplies, and which is primarily dependent upon this water for municipal and industrial purposes. The two remainder counties that are generally associated with Southern California, Ventura County and Imperial County, are not included in the study because of their
Source: University of Texas
13
large agricultural use of water and their primary dependency on singular sources of water, the State Water Project for Ventura and the Colorado River for Imperial. The data used in this study was obtained from a variety of sources, and included the years 1906 to 1995. All flows obtained were converted to annual and monthly values in acre-feet. The Colorado River water source data was obtained from the U.S. Bureau of Reclamation. This data was received as monthly natural stream flows at Lee Ferry, which were aggregated into water year annual flows (i.e. from October to September). This data encompassed the period from 1906 to 1995. To adequately compare this data with the remainder data from Mono Basin, Owens River, and the Four River Index, water year data was converted to calendar year data to coincide with the historical data received from these sources. The data for the Four River Index was obtained from DWR’s Division of Flood Management, and also included the years 1906 to 1995. This data was summarized in both annual and monthly flows. It should be noted that the Four River Index is not true unimpaired flows, but rather reconstructed (computed unimpaired) which takes into account upstream diversions that alter the measured time-volume relationship.
Data from the Mono Basin and Owens River was obtained from the Los Angeles Department of Water and Power. Flows for both Mono Basin and Owens River were approximated by producing an index for each. The Mono Basin Index was produced by aggregating flows gauged at Lee Vining Creek and Rush Creek; the Owens River Index was produced by aggregating flows gauged at Mammoth, Bishop, Cottonwood, and Independence Creeks. These indices are representative of flows approximating 90% and 30% respectively of each basin’s 50 year runoff average [LADWP, 1999]. Data included the years 1940 to 1995. Similar to the Four River Index, the flows for the Mono Basin and Owens River Indices are reconstructed rather than true unimpaired.
To determine the likelihood of concurrent droughts, a statistical cross correlation was performed on the various sources of data for the three primary sources of water. Cross correlation was chosen because it was observed that the geographical locations of these three sources are wide ranging. That is, because the geographical locations of the three are far apart, it is not evident that a drought on one source necessarily dictates drought on another. The cross correlation equation which measures the goodness of fit of two independent time series, is as follows:
( ) ( )( )( )[ ]
1.
var(var
1 Eq
yxn
ytyn
txtx
r
tt
−∑
=−
=

14
where, r = cross correlation coefficient xt = variate x at time t yt = variate y at time t x = sample mean of variate x y = sample mean of variate y n = length of data set The results of the cross correlation for the various data sets is shown in Table 2. Cross correlation was performed for annual, monthly, and seasonal (i.e. winter, spring, summer, fall) flows. Note the significant differences between the cross correlation coefficient on annual and monthly flows, which validates the suggestion by Dracup [1980] to utilize monthly values on smaller historical data sets. The results of the cross correlation for monthly flows are shown graphically in Figure 5. Although in general it appears that concurrent droughts are not likely to occur, of particular note is that the most probable correlation occurs between streamflow from Lee Ferry and the Mono Basin and Owens River Indices. This can be seen graphically in Figure 5(c) as well. The seasonal results further validates this hypothesis. This correlation will be used as the worst-case scenario on the water balances performed later in the report. The results from the cross correlation lay the framework for the various water balances that are performed for the study. The classic water balance equation is:
2.Eqt
SOutIn
∆
∆=−
where,
In = water supply Out = water demand ∆ t = annual time series ∆ S = carryover storage
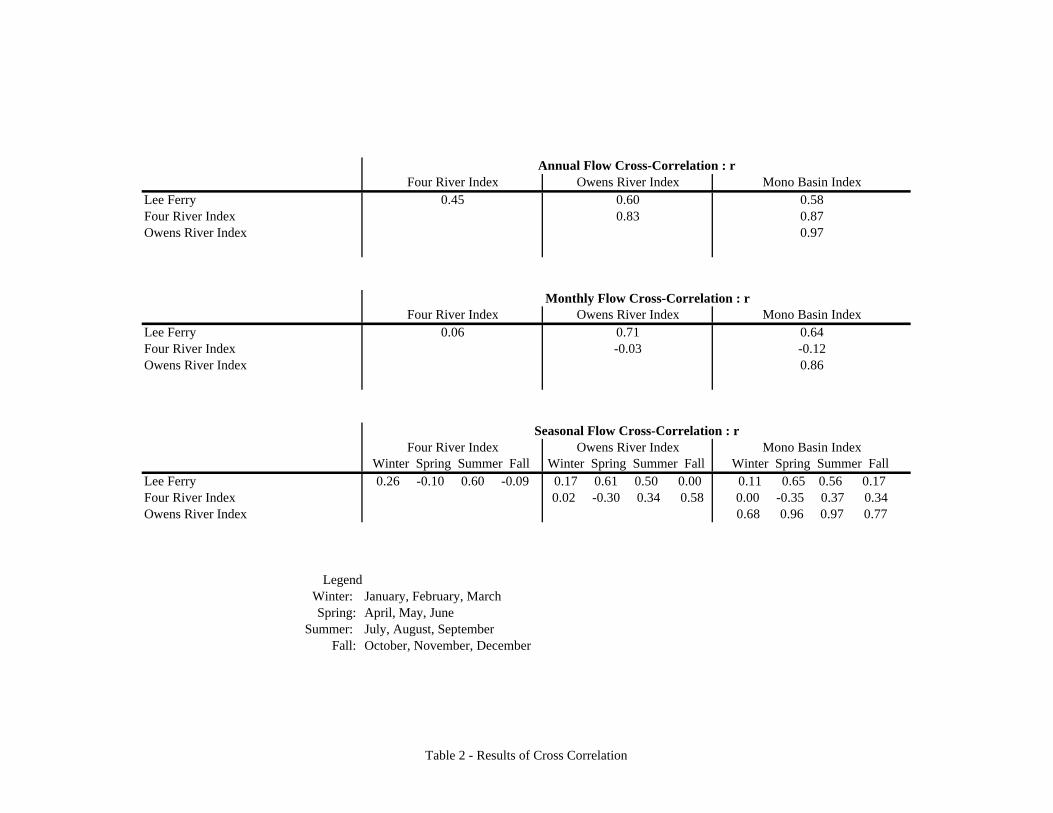
Annual Flow Cross-Correlation : r Four River Index Owens River Index Mono Basin Index
Lee Ferry 0.45 0.60 0.58Four River Index 0.83 0.87Owens River Index 0.97
Monthly Flow Cross-Correlation : rFour River Index Owens River Index Mono Basin Index
Lee Ferry 0.06 0.71 0.64Four River Index -0.03 -0.12Owens River Index 0.86
Seasonal Flow Cross-Correlation : rFour River Index Owens River Index Mono Basin Index
Winter Spring Summer Fall Winter Spring Summer Fall Winter Spring Summer Fall Lee Ferry 0.26 -0.10 0.60 -0.09 0.17 0.61 0.50 0.00 0.11 0.65 0.56 0.17Four River Index 0.02 -0.30 0.34 0.58 0.00 -0.35 0.37 0.34Owens River Index 0.68 0.96 0.97 0.77
LegendWinter: January, February, MarchSpring: April, May, June
Summer: July, August, SeptemberFall: October, November, December
Table 2 - Results of Cross Correlation

(f)
Owens River Index
Mo
no
Bas
in In
dex
r=0.86
(e)
Four River Index
Mo
no
Bas
in In
dex
r=-0.12
(d)Four River Index
Ow
ens
Riv
er In
dex
r=-0.03
(c)Mono Basin Index
Lee
Fer
ry
r=0.64
(b)Owens River Index
Lee
Fer
ry
r=0.71
(a)Four River Index
Lee
's F
erry
r=0.06
Figure 5 - Cross Correlation
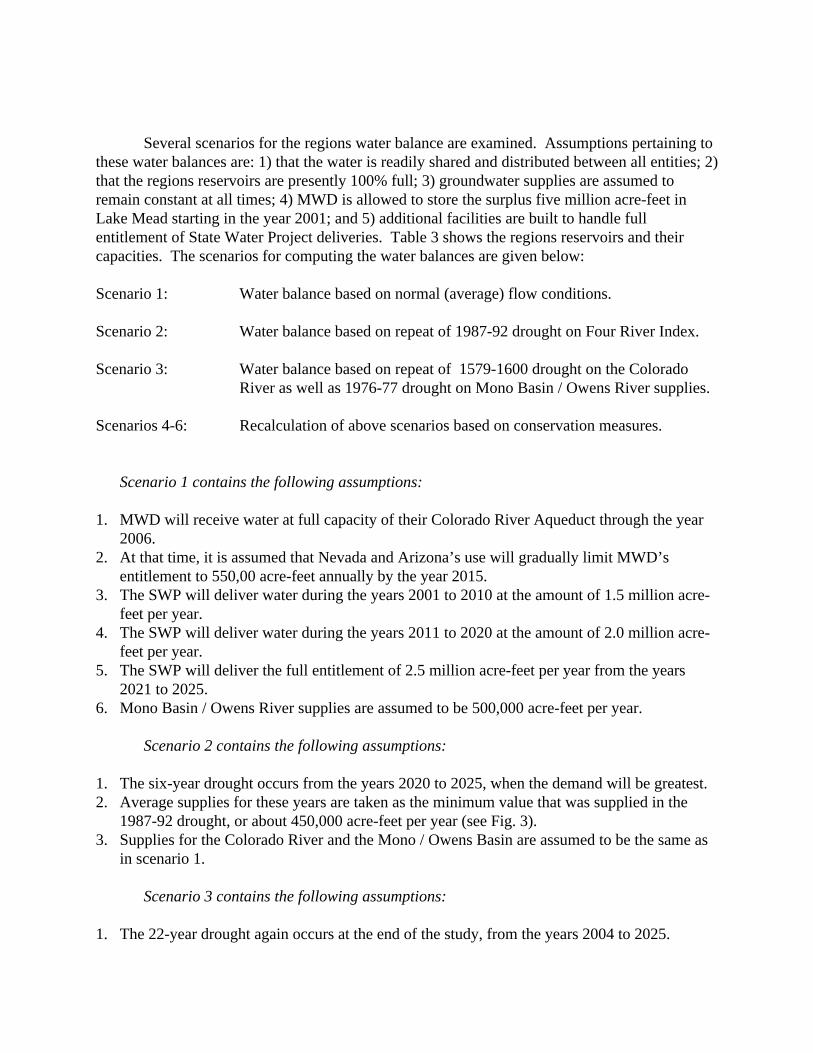
Several scenarios for the regions water balance are examined. Assumptions pertaining to
these water balances are: 1) that the water is readily shared and distributed between all entities; 2) that the regions reservoirs are presently 100% full; 3) groundwater supplies are assumed to remain constant at all times; 4) MWD is allowed to store the surplus five million acre-feet in Lake Mead starting in the year 2001; and 5) additional facilities are built to handle full entitlement of State Water Project deliveries. Table 3 shows the regions reservoirs and their capacities. The scenarios for computing the water balances are given below: Scenario 1: Water balance based on normal (average) flow conditions. Scenario 2: Water balance based on repeat of 1987-92 drought on Four River Index. Scenario 3: Water balance based on repeat of 1579-1600 drought on the Colorado
River as well as 1976-77 drought on Mono Basin / Owens River supplies. Scenarios 4-6: Recalculation of above scenarios based on conservation measures.
Scenario 1 contains the following assumptions: 1. MWD will receive water at full capacity of their Colorado River Aqueduct through the year
2006. 2. At that time, it is assumed that Nevada and Arizona’s use will gradually limit MWD’s
entitlement to 550,00 acre-feet annually by the year 2015. 3. The SWP will deliver water during the years 2001 to 2010 at the amount of 1.5 million acre-
feet per year. 4. The SWP will deliver water during the years 2011 to 2020 at the amount of 2.0 million acre-
feet per year. 5. The SWP will deliver the full entitlement of 2.5 million acre-feet per year from the years
2021 to 2025. 6. Mono Basin / Owens River supplies are assumed to be 500,000 acre-feet per year. Scenario 2 contains the following assumptions: 1. The six-year drought occurs from the years 2020 to 2025, when the demand will be greatest. 2. Average supplies for these years are taken as the minimum value that was supplied in the
1987-92 drought, or about 450,000 acre-feet per year (see Fig. 3). 3. Supplies for the Colorado River and the Mono / Owens Basin are assumed to be the same as
in scenario 1.
Scenario 3 contains the following assumptions: 1. The 22-year drought again occurs at the end of the study, from the years 2004 to 2025.
17
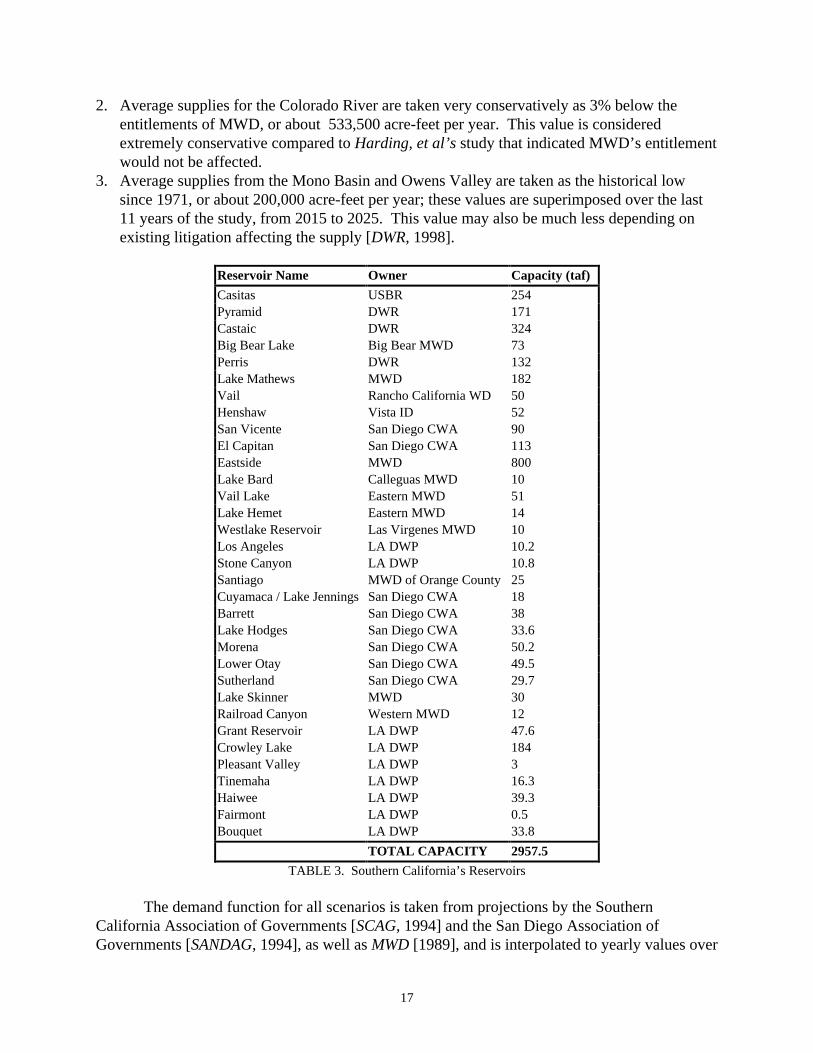
2. Average supplies for the Colorado River are taken very conservatively as 3% below the entitlements of MWD, or about 533,500 acre-feet per year. This value is considered extremely conservative compared to Harding, et al’s study that indicated MWD’s entitlement would not be affected.
3. Average supplies from the Mono Basin and Owens Valley are taken as the historical low since 1971, or about 200,000 acre-feet per year; these values are superimposed over the last 11 years of the study, from 2015 to 2025. This value may also be much less depending on existing litigation affecting the supply [DWR, 1998].
Reservoir Name Owner Capacity (taf) Casitas USBR 254 Pyramid DWR 171 Castaic DWR 324 Big Bear Lake Big Bear MWD 73 Perris DWR 132 Lake Mathews MWD 182 Vail Rancho California WD 50 Henshaw Vista ID 52 San Vicente San Diego CWA 90 El Capitan San Diego CWA 113 Eastside MWD 800 Lake Bard Calleguas MWD 10 Vail Lake Eastern MWD 51 Lake Hemet Eastern MWD 14 Westlake Reservoir Las Virgenes MWD 10 Los Angeles LA DWP 10.2 Stone Canyon LA DWP 10.8 Santiago MWD of Orange County 25 Cuyamaca / Lake Jennings San Diego CWA 18 Barrett San Diego CWA 38 Lake Hodges San Diego CWA 33.6 Morena San Diego CWA 50.2 Lower Otay San Diego CWA 49.5 Sutherland San Diego CWA 29.7 Lake Skinner MWD 30 Railroad Canyon Western MWD 12 Grant Reservoir LA DWP 47.6 Crowley Lake LA DWP 184 Pleasant Valley LA DWP 3 Tinemaha LA DWP 16.3 Haiwee LA DWP 39.3 Fairmont LA DWP 0.5 Bouquet LA DWP 33.8 TOTAL CAPACITY 2957.5
TABLE 3. Southern California’s Reservoirs
The demand function for all scenarios is taken from projections by the Southern California Association of Governments [SCAG, 1994] and the San Diego Association of Governments [SANDAG, 1994], as well as MWD [1989], and is interpolated to yearly values over

18
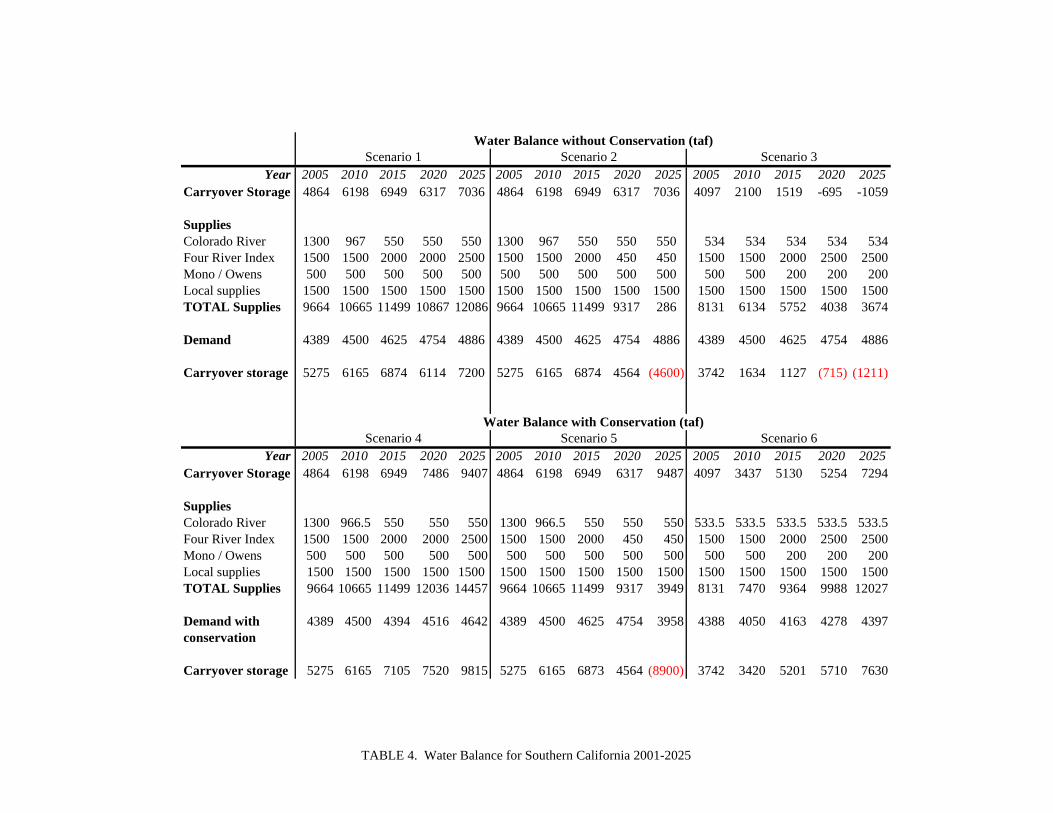
the life of the study. Conservation effects due to Best Management Practices (i.e. replacement toilets, continued public awareness, etc.) have been reported at 10% [MWD, 1995]. For the purpose of this study, this value is conservatively lowered to 5% realized at the year 2015. Conservation effects due to drought are interpolated from actual per capita use reflected by the 1987-1992 drought. During this period, per capita use declined by 19% [DWR, 1998]. It is contended here that at a minimum a 10% decrease would be seen as well over the life of the drought, beginning approximately 3-4 years after the declaration of drought. Table 4 shows the results of the water balance for the study period. It is observed in scenarios 2 and 3 that a shortage would occur in the later years of the study, in 2023 for scenario 2 and 2018 for scenario 3. Considering that it is unlikely that droughts of this magnitude would be accompanied by little or no conservation measures, nor mandatory rationing, these results are conservative. Of more realistic importance are scenarios 4 through 6, which show an abundance of water for the entire study period, save for the last year of scenario 5, when a shortage occurs. Considering that a mandatory decrease in consumptive use would likely be required in addition to conservation measures, it appears again water that would be abundant.
Year 2005 2010 2015 2020 2025 2005 2010 2015 2020 2025 2005 2010 2015 2020 2025Carryover Storage 4864 6198 6949 6317 7036 4864 6198 6949 6317 7036 4097 2100 1519 -695 -1059
Supplies Colorado River 1300 967 550 550 550 1300 967 550 550 550 534 534 534 534 534Four River Index 1500 1500 2000 2000 2500 1500 1500 2000 450 450 1500 1500 2000 2500 2500Mono / Owens 500 500 500 500 500 500 500 500 500 500 500 500 200 200 200Local supplies 1500 1500 1500 1500 1500 1500 1500 1500 1500 1500 1500 1500 1500 1500 1500TOTAL Supplies 9664 10665 11499 10867 12086 9664 10665 11499 9317 286 8131 6134 5752 4038 3674
Demand 4389 4500 4625 4754 4886 4389 4500 4625 4754 4886 4389 4500 4625 4754 4886
Carryover storage 5275 6165 6874 6114 7200 5275 6165 6874 4564 (4600) 3742 1634 1127 (715) (1211)
Year 2005 2010 2015 2020 2025 2005 2010 2015 2020 2025 2005 2010 2015 2020 2025Carryover Storage 4864 6198 6949 7486 9407 4864 6198 6949 6317 9487 4097 3437 5130 5254 7294
Supplies Colorado River 1300 966.5 550 550 550 1300 966.5 550 550 550 533.5 533.5 533.5 533.5 533.5Four River Index 1500 1500 2000 2000 2500 1500 1500 2000 450 450 1500 1500 2000 2500 2500Mono / Owens 500 500 500 500 500 500 500 500 500 500 500 500 200 200 200Local supplies 1500 1500 1500 1500 1500 1500 1500 1500 1500 1500 1500 1500 1500 1500 1500TOTAL Supplies 9664 10665 11499 12036 14457 9664 10665 11499 9317 3949 8131 7470 9364 9988 12027
Demand with 4389 4500 4394 4516 4642 4389 4500 4625 4754 3958 4388 4050 4163 4278 4397conservation
Carryover storage 5275 6165 7105 7520 9815 5275 6165 6873 4564 (8900) 3742 3420 5201 5710 7630
Water Balance without Conservation (taf)Scenario 3
Scenario 4 Scenario 5 Scenario 6Water Balance with Conservation (taf)
Scenario 1 Scenario 2
TABLE 4. Water Balance for Southern California 2001-2025

20
Conclusion The complexity of Southern California’s water supply coupled with the regions inherent growth requires extensive planning to offset the potential for water shortages, particularly in response to severe droughts. It has been suggested here that the existing storage facilities and distribution systems may be able to sustain these severe droughts should the regions major water suppliers join forces and provide framework for full conjunctive use. The intent of the research is to offer a differing point of view from the generally accepted notion of procuring new sources of water. To assess this differing point of view, a background of each of the water resource was given, as well as projections for future supplies and demands. The likelihood of severe droughts occurring concurrently was addressed using statistical hydrology, and the results were superimposed on a variety of supply and demand scenarios through the year 2025. The culmination of this research indicated that concurrent droughts were in general unlikely, except for a potential correlation between Lee Ferry and the Mono / Owens River Basins. This potential correlation was therefore used as a worst-case scenario to determine the extreme water balance for Southern California. The ultimate results of this study indicates that the existing supplies from the State Water Project, the Colorado River, and the Mono / Owens River Basins will sustain severe droughts should the needed infrastructure and conjunctive uses be realized. Acknowledgments
This research was performed to satisfy the requirements in part for the Master of Science Program at the University of California Los Angeles, in particular for the Water Resources program within the Civil and Environmental Engineering Department. I would like to take the opportunity to thank my advisor, Professor John Dracup for his ideas and support in the production and culmination of this research. Additionally, I would like to thank Mr. Rod Carson from the United States Bureau of Reclamation for his guidance in obtaining raw data for streamflow from the Colorado River at Lee Ferry, and Mr. Simon Hsu of the Los Angeles Department of Water and Power for guidance in obtaining streamflow data for the Mono Basin and Owens River.