ucms market profile - wordpress.com
TRANSCRIPT
Prepared by: Peg Barringer, FinePoint Associates, in collaboration with UCMS. Consulting Assistance sponsored by Boston Main Streets. Sources: Nielsen, U.S. Census, InfoUSA, American Community Survey, Social Explorer, www.FinePointAssociates.com
1. PTA is where most steady, repeat sales are likely to generate, typically, where 75% of customers live. 2. Vehicle and gasoline purchases are not included.
Upham’s Corner Main Street District
1
For more information, contact: Upham’s Corner Main Street (UCMS)
www.uphamscorner.org
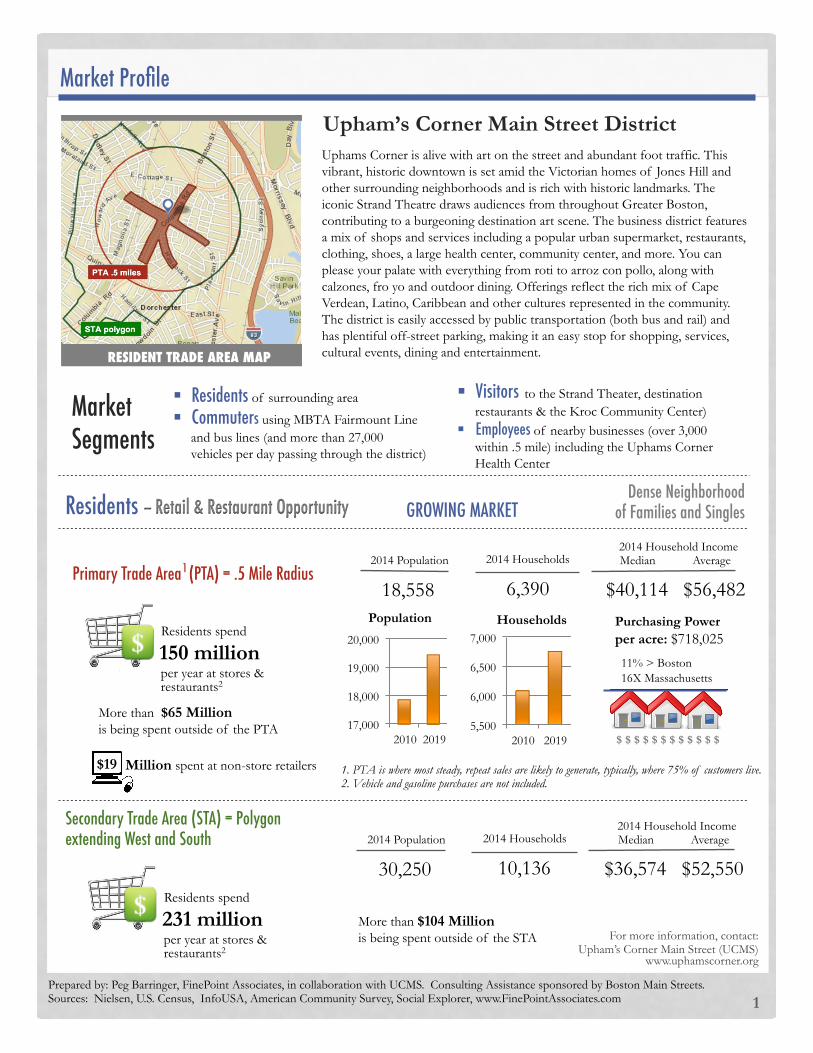
RESIDENT TRADE AREA MAP �
2014 Population
18,558
2014 Households
6,390
2014 Household Income Median Average
$40,114 $56,482
2014 Population
30,250
2014 Households
10,136
2014 Household Income Median Average
$36,574 $52,550
More than $104 Million is being spent outside of the STA
5,500
6,000
6,500
7,000
2010 2019
Households
17,000
18,000
19,000
20,000
2010 2019
Population Purchasing Power
per acre: $718,025
11% > Boston 16X Massachusetts�
Market Profile�
§ Visitors to the Strand Theater, destination restaurants & the Kroc Community Center)
§ Employees of nearby businesses (over 3,000 within .5 mile) including the Uphams Corner Health Center
Dense Neighborhood �of Families and Singles �
�-- Retail & Restaurant Opportunity� GROWING MARKET�Residents �
Residents spend
150 million per year at stores & restaurants2
Residents spend
231 million per year at stores & restaurants2
More than $65 Million is being spent outside of the PTA $19 Million spent at non-store retailers
Primary Trade Area (PTA) = .5 Mile Radius�1 �
$ $ $ $ $ $ $ $ $ $ $ $
Uphams Corner is alive with art on the street and abundant foot traffic. This vibrant, historic downtown is set amid the Victorian homes of Jones Hill and other surrounding neighborhoods and is rich with historic landmarks. The iconic Strand Theatre draws audiences from throughout Greater Boston, contributing to a burgeoning destination art scene. The business district features a mix of shops and services including a popular urban supermarket, restaurants, clothing, shoes, a large health center, community center, and more. You can please your palate with everything from roti to arroz con pollo, along with calzones, fro yo and outdoor dining. Offerings reflect the rich mix of Cape Verdean, Latino, Caribbean and other cultures represented in the community. The district is easily accessed by public transportation (both bus and rail) and has plentiful off-street parking, making it an easy stop for shopping, services, cultural events, dining and entertainment.
Secondary Trade Area (STA) = Polygon extending West and South�
§ Residents of surrounding area
§ Commuters using MBTA Fairmount Line and bus lines (and more than 27,000 vehicles per day passing through the district)
Market Segments�
Prepared by: Peg Barringer, FinePoint Associates, in collaboration with UCMS. Consulting Assistance sponsored by Boston Main Streets. Sources: Nielsen, U.S. Census, InfoUSA, American Community Survey, Social Explorer, www.FinePointAssociates.com
- 1,000 2,000 3,000 4,000 5,000
<$25,000
$25 - $49,999
$50 - $74,999
$75 - $99,999
$100 - $149,999
$150,000 +
Households by Income
PTA STA Households not in PTA
- 1,000 2,000 3,000 4,000 5,000
Other nonfamily
One person
Other family
Married couple
Single parent
Married couple
Households by Composition
PTA STA Households not in PTA
Market Profile (cont’d) �Upham’s Corner Main Street Business District �
2
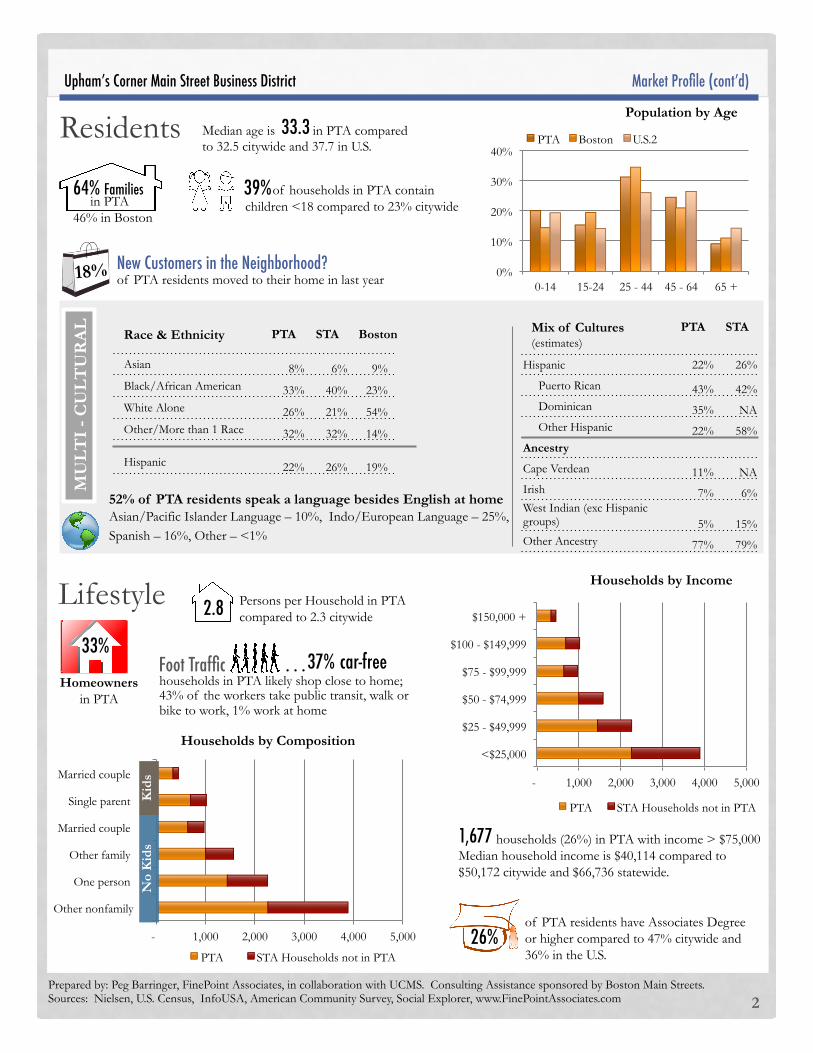
Median age is in PTA compared to 32.5 citywide and 37.7 in U.S.
33.3 �
of households in PTA contain children <18 compared to 23% citywide
39% �
Race & Ethnicity
PTA STA Boston
Asian 8% 6% 9% Black/African American 33% 40% 23% White Alone 26% 21% 54% Other/More than 1 Race 32% 32% 14% Hispanic 22% 26% 19%
33%�
Homeowners in PTA
2.8 � Persons per Household in PTA compared to 2.3 citywide
0%
10%
20%
30%
40%
0-14 15-24 25 - 44 45 - 64 65 +
Population by Age
PTA Boston U.S.2
26%�of PTA residents have Associates Degree or higher compared to 47% citywide and 36% in the U.S.
52% of PTA residents speak a language besides English at home Asian/Pacific Islander Language – 10%, Indo/European Language – 25%, Spanish – 16%, Other – <1%
New Customers in the Neighborhood?�of PTA residents moved to their home in last year 18%
Residents
Lifestyle
Kid
s N
o K
ids households (26%) in PTA with income > $75,000
Median household income is $40,114 compared to $50,172 citywide and $66,736 statewide.
1,677 �
64% Families in PTA 46% in Boston
37% car-free households in PTA likely shop close to home; 43% of the workers take public transit, walk or bike to work, 1% work at home
Foot Traffic� . . . �
MU
LT
I -
CU
LT
UR
AL
Mix of Cultures (estimates)
PTA STA
Hispanic 22% 26%
Puerto Rican 43% 42% Dominican 35% NA Other Hispanic 22% 58% Ancestry
Cape Verdean 11% NA Irish 7% 6% West Indian (exc Hispanic groups) 5% 15% Other Ancestry 77% 79%
Prepared by: Peg Barringer, FinePoint Associates, in collaboration with UCMS. Consulting Assistance sponsored by Boston Main Streets. Sources: Nielsen, U.S. Census, InfoUSA, American Community Survey, Social Explorer, www.FinePointAssociates.com
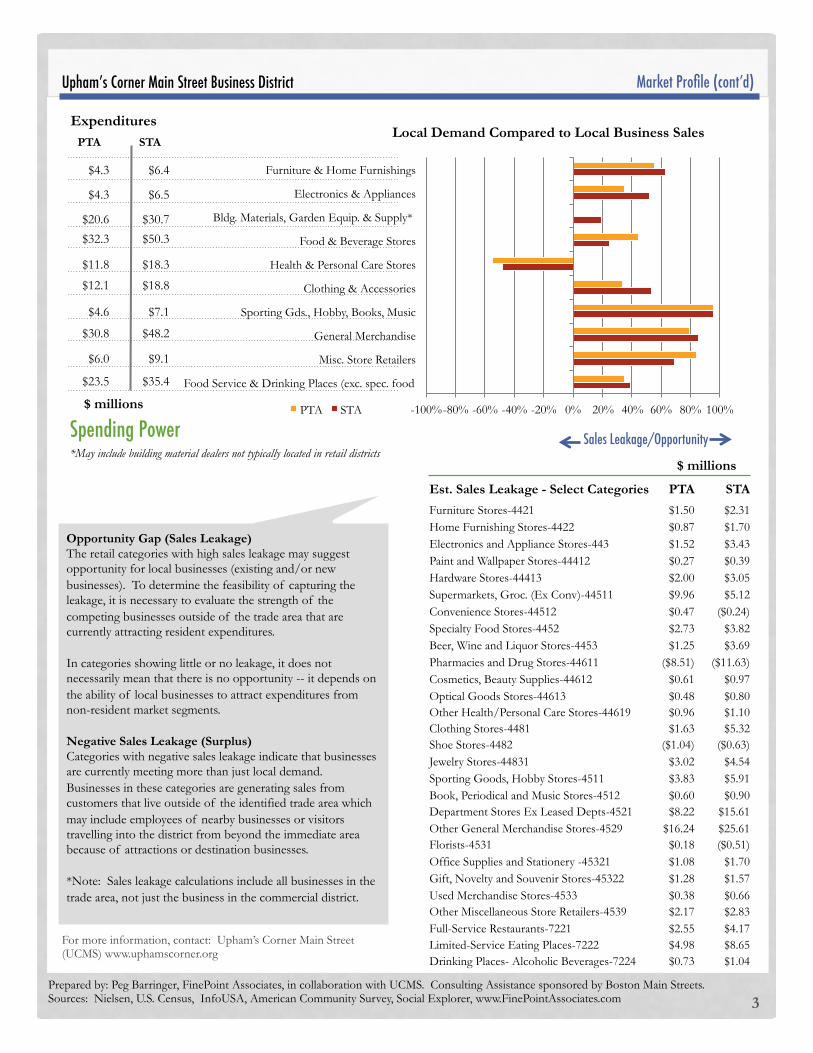
Expenditures PTA STA
$4.3 $6.4
$4.3 $6.5
$20.6 $30.7
$32.3 $50.3
$11.8 $18.3
$12.1 $18.8
$4.6 $7.1
$30.8 $48.2
$6.0 $9.1
$23.5 $35.4 $ millions
Market Profile (cont’d) �Upham’s Corner Main Street Business District �
3
-100% -80% -60% -40% -20% 0% 20% 40% 60% 80% 100%
Furniture & Home Furnishings
Electronics & Appliances
Bldg. Materials, Garden Equip. & Supply*
Food & Beverage Stores
Health & Personal Care Stores
Clothing & Accessories
Sporting Gds., Hobby, Books, Music
General Merchandise
Misc. Store Retailers
Food Service & Drinking Places (exc. spec. food
Local Demand Compared to Local Business Sales
PTA STA
Sales Leakage/Opportunity�
Opportunity Gap (Sales Leakage) The retail categories with high sales leakage may suggest opportunity for local businesses (existing and/or new businesses). To determine the feasibility of capturing the leakage, it is necessary to evaluate the strength of the competing businesses outside of the trade area that are currently attracting resident expenditures. In categories showing little or no leakage, it does not necessarily mean that there is no opportunity -- it depends on the ability of local businesses to attract expenditures from non-resident market segments. Negative Sales Leakage (Surplus) Categories with negative sales leakage indicate that businesses are currently meeting more than just local demand. Businesses in these categories are generating sales from customers that live outside of the identified trade area which may include employees of nearby businesses or visitors travelling into the district from beyond the immediate area because of attractions or destination businesses. *Note: Sales leakage calculations include all businesses in the trade area, not just the business in the commercial district.
Est. Sales Leakage - Select Categories
PTA
STA
Furniture Stores-4421 $1.50 $2.31 Home Furnishing Stores-4422 $0.87 $1.70 Electronics and Appliance Stores-443 $1.52 $3.43 Paint and Wallpaper Stores-44412 $0.27 $0.39 Hardware Stores-44413 $2.00 $3.05 Supermarkets, Groc. (Ex Conv)-44511 $9.96 $5.12 Convenience Stores-44512 $0.47 ($0.24) Specialty Food Stores-4452 $2.73 $3.82 Beer, Wine and Liquor Stores-4453 $1.25 $3.69 Pharmacies and Drug Stores-44611 ($8.51) ($11.63) Cosmetics, Beauty Supplies-44612 $0.61 $0.97 Optical Goods Stores-44613 $0.48 $0.80 Other Health/Personal Care Stores-44619 $0.96 $1.10 Clothing Stores-4481 $1.63 $5.32 Shoe Stores-4482 ($1.04) ($0.63) Jewelry Stores-44831 $3.02 $4.54 Sporting Goods, Hobby Stores-4511 $3.83 $5.91 Book, Periodical and Music Stores-4512 $0.60 $0.90 Department Stores Ex Leased Depts-4521 $8.22 $15.61 Other General Merchandise Stores-4529 $16.24 $25.61 Florists-4531 $0.18 ($0.51) Office Supplies and Stationery -45321 $1.08 $1.70 Gift, Novelty and Souvenir Stores-45322 $1.28 $1.57 Used Merchandise Stores-4533 $0.38 $0.66 Other Miscellaneous Store Retailers-4539 $2.17 $2.83 Full-Service Restaurants-7221 $2.55 $4.17 Limited-Service Eating Places-7222 $4.98 $8.65 Drinking Places- Alcoholic Beverages-7224 $0.73 $1.04
Spending Power �$ millions
For more information, contact: Upham’s Corner Main Street (UCMS) www.uphamscorner.org
*May include building material dealers not typically located in retail districts
Prepared by: Peg Barringer, FinePoint Associates, in collaboration with UCMS. Consulting Assistance sponsored by Boston Main Streets. Sources: Nielsen, U.S. Census, InfoUSA, American Community Survey, Social Explorer, www.FinePointAssociates.com
Market Profile (cont’d) �Upham’s Corner Main Street Business District �
4
Appendix – Additional Data Tables
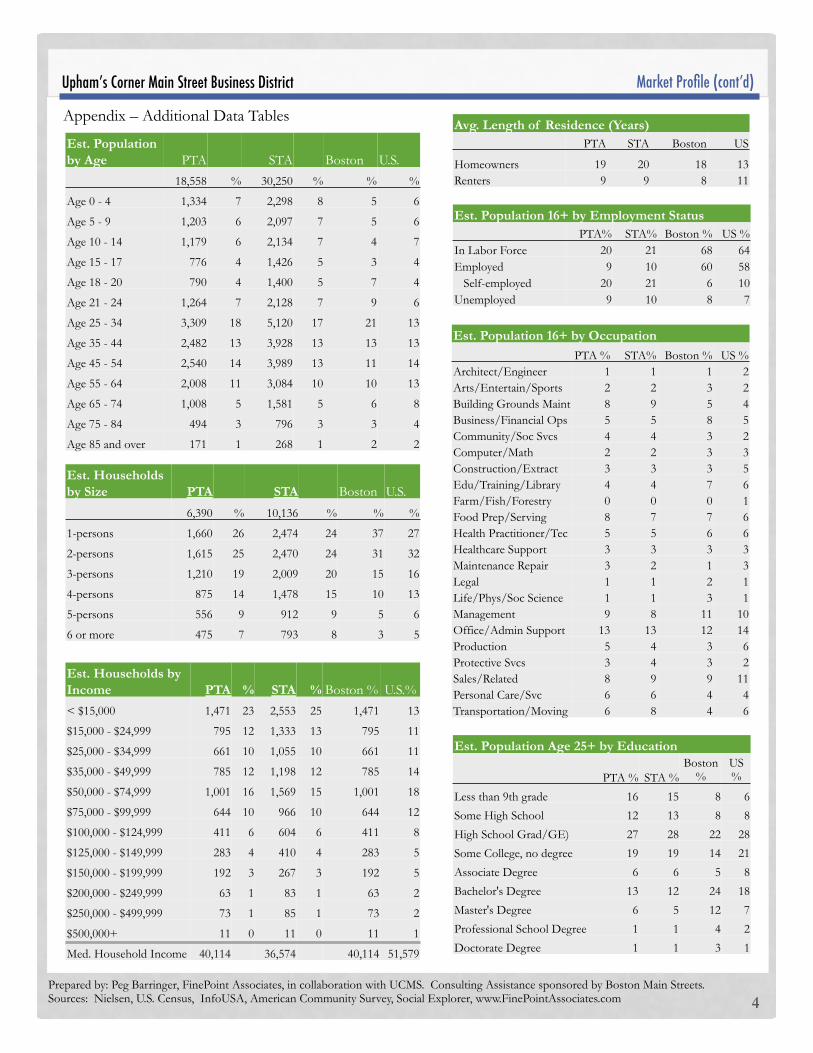
Est. Population by Age PTA STA Boston U.S.
18,558 % 30,250 % % %
Age 0 - 4 1,334 7 2,298 8 5 6
Age 5 - 9 1,203 6 2,097 7 5 6
Age 10 - 14 1,179 6 2,134 7 4 7
Age 15 - 17 776 4 1,426 5 3 4
Age 18 - 20 790 4 1,400 5 7 4
Age 21 - 24 1,264 7 2,128 7 9 6
Age 25 - 34 3,309 18 5,120 17 21 13
Age 35 - 44 2,482 13 3,928 13 13 13
Age 45 - 54 2,540 14 3,989 13 11 14
Age 55 - 64 2,008 11 3,084 10 10 13
Age 65 - 74 1,008 5 1,581 5 6 8
Age 75 - 84 494 3 796 3 3 4
Age 85 and over 171 1 268 1 2 2
Est. Population Age 25+ by Education
PTA % STA % Boston
% US %
Less than 9th grade 16 15 8 6
Some High School 12 13 8 8
High School Grad/GE) 27 28 22 28
Some College, no degree 19 19 14 21
Associate Degree 6 6 5 8
Bachelor's Degree 13 12 24 18
Master's Degree 6 5 12 7
Professional School Degree 1 1 4 2
Doctorate Degree 1 1 3 1
Avg. Length of Residence (Years) PTA STA Boston US
Homeowners 19 20 18 13 Renters 9 9 8 11
Est. Population 16+ by Occupation PTA % STA% Boston % US %
Architect/Engineer 1 1 1 2 Arts/Entertain/Sports 2 2 3 2 Building Grounds Maint 8 9 5 4 Business/Financial Ops 5 5 8 5 Community/Soc Svcs 4 4 3 2 Computer/Math 2 2 3 3 Construction/Extract 3 3 3 5 Edu/Training/Library 4 4 7 6 Farm/Fish/Forestry 0 0 0 1 Food Prep/Serving 8 7 7 6 Health Practitioner/Tec 5 5 6 6 Healthcare Support 3 3 3 3 Maintenance Repair 3 2 1 3 Legal 1 1 2 1 Life/Phys/Soc Science 1 1 3 1 Management 9 8 11 10 Office/Admin Support 13 13 12 14 Production 5 4 3 6 Protective Svcs 3 4 3 2 Sales/Related 8 9 9 11 Personal Care/Svc 6 6 4 4 Transportation/Moving 6 8 4 6
Est. Population 16+ by Employment Status PTA% STA% Boston % US %
In Labor Force 20 21 68 64 Employed 9 10 60 58 Self-employed 20 21 6 10 Unemployed 9 10 8 7
Est. Households by Size PTA STA Boston U.S.
6,390 % 10,136 % % %
1-persons 1,660 26 2,474 24 37 27
2-persons 1,615 25 2,470 24 31 32
3-persons 1,210 19 2,009 20 15 16
4-persons 875 14 1,478 15 10 13
5-persons 556 9 912 9 5 6
6 or more 475 7 793 8 3 5
Est. Households by Income PTA % STA % Boston % U.S.%
< $15,000 1,471 23 2,553 25 1,471 13
$15,000 - $24,999 795 12 1,333 13 795 11
$25,000 - $34,999 661 10 1,055 10 661 11
$35,000 - $49,999 785 12 1,198 12 785 14
$50,000 - $74,999 1,001 16 1,569 15 1,001 18
$75,000 - $99,999 644 10 966 10 644 12
$100,000 - $124,999 411 6 604 6 411 8
$125,000 - $149,999 283 4 410 4 283 5
$150,000 - $199,999 192 3 267 3 192 5
$200,000 - $249,999 63 1 83 1 63 2
$250,000 - $499,999 73 1 85 1 73 2
$500,000+ 11 0 11 0 11 1
Med. Household Income 40,114 36,574 40,114 51,579
Prepared by: Peg Barringer, FinePoint Associates, in collaboration with UCMS. Consulting Assistance sponsored by Boston Main Streets. Sources: Nielsen, U.S. Census, InfoUSA, American Community Survey, Social Explorer, www.FinePointAssociates.com
Market Profile (cont’d) �Upham’s Corner Business District �
5
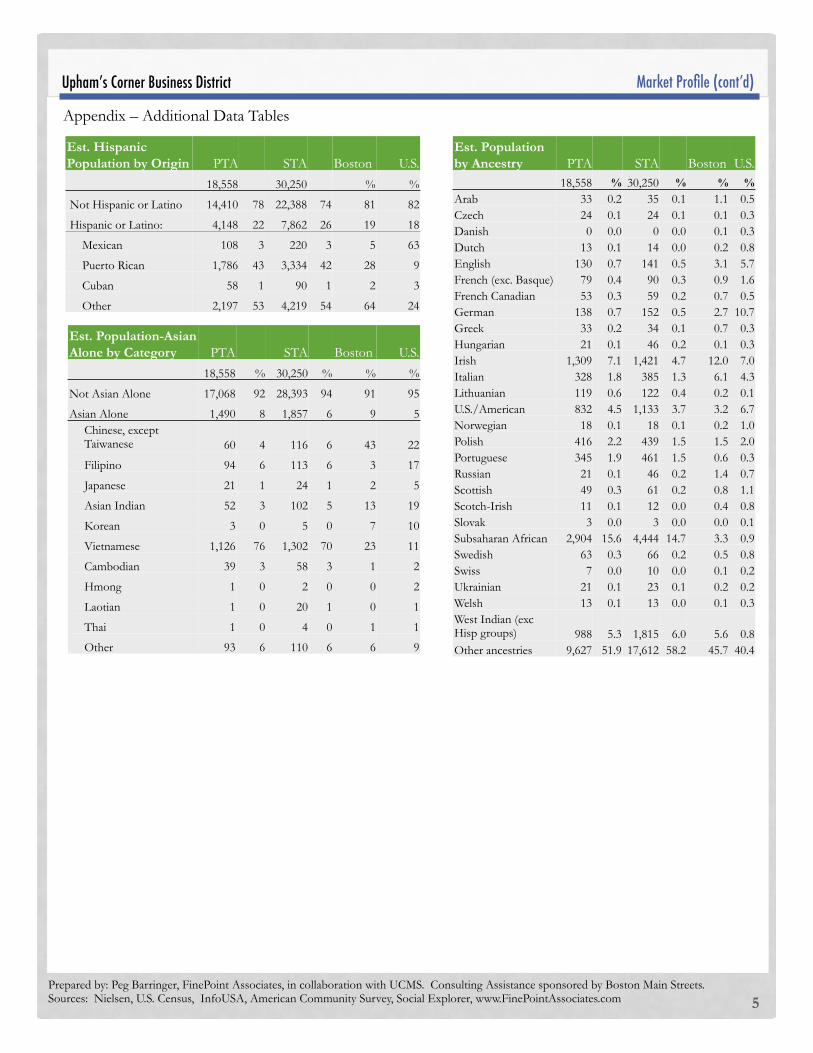
Appendix – Additional Data Tables
Est. Population by Ancestry PTA STA Boston U.S.
18,558 % 30,250 % % % Arab 33 0.2 35 0.1 1.1 0.5 Czech 24 0.1 24 0.1 0.1 0.3 Danish 0 0.0 0 0.0 0.1 0.3 Dutch 13 0.1 14 0.0 0.2 0.8 English 130 0.7 141 0.5 3.1 5.7 French (exc. Basque) 79 0.4 90 0.3 0.9 1.6 French Canadian 53 0.3 59 0.2 0.7 0.5 German 138 0.7 152 0.5 2.7 10.7 Greek 33 0.2 34 0.1 0.7 0.3 Hungarian 21 0.1 46 0.2 0.1 0.3 Irish 1,309 7.1 1,421 4.7 12.0 7.0 Italian 328 1.8 385 1.3 6.1 4.3 Lithuanian 119 0.6 122 0.4 0.2 0.1 U.S./American 832 4.5 1,133 3.7 3.2 6.7 Norwegian 18 0.1 18 0.1 0.2 1.0 Polish 416 2.2 439 1.5 1.5 2.0 Portuguese 345 1.9 461 1.5 0.6 0.3 Russian 21 0.1 46 0.2 1.4 0.7 Scottish 49 0.3 61 0.2 0.8 1.1 Scotch-Irish 11 0.1 12 0.0 0.4 0.8 Slovak 3 0.0 3 0.0 0.0 0.1 Subsaharan African 2,904 15.6 4,444 14.7 3.3 0.9 Swedish 63 0.3 66 0.2 0.5 0.8 Swiss 7 0.0 10 0.0 0.1 0.2 Ukrainian 21 0.1 23 0.1 0.2 0.2 Welsh 13 0.1 13 0.0 0.1 0.3 West Indian (exc Hisp groups) 988 5.3 1,815 6.0 5.6 0.8 Other ancestries 9,627 51.9 17,612 58.2 45.7 40.4
Est. Hispanic Population by Origin PTA STA Boston U.S.
18,558 30,250 % %
Not Hispanic or Latino 14,410 78 22,388 74 81 82
Hispanic or Latino: 4,148 22 7,862 26 19 18
Mexican 108 3 220 3 5 63
Puerto Rican 1,786 43 3,334 42 28 9
Cuban 58 1 90 1 2 3
Other 2,197 53 4,219 54 64 24
Est. Population-Asian Alone by Category PTA STA Boston U.S.
18,558 % 30,250 % % %
Not Asian Alone 17,068 92 28,393 94 91 95
Asian Alone 1,490 8 1,857 6 9 5 Chinese, except Taiwanese 60 4 116 6 43 22
Filipino 94 6 113 6 3 17
Japanese 21 1 24 1 2 5
Asian Indian 52 3 102 5 13 19
Korean 3 0 5 0 7 10
Vietnamese 1,126 76 1,302 70 23 11
Cambodian 39 3 58 3 1 2
Hmong 1 0 2 0 0 2
Laotian 1 0 20 1 0 1
Thai 1 0 4 0 1 1
Other 93 6 110 6 6 9
Prepared by: Peg Barringer, FinePoint Associates, in collaboration with UCMS. Consulting Assistance sponsored by Boston Main Streets. Sources: Nielsen, U.S. Census, InfoUSA, American Community Survey, Social Explorer, www.FinePointAssociates.com 6
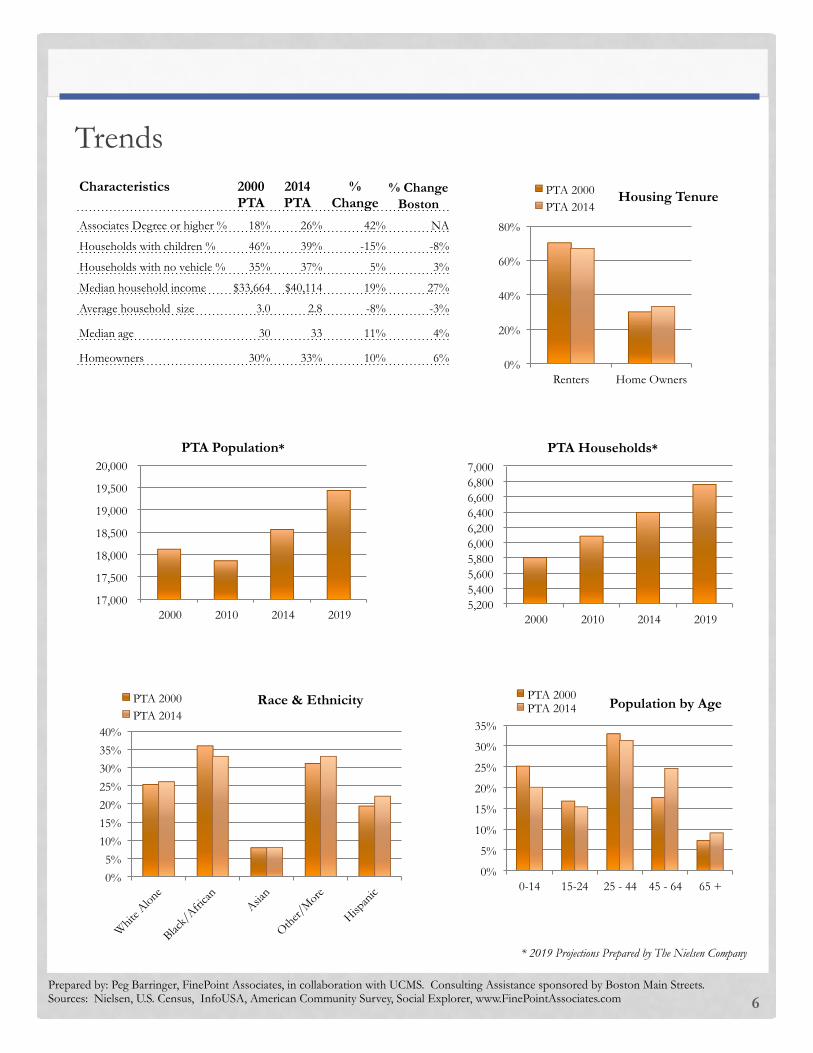
Trends
0%
5%
10%
15%
20%
25%
30%
35%
0-14 15-24 25 - 44 45 - 64 65 +
Population by Age PTA 2000 PTA 2014
Characteristics
2000 PTA
2014 PTA
% Change
% Change Boston
Associates Degree or higher % 18% 26% 42% NA
Households with children % 46% 39% -15% -8%
Households with no vehicle % 35% 37% 5% 3%
Median household income $33,664 $40,114 19% 27%
Average household size 3.0 2.8 -8% -3%
Median age 30 33 11% 4%
Homeowners 30% 33% 10% 6% 0%
20%
40%
60%
80%
Renters Home Owners
Housing Tenure PTA 2000 PTA 2014
5,200 5,400 5,600 5,800 6,000 6,200 6,400 6,600 6,800 7,000
2000 2010 2014 2019
PTA Households*
17,000
17,500
18,000
18,500
19,000
19,500
20,000
2000 2010 2014 2019
PTA Population*
0%
5%
10%
15%
20%
25%
30%
35%
40%
Race & Ethnicity PTA 2000 PTA 2014
* 2019 Projections Prepared by The Nielsen Company