ud i i p fi bl t h l iunderinvestment in profitable...
TRANSCRIPT

U d i i P fi bl T h l iUnderinvestment in Profitable Technologies when Experimentation is Costly: Evidence from a
Migration Experiment in BangladeshMigration Experiment in Bangladesh
Gharad Bryan, LSEShyamal Chowdhury, University of Sydney
A. Mushfiq Mobarak, Yale University

Famine strikes at Shunaqulir Char: Mother and Daughter go on hungry for daysTranslated from Daily Jankantha dated 2nd Nov 2005: (reports Akhil Puddar/ Thahamin Haque Bobi)Translated from Daily Jankantha dated 2nd Nov, 2005: (reports Akhil Puddar/ Thahamin Haque Bobi)
Picture (courtesy Daily Janakantha): Left: A woman showing the condition her hunger stricken grand child. Right: A person namely Matiar died while standing in line for Aid
• Rangpur districts are desperately poor (incomes ~60% of rest of country) and seasonality in income quite pronounced (~40%
in line for Aid.
drop in income before Aman harvest) (Khandker 2010)• Pre-harvest (Sept-Nov), job opportunities are limited, wages are
low grain prices are highlow, grain prices are high.2

Puzzles• Remittances into the north-west is the lowest in the country• Khandker (2010) and Zug (2008) find:• Khandker (2010) and Zug (2008) find:
– Greater inter-regional variation in income/poverty than inter-seasonal– Less pronounced seasonality in other regions– Jobs available and wages higher in nearby urban areas
• Specific Polic Goal of o r project• Specific Policy Goal of our project: Can seasonal migration mitigate the effects of the seasonal famine– Reduce the spatial mismatch between jobs and people if there is structural p j p p
seasonal unemployment in Rangpur?
• “Hungry seasons” affect hundreds of millions around the world (Malawi Madagascar Ethiopia Kenya )(Malawi, Madagascar, Ethiopia, Kenya,…)
3

Interventions
• In 2008, provided households with a small transfer conditional on migration Tk 600 + 200 ($8 50+$2 50)conditional on migration Tk 600 + 200 ($8.50+$2.50)
• Randomly allocated across 100 villages (1900 hh)C sh Gr nt (37 ill s)– Cash Grant (37 villages)
– Credit (31 villages)– Information (16 villages)Information (16 villages)– Control (16 villages)
• Within each village, added conditionalities to random subsets of households (e.g. migrate in a group, or to a specific destination)
• Program implemented by umbrella organization for microcredit NGONGOs
4

1. Seasonal out-migration appears to have large causal benefits for monga-prone householdsg p
– High take-up and large consumption effects– People re-migrate a year later after incentives removed
2. Why do households fail to take advantage of this apparently attractive investment?
– Data most consistent with a rational model in which people are uncertain about their own return to migration, and don’t experiment out of fear of a devastatingly negative outcomeexperiment out of fear of a devastatingly negative outcome.
– Inducing inaugural migration can lead to long-run benefits.
3. Should we scale this program up? What would be the3. Should we scale this program up? What would be the optimal policy design?
5

ContributionsGeneral:1. What are the causal effects of seasonal migration on g
poverty, caloric intake, distribution of expenditures?– Large literature on effects of migration (Gibson et al 2010, Yang 2008,
McKenzie et al 2010 Adams 1998 Barham and Boucher 1998…)McKenzie et al 2010, Adams 1998, Barham and Boucher 1998…)
2. Risky Experimentation holds back technology adoption and development
– Green Revolution (Munshi 2004), lower investment in agricultural inputs (Rosenzweig and Wolpin 1993, Dercon and Christiansen 2009), hinders entrepreneurship (Hausmann and Rodrik 2003, Fischer 2009)
Specific:1. Is a migration support program a cost-effective response? 2 Wh i h d i f h i l di i2. What is the design of the optimal grant, credit or insurance
scheme to promote seasonal out-migration during famine? 6

Returns to Seasonal Migration
Offer Accepted Kept Money Migration Rate
Table 1: Program Take-upg
p p yRate
Cash 71.48% 48.26% 59.0%
Credit 52.98% 34.21% 56.8%
Info .35.14% 35.9%
Control . 35.9%
IncentivizedNot
IncentivizedP‐Value
Migration Rate 58% 36%Migration Rate 2008
0.00(0.014) (0.0196)
Remigration 47% 37%0 00
Migration the
Rate 20090.00
( 0.014) (.020 )next season(after incentives removed)

Table2: Effects of Migration on Consumption amongst i i h h ld bremaining household members
OLS IV Mean of Dep. Var.79.16*** 224.8*
Food Expenditures 79.16 224.8
729.2(18.08) (124.2)
Non Food Expenditures46.04*** 111.5**
274.4(8.448) (49.54)(8.448) (49.54)
Total Expenditures124.5*** 337.5**
1003.1(22.36) (154.1)231 3*** 729 4***
• Per capita expenditures, food expenditures and caloric intake
Total Caloric intake231.3 729.4
2091.3(40.61) (238.1)
p p pincrease 30-35% among migrant households
• Monthly consumption increased by at least $4 per capita ($15/ho sehold) d e to ind ced migration [Travel cost=$7]($15/household) due to induced migration. [Travel cost=$7]
• Food consumption shifts towards meat and child education expenditures increased among migrant households.

Table 4: Savings, Earnings, RemittancesAll Migrants Incentivized Not
IncentivizedObs
Total Savings by household 3490.5 3506.6 3434.9 951Total Earnings by household 7777 2 7451 3 8894 4* 952Total Earnings by household 7777.2 7451.3 8894.4* 952
Savings per day 56.8 56.5 57.8 905Earnings per day 99.4 96.1 111.5*** 926g p yRemittances per day 17.8 16.2 23.3*** 926
Travel Cost per Episode 444.2 444.4 443.6 953
O l E l dEmployed &
Table 5: Earnings of Non Migrants remaining at origin
IncomeOnly Employed
Employed & Unemployed
Job type: Daily 94.7 87.9Job type: Salary 64.9 60.6Non Agricultural Business Daily Profits
61.1 .
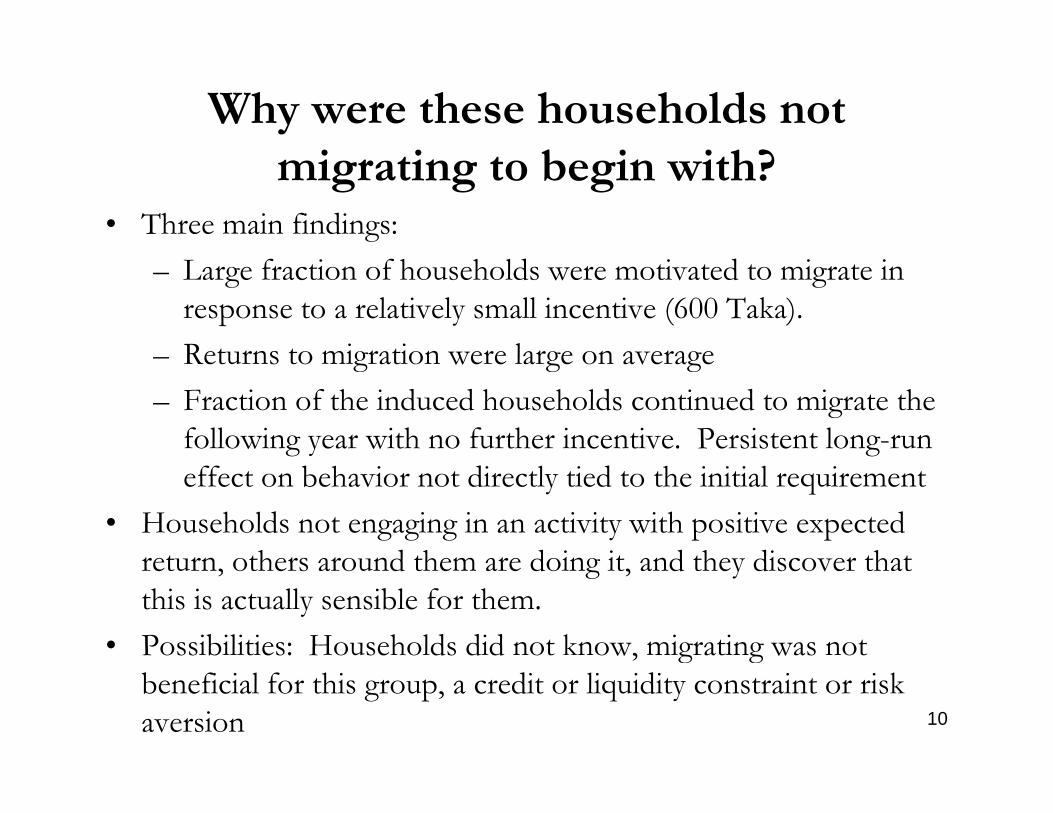
Why were these households not i i b i i h?migrating to begin with?
• Three main findings: – Large fraction of households were motivated to migrate in
response to a relatively small incentive (600 Taka).Returns to migration were large on average– Returns to migration were large on average
– Fraction of the induced households continued to migrate the following year with no further incentive. Persistent long-run effect on behavior not directly tied to the initial requirement
• Households not engaging in an activity with positive expected return others around them are doing it and they discover thatreturn, others around them are doing it, and they discover that this is actually sensible for them.
• Possibilities: Households did not know, migrating was not g gbeneficial for this group, a credit or liquidity constraint or risk aversion 10

A model of risky experimentationA model of risky experimentation
• Income at home y, from migration (y + b) with prob. μ(b), and ( ) i h b ( ) h b(y + g) with prob. μ(g), where g>b.
• Household is a discounted expected utility maximizer such that:• Household is a discounted expected utility maximizer such that:u(y + g) > u(y); and u(y + b)< u(y). (y ) (y)
11

12
13

14

Two important implications for our experiment:
• First, we can quantify what it means for the impact of the incentive to be “large”. Given the parameters used in Figure 5 the transfer reduces y* from 0 275 to 0 259 On the other handthe transfer reduces y* from 0.275 to 0.259. On the other hand, the incentive decreases y* to 0.241, that is, the same size incentive has roughly twice the impact.
• Second, because the insurance policy realizes the lions share of th i fr m th i ti p li pr di t th t mpiri llthe gain from the incentive policy, we predict that empirically our “cash” and “loan” treatments will have a similar size impact on the migration rate.
15

Predictions:Predictions:
• 1. Cash and Credit treatments should have a similar impact on1. Cash and Credit treatments should have a similar impact on migration rates;
• 2. The incentive should have a larger impact on households that are close to subsistence;
• 3. The incentive should have a larger impact on households that do not have network connections at the destination; and
• 4. Households should exhibit location specific learning.
16

Additional tests of the modelAdditional tests of the model
17
18

19
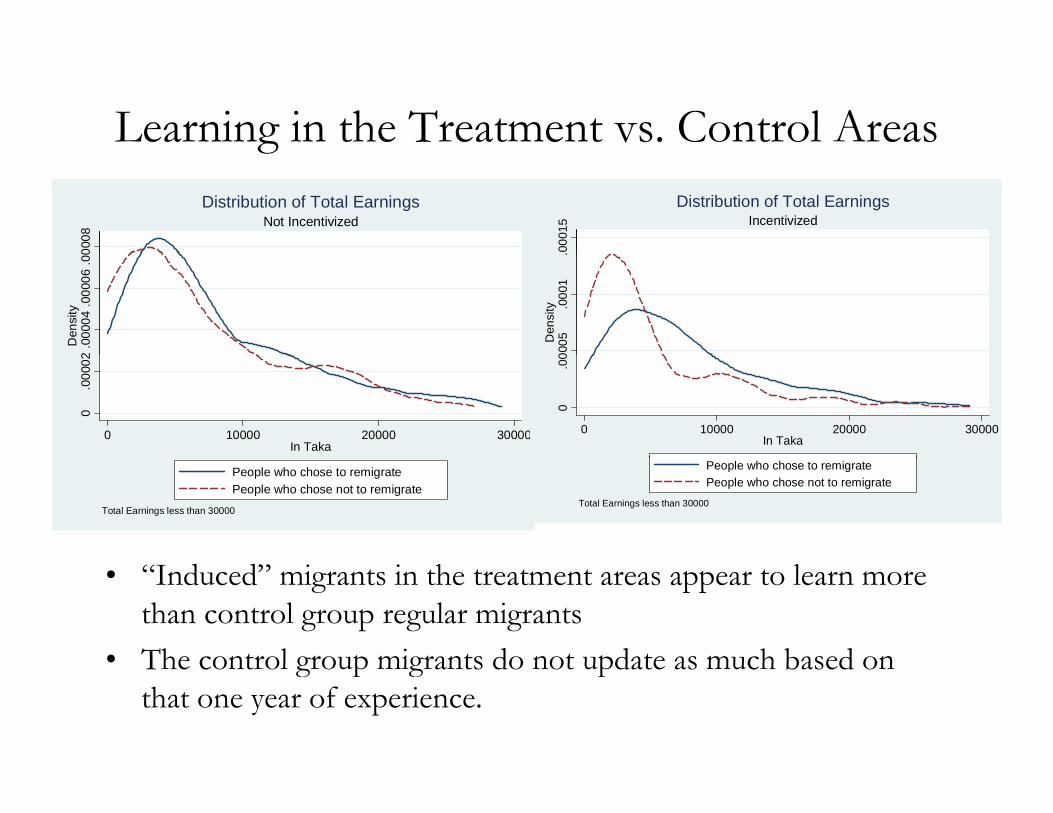
Learning in the Treatment vs. Control Areas00
08
Not IncentivizedDistribution of Total Earnings
0001
5 IncentivizedDistribution of Total Earnings
g2
.000
04.0
0006
.00
Den
sity
0005
.000
1.
Den
sity
0.0
0002
0 10000 20000 30000In Taka
0.0
0
0 10000 20000 30000In Taka
People who chose to remigratePeople who chose not to remigrate
Total Earnings less than 30000
People who chose to remigratePeople who chose not to remigrate
Total Earnings less than 30000
• “Induced” migrants in the treatment areas appear to learn more than control group regular migrants
• The control group migrants do not update as much based onThe control group migrants do not update as much based on that one year of experience.
21

AlternativesAlternatives
• Households face a strong liquidity constraintg q y
• Relieving the liquidity constraint in one year leads to ongoing migration either through learning or increased income that g g grelaxes the liquidity constraint again the following year.
• However, given the strong repeat impact and the small size of , g g p pthe transfer, a liquidity constraint story would not hold over time.
• The above discussion applies equally to any mechanism that does not emphasize the incentive effect of our treatments.
22

Concerns• Since an incentive is involved, are people accurately
reporting their migration? – Verification at the destination is imperfect since people
migrated outside the given window, and given destinationsW if h i b ki h i i– We verify their reports by asking the same question in two different surveys conducted 6 months apart. >85% consistencyy
– We are able cross-verify >60% of reports of group migration by independently asking the migration partners
– We independently ask neighbors (>85% neighbors verify) • Are people just going on a short vacation?
Almost all migrants find work within a week– Almost all migrants find work within a week– Short-run consumption/expenditure effects suggest
otherwise23

Conclusions
• Results suggest that we ought to think about the role of micro-credit more broadlycredit more broadly
• Not everyone is an entrepreneur, but credit and other financial services can be used to reduce spatial mismatch between people and jobs
• People respond to small incentives, and this has large returns even in the very short run and long-lasting impacts on behavioreven in the very short run, and long lasting impacts on behavior and outcomes even after the incentive is removed
• The model proposed here is applicable to other risky technologies where the downside is potentially devastating. e.g. new varieties of seeds, agricultural practices
• We gain a better understanding of Seasonal Migration a commonWe gain a better understanding of Seasonal Migration, a common practice to diversify away from agri (Banerjee and Duflo 2006)
24