ugwu, celestina chibuzo - university of nigeria … · mrs. ugwu, celestina chibuzo a postgraduate...
TRANSCRIPT

1
ISOLATION AND
CHARACTERIZATION OF Bacillus
cereus STRAINS FROM VARIOUS
FOODS IN NSUKKA.
BY
UGWU, CELESTINA CHIBUZO
PG/M.Sc./03/34129
DEPARTMENT OF MICROBIOLOGY
UNIVERSITY OF NIGERIA, NSUKKA
MARCH, 2009.

2
TITLE PAGE
ISOLATION AND CHARACTERIZATION OF Bacillus cereus
STRAINS FROM VARIOUS FOODS IN NSUKKA.
BY
UGWU, CELESTINA CHIBUZO
PG/M.Sc./03/34129
SUBMITTED TO THE SCHOOL OF POST GRADUATE
STUDIES,
UNIVERSITY OF NIGERIA, NSUKKA
IN PARTIAL FULFILLMENT OF THE REQUIREMENT
FOR THE AWARD OF MASTER’S DEGREE
(M.Sc.) IN MEDICAL MICROBIOLOGY
SUPERVISOR: DR. (MRS.) I.M. EZEONU
MARCH, 2009.

3
CERTIFICATION
Mrs. Ugwu, Celestina Chibuzo a postgraduate student in the
Department of Microbiology, majoring in medical Microbiology, has
satisfactorily completed the requirements for course work and research for
the degree of Master in Science (M.Sc.) in Microbiology. The work is
embodied in her dissertation original and has not been submitted in part
or full for either diploma or degree of this University or any other
University.
Prof. J.C. Ogbonna I.M. Ezeonu Ph.D.
Head, Supervisor
Department of Microbiology Department of MCB
University of Nigeria, Nsukka University of Nigeria, Nsukka.

4
DEDICATION
I dedicate this work to God Almighty and Mother Mary

5
ACKNOWLEDGEMENT
It is my wish to express my profound gratitude to God Almighty for
affording me good health, wisdom and understanding to accomplish this
work.
I am highly indebted to my project supervisor Dr. (Mrs.) I.M.
Ezeonu for her patience, encouragement, time spent with me and
corrections from the initial stage to the conclusions of this work despite
her crowded involvement in other things.
My gratitude also goes to Dr. Emeka Nweze for his contributions
and encouragement throughout this work. I am grateful to him for helping
me get the reference strains which I used in this work. I am also thankful
to Dr. Rooney, Alejandro P. a Research Geneticist, Microbial Genomics and
Bioprocessing Research Unit, USA for his kindness in taking his pains to
send me the reference strains.
My gratitude also goes to the following people for their help and
encouragement throughout this work; Prof. (Mrs.) J.I. Okafor, Prof. C.U.
Iroegbu, Prof. J.O. Ugwuanyi, Rev. Sr. Dr. M.C.U. Dibua, Dr. C.U.
Anyanwu, Mr. J.A.C. Ugonabo, Dr. E.A. Eze, Mr. Chibuzo Eze, Mrs. B.N.
Nwike, Mrs. J.O. Etonyeaku, Mr. E.I Oyibo, Mr. P.U. Ugwu, Mrs. M.O.
Ugboaja, Mr. J.O. Mbawuike, Mrs. T.I. Onyia, Mrs. E.E. Ilukwe, and Mrs.
M. Ayogu.
I am grateful to my lovely husband Mr. Ugwu, Francis E. for his
moral, financial support and encouragement throughout the period of my
studies. I am also thankful to my lovely mother, siblings and my children

6
Ogechi, Nnanna, Ifeanyi, Chinedum and Emeka for encouragement and
patience.
I am also grateful to Miss Onugwu Nwakaego of Our Redeemer
Computers and Mr. Chibuzo of Ez Computers who did their best to see this
work through.
7
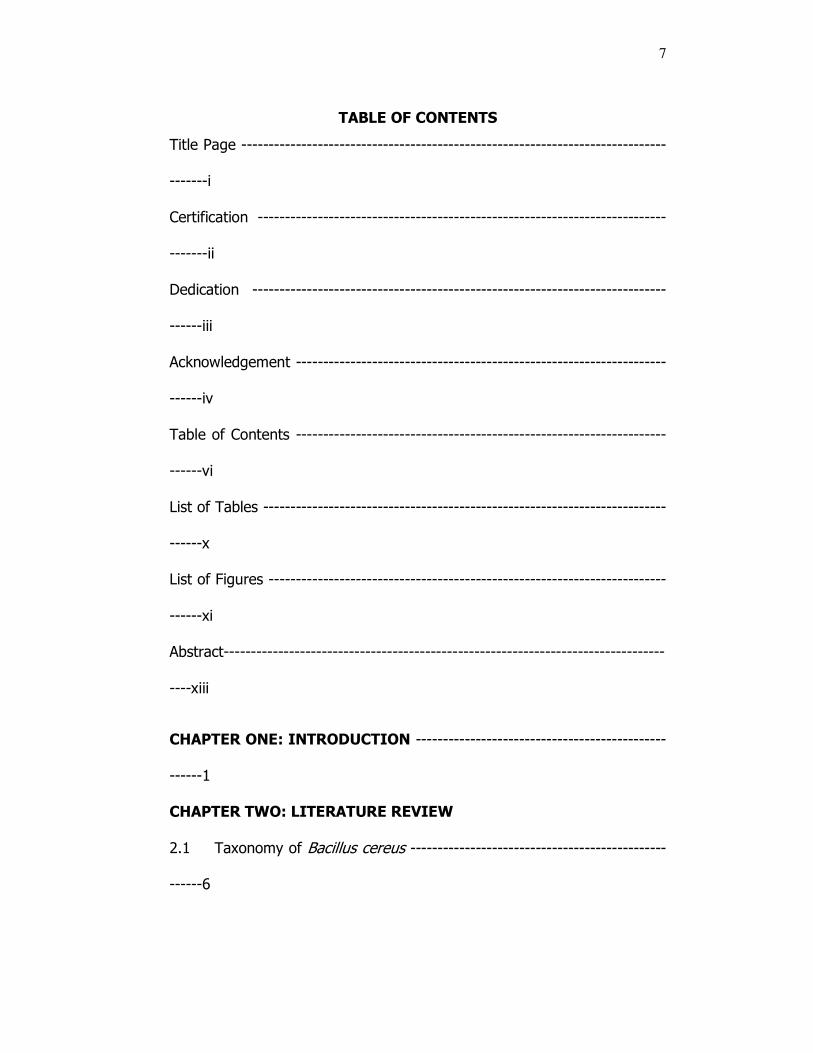
TABLE OF CONTENTS
Title Page ------------------------------------------------------------------------------
-------i
Certification ---------------------------------------------------------------------------
-------ii
Dedication ----------------------------------------------------------------------------
------iii
Acknowledgement --------------------------------------------------------------------
------iv
Table of Contents --------------------------------------------------------------------
------vi
List of Tables --------------------------------------------------------------------------
------x
List of Figures -------------------------------------------------------------------------
------xi
Abstract---------------------------------------------------------------------------------
----xiii
CHAPTER ONE: INTRODUCTION ----------------------------------------------
------1
CHAPTER TWO: LITERATURE REVIEW
2.1 Taxonomy of Bacillus cereus -----------------------------------------------
------6

8
2.2 History of Bacillus cereus ---------------------------------------------------
-------7
2.2.1 Characteristics of Bacillus cereus ------------------------------------------
-------8
2.2.2 Serotyping of Bacillus cereus -----------------------------------------------
------9
2.2.3 The Genome of Bacillus cereus --------------------------------------------
-------9
2.3 The Ecology of Bacillus cereus----------------------------------------------
-----10
2.3.1 Bacillus cereus in the Environment ----------------------------------------
-----10
2.3.2 Bacillus cereus in Food ------------------------------------------------------
-----10
2.3.3 Reservoir of Bacillus cereus ------------------------------------------------
-----13
2.4 Foods Implicated in Growth and Poisoning ------------------------------
-----14
2.5 Symptoms of Bacillus cereus Food Poisoning ----------------------------
-----15
2.5.1 The Diarrhoeal Syndrome ---------------------------------------------------
----15
2.5.2 The Emetic Syndrome -------------------------------------------------------
-----16

9
2.6 Epidemiology of Bacillus cereus --------------------------------------------
----17
2.6.1 The Incidence of Bacillus cereus Food Poisoning -----------------------
-----17
2.6.2 Transmission of Bacillus cereus --------------------------------------------
-----18
2.6.3 Nature of Bacillus cereus Cells in Foods at Consumption --------------
-----20
2.6.4 Fate of Bacillus cereus Cells in the Digestive Tract ---------------------
-----20
2.6.5 Dose Response Relations ---------------------------------------------------
-----21
2.7 Enterotoxines and Virulence Factors of Bacillus cereus ----------------
-----22
2.7.1 Haemolysin BL HBL ----------------------------------------------------------
-----22
2.7.2 Non Haemolytic Enterotoxin (NHE) ----------------------------------------
----23
2.7.3. Enterotoxin T -----------------------------------------------------------------
-----24
2.7.4 Enterotoxin FM ---------------------------------------------------------------
-----25
2.7.5 Haemolysin 1 -----------------------------------------------------------------
-----26

10
2.7.6 Haemolysin 2 -----------------------------------------------------------------
-----26
2.7.7 Phospholipases C -------------------------------------------------------------
-----26
2.7.7.1 Phosphatidyl Inositol Hydrase ---------------------------------------------
----27
2.7.7.2 Phosphatidyl Choline Hydrolase ------------------------------------------
-----27
2.7.7.3 Sphingomyelinase -----------------------------------------------------------
-----27
2.7.8 Cytotoxin-K --------------------------------------------------------------------
----28
2.7.9 Vacuolation Factor -----------------------------------------------------------
-----28
2.7.10 Spore ---------------------------------------------------------------------------
----29
2.8 Physical and Chemical Factors Affecting Bacillus cereus Growth -----
-----30
2.8.1 Temperature ------------------------------------------------------------------
-----30
2.8.2 pH ------------------------------------------------------------------------------
-----31
2.8.3 Water Activity -----------------------------------------------------------------
-----32

11
2.8.4 Sodium Chloride -------------------------------------------------------------
-----32
2.8.5 Effect of Heating -------------------------------------------------------------
-----33
2.8.6 Effect of Food Additives -----------------------------------------------------
-----34
CHAPTER THREE: MATERIALS AND METHODS
3.1 Media and Media Preparation ----------------------------------------------
-----35
3.2 Samples collection -----------------------------------------------------------
-----36
3.3 Isolation of Organisms ------------------------------------------------------
-----36
3.4 Identification Tests ----------------------------------------------------------
-----37
3.4.1 Motility -------------------------------------------------------------------------
-----37
3.4.2 Catalase -----------------------------------------------------------------------
-----37
3.4.3 Hemolysis ---------------------------------------------------------------------
-----38
3.4.4 Gelatin Liquefaction ----------------------------------------------------------
----38

12
3.4.5 Starch Hydrolysis -------------------------------------------------------------
-----39
3.4.6 Spore Staining ----------------------------------------------------------------
-----39
3.5 Standardization of inoculum ------------------------------------------------
-----40
3.6 Determination of the effect of Temperature on the
Vegetative Growth and Spore Germination of Bacillus cereus Strains -------------------------------------------------------------------------
-----41
3.7 Determination of the effect of pH on the Growth of Bacillus cereus Strains ------------------------------------------------------------41
3.8 Evaluation of Heat Resistance of Vegetative Cells ----------------------
-----41
3.9 Determination of the effect of Carbon Source on the Growth of Bacillus cereus -------------------------------------------------------------
----42
3.10 Plasmid DNA Profiling -------------------------------------------------------
-----43
3.11 Data Analysis -----------------------------------------------------------------
-----45
CHAPTER FOUR: RESULTS
4.1 Isolation and Characterization of Bacillus cereus -----------------------
-----46
4.1.1 Morphological and Metabolic Characterization of all the
Isolates -----------------------------------------------------------------------------46

13
4.1.2 Morphological and Metabolic Characterization of Reference Strains -------------------------------------------------------------------------
-----46
4.1.3 Selection of Classical Bacillus cereus Isolates ---------------------------
-----51
4.1.4 Plasmid Profile of Bacillus cereus Strains Isolated from Foods --------
---51
4.2 Effect of Temperature on the Vegetative Growth of Bacillus cereus Strains ----------------------------------------------------------------
----58
4.3 Effect of Temperature on the Spore Germination of Bacillus
cereus Strains ---------------------------------------------------------------------58
4.4 Effect of pH on the Growth Bacillus cereus Strains ---------------------
-----63
4.5 Heat Resistance of Bacillus cereus Strains--------------------------------
-----69
4.6 Effect of Carbon Source on the Growth of Bacillus cereus Strains -------------------------------------------------------------------------
-----78
CHAPTER FIVE: DISCUSSION
Conclusion -----------------------------------------------------------------------------
-----88
Recommendation ---------------------------------------------------------------------
-----89
References ----------------------------------------------------------------------------
-----90
Appendixes ----------------------------------------------------------------------------
---102

14
LIST OF TABLES
Table 1: Incidence of Bacillus cereus in Different Food Samples -------
-----47
Table 2: Morphological and Metabolic Characterization of all the
Isolates ----------------------------------------------------------------
-----48
Table 3: Morphological and Metabolic Characterization of Reference
Strains -----------------------------------------------------------------
-----49
Table 4: Morphological and Metabolic Characterization of Bacillus
cereus Strains --------------------------------------------------------
-----52
Table 5: The Decimal Reduction Times (D-value) for the Test Strains
–77

15
LIST OF FIGURES
Figure 1: Plasmid Profile of Bacillus cereus Strains Isolated from Foods------------------------------------------------------------
-----57
Figure 2: Vegetative growth of Bacillus cereus Strains at 370C----------
-----59
Figure 3: Vegetative growth of Bacillus cereus Strains at 280C-----------
-----60
Figure 4: Spore germination of Bacillus cereus Strains at 370C-----------
-----61
Figure 5: Spore germination of Bacillus cereus Strains at 280C-----------
-----62
Figure 6: Effect of pH on the Growth of NRRL-B14724 strain of Bacillus cereus ---------------------------------------------------------64
Figure 7: Effect of pH on the Growth of BC7 strain of Bacillus cereus-----------------------------------------------------------------------65
Figure 8: Effect of pH on the Growth of BC9 strain of Bacillus
cereus ----------------------------------------------------------------------66
Figure 9: Effect of pH on the Growth of NBC strain of Bacillus cereus ----------------------------------------------------------------------67
Figure 10: Effect of pH on the Growth of BC10 strain of Bacillus
cereus-----------------------------------------------------------------------68
Figure 11: Heat resistance of isolates at 40 degrees ------------------------
-----70

16
Figure 12: Heat resistance of isolates at 50 degrees-------------------------
-----71
Figure 13: Heat resistance of isolates at 60 degrees ------------------------
-----72
Figure 14: Heat resistance of isolates at 70 degrees ------------------------
-----73
Figure 15: Heat resistance of isolates at 80 degrees ------------------------
-----74
Figure 16: Heat resistance of isolates at 90 degrees ------------------------
-----75
Figure 17: Heat resistance of isolates at 100 degrees ----------------------
-----76
Figure 18: Growth of Bacillus cereus Strains on 1% Glucose
as sole carbon source ----------------------------------------------------79
Figure 19: Growth of Bacillus cereus Strains on 5% Glucose
as sole carbon source------------------------------------------------
-----80
Figure 20: Growth of Bacillus cereus Strains on 10%
Glucose as sole carbon source ------------------------------------------81
Figure 21: Growth of Bacillus cereus Strains on rice as sole carbon source --------------------------------------------------------
-----82

17
ABSTRACT
This study was carried out to determine the prevalence of Bacillus cereus in
various foods and characterize the Bacillus cereus strains isolated. All tested food
samples yielded Bacillus cereus as determined by growth on B. cereus selective
medium. A total of 350 B. cereus strains were isolated, comprising 123 (35.14%)
from rice, 111 (31.71%) from meat and 116 (33.14%) from fish. Morphological
and metabolic characterization of the isolates showed that 259 (74.00%) of the
B. cereus strains were haemolytic, 58 (16.57%) hydrolyzed starch, 252 (72.00%)
liquefied gelatin and 253 (72.29%) fermented mannitol. All isolates were motile,
catalase positive and contained endospores. Of the 350 strains, 67 (19.14%) had
the same morphological and biochemical characteristics as the two reference
strains used in the study and were therefore confirmed to be typical B. cereus
strains. Evaluation of the effect of temperature on growth showed that both
vegetative growth and spore germination occurred at 28oC and 37oC but not at
4oC. Growth of the cells occurred from pH 5 to pH 9 at 37oC with optimum at pH
7. There was no growth at pH 4. The B. cereus strains were significantly (P <
0.05) different in their responses to heat. Spores of all strains were resistant to
heat up to 60oC. At 80oC, the decimal reduction times (D-values) for the test
strains were: BC7, 208 min; BC9, 383 min; NBC, 23 min; NRRL-B14724, 250 min
and NRRL-B14725, 192 min. At 90oC, the D-values were: BC7, 64 min; BC9, 110
min; NRRL-B14724, 134 min and NRRL-B14725, 15 min and at 100oC, the D-
values were: BC7, 17 min; BC9, 16 min; and NRRL-B14724, 21 min. Differences
were also observed in the use of carbon source by the strains. Only the negative
control, NBC, grew on glucose while there was no significant (P > 0.05) growth
of the reference strain and classical test isolates. All strains grew well on rice in
contrast to the reference strain. The results of plasmid profiling showed that the
classical, negative control and reference strains contained multiple plasmids,
characteristic of B. cereus, except Bacillus thuringiensis, which contained only
one plasmid. The similarity in plasmid profiles of the strains suggested that they
are all B. cereus strains, including the atypical NBC strain.

18
CHAPTER ONE
INTRODUCTION
Bacillus cereus is an aerobic spore former that is commonly found
in soil, on vegetation and in many raw and processed foods. Consumption
of foods that contain large numbers of Bacillus cereus (> 106/g) may
result in foods poisoning, especially when foods are prepared and held for
several hours without adequate refrigeration before serving. Cooked meat,
vegetables, boiled or fried rice, vanilla sauce, custards, soups and raw
vegetable sprouts have been incriminated in past outbreaks (Bennett and
Harmon, 1988; Adams and Moss, 1995).
Two types of illnesses are attributed to the consumption of foods
contaminated with Bacillus cereus. The first is the diarrhoeal form, which
is characterized by abdominal pain, nausea and watery diarrhoea. It has
an incubation period of 4 – 16 hours and symptoms last for 12 – 24 hours.
The second type of illness is the emetic form, which is characterized by
acute attack of nausea and vomiting that occurs within 1 – 5 hours after a
meal. Desserts, meat dishes, and dairy products are the foods most
frequently associated with the diarrhoeal form, whereas rice and pasta are
the most common vehicles of the emetic form (Kramer and Gilbert, 1989).
Bacillus cereus is ubiquitous and can be found in a wide range of
foodstuffs, soil, raw materials, raw fruits and vegetables, raw herbs, dry
foods and processed foods. Almost all kinds of foods have been implicated
in B. cereus food borne poisoning and these foods may be contaminated
from any of many sources. Soil can contain between 103 spores of B.

19
cereus per gram (Guinebretiere and Nguyen-the, 2003; Te Giffel et al.,
1995; Christiansson et al., 1999). Spores of B. cereus persist on the
surface of processing equipment because these spores have strong
adhesion properties and might form biofilms (Anderson et al., 1995). Raw
milk is contaminated by B. cereus strains that persist in milk silo tanks
(Svensson et al., 2004). In complex foods, some ingredients have been
identified as important sources of contamination with B. cereus spores.
These include texturing agents, (Guinebretiere and Nguyen-the, 2003),
liquid eggs, herbs and spices (ICMSF, 2003). Spores of B. cereus were also
found in paper mill industries and in packaging materials (Pirttijarvi et al.,
2000) which could represent an additional route of contamination for
foods. Furthermore, because the organism is a spore former, complete
elimination of this organism from foods may present a difficulty. This may
explain why outbreaks of illness due to Bacillus cereus continue to be
recorded.
B. cereus has a long history of association with food poisoning. An
early report associating food poisoning with Bacillus species was made in
1906 when Lubenau described an outbreak in a sanatorium where 300
inmates and staff developed symptoms of profuse diarrhoea, stomach
cramps and vomiting. A spore forming Bacillus was isolated from meatballs
from the incriminated meal. Although Lubeanau (1906) named the
organism Bacillus peptonificans, the properties he described resemble
those of Bacillus cereus. Subsequently, aerobic spore formers were
implicated in a number of outbreaks in Europe between 1943 and 1945.

20
They were suspected of causing 117 of 367 cases investigated by the
Stockholm Board of Health. Bacillus cereus was not conclusively
established as a cause of food poisoning until 1950, after the taxonomy of
the genus had been clarified.
Hauge (1950) described four outbreaks in Norway involving 600
people. The food vehicle was a vanilla sauce which had been prepared a
day in advance and stored at room temperature before serving. Samples
of the sauce later tested contained from 1.1 x 10⁶ to 2.5 x 10⁷ cells of
Bacillus cereus. This classic report and many of the early ones from
Europe described an illness in which diarrhoea was the predominant
symptom.
Since 1975, a number of other Bacillus species have been
associated with food borne illness. In these episodes, tests have failed to
find known pathogens but food remnants and / or clinical specimens have
yielded high numbers of Bacillus spp. Far more common than outbreaks
featuring Bacillus cereus, they usually feature Bacillus species belonging to
the same morphological group, predominantly Bacillus subtills but also
Bacillus licheniformis and Bacillus pumilus. B. cereus food poisoning may
sometimes be misdiagnosed due to symptomatic similarities to
Staphylococcus aureus intoxication (Bacillus cereus vomiting type) or
Clostridium perfringens food poisonging (B. cereus diarrhoeal type). In
1977, 35 diarrhoeal food poisoning outbreaks were reported in the US,
following consumption of meat loaf, cooked rice, mashed potatoes, green
bean salad, chicken pot pie, vanilla sauce, and vegetable sprouts turkey

21
loaf. The symptoms exhibited include watery diarrhea, cramps, abdominal
pain, nausea but not vomiting, and no fever. The onset was from 12 – 18
hr and duration was greater than 24 hrs. These symptoms are similar to
those observed in Clostridium perfringens food poisoning. By 1979, 110
outbreaks of emetic food poisoning occurred in Chinese restaurants or
carry-outs and followed the consumption of boiled rice (boiled rice kept at
room temperature). The symptoms included acute nausea and vomiting,
no diarrhoea, no fever and the onset was from 1 – 5 h while duration was
for 6 – 24 hr. These are similar to symptoms of Staphylococcus aureus
food poisoning. In 1980, 9 outbreaks were reported to the Centres for
Disease Control and included such foods as beef, turkey and Mexican
foods. In 1981, 8 outbreaks were reported which primarily involved rice
and shellfish. On September 22, 1985, the Marine Bureau of Health was
notified of a gastrointestinal illness among patrons of a Japanese
restaurant. The customers exhibited symptoms of illness while still on the
restaurant premises, while the question of the specific vehicle remains
incompletely resolved; the clinical and laboratory findings substantially
support Bacillus cereus as the cause of the outbreak. On July 21, 1993,
the Lord fair-fax (Virginia) Health District received reports of acute
gastrointestinal illness that occurred among children and staff at two
jointly owned child day care centres following a catered lunch. Of the 80
persons, 67 ate the catered lunch. Chicken fried rice prepared at a local
restaurant was the only food significantly associated with illness. Illness

22
occurred in 14 (29%) of 48 persons who ate the chicken fried rice,
compared with none of 16 who did not.
In Nigeria, there is limited information on outbreaks of food
poisoning due to Bacillus cereus.
The objectives of this study were:
• To determine the incidence of Bacillus cereus strains in different food
samples.
• To characterize the Bacillus cereus strains isolated.
• To determine the effect of temperature on the vegetative growth and
spore germination.
• To determine the effect of pH on the growth
• To determine the heat resistance of both vegetative cells and spores of
Bacillus cereus.
• To determine the effect of carbon sources [glucose versus complex
carbohydrate (rice)] on the growth.

23
CHAPTER TWO
LITERATURE REVIEW
2.1 Taxonomy of Bacillus cereus
Bacillus cereus belongs to the family Bacillaceae. The family’s
distinguishing feature is the production of endospores, which are highly
refractive resting structures formed within the bacterial cells. The
members of the genus Bacillus are characterized as Gram-positive, rod-
shaped, aerobic or facultative, endospore-forming bacteria.
Bacillus cereus and the five species Bacillus thuringiensis, Bacillus
anthracis, Bacillus weihenstephanensis, Bacillus mycoides and Bacillus
pseudomycoides form a very homogenous group with 99% similarity in
their 16S r RNA sequences (Ash et al., 1991; Ash and Collins, 1992).
These six species can, however, be distinguished by phenotypic and
genotypic features (Claus and Berkeley, 1986; Lechner et al., 1998;
Nakamura, 1998).
Bacillus cereus is currently considered as a food borne disease
agent, B. thuringiensis produces a parasporal crystal toxin against insect
and is used as a bio-pesticide, B. anthracis is the agent of anthrax and B.
weihenstephanensis is able to grow at 4–5oC. However, the distinction of
the species B. thuringiensis, B. cereus and B. anthracis is not supported by
recent results in taxonomy (Guinebretiere and Sanchis, 2003; Helgason et
al., 2004). In particular, the ability to produce the parasporal crystal, the
distinctive feature between Bacillus thuringiensis and Bacillus cereus can

24
be carried by a plasmid. Thus, loss of the plasmid would turn a Bacillus
thuringiensis into a Bacillus cereus and vice versa.
2.2 History and Description of Bacillus cereus
Outbreaks of food poisoning due to Bacillus spp. have been
described since the beginning of the century (Lund, 1990). The first
confirmed outbreak of Bacillus cereus food poisoning occurred in Norway
in 1950. The food vehicle was vanilla sauce, which had been prepared a
day in advance and stored at room temperature before serving.
Consumption of the contaminated vanilla sauce resulted in a diarrhoeal
illness. The sauce was later found to contain 2.5 x 10⁷ to 1.1 x 10⁸ cells of
Bacillus cereus. Four related outbreaks were described involving more
than 600 people. To provide further evidence that Bacillus cereus was the
causative agent, Hauge, (1950) inoculated sterile sauce with Bacillus
cereus, incubated it for 24 hours and then consumed the sauce. The onset
of symptoms occurred 12 hours later. Subsequently, Bacillus cereus was
recognized as an important cause of food poisoning world wide. From
1980 to 1995, Bacillus cereus accounts for 7.4% of all bacterial food-borne
outbreaks of known aetiology in Australia. However, this number is
doubtlessly a minor representation of the true incidence of food poisoning
caused by this organism due to underreporting and the mildness of the
majority of cases.

25
2.2.1 Characteristics of Bacillus cereus
Bacillus cereus is a Gram-positive, aerobic, spore forming bacillus
with large vegetative cells, typically 1.0 µm by 3.0 – 5.0 µm in chains. This
organism grows over a temperature range of 8 to 55oC, with optimum
growth around 28 – 40oC, and does not have any marked tolerance for
low pH (minimum 5.0 – 6.0, depending on the acidulant) or water activity
(minimum 0.95).
Spores are central, ellipsoidal in shape and do not cause swelling in
the sporangium. As a spore former; Bacillus cereus is widely distributed in
the environment and can be isolated from soil, water and vegetation. This
ubiquity means that it is also a common component of the transient gut
flora in humans. The spores show a variable heat resistance, recorded D
values at 95oC in phosphate buffer range between around 1 min up to 36
min.
Bacillus cereus produces typical crenated colonies which retain the
turquoise-purple of the pH Indicator (bromocresol purple) on Bacillus
cereus selective medium due to their inability to ferment mannitol. They
are surrounded by a zone of egg-yolk precipitation caused by lecithinase
activity. This organism also produces lavender colonies with beta or apha
hemolysis on blood agar.

26
2.2.2 Serotyping of Bacillus cereus
Bacillus cereus may be differentiated into 18 serotypes based upon
flagellar (H) antigens. Eight of these serotypes are responsible for food
borne illness caused by this organism. Serotypes 1, 3, 4, 8 and 12 have
been associated with emetic illness while serotypes 1, 6, 8, 9, 10 and 12
have been associated with diarrhoeal (Serotypes, 1, 8 and 12 have been
associated with both syndromes (Graham and Paul, 2006). Shinagawa et
al., (1992) also discovered serotype 1 to be the most commonly isolated
serotype from emetic outbreaks of Bacillus cereus (Serotype 1: 23%;
serotype 8: 2%; untypable, 2%).
Parry and Gilbert (1980) conducted a study to determine the heat
resistance of Bacillus cereus spores at 95oC. The researchers found that
isolates of serotype 1 were the most resistant. They suggested that the
preparation of rice might select for serotype 1 and therefore explain why
this serotype is most commonly implicated in food-borne outbreaks.
2.2.3 The Genome of Bacillus cereus
Genetic maps of Bacillus cereus strains have indicated that the
chromosomal size may vary from 2.4 to more than 5.5 Mb. It is believed
that the Bacillus cereus genome may exist either as one large
chromosome with smaller extrachromosomal elements, or as a small
chromosome with large extra chromosomal elements. The genome seems
to have a constant region of 2.4 Mb and a less stable region which is more
easily mobilized into other genetic elements. The less stable part of the

27
genome is localized to one region of the chromosome and is believed to
be subject to frequent relocations between the chromosome and episomal
elements (Carlson and Kolso, 1993). They found plasmids in five Bacillus
cereus strains with an apparent size of 730 kb (ATCC 6464), 600 kb (F
2038/78), 450 kb (Strain 41), 400 kb (ATCC 33018) and 290 kb
(F4810/72). These large plasmids were separated in a pulse-time-
dependent manner, indicating they were linear (large circular plasmids will
not enter the gel).
2.3 The Ecology of Bacillus cereus
2.3.1 Bacillus cereus in the Environment
Bacillus cereus may be found in soil, dust and water that have run
off the soil. Bacillus cereus occurs in soils containing low levels of organic
matter. The presence of this organism in plant foods is due to soil
contamination rather than a specific association between the micro-
organism and plants.
2.3.2 Bacillus cereus in Food
Bacillus cereus is widespread in the environment and enters the
food chain through contaminated food and water. The organism is present
in most raw foods of plant origin with numbers especially high in some
samples of spices and cereals. The resistance to desiccation of the spores
allows the organism to survive on most dried food products. Rice is the
most commonly implicated food in cases of Bacillus cereus gastroenteritis.
28
Most samples of rice have low levels of Bacillus cereus present. Fried or
cooked rice has been implicated in approximately 95% of cases of Bacillus
cereus food poisoning with emetic symptoms indicating that there is a
relationship between substrate and emetic toxin production. Many food
poisoning cases have occurred where bulk rice is prepared in advance.
Resistant spores (particularly serotype 1) may survive cooking to
germinate, grow and produce emetic toxin during storage. This scenario
commonly occurs in Chinese restaurants and take-away establishments.
Leftover portions of boiled rice from bulk cooking are allowed to “dry off”
at room temperature and when required are either reheated or, more
usually flash fried before service. Parry and Gilbert, (1980) found Bacillus
cereus in 25 of 252 samples of boiled rice and 49 of 204 samples of fried
rice. Levels of the bacterium ranged from 102 – 105 cfu per gram in boiled
and fried rice.
Bacillus cereus is of particular concern in the dairy industry for
several reasons. Firstly the spores are very hydrophobic and attach to the
surfaces of the pipelines of the dairy processing plant, where they might
germinate, multiply and resporulate. Secondly, pasteurization heating is
insufficient to kill the spores, while competition from vegetative bacteria is
eliminated. Thirdly several strains of Bacillus cereus are psychrotrophic
and are capable of growth in milk at temperatures as low as 4 – 6oC
(Anderson et al., 1995). Granum (1997) suggested that milk drinkers may
be partially protected against Bacillus cereus food poisoning through
immunity acquired by continuous consumption of this organism. Despite

29
the frequency at which dairy products are found to be contaminated with
Bacillus cereus, no outbreak have occurred from consumption of milk and
milk products, except for a few cases involving cream and certain
desserts. Presumably the high numbers of the organism required to elicit
symptoms causes visible spoilage of milk and other dairy products and this
deters consumption of the product (Andersson et al., 1995).
Bacillus cereus has been isolated from a variety of other foods
including beans, cocoa, fish, dried potatoes, lentils, oil and meat. An
outbreak of diarrhoeal food poisoning occurred after a University field day
in South Carolina, U.S.A. People at the field day who ate barbecued pork
were five times more likely to develop symptoms than those who did not
eat the pork. The pork was un-refrigerated for 18 hours after cooking.
Subsequent tests showed that the leftover pork contained > 105 cfu/g of
enterotoxigenic Bacillus cereus.
Raw fruits and vegetables, raw herbs, dry foods, and processed
foods before storage usually contain < 100 spores/g. However, in some
herbs and spices, presence of > 100 spores/g was reported (ICMSF,
2003). Bacillus cereus is frequently present as spores either because
vegetative cells have been killed by preparation of ingredients (for
instance mild heat treatment, drying) or because conditions do not permit
spore germination and growth (dry product such as spices and herbs for
instant). The presence of spores in such raw materials is usually not a
concern. However Bacillus cereus spores would survive cooking and high
numbers of spores in spices and herbs can be a problem whenever they

30
are used in processed foods allowing growth of the organism. Storage of
the processed product or use of raw materials in complex foods, with
conditions suitable for Bacillus cereus growth, permit spore germination
and growth of Bacillus cereus to numbers that might represent a hazard
for consumers.
Additional contamination during processing may occur because
spores of Bacillus cereus have strong adhesion properties, might form
biofilms and may persist on the surface of processing equipment
(Andersson et al., 1995). For instance raw milk can be contaminated by
Bacillus cereus strains that persist in milk silo tanks (Svensson et al.,
2004). Contamination of pasteurized and powdered milk by Bacillus cereus
strains persisting in pasteurized and drying equipment was also suspected
(Eneroth et al., 2001; Svensson et al., 1999; Te Giffel et al., 1996). In
complex foods some ingredients have been identified as important source
of contamination with Bacillus cereus spores such as texturing agents,
(Guinebretiere and Nguyen-the, 2003) liquid eggs, herbs and spices
(ICMSF, 2003).
2.3.3 Reservoir of Bacillus cereus
Soil is the primary source of contamination of foods with spores of
Bacillus cereus. For instance, the same genotypes were found in the soil of
dairy farms and in the milk (Christiansson et al., 1999), and in the soil on
which vegetables were grown and in cooked chilled foods containing the
vegetables (Guinebretiere and Nguyen-the, 2003). Soil can contain

31
between 103 and 105 spores of Bacillus cereus per gram (Guinebretiere
and Nguyen-the, 2003; Te Giffel et al., 1995; Christiansson et al., 1999).
Development of some strains of Bacillus cereus and of some strains of the
very close species Bacillus thuringiensis was observed in the rhizosphere
of plants and in the gut of earthworms (Hendriksen and Hansen, 2002;
Halverson et al., 1993). Climate presumably influences the Bacillus cereus
population in soil, psychrotrophic strains being more frequent in soil from
cold regions (Vonstetten et al., 1999).
2.4 Foods Implicated in Poisoning
Because Bacillus cereus is ubiquitous and might be present in
several foods consumed by patients, it is particularly difficult to trace the
food involved in food borne poisoning.
Food categories implicated are frequently heat-treated foods (recipe
dishes, stews, purees). However, other food categories (salads, sprouts,
orange juice, mayonnaise dressing) have been implicated. Food borne
poisoning frequently occurs in restaurant or in catering services. Failure in
refrigeration and/or too long delay before consumption are presumably
factors that lead to poisoning (EFSA, 2005).
Emetic Bacillus cereus food borne intoxications are frequently linked
to rice and pasta dishes. In particular, cooking rice and keeping it
unrefrigerated several hours before frying or re-heating may lead to
several emetic intoxication outbreaks. The emetic toxin, cereulide, may be
32
produced during storage of the cooked rice but not destroyed by the
frying or re-heating step (Kramer and Gilbert, 1989).
A wide range of foods have been implicated in poisoning from other
Bacillus spp, including various recipe dishes, meat products, pastries, dairy
products, infant food formulae, sandwich, pizzas, canned tomato juice. In
all cases, suspected foods usually contained between 106 – 109 cfu/g
(Kramer and Gilbert, 1989; Salkinoja-Salonen et al., 1999).
2.5 Symptoms of Bacillus cereus food poisoning
2.5.1 The Diarrhoeal Syndrome
The diarrhoeal illness caused by Bacillus cereus is characterized by
abdominal pain, profuse watery diarrhoea and rectal tenesmus. The illness
is usually quite mild. However, cases that require hospitalization have
occurred. The incubation period for this syndrome is 8 – 16 hours after the
consumption of the food and symptoms last for 12 – 24 hours. Nausea
and vomiting are not commonly associated with the diarrhoeal illness.
Levels of Bacillus cereus found in the implicated foods responsible for this
syndrome range from 5 x 10⁵ to 9 x 10⁸ cfu/g (Adams and Moss, 1995).
The diarrhoeal syndrome of Bacillus cereus food poisoning can be
mediated by at least three distinct enterotoxins. The pH and proteolytic
enzyme of the gut digests these toxins if they are preformed in foods.
Therefore, the diarrhoeal illness is proposed to be due to bacteria growing
in the intestine. Spores, which have survived indigestion, are believed to
sporulate in the intestine and grow to produce viable cells, which then

33
produce toxin. The action of these toxins at the molecular level is not well
established. However, they are known to reverse the absorption of fluids,
sodium, and calcium and to cause mal-absorption of glucose and amino
acids (Mantynen and Lindstrom, 1998).
2.5.2 The Emetic Syndrome
The emetic illness is more acute than the diarrhoeal illness and
symptoms occur only 1–5 hours after the ingestion of the contaminated
food. The illness is characterized by nausea and vomiting, which lasts for 6
– 24 hours. Levels of Bacillus cereus in foods associated with the emetic
illness range from 1.0 x 10³ to 5.0 x 10¹⁰ cfu/g (Adams and Moss, 1995).
The emetic toxin is regarded as the most dangerous of the toxins
produced by Bacillus cereus. This is highlighted in a case where a 17-year
old boy and his father developed acute gastroenteritis after eating
spaghetti and pesto that had been prepared four days earlier. The boy
died within two days due to fulminant liver failure and rhabdomyolysis.
The father developed hyperbilirubinemia and rhabdomyolsis but
recovered. High concentrations of the emetic toxin were found in both the
residue from the pan used to reheat the food and the boy’s liver and bile
(Mahler et al., 1997). In most cases of emetic toxin food poisoning, illness
occurs following ingestion of pre cooked food held for too long at
unsatisfactory storage temperatures.

34
2.6 Epidemiology of Bacillus cereus
2.6.1 The Incidence of Bacillus cereus Food Poisoning
The reported incidence of Bacillus cereus food poisoning varies
widely between different countries. It is apparent that a major factor in
this variation is the differing reporting procedures between countries. In
most cases the true prevalence of food poisoning is grossly underreported.
Moreover, the reporting rate of illness caused by Bacillus cereus may be
underestimated due to the relatively short duration of both disease
syndromes (< 24 hours). In addition, the frequency at which single people
are affected is usually not monitored. Consequently the full extent of
Bacillus cereus food poisoning is unknown.
In the USA, from 1988 to 1992, a total of 2,423 food-borne disease
outbreaks affecting 77,375 people were reported. In approximately 40%
of these cases the aetiology was confirmed. Bacillus cereus was
responsible for 21 outbreaks, affecting 433 people. Chinese food was the
most commonly implicated vehicle of transmission (Notermans and Batt,
1998).
In the Netherlands, from 1992 to 1994, a total of 1,543 outbreaks
and 1,087 single cases of food-borne disease were reported, involving a
total of 7,567 people. The causative agent was identified in only 8.3% of
the cases. Bacillus cereus was the most frequently isolated pathogen and
was implicated in 40 incidences. The most commonly implicated food
vehicle was Chinese foods (Notermans and Batt, 1998). The Netherlands
and Norway experienced the highest reported incidence of outbreaks from

35
this organism. However, Bacillus cereus has been the focus of much
research in these countries and this may explain the high isolation rate
from food poisoning outbreaks (Granum, 1997).
The type of illness most commonly encountered in countries also
vary. In Japan, the emetic illness is reported about 10 times more
frequently than the diarrhoeal form of the disease. In Europe and North
America the diarrhoeal illness is reported more frequently. This variation is
presumably due to the differences in diet and nutrition that exist between
these countries (Granum, 1997).
2.6.2 Transmission of Bacillus cereus
Asymptomatic carriage of Bacillus cereus has been reported in 14 to
43% of people. In addition, during the acute phase of the illness, faeces
may contain up to 109 organisms/gram and bacteria can also be isolated
from the vomitus. This suggests that human contacts such as food
handlers may be an important source of Bacillus cereus in foods. The
belief, however, is that the organism most commonly enters the food
chain through contaminated soil or water (Graham and Paul, 2006).
Raw foods of plant origin are the major source of Bacillus cereus.
The majority of outbreaks associated with this organism occur when food
has been held for too long at unsatisfactory storage temperatures. For
instance, Johnson et al., (1983) found that the numbers of Bacillus cereus
can double in 25 – 60 minutes in boiled rice held at 30oC. This rate is
reported to be higher if protein source such as chicken, beef or eggs are

36
present. Milk is frequently found contaminated with Bacillus cereus
particularly if cows are fed with silage or are housed in barns.
Contamination is often linked to the cow’s udder or equipment at the farm
and the dairy factory. Bacillus cereus and Bacillus licheniformis were the
most commonly isolated species of Bacillus found in milk at all stages of
processing. Bacillus cereus was associated with cattle feed throughout the
year. However, the bacteria were more common in raw milk during the
summer months. Although Bacillus licheniformis was more frequently
found in higher numbers, Bacillus cereus grew to dominate the bacterial
population when grown at ambient temperatures. In all but three months
Bacillus cereus was isolated from raw or heat-treated milks after
incubation (30oC for 24 h) regardless of it being undetected in the non-
incubated samples (Graham and Paul, 2006).
Foods implicated in Bacillus cereus food poisoning illnesses usually
contain at least 105 cfu/g. However, 10% of outbreaks have been
associated with food containing less than 105 cfu/g. Kramer and Gilbert
(1989) surveyed the data from a large number of Bacillus cereus disease
outbreaks. Levels of Bacillus cereus involved in the diarrhoeal syndromes
studied varied from 1.2 x 10³ to 1.0 x 10⁸ organisms/gram with a median
value of approximately 1 x 10⁷ organisms/gram. The data from the emetic
outbreaks showed that the numbers of Bacillus cereus in implicated foods
ranged from 1.0 x 10³ to 5.0 x 10¹⁰ organisms/gram with a median value
of 1 x 10⁷ organisms. Granum (1997) suggested that food with more than
104 Bacillus cereus cells/spores may not be safe for consumption.

37
2.6.3 Nature of Bacillus cereus Cells Present in Foods at
Consumption
Diarrhoeal poisoning is most probably due to Bacillus cereus cells
ingested with the food. Most foods will be contaminated with spores of
Bacillus cereus and whenever conditions are not favourable to spore
germination and growth, Bacillus cereus would be ingested as spores. In
contrast, whenever conditions in the food permit germination and growth,
Bacillus cereus would be ingested as vegetative cells. In particular,
refrigeration at 4-7oC, would select the psychrotrophic strains of Bacillus
cereus (Notermans et al., 1997). The number of viable Bacillus cereus cells
and the nature of the organisms (vegetative or spores, respectively;
psychrotrophy or mesophily) that may be ingested is determined by the
combination of initial contamination and the way the food is handled prior
to ingestion. In the case of emetic poisonings, production of emetic toxin
in the food would depend on the presence of strains carrying the genes
responsible for emetic toxin production and of food conditions.
2.6.4 Fate of Bacillus cereus cells in the Digestive Tract
After consumption, food reaches the stomach where the ingested
Bacillus cereus cells and toxins are exposed to low pH and the action of
pepsin. In case where the food was handled properly only spores would
be present and irrespective of the pH of the stomach, spores would reach
the small intestine. If, on the other hand, the food was handled
improperly, spores, vegetative cells and toxins would be present. The

38
emetic toxin, depending on the concentration, would bind to the 5-HT3
receptors in the stomach and cause the emetic intoxication. Diarrhoeal
toxins are destroyed by enzymatic activity in the stomach. Whether only
spores or spores and vegetative cells pass the stomach to reach the small
intestine would depend on the pH of the stomach. A sufficiently low pH
will kill the vegetative cells, but higher pH values give vegetative cells the
opportunity to reach the small intestine (Clavel et al., 2004).
Thus, pH of the stomach during digestion of the contaminated food
(depending on the consumer and on the composition of the meal) and
nature of Bacillus cereus in the food (vegetative cells or spores) would
certainly influence the number of Bacillus cereus cells required to cause
diarrhoea.
2.6.5 Dose Response Relations
Bacillus cereus spores occur widely in foods and survive extended
storage (Setlow et al., 1997). The levels of Bacillus cereus reported in food
poisoning range from 102 – 108 cfu/g (Beattie and Williams, 2000). It is
generally believed that any food exceeding 104 to 105 cells or spores per
gram may not be safe for consumption (Beattie and Williams, 2000;
Granum and Lund, 1997; Notermans and Batt, 1998). This number is
often exceeded in a wide range of foods that are actually consumed.
Nonetheless, illness is relatively rare considering the high levels (> 103
cfu) of Bacillus cereus that are consumed (Notermans et al., 1997;
Notermans and Batt, 1998). This probably reflects the wide variation of

39
pathogenic potential and overall diversity among Bacillus cereus strains
(Helgason et al., 2000). Bacillus cereus toxico-infections and intoxications
with a short incubation period contains 105 – 108 Bacillus cereus per gram.
The infective dose may vary from 105 – 108 viable cells or spores in
part because of the large differences in the amount of enterotoxin
produced by different strains. Hence food containing > 104 cells/spores
per g may sometimes pose a risk (Granum and Lund, 1997).
2.7 Enterotoxins and Virulence Factors of Bacillus cereus
Enterotoxins and virulence factors of Bacillus cereus remain
uncertain, partly because it produces a large number of proteins that
potentially possess toxigenic activity and partly because these proteins are
difficult to isolate. Illness associated with this organism may be mediated
by the synergistic effect of a number of products (Graham and Lund,
2006).
2.7.1 Haemolysin BL (HBL)
Haemolysin BL (HBL) is a haemolysin consisting of three
proteinaceous subunits: B, L1 and L2, a binding factor and two “lytic”
factors, respectively. These three subunits have been purified and
characterized. The toxin shows dermonecrotic activity as well as activity
towards vascular permeability, and causes fluid accumulation in ligated
rabbit ileal loops (Granum and Lund, 1997). Beecher and Macmillan (1990)
identified a three component toxin that was only active when all three

40
components were present. The researchers found that the individual
components of HBL were not haemolytic. However, when the components
were recombined, haemolytic activity was restored. All three components
are necessary for maximal enterotoxic activity (Beecher et al., 1995;
Thompson et al., 1984; Beecher and Macmillan, 1991).
The B component of HBL has a molecular mass of 35 KDa and is
encoded by the gene hbla. The component’s role as a binding protein was
verified by an immunofluorescent staining procedure that detected the
attachment of purified B component to sheep erythrocytes (Beecher and
Macmillan, 1991). The L1 component of HBL has a molecular mass of 36
KDa and L2 has a molecular mass of 45KDa and these mediate lysis of
cells.
2.7.2 Non-haemolytic Enterotoxin (NHE)
Non-haemolytic Enterotoxin (NHE) has been characterized (Lund
and Granum, 1996) and, like HBL, consists of three proteinaceous subunits
as well; NHE A, NHE B and NHE C, two lytic factors and a binding factor
respectively. Although binary combinations of the subunits show some
biological effect, maximal activity is achieved when all three components
are present (Lund and Granum, 1997). Here too, a single gene codes for
each subunits, and the genes of all three subunits are grouped in one
operon. There is substantial similarity between the proteins of the
haemolytic and the non-haemolytic enterotoxin (Granum et al., 1999).

41
Transcription of the operon for the haemolytic enterotoxin HBL, and
the operon for the non-haemolytic enterotoxin NHE seems to be positively
regulated by plcR, a gene that also regulates Phospholipase C expression
(Agaisse et al., 1999; Granum et al., 1999). This plcR gene has also been
described in connection with enterotoxic properties of Bacillus
thuringiensis, which also belongs to the Bacillus cereus group (Agaisse et
al., 1999). It has been proven that plcR- strains are not able to produce
the enterotoxin HBL, while their plcR+ equivalent did show HBL-
production (Salamitou et al., 2000)
2.7.3 Enterotoxin T
Enterotoxin T is a single component protein enterotoxin with
activity towards vascular permeability. Also it exhibits cytotoxicity to vero
cells, causes fluid accumulation in the ligated rabbit ileal loop test, and is
lethal to mice after intravenous injection (Agata et al., 1995a). Such
properties were found also by Shinagawa after the production and
subsequent purification of a single non-haemolytic protein (Shinagawa et
al., 1992a). The Enterotoxin T has a molecular weight of 41 KDa.
Studies utilizing PCR to determine the prevalence of enterotoxin T
in strains of Bacillus cereus vary in their results. Agata et al., (1995a)
found the gene bce-T in 100% (10/10) of the isolates tested. The bacteria
included four strains obtained from diarrhoeal syndrome food born
illnesses, three strains from emetic syndrome food-borne illness and three
strains from soil and from raw and cooked rice. Granum et al., (1995)

42
detected the bceT gene in only 40% (37/71) of the isolates tested. Hsieh
et al., (1999) reported that the gene was present in 50% (14/28) of
Bacillus cereus food isolates and 57% (17/30) outbreak-associated strains.
Mantynen and Lindstrom (1998) only found the gene in the model strain
(B – 4ac) of 58 strains of Bacillus cereus. These discrepancies may be due
to the use of different primers or to varying populations in different
regions.
2.7.4 Enterotoxin FM
Enterotoxin F M is a three component enterotoxin complex
composed of three protein with molecular masses of approximately 39, 45
and 105 kDa. This three component enterotoxin complex was first
discovered by Granum et al., (1996). Similar to HBL, all components are
required for maximal cytotoxic activity. The complex is highly cytotoxic to
vero cells but is non-haemolytic. The 45 kDa component is the same
protein as the main antigen detected in the Bacillus Diarrhoeal Visual
Immunoassay (Tecra). The sequence of the 39 kDa protein overlaps with
five of the six amino acids in the N-terminal of the L1 protein of HBL
(Beecher and Wong, 1994). Furthermore, the three toxic component were
all recognized by a polyclonal antiserum for detection of enterotoxin from
Bacillus cereus (Lund and Granum, 1996).

43
2.7.5 Haemolysin 1
Haemolysin 1 (or cereolysin) is a thiol activated protein that cross-
reacts with streptolysin-O and has a molecular weight of about 5 kDa. This
protein is responsible for the main haemolysis observed in Bacillus cereus
and is lethal when injected into mice. Haemolysin 1 is heat labile but is not
susceptible to proteolysis. It is inhibited by cholesterol and serum
(Granum, 1994).
2.7.6 Haemolysin 2
Haemolysin 2 is heat labile and susceptible to proteolytic enzymes.
The molecular weight of the protein is approximately 30 kDa. It is not
susceptible to cholesterol. The in vivo toxicity of this protein has not yet
been established (Granum, 1994).
2.7.7 Phospholipases C
Bacillus cereus produces three different phospholipases C. They
have all been cloned and are well characterized. Phospholipases C specific
for various phospholipids have been isolated from several bacteria, such
as Pseudomonas aeruginosa, Staphylococcus aureus and Bacillus cereus
(Yamada et al., 1988).

44
2.7.7.1 Phosphatidyl inositol Hydrase
Phosphatidylinositol Hydrase (PIH) is a 34 kDa enzyme which
hydrolyses phosphatidylinositol (P1) and P1 – glycan – containing
membrane anchors, which are important structural components of one
class of membrane proteins. Phosphatidylinositol Hydrase is non-
haemolytic and does not require any ions for biological activity. This
enzyme is not generally linked to the two other phospholipases C
(Granum, 1994).
2.7.7.2 Phosphatidylcholine Hydrolase
Hydrolysis of lecithinin, (egg yolk reaction) is a major criterion for
the identification of Bacillus cereus spp. Most strains of the Bacillus cereus
group, such as Bacillus cereus, Bacillus thuringiensis, Bacillus mycoides,
possess lecithinase activity. The reaction is catalyzed by the phospholipase
C, phosphatidylcholine hydrolase (PCH) which hydrolyses lecithin (Schraft
and Griffiths, 1995). PCH also hydrolyses phosphatidylethanolamine and
phosphatidylserine. PCH requires the presence of either zinc or calcium for
activity (Granum, 1994).
2.7.7.3 Sphingomyelinase
Sphingomyelinase hydrolyses sphingomyelin. The enzyme requires
magnesium for activity and is inhibited by zinc and calcium. Hsieh et al.,
(1999) designed primers based on the reported sequence of four different
strains of Bacillus cereus.

45
Positive PCR results were obtained for all Bacillus cereus group
strains tested. This suggests that sphingomyelinase alone cannot be
responsible for the symptoms elicited by this organism as not all strains
are capable of causing disease.
2.7.8 Cytotoxin-K
Cytotoxin-K is a single component protein enterotoxin showing
necrotic and haemolytic activity and is highly toxic to epithelial cells as
shown with human CaCo-2 cells (Hardy et al., 2001). Cytotoxin-K is the
most recently described enterotoxin from Bacillus cereus. It was detected
after a food poisoning outbreak in an elderly home in France. In total, 44
people were ill, 6 of these patients had bloody diarrhoea, and three of the
six died (Lund et al., 2000).
2.7.9 Vacuolation Factor
The vacuolation factor is a peptide produced by Bacillus cereus
which was named Emetic toxin of Bacillus cereus and was shown to cause
vacuolation of mitochondria when exposed to HEP-2 (human carcinoma of
the larynx) cells. The HEP-2 cell vacuolation factor was extracted and
purified by Agata et al., (1994). The emetic toxin is an extremely stable
compound. It can survive trypsin and pepsin treatments, pH 2 – 11 and
heating at 121oC for 90 min (Granum and Lund, 1997). The toxin
responsible for vomiting type was a 5 kDa dodecadepeptide and was
named cereulide. Agata et al., (1994) also determined the structure of the

46
toxin: (D – O – Leu – D – Ala – L – O – Val – I – Val). The emetic toxin
was shown to have a very similar structure to the potassium ionophore
valinomycin. Like the emetic toxin valinomycin also inflicts mitochondrial
damage when added to HEP-2 cells and induces emesis in Suncus murinus
(Agata et al., 1995b). Mikkola et al., (1999) found that the action of the
emetic toxin was complementary to that of valinomycin over a wide range
of tests. They concluded that the toxic effects of the emetic toxin was due
to its being a potassium ionophore. The toxin may be the translation
product of a Bacillus cereus gene or the result of enzymatic conversion of
a certain substrate in the growth medium. The production of the emetic
toxin has been suggested to be related to sporulation (Shinagawa et al.,
1992b).
2.7.10 Spore
The spores produced by Bacillus cereus are highly resistant to heat,
radiation and chemicals due to their metabolic dormancy and tough
physical nature. The vegetative cells of Bacillus cereus are not particularly
resistant to these environmental stresses.
Generally, adherence of enteropathogens to the intestinal
epithelium is an essential step required for colonization (Contrepois,
1993). It has been suggested that appendages on the spore surface
contribute to the adhesion of Bacillus cereus spores to epithelial cells
(Andersson et al., 1998). Also hydrophobicity is believed to play a role in
the adherence not only to solid surfaces (Husmark and Ronner, 1990), but

47
also to epithelial cells (Andersson et al., 1998). However, the
hydrophobicity of vegetative cells is much less than that of spores
(Wiencek et al., 1990). The Bacillus cereus spores are known to be more
hydrophobic than spores from other Bacillus species (Husmark, 1993;
Ronner et al., 1990). It is believed that the hydrophobicity is one of the
main reasons for the adhesion problems caused by Bacillus cereus spores
in the daily industry (Andersson et al., 1995). Hence, spore adhesion could
be an important virulence factor for some Bacillus cereus strains
(Andersson et al., 1998).
2.8 Physical and Chemical Factors Affecting Bacillus cereus
Growth
2.8.1 Temperature
Mesophilic strains of Bacillus cereus can grow between 10oC and
42oC, some strains being able to grow at 50 – 55oC (Kramer and Gilbert
1989, Nguyen-the and Carlin, 2003), with an optimal growth temperature
between 30 and 37oC. Psychrotrophic strains would grow below 10oC, at
temperatures as low as 4oC (Kramer and Gilbert 1989, Nguyen-the and
Carlin, 2003; Anderson et al., 1995, Van Netten et al., 1990; Te Giffel et
al., 1996, 1995, 1997; Dufrenne et al., 1994; Francis et al., 1998;
Andersen-Borge et al., 2001).
Refrigeration reduces growth of Bacillus cereus by increasing the
generation time. For instance, doubling times of a cocktail of 5 strains of
Bacillus cereus, including psychrotrophic and mesophilic strains in

48
laboratory media were 1.6 h at 19.5oC, 2.9 h at 14.2oC, 4 h at 9.6oC and
6.7 h at 6.5oC (Choma et al., 2000). Refrigeration also considerably
increases lag time. Valero et al., (2000) reported lag time of 148.77 h and
1.96 h at 5 and 30oC respectively.
Growth of some strains of Bacillus cereus was observed at 55oC,
but growth kinetics at this temperature, have not been elucidated. At 50oC
and below, important variations were observed among strains. Generation
times for Bacillus cereus in laboratory media were 0.3 to 3.6 h at 50oC (for
strains able to grow) 0.3 to 0.7 h at 40oC, 0.4 to 1.3 h at 35oC (Rajkowski
and Mikolajcik, 1987; Johnson et al., 1983). These generation times are
similar or slightly lower than those reported for Clostridium perfringens.
0.5 h at 51oC and 0.2 h at 40oC in cooked meat (Willardsen et al., 1978),
0.3 to 0.4 h at 350C in laboratory media (Beuchat et al., 1980).
2.8.2 pH
Bacillus cereus is not a particularly acid tolerant bacterium. The pH
limit for growth in carrot substrate acidified with citric acid was between
4.5 and 4.75 (Valero et al., 2000). In milk acidified with HCl, slight growth
was observed at pH 4.1 at 37oC (Clavel et al., 2004). At 25oC, growth rate
of strains of Bacillus cereus were approximately constant between pH 7
and pH 5.5 but dropped dramatically below this level (Lundsay et al.,
2000).

49
2.8.3 Water Activity
Bacillus spp. are more sensitive to low water activity than yeast and
moulds. In the particular case of Bacillus cereus the water activity must be
higher than 0.92 for growth (Kramer and Gilbert, 1989). For other Bacillus
spp, at 20oC and pH 6.4 in Tryptose caseine – Soja broth, mixture of 9
strains isolated from bakery products had lag times of 10 days and 15 –
18 days respectively for aw of 0.92 and 0.91 (Quintavalla and Parolari,
1993).
2.8.4 Sodium Chloride
Sodium chloride has effect on the growth of Bacillus cereus
depending on the concentration. Raevuori and Genigeorgis (1975) and
Claus and Berkeley (1986) reported that 11 – 89% of strains of Bacillus
cereus grow in 7% of NaCl. Mossel et al., (1967) suggested that 5% NaCl
included in isolation agars was a useful selective agent for Bacillus cereus
but that 10% was too inhibitory. Peters et al., (1991) identified the
temperature range over which Bacillus cereus could grow at different NaCl
concentrations. These ranged from growth at all temperatures examined
(14 – 41oC) at NaCl concentration of 0.5% (w/v) with pH 4.7 the lowest
permitting growth to growth at 21 – 39oC at 5% (w/v) NaCl, with minimum
pH of 5.5. At 7% (w/v) NaCl no growth was recorded at any temperature.

50
2.8.5 Effect of Heating.
Heat is the most common method used to kill bacterial spores in
foods. However, spores of Bacillus cereus have a broad range of heat
resistance. This has been a problem for producers in developing consistent
cooking or pasteurization processes. For instance, among a set of strains
from various origins, time to reduce 10 fold, the number of cultivable
spores at 90oC, pH 7 (D-value) varied from a few minutes to > 100 min
(Dufrenne et al., 1994). Strains from food borne outbreaks had D values
at 100oC ranging from 6 to 27 minutes (Rajkowski and Mikolajcik, 1987).
Strains isolated from spoiled canned vegetables had D values at 130oC
around 0.3 min (Bradshaw et al., 1975). Spores isolated from vegetables
showed a D105oC value or 0.63 min in reference substrate (pH 7)
(Fernandez et al., 1999).
Heat resistance of Bacillus cereus spores can be modified by the pH
(EFSA, 2005). Survival of Bacillus cereus spores at 95oC decreased by
three fold when the pH of the heating substrate was decreased from 6.2
to 4.7 (Fernandez et al., 2002). Mazas et al., (1998) found that
acidification from pH 7 to 4 produced a five fold decrease in D103oC values.
In low acid foods, the process used to eliminate Clostridium botulinum,
121oC for 3 min, would also eliminate spores of Bacillus cereus. Foods
subjected to less severe heat treatments will occasionally carry spores of
Bacillus cereus.

51
2.8.6 Effect of Food Additives.
Food additives such as nisin induce the inactivation of Bacillus
cereus vegetative cells while others such as Carvacrol have a very little
effect (Ray 1992; Pol and Smith 1999; Periago and Moezelaar 2001).

52
CHAPTER THREE
MATERIALS AND METHODS
3.1 Media and media preparation
A total of six different media were used throughout the study. They
are: Bacillus cereus selective agar, Bacillus cereus selective broth, rice
medium, nutrient agar, nutrient broth and SIM medium. The Bacillus
cereus selective agar is composed of: agar, 2.0 g; D-mannitol, 1.0 g;
(NH4)2PO4, 0.1 g; KCl, 0.02 g; MgSO4. 7H2O, 0.02 g; Yeast extract, 0.02 g;
Bromocresol purple, 0.004 g and 10 mI of 20% egg yolk emulsion
(Ranald, 1996). All these were dissolved in 100 ml of distilled water.
To prepare the egg yolk emulsion, 12 eggs were soaked in 1:100
dilution of saturated mercuric chloride solution for 1 min. Eleven eggs
were cracked and yolks were separated from whites. The egg yolks were
then mixed with the 12th egg (white and yolk) and mixed. Twenty
milliliters of egg yolk mixture was added to 80 ml of 0.9% NaCl solution.
This was then mixed thoroughly. The emulsion was warmed to 45 – 50oC.
The medium components except egg yolk emulsion were added to
100 ml of distilled water. The mixture was autoclaved at 121oC for 15 min
and then cooled to 45 – 50oC. Ten milliliters of sterile egg yolk emulsion
(20%) was added aseptically and mixed thoroughly. The medium was
then poured into sterile Petri dishes and incubated for 24 h at 37oC to
ensure sterility.

53
The Bacillus cereus selective broth is composed of the above
components except the agar. Other media were prepared according to the
manufacturers and users specification.
3.2 Sample Collection
Different food samples such as fried fish, cooked rice, cooked fish,
raw meat and raw fish were collected for this study from restaurants in
University of Nigeria, Nsukka and vendors in Nsukka market. A total of 325
food samples including 115 rice, 103 meat and 107 fish were collected.
These samples were wrapped in sterile white polythene bags as soon as
they were bought and brought to the laboratory. They were used
immediately.
3.3 Isolation of Organism
After the samples were collected and brought to the laboratory, one
gram of each sample was ground in a sterile motar and resuspended in 5
ml of sterile distilled water. Bacillus cereus strains were isolated on Bacillus
cereus selective medium by inoculating 0.1 ml of the food suspension onto
Bacillus cereus agar and incubating for 24 h at 37oC. Resulting colonies
were characterized in terms of Gram stain, spore production, catalase
reaction, haemolysis, gelatin liquefaction, starch hydrolysis and plasmid
profile. Presumed B. cereus colonies were stored in nutrient agar slants at
4oC for further use.

54
3.4 Identification Tests
3.4.1 Motility
SIM (sulphide, indole and motility) medium was used for the
motility test. This demonstrates the ability of the isolates to move away
from the point of inoculation. To 50 ml of distilled water, 1.8 g of SIM
medium was added and heated for complete dissolution. The medium was
dispersed into clean test tubes in 10 ml aliquots and sterilized by
autoclaving at 121oC for 15 min. The tubes were allowed to cool after
which media were stab-inoculated with the isolates and incubated at 37oC
for 48 h. Positive motility test is shown by diffuse growth or turbidity away
from the line of inoculation while growth only along the line of stabbing
indicates a negative result.
3.4.2 Catalase
This test demonstrates the ability of bacteria to produce the
enzyme catalase that breaks down hydrogen peroxide (usually toxic to
microorganism) to water and oxygen (Cheesbrough, 2000).
2H2O2 2H2O + O2
For each isolate, a drop of 3% (w/v) hydrogen peroxide was placed
on a clear grease-free slide. A little quantity of the isolate was then
emulsified on the slide. Positive test or reaction was indicated by
effervescence.

55
3.4.3 Hemolysis
To 100 ml of distilled water, 2.8 g of nutrient agar was added and
heated for complete dissolution. The mixture was sterilized by autoclaving
at 121oC for 15 min. It was allowed to cool to 45oC and 5 ml of human
blood was added aseptically and swirled immediately. It was then poured
into sterile plates and incubated for sterility after which they were
inoculated with the isolates and incubated for 24 h at 37oC. Following
incubation, the plates were examined for haemolysis.
3.4.4 Gelatin Liquefaction
The test is used for the detection of proteolysis (elaboration of
gelatinilytic enzyme) as shown by the liquefaction of gelatin.
The gelatin liquefaction medium was prepared according to Cowan
and Steel, (1966), by adding 1.2 g of gelatin and 2.8 g of nutrient agar to
100 ml of distilled water and heating for complete dissolution. It was then
sterilized at 121oC for 15 min. The solution was poured into plates and
incubated for 24 h at 37oC for sterility. The isolates were streaked onto the
plates and incubated for 24 h at 37oC. After the incubation, the surface
was flooded with acid mercuric chloride solution (Mercuric chloride, 12 g,
distilled water, 50 ml concentrated hydrochloric acid, 16 ml). A zone of
clearing around the growth was indicative of gelatin liquefaction (positive
result), while no zone of clearing indicated negative result.

56
3.4.5 Starch Hydrolysis
This test demonstrates the production of amylase by the isolates.
One gram of starch was added to 100 ml of nutrient agar and sterilized by
autoclaving at 121oC for 15 min. The medium was allowed to cool to about
60oC before dispensing into sterile Petri dishes. The Petri dishes were
incubated for 24 h at 37oC for sterility. The Petri dishes were then
inoculated with the isolates and incubated for 24 h at 37oC. Starch
hydrolysis was determined by flooding the culture plates with Gram’s
iodine solution. A zone of clearing shown by the starch hydrolyzing
bacteria after flooding detects the starch hydrolysis. Blue-black colour
around bacterial growth indicates a negative result (Ogbulie et al., 1998).
3.4.6 Spore Staining
This test is to demonstrate the production of spores by the isolates.
A smear of a 24 h culture of each isolate was prepared on a clean, grease
free slides, air-dried and heat fixed. The smear was covered with
malachite green solution and heated over a beaker of boiling water for 5
seconds or until it steamed. Then the slide was rinsed with water. The
smear was counter stained with safranin for about 30 seconds, washed off
with water, drained, air-dried, and examined under the light microscope
using the oil immersion objective lens. The spores stained green and the
vegetative cells stained red (Ogbulie et al., 1998).

57
3.5 Standardization of inoculum
A small quantity of B. cereus was inoculated into 10 ml of nutrient
broth and incubated at 37oC for 24 h. Following incubation, hundred fold
serial dilutions were made of the 24 h culture in sterile tubes up to 10-12
dilution. Thereafter, 0.1 ml of each dilution was spread-plated onto
duplicate agar plates and incubated at 37oC for 24 h for viable counts. The
absorbance of each tube was also taken in the spectrophotometer at 580
nm. The dilution yielding 1.0 to 1.5 x 10¹⁰ cfu/ml was taken as the
standard and its optical density (OD) of 0.2 was noted. Subsequently,
standard inocula were prepared by adding or removing B. cereus cells
from tubes of nutrient broth until the OD of 0.2 was attained.
3.6 Determination of the Effect of Temperature on the
Vegetative Growth and Spore Germination
Three isolates (BC7, BC9, NBC) and a typed strain (NRRL-B14724)
were used in this study. These isolates were tested for the effect of
temperature on the vegetative growth and spore germination according to
Finlay et al., (2000). Three flasks containing 100 ml of nutrient broth,
each, were inoculated with 0.1 ml of standard inoculum containing 1.0 x
109 cells and incubated at 37oC, 28oC and 4oC respectively. Samples of 1
ml were taken at intervals of 24 h from each incubation temperature.
From this 1 ml, 100 µl was taken to ascertain the vegetative growth by
plating out on duplicate agar plates. The remaining 900 µl of each sample
was placed in a water bath at 80oC for 10 min to kill vegetative cells.

58
Thereafter, 100 µl of this heat-treated sample was taken to provide spore
germination by plating out on duplicate nutrient agar plates.
3.7 Determination of the Effect of pH on the Growth of Bacillus
cereus
Six flasks of Nutrient broth (100 ml per flask) were adjusted to pH
4.0, 5.0, 6.0, 7.0, 8.0 and 9.0 respectively. They were later sterilized at
121oC for 15 min. Then 0.1 ml of standard inoculum prepared as
previously described was added to each of the flasks. They were then
incubated at 37oC and monitored for seven days. On each day, 0.1 ml
from each flask was serially diluted and plated out in duplicate nutrient
agar plates to determine the viable cell numbers.
3.8 Evaluation of Heat Resistance of the Isolates
The four isolates were tested for heat resistance within the
temperature range of 40oC – 100oC. The test isolates were grown in
nutrient broth for 24 h at 37oC after which they were adjusted to 0.2
optical density (580nm) containing 1.0 x 10¹⁰ cells/ml. For each test, 1 ml
of the diluted culture was added to 9 ml sterile nutrient broth in a bijou
bottle maintained in a water bath at the given test temperature. Each test
was performed in duplicates. The bijou bottles were held in the water bath
with the surface of the broth cultures 2 to 3 mm below the surface of the
water in the bath and swirled intermittently by hand so as to promote

59
equal temperature distribution in the broth. Care was taken to prevent
contamination of the tops of the bijou bottles.
At set times (20-min intervals for 40 to 80oC and 5-min intervals for
90 to 100oC), the bottles were taken out and loopfuls were withdrawn and
inoculated onto duplicate plates of nutrient agar and incubated at 37oC
overnight to determine viable counts. Decimal reduction times (D-values)
were calculated using this formula:
D-value = t1 – t0
Log N0 – log N1
where t1 = time after heating
t0 = Time at start
N0 = Start population
N1 = Population after heating
3.9 Determination of Effect of Carbon source on the growth of
Bacillus cereus.
The isolates were evaluated for the effect of carbon source by
growing the cells on glucose at different concentrations or rice as sole
carbon source.
To evaluate the effect of glucose, according to Spira et al., (1979),
a growth medium comprising (g/100 ml) of (NH4)2 PO4, 0.1 g; Na2HPO4,
2.5 g; 1 ml of mixture of 5% MgSO4, 0.5% MnSO4, 0.5% iron citrate and
0.02 g yeast extract, was supplemented with 1%, 5% or 10% glucose

60
(w/v) separately in 250 ml Erlenmeyer flasks. The pH was adjusted to 7 in
all the flasks before sterilizing in the autoclave at 121oC for 15 min.
The flasks were each inoculated with 0.1 ml of the standard
inoculum. The cultures were incubated at 37oC and monitored for seven
days. Every 24 hours, 0.1 ml from each flask was serially diluted and
plated out in duplicate nutrient agar plates for viable counts.
On the effect of complex carbohydrate, rice culture was used. Five
grams of boiled rice (wet weight) was cooked and dried and 4.3 g (dry
weight) was added to 100 ml of distilled water in a flask. This medium was
adjusted to pH 7 and sterilized. The medium was inoculated with 0.1 ml of
standard inoculum which contains 1.0 x 10⁹ cells and incubated at 37oC for
seven days. On every 24 h, 0.1 ml from each flask was serially diluted and
plated out in duplicate nutrient agar plates for viable counts.
3.10 Plasmid DNA Profiling
Eleven Bacillus cereus strains, a Bacillus thuringiensis (Bt) strain
and a non- Bacillus cereus strain were examined to know their plasmid
DNA profiles, according to the method of Zhou et al., (1990). These
strains were inoculated into different sterile test tubes containing nutrient
broth and incubated for 72 h at 37oC. After the incubation, the cells were
spinned at 10,000 rpm for 5 min in a microcentrifuge to pellet cells. The
supernatants were gently decanted leaving the cell pellets. Lysis buffer
(300 µl) comprising 10 mM Tris-HCl, 1 mM EDTA, 0.1 N NaOH and 0.5%
sodium dodecyl sulphate, at pH 8.0, was added to the cell pellet and

61
vortexed at high speed for 2 – 5 seconds until the mixture became sticky.
Then 150 µl of 3.0 M sodium acetate (pH 5.2) was added. The mixture
was again centrifuged for 5 min in microcentrifuge to pellet cell debris and
chromosomal DNA
The supernatant was then transferred to a fresh tube and mixed
well with 1.0 ml of 100% ethanol, which was pre-cooled to -20oC. This
was then spinned for 5 min to pellet plasmid DNA. At this juncture, pellet
was observed. The supernatant was discarded and pellet was rinsed twice
with 1 ml of 70% ethanol and the pellet was dried by evaporation. The
pellet was re-suspended in 20 – 40 µl of TE buffer (Tris-HCl and EDTA) for
further use.
To each 6 µl DNA sample, 3 µl of loading dye was added and mixed
by vortexing the mixture. A 1.3% agarose gel was prepared by dissolving
1.3 g of agarose in 100 ml of Tris-Borate buffer (pH 7.6) and heating to
dissolution. After cooling, the solution was then poured into the gel
column and left to solidify. The samples were loaded into the gel wells
(along with Hind III digest of lambda DNA (Sigma chemicals) used as
molecular weight standard) and subjected to electrophoresis at 60 V for 1
½ h. Following electrophoresis, bands were viewed under UV light in a
transilluminator. The graph of the standard was plotted and from this
graph, the molecular weights of the plasmids were extrapolated.

62
3.11 Data Analysis.
Data from all the experiments were analyzed by one-way ANOVA
and Least Significant Difference (LSD) at the 95% confidence limit.

63
CHAPTER FOUR
RESULTS
4.1 Isolation and Characterization of Bacillus cereus
4.1.1 Incidence of Bacillus cereus in different food samples
A total of 325 food samples were examined comprising 115
(35.39%) rice, 103 (31.69%) meat and 107 (32.93%) fish samples. All
samples (100%) yielded Bacillus cereus as determined by growth on
Bacillus cereus selective medium. A total of 350 strains of B. cereus were
isolated made up of 123 strains (35.14%) from rice, 111 (31.71%) from
meat and 116 (33.14%) from fish. These results are shown in Table 1.The
table also shows the bacterial load of the different food samples with
highest load of up to106 cfu/g obtained from fish samples.
4.1.2 Morphological and Metabolic Characterization of
Isolates and Reference Strains
A summary of morphological and metabolic characteristics of the isolates
are shown in Table 2. A total of 259 (74%) of the strains were haemolytic,
58 (16.57%) hydrolyzed starch, 252 (72.00%) isolates liquefied gelatine
and 97 (27.71%) did not ferment mannitol. All isolates were motile,
catalase positive and contained endospores. The morphological and
metabolic characteristics of the reference strains are shown in Table
3.They were all Gram positive short rods, spore formers, motile, catalase
positive and liquefied gelatine.

64
Table 1. Incidence of Bacillus cereus in different food samples
Food
samples
Number of
samples
examined
(percentage)
Number positive
for Bacillus
cereus*
(percentage)
Number of
Bacillus cereus
isolates
(percentage)
Bacterial
load
(Range)
(cfu/g)
Rice 115 (35.39%) 115 (100%) 123 (35.14%) 103 – 105
Meat 103 (31.69%) 103 (100%) 111 (31.71%) 104 – 105
Fish 107 (32.93%) 107 (100%) 116 (33.14%) 102 – 106
Total 325 325 350
* Samples yielding growth on Bacillus cereus selective medium were taken
as positive

65
Table 2: Summary of Morphological and Metabolic Characteristics
of the Isolates
Characterization
Number of isolates
positive
(percentage)
Number of isolates
negative
(percentage)
Hemolysis 259 (74%) 91 (26%)
Starch hydrolysis 58 (16.57%) 292 (83.43%)
Gelatin liquefaction 252 (72%) 98 (28%)
Mannitol fermentation 253 (72.29%) 97 (27.71%)
Gram reaction 350 (100%) 0 (0%)
Spore stain 350 (100%) 0 (0%)
Motility 350 (100%) 0 (0%)
Catalase 350 (100%) 0 (0%)

66
Table 3: Morphological and Metabolic Characterization of Reference
Strains
Isolates
Characterization on
Bacillus cereus
selectve medium
Hemolysis
on blood
agar
Starch
hydrolysis
Gram
reaction
Spore
strain
Gelatine
liquefaction
Motility
Catalase
NRRL-B14724 No distinct
colonies, there is
zone of clearing
around the
growth, the
growth is flat
with creanated
edges. It does
not ferment
mannitol i.e. the
purple colour still
retains. The
growth is milky in
colour.
β-
Hemolytic
greenish
colour
without
zone of
clearing.
The
colonies
are flat
with
creanated
or rough
edges
Negative.
There is
large grey
white flat
colonies
with no
zone of
clearing.
Gram
positive
short rods
in chains.
+ Positive
with wide
zone of
clearing.
+ +
NRRL-B14725
No distinct
colonies, there is
zone of clearing
around the
growth, the
growth is flat
with creanated
edges. It does
not ferment
mannitol i.e. the
purple colour still
retains. The
growth is milky in
Non-
hemolytic
with flat
white
growth
Positive
before
addition of
iodine,
there is
zone of
clearing
around the
growth.
After
addition of
iodine,
there is
Gram
positive
short rode
in chains.
+
Positive
with small
zone of
clearing
+
+

67
colour. zone of
clearing.
Bt (GSC 3) No growth β-
Hemolytic
Greenish
colour
without
zone of
clearing.
The
colonies
are flat
with
creanated
edges
Negative
There is
large grey
white flat
colonies
with blue-
black
colour
around the
growth
+ + Negative + +

68
4.1.3 Selection of Classical Bacillus cereus Isolates
A total of 10 isolates were selected based on their morphological
and metabolic similarity to the reference strains. These strains were
designated BC 1 to BC10. Another isolate which differed markedly from
the reference strains (ferments mannitol and has smooth edges) was
designated as Non- Bacillus cereus (NBC) and was used as negative
control for the rest of the study. The morphological and metabolic
characteristics of these isolates are shown in Table 4.
4.1.4 Plasmid profile of Bacillus cereus strains isolated from foods
The ten selected isolates, the reference strains and the negative control
were characterized by plasmid profiling. The results showed that the
strains contained multiple plasmid bands. Most had three observable
plasmid bands with molecular weights of approximately 5 kb, 21 kb and a
large plasmid >35 kb, respectively. Two strains had profiles that were
different; BC10 (lane 13) and Bacillus thuringiensis (Bt, lane 15). The
BC10 strain contained the large plasmid in addition to two others of
molecular weights 33 kb and 26 kb. The Bt contained only the 21 kb
plasmid. These results are shown in Figure 1.

Table 4: Morphological and Metabolic Characteristics of classical B. cereus isolates
Isolates
(Source)
Characterization on Bacillus
cereus selective medium
Hemolysis on blood
agar
Starch hydrolysis
Gram reaction
Spore
strain
Gelatine
liquefaction
Motility
Catalase
BC1
(Meat)
Non-mannitol
fermenting. The
purple colour still
retains. The growth
is milky in colour with
zone of clearing. The
growth is flat with
creanated edges.
β-
Hemolytic
Greenish
colour without
zone of
clearing.
+
There is large
grey white flat
colonies with
zone of
clearing.
Gram positive
short rods in
chains.
+ + + +
BC2
(Rice)
The purple colour still
retains. The growth
is milky in colour with
zone of clearing. The
growth is flat with
creanated edges.
β-
Hemolytic
Greenish
colour without
zone of
clearing.
+
There is large
grey white flat
colonies with
zone of
clearing.
Gram positive
short rods in
chains.
+ + + +
52

BC3
(Fish)
The purple colour still
retains. The growth
is milky in colour with
zone of clearing. The
growth is flat with
creanated edges.
β-
Hemolytic
Greenish
colour without
zone of
clearing.
Negative
There is large
grey white flat
colonies with
blue-black
colour around
the growth.
Gram positive
short rods in
chains.
+ + + +
BC4
(Rice)
The purple colour still
retains. The growth
is milky in colour with
zone of clearing. The
growth is flat with
creanated edges.
β-
Hemolytic
Greenish
colour without
zone of
clearing.
Negative
There is large
grey white flat
colonies with
blue-black
colour around
the growth.
Gram positive
short rods in
chains.
+ + + +
Table 4 Continued
53

BC5
(Fish)
The purple colour still
retains. The growth
is milky in colour with
zone of clearing. The
growth is flat with
creanated edges.
β-
Hemolytic
Greenish
colour without
zone of
clearing.
Negative
There is large
grey white flat
colonies with
blue-black
colour around
the growth.
Gram positive
short rods in
chains.
+ + + +
BC6
(Meat)
The purple colour still
retains. The growth is
milky in colour with
zone of clearing. The
growth is flat with
creanated edges.
β-
Hemolytic
Greenish colour
without zone of
clearing.
+
There is large
grey white flat
colonies with
zone of
clearing.
Gram positive
short rods in
chains.
+ + + +
BC7
(Meat)
The purple colour still
retains. The growth is
milky in colour with
zone of clearing. The
growth is flat with
creanated edges.
β-
Hemolytic
Greenish colour
without zone of
clearing.
Negative There
is large grey
white flat
colonies with
blue-black
colour around
the growth.
Gram positive
short rods in
chains.
+ + + +
Table 4 Continued
54

BC8
(Rice)
The purple colour still
retains. The growth
is milky in colour with
zone of clearing. The
growth is flat with
creanated edges.
β-
Hemolytic
Greenish
colour without
zone of
clearing.
+
There is large
grey white flat
colonies with
zone of
clearing.
Gram positive
short rods in
chains.
+ + + +
BC9
(Rice)
The purple colour still
retains. The growth
is milky in colour with
zone of clearing. The
growth is flat with
creanated edges.
β-
Hemolytic
Greenish
colour without
zone of
clearing.
Negative
There is large
grey white flat
colonies with
blue-black
colour around
the growth
Gram positive
short rods in
chains.
+ + + +
BC10
(Rice)
The purple colour
changes to yellow.
The growth is milky
in colour without
zone of clearing. The
colony is raised with
Non-
hemolytic.
Negative
There is large
grey white flat
colonies with
blue-black
colour around
Gram positive
short rods in
chains.
+ - + +
Table 4 Continued
55

smooth edges. The
growth is flat with
creanated edges.
the growth
NBC/Non
Bacillus
cereus
(fish)
The colonies change
the purple colour of
the indicator to
yellow. That is, the
organism ferments
mannitol. The colony
is raised with smooth
edges.
β-
Hemolytic
Greenish
colour without
zone of
clearing.
+
There is large
grey white flat
colonies with
zone of
clearing.
Gram positive
short rods
+ + + +
Table 4 Continued
56

Figure 1. Plasmid profile of Bacillus cereus strains isolated from
foods. The molecular weight standard (Hind III digest of λ DNA)
was loaded in Lane 1; Lanes 3 – 13, plasmid DNA from food
isolates; Lane 14, plasmid DNA from refernce strain NRRL-
B14724; Lane 15, plasmid DNA from Bacillus thuringiensis (Bt)
and Lane 16, plasmid DNA from the negative control NBC. Lanes
2 and 11 were left empty. Note the multiple plasmid bands in most
strains. Also, note the similar profile in most strains, except BC10
(Lane 13) and Bt (Lane 15).
1 2 3 4 5 6 7 8 9 10 11
1 12 13 14 15 16
23,130 bp
9,146 bp
6,556 bp
4,321 bp
2,322 bp
2,027 bp
>35 kb
33 kb
26 kb
21 kb
5 kb
57

4.2 Effect of Temperature on the Vegetative Growth of Bacillus
cereus Strains
The Bacillus cereus strains were grown at 37oC, 28oC and 4oC
respectively to ascertain their vegetative growth. At 37oC, all the strains grew
well with NRRL-B14724 strain having the highest growth (1.1x10¹⁰ – 7.0x10¹⁵
cfu/ml) (Figure 2).
At 28oC, all strains grew again with NRRL-B14724 having the highest
growth (9.0x10⁹ – 5.0x10¹² cfu/ml). There was, however, an increased lag at
this temperature (Figure 3).
At 4oC, there was no growth. It was observed, however, that after the
7th day, when the plates were brought out from 4oC and kept at 28oC
overnight, growth occurred.
4.3 Effect of Temperature on the Spore Germination of Bacillus
cereus strains
The germination of spores followed the pattern of vegetative growth
(Figure 4 and 5). However, a rapid loss of viability was recorded after 6 days
for the type strain NRRI-B14724, at both 37oC, and 28oC.
At 4oC, none of the spores germinated. However, that after the 7th
day, when the plates were brought out from 4oC and kept at 28oC overnight,
the spores germinated.
58

Fig.2: Vegetative growth of Bacillus cereus strains at 370C
59

Time (Days)
Fig.3: Vegetative growth of Bacillus cereus strains at 280C
60

Time (Days)
Fig.4: Spore Germination of Bacillus cereus strains at 370C
61

Time (Days)
Fig.5: Spore Germination of Bacillus cereus strains at 280C
62

4.4 Effect of pH on the growth of Bacillus cereus strains
Isolates BC9, BC10, NBC and reference strain NRRL-B14724 were
grown at different pH values (pH 4 – pH 9). There was significant (p < 0.05)
growth of all strains from pH 6 – pH 8 and no growth at pH 4 (Figure 6 – 10).
At pH 5, there was a prolonged lag for all strains except the negative control
NBC, which did not grow at all (Figure 9). These differences were significant
at the 95% confidence level. One of the test strains, BC10, lost viability after
six days at pH 9 (Figure 10).
63

Fig.6: Effect of pH on the Growth of NRRL-B14724 strains of Bacillus cereus
64

Fig.7: Effect of pH on the Growth of BC7 strain of Bacillus cereus
65

Fig.8: Effect of pH on the Growth of BC9 strain of Bacillus cereus
66

Fig.9: Effect of pH on the Growth of NBC strain of Bacillus cereus
67

Fig. 10: Effect of pH on the growth of BC10 strain of Bacillus cereus
68

4.5 Heat Resistance
All strains were resistant to heat up to 60oC. However, there was
variability in heat resistance of the spores at higher temperatures. The heat
resistance of the tested strains were in the order NRRL-B14724 > BC7 > BC9
> NRRL-B14725 > NBC. These results are shown in Figures 11 – 17 and
Table 5
69

Fig.11: Heat Resistance of isolates at 40 degrees
70

Fig.12: Heat Resistance of isolates at 50 degrees
71

Fig.13: Heat Resistance of isolates at 60 degrees
72

Fig.14: Heat Resistance of isolates at 70 degrees
73

Fig.15: Heat Resistance of isolates at 80 degrees
74

Fig.16: Heat Resistance of isolates at 90 degrees
75

Fig.17: Heat Resistance of isolates at 100 degrees
76

Table 5: The decimal reduction time (D-value) for the test strains.
Strains D80oc-values
(min)
D90oc-values
(min)
D100oc-values
(min)
BC7 208 64 17
BC9 383 110 16
NBC 23 0 0
NRRL-B14724 250 134 21
NRRL-B14725 192 15 0
77

4.6 Effect of carbon source on the growth of Bacillus cereus strains
The growth of three strains BC7, BC9 and NBC and a reference strain
NRRL-B14724 were compared on simple sugar (glucose) and complex
carbohydrate (rice).
At 1%, 5% and 10% concentrations of glucose, there was no
significant (p > 0.05) growth of BC7, BC9 and NRRI-14724 strains, while NBC
grew up to day 4. That is, the cell numbers increased from 4.17x10¹¹ –
2.0x10¹³ cfu/ml (1%), 4.27x10¹¹ – 3.3x10¹² cfu/ml (5%) and 2.14x10¹¹ –
2.0x10¹⁵ cfu/ml (10%) but lost its viability at day 5 (Figures 18 – 21).
On complex carbohydrate (rice), all strains grew well except the
reference strain NRRL-B14724 (Figure 21). The cell numbers increased from
1.66x10¹¹ – 6.6x10¹⁵ cfu/ml (BC7), 1.37x10¹¹ – 1.9x10¹⁶ cfu/ml (BC9) and
3.82x10¹¹ – 1.73x10⁷ cfu/ml (NBC).
78

Fig.18: Growth of Bacillus cereus strains on 1% glucose as the sole carbon source
79

Fig.19: Growth of Bacillus cereus strains on 5% glucose as the sole carbon source
80

Fig.20: Growth of Bacillus cereus strains on 10% glucose as the sole carbon source
81

Fig.21: Growth of Bacillus cereus strains on Rice as the sole carbon source
82

CHAPTER FIVE
DISCUSSION
Bacillus cereus is the causative agent of two forms of food poisoning; a
diarrhoeal form, which is mild and resembles Clostridium perfringens food
poisoning and an emetic form, which resembles staphylococcal food
intoxication and may become fulminant and fatal (Mahler et al., 1997;
Andersson et al., 1998; Finlay et al., 2000; Dierick et al., 2005). The ubiquity
of the organism and the ability of its spores to survive dried storage means
that most raw and ready to eat foods may contin B. cereus. The results from
this study showed that all meat, fish and rice samples examined were
contaminated with B. cereus and the bacterial loads of the samples were
within the range of 102 – 106 cfu/g (Table 1). These results are in line with
reports from other researchers, which state that B. cereus spores occur
widely in foods and all kinds of foods have been implicated in B. cereus food
poisoning (Haggblom et al., 2002; EFSA, 2005). The levels of B. cereus
reported in food poisonings range from 102 to 108 cfu/g and it is generally
believed that any food exceeding 104 to 105 cells or spores per gram may not
be safe for consumption (Notermans and Batt, 1998; Beattie and Williams,
2000; Finlay et al., 2000). The levels of B. cereus recorded from the samples
in this study are therefore a cause for concern.
Studies have also shown, however, that although the number of cells
recovered from foods falls frequently within ranges that may be considered
83

unsafe, illness from these occurrences are relatively rare (Notermans et al.,
1997). This has been attributed mainly to the wide variation of pathogenic
potential and overall diversity among B. cereus strains (Helgason et al.,
2000). For instance, B. cereus strains may differ morphologically,
metabolically, in genetic arrangement as well as in the physical and chemical
conditions required for growth and toxin production (Parry and Gilbert 1980;
Shinagawa et al., 1992; Carlson and Kolso, 1993; Granum and Lund, 1997;
Graham et al., 2006). In this study, a total of 350 different isolates recovered
on B. cereus selective medium were characterized. The results showed that
there was indeed metabolic diversity among the strains in terms of
haemolytic reaction, starch hydrolysis, gelatin liquefaction and mannitol
fermentation (Table 2). By comparison with reference B. cereus strains, ten
isolates (BC1 to BC10) were selected as classical strains. The ten strains were
all non-mannitol-fermenting and β-haemolytic, but differed in terms of starch
hydrolysis and gelatin liquefaction. The results on starch hydrolysis and
gelatin liquefaction are particularly important, since some authors have
suggested that these two properties may be significant for separating emetic
B. cereus strains from other B. cereus; emetic strains not being able to
hydrolyze starch and giving wide zones of clearing on gelatin-liquefaction
tests (Christiansson et al., 1989). Of the ten classical strains, six (BC3, BC4,
BC5, BC7, BC9 and BC10) did not hydrolyze starch, suggesting that these
may be emetic strains and only BC10 did not liquefy gelatin. The plasmid
84

profiles also showed BC10 to be the only strain with a different profile (Figure
1). It was interesting, however, to observe that the strain designated NBC
(non-Bacillus cereus) had a profile similar to the classical and reference
strains. This would suggest that the strain, though atypical, is also a B.
cereus strain and again emphasizes the diversity among the strains.
Studies on the effect of temperature on growth showed that all strains
grew well at 28oC and 37oC but not at 4oC (Figures 2 and 3). Also, the strains
showed significant (P < 0.05) growth from pH 6 to pH 8. Outside of this pH
range, however, there was variability in the strains. There was no growth of
any of the strains at pH 4 while at pH 5, there was a prolonged lag for the
strains that grew, specifically, BC7, BC9 and NRRL-B14724 (Figure 6-8). The
atypical NBC strain did not grow at all at pH 5. It also had a prolonged lag at
pH 9 (Figure 9). These observations are in line with reports of other
researchers, which show that refrigeration significantly reduces growth of B.
cereus by increasing the generation time as well as lag time and that B.
cereus is not particularly acid tolerant (Choma et al., 2000; Valero et al.,
2000; Clavel et al., 2004).
In terms of heat resistance, the results showed that all the strains
were resistant to heat up to 60oC, but there was variability in the heat
resistance of the spores at higher temperatures (Table 5). A broad spread of
heat resistance of B. cereus spores has been reported in literature. For
instance, among a set of strains from various origins, D90oC-values varied from
85
a few min to >100 min (Dufrenne et al., 1994), strains from foodborne
outbreaks had D values at 100oC ranging from 6 to 27 min (Rajkowski and
Mikolajeik, 1987) and spores isolated from vegetables had D values at 105oC
around 0.63 min (Fernandez et al., 1999). It has been suggested that the
most heat-resistant strains belong to serotype 1 of the species and this
serotype is also the most frequently isolated from emetic outbreaks (Parry
and Gilbert, 1980; Shinagawa et al., 1992; Graham and Paul, 2006). They
also suggested that the preparation of rice might select for this serotype and
therefore explain why this serotype is most commonly implicated in
foodborne outbreaks. For comparative purposes, some of the strains in this
study, specifically BC7 and BC9, which have previously been suggested to be
possibly emetic, also had D100oC-values of 17 and 16 min respectively (Table
5). Again, this suggests emetic nature of the strains.
Results from the evaluation of effect of carbon source showed that
growth occurred highest on rice with no significant growth on glucose as sole
carbon source. This is in accord with epidemiological findings where fried or
cooked rice has been implicated in approximately 95% of cases of emetic B.
cereus poisoning, suggesting that there is a relationship between substrate
and emetic toxin production (Graham and Paul, 2006).
From the results of this study, it is evident that most raw and cooked
foods available to consumers are highly contaminated with B. cereus spores,
including the dangerous emetic strains. The high prevalence and highly heat-
86

resistant nature of these strains represent a significant health risk to
consumers. In addition, the great variability in the biological properties of the
B. cereus strains would present a difficulty in terms of food monitoring and
assessment of risk based on strains. Therefore, any food containing B. cereus
poses a potential risk. However, the results of this study have also shown
that the risks may be minimized by maintaining foods, particularly rice dishes
under adequate refrigeration or any conditions which might prevent growth of
the organism.
87

Conclusion
From the results of this work, it is concluded that:
• There is a high incidence of contamination of foods with Bacillus
cereus and this has associated health risks.
• The inability of the strains to grow at 4oC indicates that storage
temperature is critical for controlling growth of Bacillus cereus in food
samples
• There is a high degree of variability in morphological and metabolic
characteristics of Bacillus cereus strains and this could pose a problem
in terms of proper screening and monitoring of foods for Bacillus
cereus.
• Inhibition of growth of Bacillus cereus can be achieved by reducing pH
and/or temperatures .
88

Recommendations
From the results of this work, it is recommended that:
• To avoid high numbers of Bacillus cereus at the stage of consumption,
cooked foods should be eaten soon after cooking, or kept above 63oC or
cooked rapidly and kept below 7 – 8oC (ideally below 4oC).
• Temperature below 10oC greatly slows multiplication and temperatures
below 4oC prevent it. Rapid cooling of heat treated foods through the
temperature range supporting growth will also minimize multiplication
before storage.
• Food vendors and restaurants should be monitored to avoid the
multiplication since all the samples collected were contaminated.
• All food samples should be taken care of since these organisms are highly
resistant and heating to inactivate the growth of the organisms may alter
the food quality.
• All foods containing rice should be handled properly since B.cereus strains
grow well in rice and can produce toxins.
89

REFERENCES
Adams, M. R., and Moss, M.O. (1995). Food Microbiology. The Royal Society of Chemistry, Cambridge. pp 160 – 163.
Agaisse, H., Gominet, M., Okstad, O. A., Kolsto, A, B., mand lereclus, D.
(1999). PLCR is a pleiotropic regulator of extracellular virulence factor gene expression in Bacillus thuringiensis. Molecular Microbiology 32: (5), 1043 – 1053.
Agata, N., Mori, M. Ohta, M. Suwan, S., Ohtani, and Isobe, M., (1994). A
Novel dodecadepepetide, cereulide, isolated from Bacillus cereus causes vacuole formation in HEP – 2 cells. FEMS Microbiol Lett 121: 31 – 4.
Agata, N., Ohta, M., Arakawa, Y., and Mori, M. (1995a). The bceT gene of
Bacillus cereus encodes on enterotoxic Protein. Microbiology 141: (4), 983 – 988.
Agata, N., Ohta, M., Mori M. and Isobe M. (1995b). A novel
Dodecadepsipeptide, cereulide, is an Emetic Toxin of Bacillus cereus. FEMS Microbiology letters 129: 129 – 19.
Andersen – Borge, G. L., Skeie, M., Sorhaug, T., Langsrud, T. and Granum, P.
E. (2001). Growth and Toxin Profiles of Bacillus cereus isolated from different food sources. International Journal of Food Microbiology 69: 237 – 246.
Andersson, A., Ganum P. E. and Ronner, U. (1998). The adhesion of Bacillus
cereus spores to epithelial cells might be an additional virulence mechanism. International Journal of Food Microbiology 39: 93 – 99.
Andersson, A., Ronner, U. and Granum P. E. (1995). What Problems does the
food Industry have with the spore-forming Pathogens Bacillus cereus and Clostridium perfringens? Int J food Microbiol 28: 145 – 155.
Ash, C., Farrow, J. A. E., Wallbanks, S. and Collins, M. D. (1991).
Phylogenetic heterogeneity of the genus Bacillus revealed by comparative analysis of small submit-ribosomal RNA sequences. Letters in Applied Microbiology 13: 202 – 206.
90

Ash,C. and Collins, M. D. (1992). Comparative Analysis of 235 ribosomal RNA gene sequences of Bacillus anthracis and emetic Bacillus cereus determined by PCR Direct sequencing. FEMS Microbiology letters 73: 78 – 80.
Beattie, S. H. and Williams, A. G. (2000). Detection of toxins. In: R. K.
Robinson, C. A. Batt, and P.D. Patel (ed), Encyclopedia of Food Microbiology, Vol. 1. Academic Press San Diego, Calif. pp 141 – 158.
Beecher, D. J. and Macmillan, J. D. (1990). A novel bicomponent hemolysin
from Bacillus cereus. Infect. Immun 58: 2220 – 2227. Beecher, D. J. and Macmillan, J. D. (1991). Characterization of the
components of hemolysin BL from Bacillus cereus. Infection and Immunity 59: (5), 1778 – 1784.
Beecher, D. J. and Wong, A. C. L. . (1994). Identification of hemolysin BL-
Producing Bacillus cereus by a discontinuous hemolytic haemolytic pattern in blood agar. Appl Environ Microbiolo 60: 1646 – 51.
Beecher, D. J., Schoeni, J. L., and Lee Wong A. C. (1995). Entero toxic
activity of hemolysin BL from Bacillus cereus. Infection and Immunity 63: (11), 4423 – 4428.
Bennett, R. W., and Harmon, S. M. (1988). Bacillus cereus food poisoning. In:
Laboratory Diagnosis of Infections Diseases: Principles and Practice, A. Balows, W. J. Hausler, Jr., M. Ohashi, an A. Turano (eds). Springer – Verlag, New York Vol. 1: pp 88 – 93.
Beuchat, L. R., Ma – lin, C. F. A., Carpenter, J. A. (1980). Growth of Bacillus
cereus in media containing plant seed materials and ingredients used in Chinese cooker Y. J. Appl Bacteriol., 48: 397 – 404.
Bradshaw, J. G., Peeler J. T. and Twedt, R. M. (1975). Heat resistance of
illeal loop reactive Bacillus cereus strains isolated from commercially canned food. Applied Microbiology 30: (6) 943 – 945.
91

Carlson C. R. and Kolsto, A. B. (1993). A complete physical map of a Bacillus thuringiensis Chromosome. J. Bacteriology 175: 1053 – 1060.
Cheesbrough,M. (2000). District laboratory practice in tropical countries.
University press Cambridge, United Kingdom – volume II. Pp 38 – 64. Choma, C., Guinebretiere, M. H., Carlin, F., Schmitt, P., Velge, P., Granum, P.
E. and Nguyen – the C. (2000). Prevalence, Characterization and growth of Bacillus cereus in commercial cooked chilled foods containing vegetables. Journal of Applied Microbiology 88: 617 – 625.
Christiansson, A., Naidu, A. S., Nilssm, I., Wadstrom, T. and Pettersson, H.
(1989). Toxin production by Bacillus cereus Dairy isolates in milk at low temperatures. Applied and Environmental Microbiology 55 (10): 2595 – 2000.
Chrisitiansson, A., Bertilsson J. and Svensson, B. (1999). Bacillus cereus
spores in raw milk: Factors affecting the contamination of milk during the grazing period. Journal of Dairy Science 82: 305 – 314.
Claus, D. and Berkeley, R. C. W. (1986). Genus Bacillus Cohn 1987, 174 In:
Sneath, P. H. A; Mair, N. S., Sharpe M. E. and Holt, J. G. (eds), Bergey’s manual of Systematic Bacteriology, William & Wilkins. pp 1105 – 1139.
Clavel, T. Carlin, F., Lairon D., Nguyen – The, C., Schmitt, P. (2004). Survival
of Bacillus cereus spores and vegetative cells in acid media stimulating human stomach. Journal of Applied Microbiology. 97: (1): 214 – 219.
Contrepois, M. (1993). Adherence bacterienne et colonization des muqueuses
digestives. In: Rambaud, J. C. and Rmapal, P. (eds). Diarrhees aigues infectiveness. Doin, Paris. Pp 11 – 19.
Cowan, S. T. and Steel, K. J. (1966). Manual for the Identification of Medical
Bacteria. Cambridge University press, New York pg. 116 – 156. Dierick. K. Van Coillie, E., Swiecicka, 1 & 7 other authors (2005). A fatal
family outbreak of Bacillus cereus food poisoning. J. Clin Microbiol (in press).
Dufrenne, J., Soentoro, P., Tatini, s., Day, T. and Notermans, S. (1994).
Characteristics of Bacillus cereus related to safe food production. International Journal of food Microbiology 23: 99 – 109.
92

European Food and Safety Agency (EFSA) (2005). Bacillus cereus and other Bacillus spp in foodstuffs. The EFSA Journal 175:1-48.
Eneroth, A., Svensson, B., Molin G and Christiansson, A. (2001).
Contamination of Pasteurized milk by Bacillus cereus in the filling machine. Journal of Dairy Research 68: 189 – 196.
Fernandez, A., Collado, J., Cunha, L. M., Ocio, M. J. and Martinez, A. (2002).
Empirical model building based on Weibull distribution to describe the joint effect of pH and temperature on the thermal resistance of Bacillus cereus in vegetable substrate. International Journal of Food Microbiology 77: 147 – 153.
Fernandez, A., Collado, J., Cunha, L. M., Ocio, M. J., Fernandez, P. S.,
Rodrigo, M. and Martinez, A. (1999). Application of non-linear depression analysis to the estimation of kinetic parameters for two enterotoxigenic strains of Bacillus cereus spores. Food Microbiology 16: 607 – 613.
Finlay, W. J. J., Logan N. A. and Sutherland, A. D. (2000). Bacillus cereus
produces most emetic toxin at lower temperatures. Letters in Applied Microbiology 31: 335 – 339.
Francis, K. P., Mayr, R., Von Stetten, F., Stewart, G. and Scherer, S. (1998).
Discrimination of Psychrotophic and Mesoplilic strains of the Bacillus cereus group by PCR targeting of major old shock protein genes. Applied and Environmental Microbiology 64: 3525 – 3529.
Gilbert, R. J., Stringer, M. F., and Peace, T. C. (1974). The survival and
growth of Bacillus cereus in boiled and fried rice in relation to outbreaks of food poisoning. Journal of Hygiene, Cambridge 73: 433.
Graham, B. and Paul, H. (2006). Development of Improved Molecular
Detection methods for Bacillus cereus toxins. A report for the rural industries research and development corporation. Pg 1 – 60.
Granum, P. E. (1994). Bacillus cereus and its toxins. Symposium series
society for Applied Bacteriology. 61s – 66s. Granum, P. E. (1997), Bacillus cereus Dissection of toxins. In: R. K. Robinson,
C. A. Batt and P. D. Patel (ed.), Encyclopedia of Food Microbiology, Academic press, San Diego, Calif vol. 1: pp 327 – 336.
93

Granum, P. E., Naestvold, A. and Gunderby, K. N. (1995). An outbreak of Bacillus cereus food poisoning in the junior Norwegian ski championships. Norsk veterinaertidsskrift 107: 945 – 948.
Granum, F. E., Andersson, A., Gayther, C., te Giffel, M., Larsen, H., Lund, T.
and O’ Sullivan, K. (1996). Evidence for a further enterotoxin complex produced by Bacillus cereus. FEMS Microbiol Lett 141: 145 – 149.
Granum P. E. and Lund, T. (1997). Bacillus cereus and its food poisoning
toxins. FEMS Microbiology letters 157: (2), 223 – 228. Granum, P.E. O’ Sullivan, K., and Lund, T. (1999). The sequence of the non-
haemolytic enterotoxin operon from Bacillus cereus. FEMS Microbiology letters 177: (2), 225 – 229.
Guinebretiere, M. H. and Nguyen –the, C. (2003). Sources of Bacillus cereus
contamination in a pasteurized Zucchini puree processing plant, differentiated by two PCR – based methods. FEMS Microbiology Ecology 43: 207 – 215.
Guinebretiere, M. H. and Sanchis, V. (2003). Bacillus cereus Sensu lato.
Bulletin de la societe francaise de microbiologie 18: 95 – 103. Halverson, L. J., Clayton, M. K. and Handelsmen, J. (1993). Population
biology of Bacillus cereus UW 85 in rhizosphere of field grown soy beans. Soil Biological Biochemistry 25: 485 – 493.
Hardy, S. P., Lund, T., Granum, P. E. (2001). Cyt K toxin of Bacillus cereus
forms pores in planar lipid bilayers and is cytotoxic to intestinal epithelia. FEMS Microbiology letters 197: 47 – 51.
Hauge, (1950). Food Poisoning caused by Bacillus cereus preliminary report
(In Norwegian). Nord. Hyg. T. 31: 189 – 206. Heganson, E., Caugant, D. A., Olsen, I. And Kolsoto, A. (2000). Genetic
structure of population of Bacillus cereus and Bacillus thuringensis isolates associated with periodontitis and other human infections. J. Clin Microbiol 38: 1615 – 1622.
94

Helgason, E., Okstad, O. A., Caugent D. A., Johansen, H. A., Fouet, A., Moik, M., Hegna, 1.8 Kolsto, A. A., (2000). Bacillus antracis, Bacillus cereus and Bacillus thuringiensis. One species on the basis of genetic evidence. Appl Environ Microbiol 66: 2627 – 2630.
Helgason, E., Tourasse, N. J., Meisal, R., Caugant, D. A. and Kolston, A. B.
(2004). Multilocus sequence typing Scheme for bacteria of the Bacillus cereus group. Microbiology Applied and Environmental 70: 191 – 201.
Hendriksen, N. B. and Hensen, B. M. (2002). Long-term survival and
germination of Bacillus thuringiensis var. Kurstak in a field trial. Canadian Journal of Microbiology 48: 256 – 261.
Hsieh, Y. M., Sheu S. J., Chen Y. L. and Tsen, H. Y. (1999). Enterotoxigenic
profiles and polymerase chain reaction detection of Bacillus cereus group and Bacillus cereus strains from foods and food borne outbreaks. J. Appl Microbiol 87: 481 – 490.
http://mic.sgmijounals.org. Husmark, U. and Ronner, U. (1990). Forces involved in adhesion of Bacillus
cereus spores to solid surfaces under different environmental conditions. Journal of Applied Bacteriology 69: 557 – 562.
Husmark, U. (1993). Adhesion mechanisms of bacterial spores to solid
surface. Ph. D. thesis, Department of Food Science, Chalmers University of Technology and sik, the Swedish Institute for Food Research Got
ICMSF (International Commission in Microbiological Specification for foods
(2003). Microbial theology of food commodities, 2nd edition, Kluwer Academic/Plenum Publishers, New York (in press).
Johnson, K.M., Nelson, C. L., Busta F. F. (1983). Influence of temperature on
germination and growth of spores of emetic and diarhoeal stran of Bacillus cereus in a broth medium and in rice. J. Food Sci. 48: 286 – 287.
Kramer, J. M. and Gilbert, R. J. (1989). Bacillus cereus and other Bacillus
species. Food borne bacterial pathogens. Marcel Dekkar Inc New York, USA.
95

Lechner, S., Mayr, R. Francis, K. P., Pruss, B. M., Kaplan, T., Wiessner. Gunkel, E., Stewartz, G. and Scherer, S. (1998). Bacillus weihenstephanensis sp. Nov. in a new psychrotolerant species of the Bacillus cereus group. International Journal of Systematic Bacteriology 48: 1373 – 1382.
Logan, N. A. and Berkeley, R. C. (1984). Identification of Bacillus strains using
the API system. Journal of General Microbiology 130: 1871 – 1882. Lubenau. C. (1906). Bacillus peptonificans als Erreger emer Gastroenteritis –
Epidemic. 2bl. Bakt. 1. Orig; 40 431 – 437. Lund, B. M. (1990). Food – borne disease due to Bacillus and Clostridium
species. Lancet 336: 982 – 986. Lund, T., DeBuyser, M. L., Granum, P. E. (2000). A new cytotoxin from
Bacillus cereus that may cause necrotic enteritis. Moleculer Microbiology 38: 254 – 261.
Lund T. and Granum, P. E. (1996). Characterization of a non-heamolytic
enterotoxin complex from Bacillus cereus isolated after a food borne outbreak. FEMS Microbiology letters 141: (213), 151 – 156.
Lund, T. and Granum P. E. (1997). Comparison of biological effect of the two
different enterotoxin complexes isolated from three different strains of Bacillus cereus. Microbiology 143: 3329 – 3336.
Lundsay, D., Brozel, V. s., Mostert, J. f. and Von Holy, A. (2000). Physiology
of dairy associated Bacillus Spp over a wide pH range. Int. J. Food Microbilogy 54: 49 – 62.
Mahler, H., Pasi, A., Kramer, J. M., Schulte, P., Scoging, A. C., Bar, W. and
Krahen buhl, S. (1997). Fulminant liver failure in association with the emetic toxin of Bacillus cereus. New England Journal of medicine 336: 1142 – 1148.
Mantynen, V. and Lindstrom, K. (1998). A rapid PCR-based DNA test for
enterotoxic Bacillus cereus. Appl. Environ Microbiol, 64: 15334 – 15339.
96

Max, M. H., Apetroaie, C., Andersson, M. A. and Salkinoja – Salonen, M. S. (2002). Quantitative Analysis of Cereulide, the Emetic Toxin of Bacillus cereus produced under various conditions. Appl Environ Microbiol. 68: 2479 – 2483.
Mazas, M., Lopez, M., Gonzalez, I., Gonzalez, J., Bernardo, A and Martin, R.
(1998). Effects of the heating medium pH on heat resistance of Bacillus cereus spores. Journal of food safety 18: 25 – 36.
Mikkola, R., Saris N. E., Grigoirer, P. A., Andersson, M. A. and Salkinoja –
Salonen, M. s. (1999). Ionophoretic Properties and Mitochondrial effects of cereulide: the emetic toxin of Bacillus cereus. Eur J. Biochem 26: 112 –117.
Mossel, D. A. A., Koopman, M. J. and Jongerius, E. (1967). Enumeration of
Bacillus cereus in foods. Applied Microbiology 15: 650 – 653. Nakamura, L. K. (1998). Bacillus pseudomycoides Sp. Nov. International
Journal of Systematic Bacteriology 18: 1031 – 1035. Nguyen –the, C. and Carlin, f. (2003). Bacillus cereus et securite des
aliments. Bulletin de la societe Francaise de Microbiologie 18: 104 – 112.
Notermans, S. and Batt, C. A. (1998). A risk assessment approach for food –
borne Bacillus cereus and its toxins. Symposium, series – society for Applied Bacteriology 84: 515 – 615.
Notermans, S., Dufernne, J., Teunis, P., Beumer, R., Giffel, M. T., Peeters
Weem, P., (1997). A risk assessment study of Bacillus cereus present in pasteurized milk. Food Microbiology 14: (2) 143 – 151.
Ogbulie, J. N. Uwaezuoke, J. C., and Ogiehor, S. I. (1998). Introductory
Microbiology practical Springfield publishers, Nigeria. pg. 32. Parry, J. M. and Gilbert, R. J. (1980). Studies on the heat resistance of
Bacillus cereus spores and growth of the organism in boiled rice. Journal of Hygiene, Cambridge 84: 77 – 82.
Periago, P. M. Moezelaar, P. (2001). The combined effect of nisin and
carvacol at different pH and temperature levels on the viability of different strains of Bacillus cereus. International Journal of Food Microbiology 68: 141 – 148.
97

Peters, A. C., Thomas, L. and Winpenney, J. W. T.(1991). Effects of salt concentration on bacterial growth on plates with gradients of pH and temperature. FEMS Microbiological letters 77: 309 – 314.
Pirttijarvi, T. S., Andersson, M. A. and Salknoja – Salonen, M. S. (2000).
Properties of Bacillus cereus and other bacilli contaminating biomaterial. Journal of Food Microbiology 60: 231 – 239.
Pol, I. And Smith, E. J. (1999). Combined action of nisin and Carvacrol on
Bacillus cereus and Listeria monocytogenes. Letters in Applied Microbiology 29: 166 – 170.
Quintavalla, S., Parolari, G. (1993). Effects of temperature aw and pH on the
growth of Bacillus cereus. International Journal of Food Microbiology 19: 207 – 216.
Raevuon, M. T. and Genigeorgis, C. (1975). Effects of pH and sodium on
growth of Bacillus cereus in laboratory media and certain foods. Applied Microbiology 29: 68 – 73.
Raevuori, M., T. Klutamo, and A. Niskaneo (1977) Comparative studies of
Bacillus cereus strains isolated from various foods and food poisoning outbreaks. Acta Vet. Scan. 18: 397 -407.
Rajkowski, K. T. and Mikolajcik, E. M. (1987). Characteristics of selected
strains of Bacillus cereus. Journal of food protection 50: 199 – 205. Ranald, M. A. (1996). Handbook of Microbiological Media. Parka,L.C. (eds.).
Robert Stern, USA. pp 137-138. Ray, B. (1992). Nisin of Lactococcus lactis sp lactus as a food biopreservative.
In: B. Ray and M. A. Daeschel (ed). Food Bio preservatives of Natural origin. C R C Press BoCa Raton Fla. pp. 207 – 264.
Runner, U. Husmark, U., Henriksson, A. (1990). Adhesion of Bacillus spores
in relation to hydrophobicity. J. Appl. Bacteriol. 69: 550 – 556. Salamitou, S., Ramisee, F., Brhelin, M., bouguet, D., Gilois, N., Gominent, M.,
Hermandez, E. and Lereclus, D. (2000). The pclR regulon is involed in the opportunistic properties of Bacillus thuringiensis and Bacillus cereus in mice and Insects. Microbiology 146: 2825 – 2832.
98

Salkinoja – Salonen, M. S., Vuorio, R. Andersson, M. A., Kampfer, P., Andersson, M. C., Honkanen – Buzalski, T. and Scoging, A. C. (1999). Toxigenic strains of Bacillus licheniformis Related to food poisoning. Appl. Environ Microbiol, 65: 4637 – 4645.
Schraft, H. and Griffiths, M. W. (1995). Specific Oligonucletide primers for
detection of Lecithinase positive Bacillus cereus spp by PCR. Appl Environ Microbiol 61: 469 – 474.
Setlow, P. and Johnson, E. a. (1997). Spores and their significance. In M. P.
Doyle, L. R. Beuchat, and T. L. Montuille (ed.), Food Microbiology: Fundamental and frontiers. ASM press, Washington, D. C. pp 30 – 64.
Svensson, B., Eneroth, A., Brendehaug, J. and Christiansson, A. (1999).
Investigation of Bacillus cereus contamination sites in a dairy plant with RAPD-PCR. International Dairy Journal 9: 903 – 912.
Shinagawa, K., N. Matsusaka, H. Konuma, and H. Kurate. (1985). The
relation between the diarrheal and other biological activities of Bacillus cereus involved in food poisoning outbreaks. J. Vet. Sc. 47: 557 – 565.
Shinagawa, K., Takechi, T., Matasusaka, N. and Shugii, S. (1992). Purification
of an enterotoxin produced by Bacillus cereus by immuno affinity chromatography using a monoclonal antibody. Canadian journal of Microbiology 38 (2): 153 – 156.
Shinagawa, K., Otake, S., Matsuasaka, N. and Sugii, S. (1992a).Production of
the vacillation factor of Bacillus cereus isolated from vomiting – type food poisoning J. Vet. Med. Sci. 54: 443 – 446.
Shinagawa, K., Takechi, T., Matasusaka, N. and Shugii, S. (1992b).
Purification of an enterotoxin produced by Bacillus cereus by immuno affinity chromatography using a monoclonal antibody. Canadian Journal of Microbiology 38 (2): 153 – 156.
Spira, W. M. and Silverman, G. J. (1979). Effects of Glucose, pH and
Dissolved – Oxygen Tension on Bacillus cereus growth and permeability factor production in Batch culture. Applied and Environmental Microbiology 37: 109 – 116.
99

Svensson, B., Ekelund, K., Ogura, H. and Chrgtiansson, A. (2004). Characterization of Bacillus cereus isolated from milk silo tanks at eight different diary plants. International Diary Journal 14: 17 – 27.
Te Giffel, M. C., Beumer, R. R., Bonestroo, M. H. and Rombouts, F. M.
(1996). Incidence and characterization of Bacillus cereus in two dairy processing plant. Netherlands milk and Dairy Journal 50: 479 – 492.
Te Giffel, M. C., Beumer, R. P., Slaghuis, B. A. and Rombouts, F. M. (1995).
Occurrence and Characterization of Psychrotrophic Bacillus cereus on farms in the Netherlands. Netherlands milk & Dairy Journal 49: 125 – 138.
Te Giffel, M. C., Beumer, R. R., Granum, P. E. and Rombouts, F. M. (1997).
Isolation and characterization of Bacillus cereus from pasteurized milk in household refrigerators in the Netherlands. International Journal of Food Microbiology 34: 307 – 318.
Thompson, N. E., Ketterhagen, M. J., Bergdoll, M. S. and Schantz, E. J.
(1984). Isolation and some properties of an enterotoxin produced by Bacillus cereus. Infect Immun 43: 887 – 894.
Valero M., Leontidis S., Fernandez P., Martinez A. and Salmeron C. (2000).
Growth of Bacillus cereus in natural and acidified carrot substrates over the temperature range 5 – 30OC. Food Microbiology 17: 605 – 612.
Van Netten, P., Van de Moosdjik, A., Van Hoensel, P., Mossel, D. A. A. and
Perales, I. (1990). Psychrotrophic strains of Bacillus cereus producing enterotoxin. Journal of Applied Bacteriology 69: 73 – 79.
Von Stetten, F., Mayr, R. and Scherer, S. (1999). Climatic Influence on
Mesophilic Bacillus cereus and psychrotolerant Bacillus wihenstephansis populations in tropical temperate and alpine soil. Environmental Microbiology 1: 505 – 515.
Wiencek, K. M., Hapes, N. A. and Foegeding, P. M. (1990). Hydrophobicity of
Bacillus and Clostridium spores. Applied and Environmental Microbiology. 65: 470 – 475.
Willardsen, R., Busta, F., Allen, C., Smith L. (1978). Growth and survival of
Clostridium perfringens during constantly rising temperatures. J. Food Sci. 43: 470 – 475.
100

Yamada, A., Tsukagoshi, N., Udaka, S., Sasaki, t., Makino, S., Nakamura, S.,
Little, C., Tomita, M. and Ike Zawa, H. (1988). Nucleotide sequence and expression in Escherichia coli of the gene Coding for Sphingomyelinase of Bacillus cereus. Eur J. Biochem. 175: 213 – 20.
Zhou, C., Yang, Y. Y., Jong, A. Y. (1990). Mini prep Plasmid DNA in Ten
minutes. Biotechniques 11: (2) 217.
101

APPENDIX 1 Electrophoretic Mobility of Standard Molecular weight Markers in Figure1.
Electrophoretic mobility (mm) Molecular weight (bp)
17 23130
21 9416
24
26
6557
4321
37 2322
41 2027
102

APPENDIX II
0
5000
10000
15000
20000
25000
30000
35000
40000
0 10 20 30 40 50
Electrophoretic mobility (mm)
Mo
lecu
lar
wei
gh
t (b
p)
Reference graph of the molecular weight versus
electrophoretic mobility of the standard molecular weight
marker.
103

APPENDIX III
The eletrophoretic mobilities and calculated molecular weights of plasmid
bands in Figure 1.
Bands No of Bands
Electrophoretic mobilities
Molecular weights
Lane 3 3 1 mm, 18 mm, 28 mm
>35 Kbp, 21 Kbp, 5 Kbp
Lane 4 3 1 mm, 18 mm, 28 mm
>35 Kbp, 21 Kbp, 5 Kbp
Lane 5 3 1 mm, 18 mm, 28 mm
>35 Kbp, 21 Kbp, 5 Kbp
Lane 6 3 1 mm, 18 mm, 28 mm
>35 Kbp, 21 Kbp, 5 Kbp
Lane 7 3 1 mm, 18 mm, 28 mm
>35 Kbp, 21 Kbp, 5 Kbp
Lane 8 3 1 mm, 18 mm, 28 mm
>35 Kbp, 21 Kbp, 5 Kbp
Lane 9 3 1 mm, 18 mm, 28 mm
>35 Kbp, 21 Kbp, 5 Kbp
Lane 10 3 1 mm, 18 mm, 28 mm
>35 Kbp, 21 Kbp, 5 Kbp
Lane 11 - No sample loaded No sample loaded
Lane 12 3 1 mm, 18 mm, 28 mm
>35 Kbp, 21 Kbp, 5 Kbp
Lane 13 3 1 mm, 5 mm, 12 mm >35 Kbp, 33 Kbp, 26 Kbp
Lane 14 3 1 mm, 18 mm, 28 mm
>35 Kbp, 21 Kbp, 5 Kbp
Lane 15 1 18 mm 21 Kbp
Lane 16 3 1 mm, 18 mm, 28 mm
>35 Kbp, 21 Kbp, 5 Kbp
104

APPENDIX IV
***** Analysis of variance for Effects Temperature *****
Variate: NRRL_BC
Source of variation d.f. s.s. m.s. v.r. F pr.
Temp_oC 2 96.260 48.130 12.71 <.001
Residual 18 68.138 3.785
Total 20 164.399
***** Tables of means *****
Variate: NRRL_BC
Grand mean 12.79
Temperature (oC) 4.00 28.00 37.00
10.00 13.17 15.20
*** Least significant differences of means (5% level) ***
Table Temp_oC
rep. 7
d.f. 18
l.s.d. 2.185
Least Significant Difference Table
Treatments
Means
Difference between treatment
means (i-j)
4oC – 28
oC
-37oC
28oC – 4
oC
-37oC
37oC – 4
oC
-28oC
-3.17*
-5.2*
3.17*
-2.03
5.2*
2.03
* Significance
105

APPENDIX V
***** Analysis of variance for Growth of BC7 at different
Temperatures
Variate: BC7_Gth
Source of variation d.f. s.s. m.s. v.r. F pr.
Temp_oC 2 47.693 23.847 11.15 <.001
Residual 18 38.493 2.139
Total 20 86.186
***** Tables of means *****
Variate: BC7_Gth
Grand mean 11.85
Temperature(oC) 4.00 28.00 37.00
10.00 11.85 13.69
*** Least significant differences of means (5% level) ***
Table Temp_oC
rep. 7
d.f. 18
l.s.d. 1.642
Least Significant Difference Table
Treatments
Means
Difference between treatment
means (i-j)
4oC – 28
oC
-37oC
28oC – 4
oC
-37oC
37oC – 4
oC
-28oC
-1.85*
-3.69*
1.85*
-1.84*
3.69*
1.84*
* Significance
106

APPENDIX VI
***** Analysis of variance *****
Variate: BC9_Gth
Source of variation d.f. s.s. m.s. v.r. F pr.
Temp_oC 2 46.282 23.141 9.60 0.001
Residual 18 43.383 2.410
Total 20 89.665
***** Tables of means *****
Variate: BC9_Gth
Grand mean 11.85
Temp_oC 4.00 28.00 37.00
10.00 11.92 13.63
*** Least significant differences of means (5% level) ***
Table Temp_oC
rep. 7
d.f. 18
l.s.d. 1.743
Least Significant Difference Table
Treatments
Means
Difference between treatment
means (i-j)
4oC – 28
oC
-37oC
28oC – 4
oC
-37oC
37oC – 4
oC
-28oC
-1.92*
-3.63*
1.92*-1.71
3.63*
1.71
* Significance
107