uidance document for the testing and interpretation …...43 the use of data generated by...
TRANSCRIPT

Organisation for Economic Co-operation and Development
DOCUMENT CODE
For Official Use English - Or. English
1 January 1990
Guidance Document for the testing and interpretation of data on dissolution rate
and dispersion stability of nanomaterials for effects and exposure assessment
DRAFT (December 2019)
This draft is circulated for a second round of WNT comments. Comments on this document
are due 10th February 2020.
Comments made on the previous version, as well as the tracked changes mode version of this
revised GD, are available in the restricted site: https://community.oecd.org/community/tgeg
Mar Gonzalez [email protected] .
This document, as well as any data and map included herein, are without prejudice to the status of or sovereignty over any territory, to the
delimitation of international frontiers and boundaries and to the name of any territory, city or area.

2 │
Table of contents
1 Introduction ........................................................................................................................................ 3
2 Testing of solubility and dissolution rate ......................................................................................... 5
2.1. Static Batch Test ........................................................................................................................ 5 2.2. Dynamic testing of dissolution rates ......................................................................................... 8 2.3. Data evaluation and reporting from dissolution testing ........................................................... 10
3 Testing of dispersion stability with TG 318 ................................................................................... 12
3.1. Data presentation and evaluation for TG 318 .......................................................................... 15 3.2. Alternative test conditions ....................................................................................................... 19 3.3. Testing of heteroagglomeration ............................................................................................... 20 3.4. Data evaluation and derivation of attachment efficiency ........................................................ 24
4 Use of data generated on dissolution testing and dispersion stability for further testing and
assessment strategies ........................................................................................................................ 28
4.1. Purpose .................................................................................................................................... 28 4.2. Testing strategy ....................................................................................................................... 29 4.3. Points to consider when applying information on dispersion stability and dissolution for
potential further testing ............................................................................................................ 31
5 Use of data on dispersion stability, solubility and dissolution rate in exposure modelling ........ 35
5.1. Use of data on dissolution rate in exposure modelling ............................................................ 35
6 Links to other relevant TGs and GDs ............................................................................................ 37
6.1. WNT project 2.51: GD on Aquatic and Sediment Toxicological Testing of Nanomaterials .. 37 6.2. WNT project 3.14: GD to support the use of TG312 (Leaching in soil columns) for
nanomaterial safety testing. ..................................................................................................... 38 6.3. WNT project 3.12: Assessing the Apparent Accumulation Potential of Nanomaterials
during fish bioaccumulation studies ........................................................................................ 38 6.4. OECD TG 105: Dissolution in water ...................................................................................... 38 6.5. OECD GD 29: Guidance document on transformation/dissolution of metals and metal ........ 39 6.6. OECD TG 106 Adsorption - Desorption Using a Batch Equilibrium Method ........................ 39 6.7. OECD WNT project 3.11. TG for nanomaterial removal in wastewater ................................ 40
7 References ......................................................................................................................................... 41
Annex I Terminology, definitions and abbreviations ................................................................. 47

│ 3
1 Introduction
In the OECD Expert Meeting in Berlin 2013 (OECD 2014a), it was identified that 1
dissolution rate and dispersion stability in the environment are important parameters for 2
nanomaterials, i.e. these parameters are main drivers in environmental fate of nanomaterials 3
and nanomaterials (bio)availability, and as such important in environmental risk 4
assessment of nanomaterials. It was concluded that Test Guidelines (TGs) should be 5
developed for these parameters. As these parameters are often interlinked it was also 6
acknowledged that an overarching guidance document (GD) would be beneficial as well. 7
A Test Guideline (TG 318, OECD 2017) on dispersion stability of manufactured 8
nanomaterials in simulated environmental media is already available since 2017. 9
The development of a TG on dissolution rate in environmental media was 10
included as OECD WNT (Working Group of National Co-ordinators of the OECD Test 11
Guidelines Programme) project 3.10 in the Test Guideline Programme work plan in 2014 12
(latest draft version OECD 2018), but could not be finished so far. The purpose of this TG 13
is to develop and adequately validate a robust method in standardised conditions for 14
dissolution of nanomaterials. Meanwhile, also other relevant methods for dissolution rate 15
testing in water and biological fluids (WNT project 1.5) as well as transformation in the 16
environment (WNT project 3.16) were included to the WNT work plan. In view of the 17
current lack of harmonised methods and to make progress, it was concluded for the 18
meantime to include the dissolution relevant content in this overarching GD based on the 19
available information, including the current draft documents of WNT project 3.10, 20
scientific literature, and GD 29 (OECD 2001). In doing so, the GD provides interim 21
guidance on experimental steps and procedures of batch and dynamic flow-through 22
methods and decision support when to use them for nanomaterials (Chapter 2) until the 23
related TG is available. When these above mentioned OECD projects are finalised and TGs 24
available, an update of this GD might be needed. 25
This document provides guidance for the methods to address dissolution rate and 26
dispersion stability for nanomaterials. The definition of nanomaterials as having one 27
dimension between 1 and 100 nm is generally accepted (ISO 2017a, EU 2011). The 28
guidance provided here is relevant for particles in nanoscale as well as its aggregates and 29
agglomerate and focuses on the fate and behaviour in aqueous media. In particular it 30
presents the influence of various experimental conditions on the performance and outcomes 31
of the discussed methods. In addition, this GD addresses modifications or additions to the 32
methods and aims to give support for the interpretation of the test results. 33
Chapter 2 provides guidance for the determination of solubility and dissolution 34
rate based on batch test and flow-through methods as well as on how to evaluate and report 35
the gained test results. 36
Specific guidance on TG 318 is given in Chapter 3 including further 37
experimental conditions than described in the TG, guidance to account for 38
heteroagglomeration (section 3.3), and deriving attachment coefficient(s) (section 3.4). In 39
order to address the latter issues, the state of the knowledge was included from available 40
scientific literature. Furthermore, guidance is provided on the interpretation and 41
presentation of data addressing the endpoint. 42

4 │
The use of data generated by dissolution testing and testing of dispersion stability 43
using TG 318 for possible further nano-specific fate and effect testing and assessment 44
strategies is presented in Chapter 4. A testing strategy is presented in section 4.2. 45
Furthermore, mutual influence of the two endpoints to each other is discussed, i.e. 46
dispersion stability will influence dissolution rate and vice versa. 47
In Chapter 5, this GD provides recommendations on the use of output data from 48
dissolution rate and dispersion stability tests to derive input parameters for exposure 49
models. 50
Chapter 6 provides information on the use of this GD in relation to other OECD 51
TGs and GDs, including the foreseen GD on aquatic and sediment toxicity testing (see 52
section 1) and the foreseen GD on the apparent accumulation potential of nanomaterials in 53
fish (see section 6.3). As fate estimations of nanomaterials in soil and sediment are 54
challenging to conduct, the GD also gives advice on screening possibilities for dispersion 55
stability and dissolution rates by varying the environmental conditions to mimic those in 56
soil and sediment (see section 6.2), and this is linked to the foreseen nano-specific GD for 57
OECD TG 312 of OECD project 3.14. 58

│ 5
2 Testing of solubility and dissolution rate 59
It is important to clearly distinguish between the terms solubility, dissolution and 60
dissolution rate (see Annex 1 for definitions). Solubility and dissolution rate of 61
nanomaterials are important to predict their fate and behaviour in the environment and for 62
understanding the changes in their bioavailability, reactivity, fate, and toxicity. Dissolution 63
rates from nanomaterials are particularly important in determining risk/hazard since the 64
rate of release of ions/molecules prior to interaction/complexation with ligands may be 65
more important than equilibrium concentrations. 66
General methods for the determination of solubility and dissolution rate are 67
available e.g. OECD TG 105 (OECD1995), Misra et al. 2012, and ISO 19057 (ISO 2017b). 68
All these methods feature different advantages and disadvantages for nanomaterial testing. 69
So far, no specific OECD TG is available for determination of solubility and dissolution 70
rate for nanomaterials. However, there are two WNT projects ongoing (WNT project 3.10 71
“TG on Dissolution Rate of Nanomaterials in Aquatic Environment”, and WNT project 1.5 72
on “Determination of Solubility and Dissolution Rate of Nanomaterials in Water and 73
Relevant Synthetic Biological Media”) aiming to provide harmonised approaches for 74
testing solubility and dissolution rate of nanomaterials via static batch testing and dynamic 75
flow-through methods, respectively. 76
In the existing OECD TG 105 (OECD 1995) two methods are described for the 77
determination of solubility of substances, a static batch test and a dynamic test. For 78
determining dissolution (rate) of nanomaterials the same set-up may be used with some 79
modifications. In addition, the existing OECD GD 29 (OECD 2001) for metals and metal 80
compounds may be applicable to some nanomaterials. It describes a similar batch test as 81
the one developed in WNT project 3.10. Scientific basis for the flow-through method 82
currently foreseen in the WNT project 1.5 can be found in literature e.g. in Koltermann-83
Juelly et al. 2018. 84
2.1. Static Batch Test 85
Currently a draft TG on “Determining the Dissolution of Metal Nanomaterials in 86
Aquatic Media” is in preparation (WNT project 3.10) but not yet available. This draft TG 87
is based on OECD GD 29 (OECD 2001, Guidance Document on 88
Transformation/Dissolution of Metals and Metal Compounds in Aqueous Media) while 89
making some nanospecific amendments. Care should be taken regarding the applicability 90
of OECD GD 29 when considering the purpose of testing solubility and dissolution rate of 91
nanomaterials. OECD GD 29 aims to provide supplemental information for aquatic 92
ecotoxicity testing of metal and metal compounds. As indicated in OECD GD 29 “The 93
intent of the screening test, performed at a single loading, is to identify those compounds 94
which undergo either dissolution or rapid transformation such that their ecotoxicity 95
potential is indistinguishable from soluble forms”. As such the original purpose of OECD 96
GD 29 is not to provide a harmonised approach to determine solubility or dissolution rate 97
or to provide information on environmental fate. Some of the pros and cons of a static batch 98
test as described in GD 29 are discussed in this section. 99
Furthermore, several considerations in GD 29 differ from the rationale of testing 100
nanomaterials. For example, while GD 29 asks for testing the smallest available particle of 101

6 │
a metal or metal compounds, for nanomaterial the question arises about the solubility or 102
dissolution rate of the specific nanomaterial under investigation. As another example, the 103
screening test in GD 29 requires test conditions where a metal/metal compound shows 104
highest solubility, whereas for nanomaterials the specific solubility/dissolution rate under 105
certain conditions is of interest (i.e. not necessarily the highest solubility). 106
For testing of solubility and dissolution rate the use of the 24 h screening test of 107
GD 29 can still be of interest and can be in principle applied, depending on the nanomaterial 108
properties. This seems to work at least for silver nanoparticles (Wasmuth et al 2016). For 109
instance, the screening test can provide solubility limit for all nanomaterials and estimation 110
of dissolution rate for sparingly soluble and slowly dissolving nanomaterials. However, for 111
determining dissolution rate, the concentration of dissolved ions needs to be measured over 112
the time with short measuring intervals as long as steady state concentration is not reached. 113
This is of particular importance for such nanomaterials that dissolves very fast within few 114
hours. 115
GD 29 prescribes a 0.20 m filtration method for separating dissolved and non-116
dissolved compounds. This is not appropriate for nanomaterials that have individual 117
particles or aggregates that are usually smaller than this size cut-off, so further separation 118
is needed. ISO 19057 (ISO 2017b) reviews separation techniques that are applicable for 119
nanomaterials related to in vitro biodurability testing. 120
For the screening test the OECD GD 29 proposes the use of reconstituted standard 121
water with pH range between 6 to 8.5 (i.e. water of known composition, for details on 122
media composition see OECD GD 29). However, in principle and based on the purpose of 123
the testing, the 24 h screening test can be also performed under different media conditions 124
(e.g. ecotoxicity media, natural water, simulated media according to TG 318). In any way, 125
it is essential to characterise and report test media characteristics as detailed as possible (at 126
least pH at begin, after equilibrium time and end of testing, ionic strength, if possible the 127
presence and the concentration of polyvalent ions, and the composition and concentration 128
of NOM should be reported), as media composition considerable influences nanomaterial’s 129
dissolution. 130
When performing the dissolution test as a batch test, it should be realised that 131
derived dissolution rates according to GD 29 may not reflect the dissolution rate under 132
environmental realistic conditions. The ion concentration in the test media may increase, 133
and the solubility limit of an investigated nanomaterial in the specific test medium may be 134
reached before complete dissolution. Longer observation periods will then reduce the 135
apparent dissolution rate. If not already considered in the process of deriving the rate 136
constant and the applied model, the obtained value will be depending on the a) solute 137
concentration already present at the start and b) the solute concentration build-up during 138
the experiment. Derivation of dissolution rate of dissolving nanomaterials is not possible 139
for those nanomaterials that show such a rapid increase of the ion concentration during 140
testing resulting in a steep slope that cannot be resolved by measurement. Speciation 141
calculations can be useful for the investigated nanomaterial to estimate its general tendency 142
of dissolution in the used test media e.g. using the freely available software Phreeqc (The 143 software PHREEQC (ver. 3 from the United States Geological Survey: 144 https://www.usgs.gov/software/phreeqc-version-3/) or VMinteq (https://vminteq.lwr.kth.se/) 145
under consideration of the full test media characteristics. This would include a suggestion 146
of the use of a unified database for the calculations. However, not all nanomaterials are 147
covered by existing data base entries. 148

│ 7
Three main methods exist in the literature to separate nanomaterials and their 149
aggregates from their dissolved fraction: ultra-centrifugation, dialysis and centrifugal 150
ultrafiltration. Research has shown that filter pore sizes of 0.1 to 0.02 μm could be suitable 151
for separation of some nanomaterials from dissolved species (Jünemann and Dressman 152
2012) by filtration. As retention depends also on the filter material this should be reported 153
together with filter pores size in case filtering was used for nanomaterial separation. 154
Ultra-centrifugation is not recommended for several reasons. Firstly, it is difficult 155
to calculate the optimal centrifugal settings (speed and time) to guarantee complete 156
centrifugation of nanomaterials, especially for the case of non-spherical particles and when 157
the rotor has no swing-bucket design but is e.g. a fixed angle rotor. Secondly, theoretical 158
optimal centrifugal times are often long relative to the dissolution rate, especially in the 159
case of relatively small nanomaterials or nanomaterials with low density. For those 160
nanomaterials a proportionally long centrifugation times is needed to be separated from 161
their dissolved ions. At the same time, they might dissolve faster compared to larger 162
nanomaterials of the same composition. A too slow separation technique thus hampers the 163
determination of relatively fast dissolution rates. Also, often the accurate density of the 164
investigated nanomaterial (e.g. nanomaterials with coating/ligants) is not known and it is 165
difficult to calculate the correct speed settings. Finally, back-diffusion of centrifuged 166
nanomaterials into the centrifuge vial during sampling is likely and may cause artefacts of 167
overestimating dissolution. To minimise sampling of back-diffused nanomaterials it is 168
therefore recommended to sample just below the surface. 169
Dialysis is also not recommended for separating nanomaterials and their 170
dissolved substances. In this technique, nanomaterials are suspended in a medium within a 171
dialysis bag. Dissolved substances thus need to diffuse through the dialysis membrane into 172
a second compartment where they can be sampled for quantification of the dissolution rate. 173
This process may again be too slow compared to the dissolution process itself (see e.g. 174
Franklin et al., 2007). 175
Centrifugal ultrafiltration is the recommend method for separating nanomaterials 176
and their dissolved substances. Here, a mixture of nanomaterials and their dissolved 177
substances are injected in centrifugal ultrafiltration devices. During centrifugation, 178
nanomaterials and dissolved substances and the test medium are transported towards an 179
ultrafiltration membrane through which nanomaterials cannot pass while their dissolved 180
substances can. The dissolved substances can then be measured in the filtered media. 181
The pore diameter of ultrafiltration is expressed in terms of molecular weight cut-182
off (MWCO), i.e. the molecular weight of different molecules in the filtration process 183
(usually dextran or polyethylene glycol) that are retained for 90 % by the membrane (Ren 184
et al., 2006). There is also a pore size distribution, rather than a single pore size. The 185
maximum pore diameter of 10 kDa membranes, for instance, is 4.57 nm (Ren et al., 2006). 186
To ensure complete separation between ionic and particulate phases, a MWCO of 187
maximum 3 kDa is recommended. However, care should be taken as the use of low MWCO 188
filter membranes can lead to a built up of ions in front of the filter. This results into a 189
measurement of a lower a dissolution rate. 190
The centrifugal speed and time required to drive a sufficient amount of aqueous 191
solution containing dissolved species to cross the membrane depends on the MWCO and 192
hydrophobicity of the membrane, as well as the chemistry of the medium. The centrifugal 193
settings should be optimized to achieve a filtrate volume sufficient for subsequent 194
measurement. Prewashing of the filter membrane by centrifuging ultrapure water through 195
the membrane is prerequisite for any filtration step to remove dissolved chemicals that 196
8 │
could influence the dissolution process. Modifying or pre-treating the membranes can be 197
used if significant issues are observed, e.g. binding to the membrane (Cornelis et al. 2010, 198
Hedberg et al. 2011). Prior to use, a centrifugal filtration device should be evaluated 199
concerning the interaction with the investigated nanomaterial. This can help to assess 200
possible loss of ions and to avoid an underestimation of dissolution rate (Kennedy et al., 201
2010). 202
In principle the batch test procedure may also be applicable for testing non-metal 203
nanomaterials, but the current analytical possibilities are still limiting these options. 204
2.2. Dynamic testing of dissolution rates 205
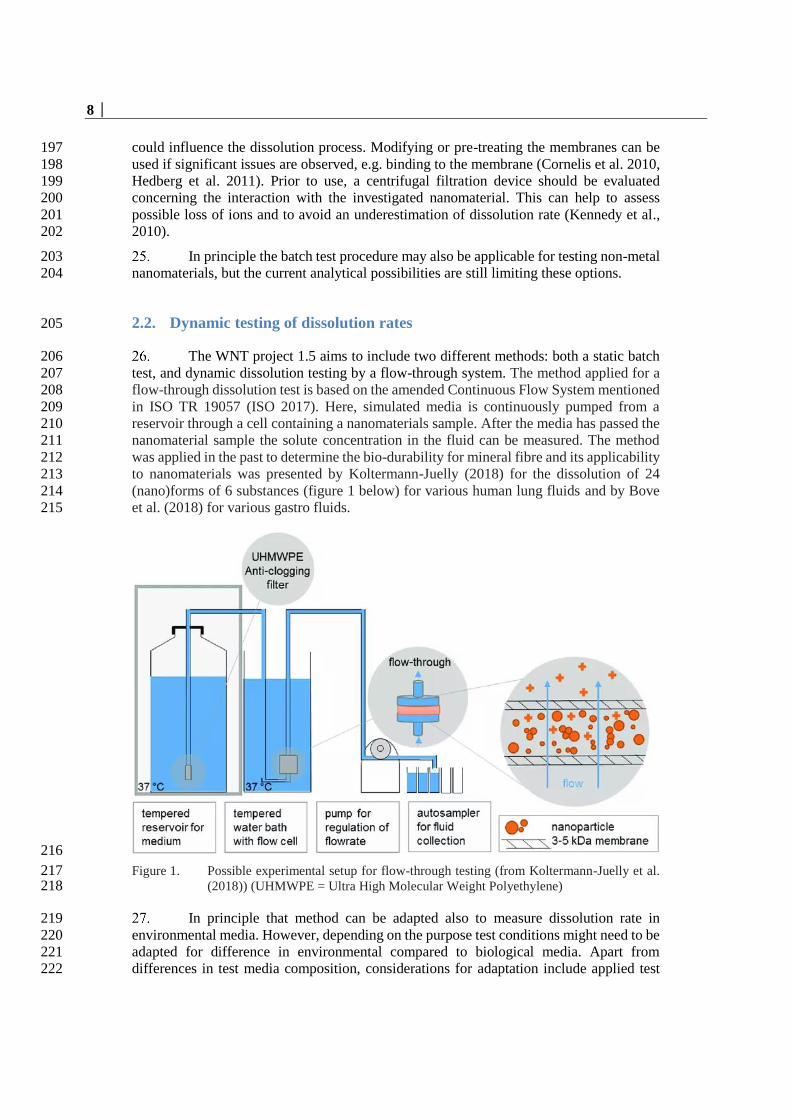
The WNT project 1.5 aims to include two different methods: both a static batch 206
test, and dynamic dissolution testing by a flow-through system. The method applied for a 207
flow-through dissolution test is based on the amended Continuous Flow System mentioned 208
in ISO TR 19057 (ISO 2017). Here, simulated media is continuously pumped from a 209
reservoir through a cell containing a nanomaterials sample. After the media has passed the 210
nanomaterial sample the solute concentration in the fluid can be measured. The method 211
was applied in the past to determine the bio-durability for mineral fibre and its applicability 212
to nanomaterials was presented by Koltermann-Juelly (2018) for the dissolution of 24 213
(nano)forms of 6 substances (figure 1 below) for various human lung fluids and by Bove 214
et al. (2018) for various gastro fluids. 215
216
Figure 1. Possible experimental setup for flow-through testing (from Koltermann-Juelly et al. 217 (2018)) (UHMWPE = Ultra High Molecular Weight Polyethylene) 218
In principle that method can be adapted also to measure dissolution rate in 219
environmental media. However, depending on the purpose test conditions might need to be 220
adapted for difference in environmental compared to biological media. Apart from 221
differences in test media composition, considerations for adaptation include applied test 222

│ 9
concentration, flow rates and test duration. For instance, for the determination of 223
dissolution rate under environmental relevant conditions considerably different 224
concentrations (e.g. media composition, temperature) and flow rates (first suggestion µg 225
and 1 ml/min) should be used than those used for the dissolution testing in biological media 226
(mg and 2 ml/h), thus saturation effects will hardly occur. 227
The dynamic dissolution test should mimic the condition in a natural water, where 228
the nanomaterial is highly diluted and freely diffusing. The dissolution rate of intermediate 229
and highly soluble materials is among other parameters controlled by the thickness of the 230
boundary layer and the concentration gradient of dissolved ions in the boundary layer. For 231
those nanomaterials the transport of ions away from the particle surface is a limiting factor. 232
The flow rate in the experiment should ideally mimic those conditions. With 2 mL/h 233
saturation effects have been observed with BaSO4, at 1 mL/min these effects are reduced 234
but not totally prevented. Flow rate and test conditions can be in principle modified to 235
mimic other specific environmental relevant conditions. 236
With current scientific knowledge and the co-dependence of the dissolution rate 237
on solubility, thickness of boundary layer and specific surface area/particle size, exact cut 238
off values for applying a dynamic dissolution test cannot be given. From current 239
experiences the dynamic test would be suggested if the solubility of the nanomaterial is 240
between 0.1 and 10 mg/L. This range can of course be broadened when test conditions as 241
flow rate and amount of material in the test are adapted to the solubility of the material. 242
In addition, the test procedure can be adapted in such a way that the application 243
of the investigated nanomaterial can be injected directly as a dispersion into the system at 244
a location between the pump and the filter membrane (MWCO between 3-10 kDa). A 245
schematic overview of the dynamic test system is presented in Figure 2. Filter membranes 246
with low MWCO can help to avoid the passage of small particles. However, care should 247
be taken as the use of low MWCO filter membranes can lead to a built up of ions in front 248
of the filter. This results into a measurement of a lower a dissolution rate. 249
Similar to the batch test, in principle the flow-through test procedure may also be 250
applicable for testing of non-metal nanomaterials, but the analytical possibilities are still 251
limiting these options. 252

10 │
253
Figure 2. A draft scheme for dynamic testing of dissolution rate (von der Kammer 2018, 254 personal communication, to be published soon). (P = pump, IV = Injection Valve). 255
2.3. Data evaluation and reporting from dissolution testing 256
The concentration of the dissolved fraction should be measured during the test 257
and plotted versus time. 258
The result of the solubility test has to be expressed as mg/L of the ions formed as 259
a consequence of dissolution. As the solubility depends on the starting concentration, also 260
the starting concentration has to be reported. Expression solubility in % is discouraged as 261
this is difficult to interpret and to compare with other data. 262
For most existing nanomaterials, dissolution follows a (pseudo-)first order 263
kinetics. But it should be noted that there are nanomaterials that might follow zero or 264
second order kinetics and thus, it has to be reviewed how models relate to nanomaterials of 265
different shape and surface area. Care should be also taken for nanomaterials with broad 266
size distribution as the smaller particle tend to dissolve faster than the bigger ones. This 267
could lead to an incorrect choice of fitting models. However, as a result, the dissolution 268
rate will not only depend on the dissolution rate constant and specific surface area, but also 269
on mass. The relationship is: 270
Dissolution rate =𝑑m
𝑑t= −𝑘diss ∙ m 271
where m is mass of the nanomaterial, t is time, and kdiss is dissolution rate constant. 272
Dissolution rate can be also expressed as: 273
Dissolution rate =𝑑m
𝑑t= (D ∙
A
h) ∙ (cS − c) 274

│ 11
where D is the diffusion coefficient of the dissolved species in the medium, A is the surface 275
area of the nanomaterial, h is the thickness of the diffusion layer, cS is the saturation 276
concentration, and c is the starting concentration. The thickness of the diffusion layer will 277
be dependent on the test condition e.g. if the nanomaterial is agitated during the test 278
performance. 279
Based on this dissolution rate of first order kinetics the dissolution halftime (when 280
half of the nanomaterial is left and half is dissolved, respectively) can be estimated (for 281
information on calculation model see e.g. chapter 11.6 of ISO 2017b). 282
Results on solubility and dissolution rate have to be reported together with test 283
conditions like media composition, temperature, and test duration. Regarding 284
environmental exposure modelling, one of the important nanomaterial characteristics 285
required is the dissolution rate constant (kdiss) and not the dissolution rate itself. The use of 286
kdiss for exposure modelling is discussed in Chapter 5. 287
288

12 │
3 Testing of dispersion stability with TG 318 289
OECD TG 318 (OECD 2017) describes a method for determining the 290
dispersibility and dispersion stability of nanomaterials in aqueous media of different, yet 291
environmentally relevant hydrochemistry. Prerequisite for the experimental approach was 292
to enable the investigation of the dispersion behaviour in a small number of relatively 293
simple tests within a time frame suitable for standard laboratory routine. The 294
hydrochemical conditions in the tests cover those parameters and parameter ranges which 295
are (a) representative for natural waters and (b) are recognized drivers for agglomeration 296
of nanomaterials within concentration range of the TG (Monikh et al. 2018). Hence the 297
composition of the test media resembles only those compounds in surface water that are 298
relevant for the agglomeration process and exist in a concentration range where they can 299
become relevant. 300
Dispersion stability as measured using TG 318 actually determines 301
homoagglomeration (attachment of nanomaterial to each other) under consideration of 302
environmental parameters which have a major influence on the dispersion stability of 303
nanomaterials over a fixed time-span of 6 hours. This enables a direct comparison of 304
nanomaterials with each other and how they will behave in test systems. For comparison 305
with media which differ in composition from the test media in TG 318, the agglomeration-306
relevant compounds in the media should be compared. These are the concentrations of 307
divalent cations and anions, the pH, the concentration of natural organic matter. 308
The kinetics of the homoagglomeration processes are depending on the number 309
concentration of the nanomaterials and the progression of agglomeration. To be able to 310
directly compare results among different nanomaterials and also to finish the test over a 311
period of 6 hours, the starting concentration must be set to a fixed particle number 312
concentration. In this way the agglomeration process is almost independent of particle size 313
and density. Comparisons have shown that the starting concentration in particle number 314
should not vary more than one order of magnitude between different nanomaterials (i.e. 315
roughly plus or minus half an order of magnitude). To obtain the required mass 316
concentration of the nanomaterial, the mass concentration of the nanomaterial in the stock 317
dispersion has to be converted into particle number concentration by using the average 318
particle diameter and material density as described in TG 318. It is acknowledged that, 319
especially nanomaterials with a broad size distribution, the average particle size will not 320
convert correctly into the particle number concentration, however, the influence on the test 321
outcome appears to be small (order of magnitude accuracy required) so that the additional 322
effort for precisely determining the particle size distribution and considering it in the 323
number calculation appears not necessary. However, if precise data on the particle size 324
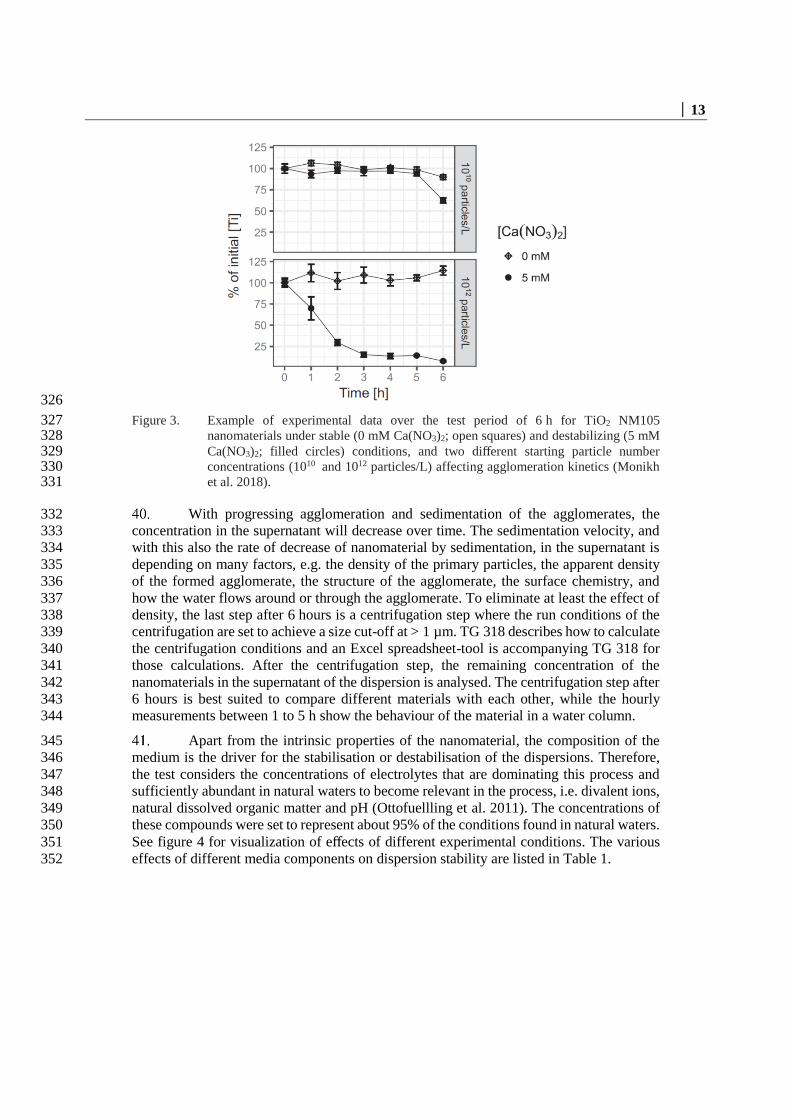
distribution are available, it is advised to use this information. For an example see figure 3. 325
│ 13
326
Figure 3. Example of experimental data over the test period of 6 h for TiO2 NM105 327 nanomaterials under stable (0 mM Ca(NO3)2; open squares) and destabilizing (5 mM 328 Ca(NO3)2; filled circles) conditions, and two different starting particle number 329 concentrations (1010 and 1012 particles/L) affecting agglomeration kinetics (Monikh 330 et al. 2018). 331
With progressing agglomeration and sedimentation of the agglomerates, the 332
concentration in the supernatant will decrease over time. The sedimentation velocity, and 333
with this also the rate of decrease of nanomaterial by sedimentation, in the supernatant is 334
depending on many factors, e.g. the density of the primary particles, the apparent density 335
of the formed agglomerate, the structure of the agglomerate, the surface chemistry, and 336
how the water flows around or through the agglomerate. To eliminate at least the effect of 337
density, the last step after 6 hours is a centrifugation step where the run conditions of the 338
centrifugation are set to achieve a size cut-off at > 1 µm. TG 318 describes how to calculate 339
the centrifugation conditions and an Excel spreadsheet-tool is accompanying TG 318 for 340
those calculations. After the centrifugation step, the remaining concentration of the 341
nanomaterials in the supernatant of the dispersion is analysed. The centrifugation step after 342
6 hours is best suited to compare different materials with each other, while the hourly 343
measurements between 1 to 5 h show the behaviour of the material in a water column. 344
Apart from the intrinsic properties of the nanomaterial, the composition of the 345
medium is the driver for the stabilisation or destabilisation of the dispersions. Therefore, 346
the test considers the concentrations of electrolytes that are dominating this process and 347
sufficiently abundant in natural waters to become relevant in the process, i.e. divalent ions, 348
natural dissolved organic matter and pH (Ottofuellling et al. 2011). The concentrations of 349
these compounds were set to represent about 95% of the conditions found in natural waters. 350
See figure 4 for visualization of effects of different experimental conditions. The various 351
effects of different media components on dispersion stability are listed in Table 1. 352

14 │
353
Figure 4. A general visualization of effect in different experimental conditions and how this can 354 be used to differentiate between suspensions of A high, B intermediate and C low 355 stability. (Monikh et al. 2018). 356
Table 1. Role and effect of the selected components in the synthetic water (Monikh et al. 2018) 357
compound represents effect effect strength abundance
Na+ monovalent cations not included
destabilisation low medium
Ca2+ divalent cations destabilisation
stabilisation when adsorbing to surfaces of positively charged materials
medium high
Mg2+ divalent cations less complexed by NOM
destabilisation
relevant when NOM is high and complexes Ca2+
low low
NO3- monovalent anions destabilisation
non-adsorbing
non-complexing
low low
SO42- divalent cations destabilisation, especially positively charged particles medium medium
Al3+ trivalent cations not included
destabilisation high very low
SR-NOM dissolved organic matter
stabilisation through surface adsorption with electrostatic (negative) and steric effect charge reversal (positive to negative) through complexation of destabilising cations
destabilising when adsorption to positive surfaces reduces net charge of surfaces
high medium
A decision tree is presented in the TG 318 to determine whether the nanomaterial 358
of interest requires only a screening procedure or if an in-depth testing has to be performed. 359
The decision tree allows nanomaterials to be categorised as generally stable dispersible 360
under all test conditions, non-dispersible or dispersible depending on the hydrochemical 361

│ 15
conditions. The screening test is performed in the presence of natural organic matter, which 362
will stabilise most nanomaterials against agglomeration. This will put many nanomaterials 363
into the category “dispersible, no detailed testing in TG 318 necessary”. 364
The NOM added to the test vial has three roles in the test: (a) it acts as a pH buffer 365
stabilizing the adjusted pH, especially at pH 9, (b) it complexes Ca2+ and reduces thereby 366
the activity of the destabilising Ca2+ ion, (c) it adsorbs to the surface of the nanomaterial 367
and adds to the negative charge density, thereby reducing the net positive charge that can 368
lead to destabilisation. If present in sufficient amounts, it eventually may reverse the charge 369
to negative and can increase the magnitude of the negative charge density. The amount of 370
natural organic matter to be used is standardized to 10 mg/L DOC in 40 mL (400 µg DOC) 371
and a calculation tool for the required minimum DOC is provided in the TG318. It should 372
be considered that under certain conditions (e.g. NOM composition) NOM can lead to a 373
destabilisation. In addition, some nanomaterials may not adsorb NOM under surface-water 374
like conditions (Hedberg et al. 2017a, Hedberg et al. 2017b, Pradhan et al. 2017) 375
Applicability of TG 318 for different nanomaterial types should be considered 376
based on the available data on similar or resembling nanomaterials, e.g. based on their 377
shape and size (spherical, rod, platelets, fibre-like). Three considerations are important to 378
judge a priori if the test can be applied to a nanomaterial: (a) the nanomaterials density 379
must be > 1 g/cm³, (b) the mass concentration calculated for the required particle number 380
concentration must be at least 10 times above the detection limit of the analytical method, 381
(c) an analytical method with sufficient sensitivity for the nanomaterial or an equally 382
distributed component is required. The requirement (b) stems from the consideration that 383
even with 90% removal from the water column the nanomaterial should still be quantifiable 384
in the supernatant. Especially for small, low density particles, the mass concentration 385
originating from the recommended number concentration might challenge the ICP-OES 386
based methods and at some point also routinely operated ICP-MS methods. The required 387
detection limit (10% of initial concentration) for a SiO2-NP of 15 nm would be ~0.2 µg/L 388
(Si). 389
Regarding the analytical approach to quantify the nanomaterials in the 390
supernatant in principle any method/instrument (e.g. ICP-MS, GFAAS, polarography) can 391
be applied which offers the required detection limits for the nanomaterial or a component 392
of it. Beside dispersion stability measurement zeta potential as calculated from 393
electrophoretic mobility can provide indicator for nanomaterial stability. However, this 394
method will not provide information on the amount and behaviour of the (de-) stable 395
fraction. 396
3.1. Data presentation and evaluation for TG 318 397
When the dispersion stability of a nanomaterial is tested according to TG 318 398
either the screening test is already sufficient, or a full testing is required. 399
There are various ways to present the retrieved data for the screening test or to 400
visualize the influence of electrolyte concentration, pH, and presence of NOM. Examples 401
of data presentation from dispersion stability studies using TG 318 are shown in figure 5, 402

16 │
6, and 7. A spreadsheet tool1 is accompanying this GD to facilitate such a harmonized 403
presentation of the data. 404
Figure 5 shows a schematic example on dispersion stability for results of the 405
screening test with the three possible outcomes according to the TG 318 decision tree. 406
In figure 6 the output of the tool for illustrating the full tests’ results (following 407
Monikh et al. 2018) is presented. Here the results are presented in a three-dimensional 408
matrix considering various hydrochemical conditions and the resulting dispersion stability. 409
Higher colloidal stability (less agglomeration/sedimentation) is reflected by a higher 410
remaining concentration (brighter shade in the plots) in the dispersion relative to the 411
starting concentration (0-100%). 412
By means of the full test beside dispersion stability also information on the 413
underlying processes leading to the removal from the water column can be elucidated. 414
Figure 7 presents an example of a dispersion stability plot of the full test for one test 415
condition where the dispersion stability measured at each hour is plotted over the time. 416
Possible interpretation of removal processes based on the removal function are shown in 417
Figure 8. The interpretations shown here may also help designing testing strategies (Section 418
4). 419
420 421
Figure 5. Output from the spreadsheet tool for the screening test at different Ca2+ concentrations 422 (y-axis) and pH-values (x-axis) in the test medium. (The numbers in the boxes indicate 423 the % of initial concentration left in the supernatant at the end of the test). Left panel: 424 all tests are completed with ≥90 % of the nominal (initial) concentration left in the 425 supernatant after 6 h (indicating high stability). Middle panel: some conditions lead 426 to stable (≥90 %), some to intermediate stability (≥10 % and ≤ 90%), further testing 427 is required in a full test. Right panel: all conditions lead to ≥ 90 % sedimentation from 428 the water column (≤10 % stability), indicating an unstable nanomaterial under tested 429 conditions. Green tick presents those cases were a nanomaterial is either highly stable 430 and red cross were a nanomaterial is unstable under the respective condition. Yellow 431 exclamation mark indicates cases were a nanomaterial shows intermediate stability. 432
1 Link to Excel sheet tool [will be specified when the final GD will be published]

│ 17
433
434
435
Figure 6. Dispersion stability regarding different environmental conditions (Ca2+ 436 concentration: y-axis, pH-value: x-axis). Higher stability (less 437 agglomeration/sedimentation) is reflected by a higher remaining concentration 438 (brighter shade in the plots) in the dispersion relative to the starting concentration (0-439 100%). The numbers in the boxes represent the remaining percentage of the 440 nanomaterial in the dispersion, thus the dispersion stability in %. (from Monikh et al. 441 2018). 442

18 │
443
Figure 7. An example of dispersion stability plot as percentage of nanomaterials remaining in 444 water phase compared to initial concentration (y-axis) against time in hours (x-axis) 445 of the full test for one (here not further specified) test condition. 446
. 447
Figure 8. Possible shapes of the removal function over time and suggested interpretations. 448

│ 19
3.2. Alternative test conditions 449
TG 318 covers only synthetic waters that resemble the bandwidth of 450
agglomeration-relevant components found in surface waters. In principle TG 318 can also 451
be performed with other media than those used in TG 318, e.g. ecotoxicological test media. 452
When using any other test media, it should be assured that the addition of the nanomaterial 453
to the medium does not significantly change media conditions, e.g. the pH. A good estimate 454
can be drawn from results of TG 318 with synthetic waters if the agglomeration-relevant 455
components of the test media (sum of divalent cations, sulphate) are comparable with 456
TG 318 conditions (the full test without NOM). When using alternative test conditions 457
compared to TG 318 it is of utmost importance to characterise and report the test media 458
compositions and conditions and also to compare those with test media compositions and 459
conditions of TG 318 for the data evaluation and interpretation. This will also enable 460
retrospective analysis of studies compared with new data produced in the future. 461
TG 318 can be used with natural waters to investigate the dispersion stability and 462
agglomeration behaviour in these waters. To prevent a situation where homo- and 463
heteroagglomeration takes place in an uncontrolled way, the water sample should be 464
filtered over a filter membrane with pore size equal or smaller than 0.1 µm or subjected to 465
ultracentrifugation to remove all sorts of natural particles, microorganisms, µm-sized 466
debris, colloids and nanomaterials from the sample. It should also be taken into account, 467
that the obtained result is a (very precise) descriptive value for this one sample only, 468
resembling a unique and constantly changing situation regarding hydrochemical 469
composition and type and concentration of NOM. Whether it is possible to transfer this one 470
result to the sampled surface waterbody in general depends on the spatial and temporal 471
variability of the waterbody. If the unfiltered sample shall be tested with TG 318 the 472
presence of natural suspended particulate matter will make it necessary to apply the variant 473
of TG 318 that deals with heteroagglomeration (see section 3.3). 474
The transferability of the data from TG 318 studies to higher tier testing (e.g. 475
ecotoxicological studies) should be carefully evaluated as the used simulated 476
environmental media differs from ecotoxicological test media which aims to promote 477
animal vitality rather than to mimic natural habitats. When possible, it would be beneficial 478
to test the dispersion stability with TG 318 using the test media used in the ecotoxicological 479
test as recommended in the OECD draft GD for Aquatic (and Sediment) Toxicological 480
Testing of Nanomaterials (WNT project 2.51). However, in many ecotoxicological tests, 481
the test organism will change the test media composition, e.g. in a 72 hours algae toxicity 482
test according to TG 201 by algal exudates and photosynthesis. This will result in pH shift, 483
various ionic compositions and different NOM characteristics that will result in changes in 484
dispersion stability (but also dissolution rates). 485
NOM is a natural product with an enormous variability in structure, molecular 486
weight distribution, conformation, composition and purity. The type and quality of the used 487
NOM or even NOM in natural waters or test media with intrinsic NOM will have effects 488
on dispersion stability. This should be taken into account for data evaluation and in 489
estimations for environmental conditions. One has to distinguish between processed 490
commercial products resembling NOM or unprocessed natural NOM as part of a natural 491
water sample. The commercial products are more or less close to reality regarding their 492
properties and are more likely to enable repeatability of the results. In contrast, natural 493
NOM might trigger a behaviour of the nanomaterial (e.g. formation of “ecological corona”) 494
that is linked to the composition of the NOM, which might be very unique in time and space 495
and not fully resemble the surface water the NOM was sampled from. In TG 318 2R101N 496

20 │
Suwannee River NOM (SRNOM) is recommended as standardised and purified material. 497
Due to differences in the composition of NOM from different sources, it is difficult to 498
compare results obtained by the use of different types of NOM. Therefore, the alternatively 499
used NOM should be characterised as much as possible, at least the minimum DOC content 500
after properly cleaned from ions and ash should be determined. DOC content and treatment 501
should be reported together with the test results. It is advisable to always test the 502
nanomaterial according to the conditions presented in TG 318 in order to obtain 503
comparative “benchmark” data. 504
3.3. Testing of heteroagglomeration 505
The heteroagglomeration of nanomaterials (mainly engineered nanoparticles, 506
referred to as ENPs) with suspended particulate matter (SPM), which is ubiquitous in 507
natural surface waters, is a crucial process affecting the environmental transport and fate 508
of nanomaterials (Praetorius et al. 2014b, Quik et al. 2014, Therezien et al. 2014, Gao and 509
Lowry 2018). 510
The need for consideration of heteroagglomeration as an aspect of nanomaterial 511
fate has been discussed already during the development of TG 318 on dispersion stability 512
(Baun et al. 2017). Due to the complexity and diversity of natural SPM and the possible 513
interaction mechanisms of nanomaterials with it, it seems impossible to decide on a 514
representative set of SPMs for standardisation on one hand, while on the other hand a 515
restricted number of SPMs could lead to disproportional uncertainty in the estimation of 516
(hetero)attachment efficiencies (see section 3.4). Furthermore, methods are not yet 517
progressed to develop a fully validated TG for heteroagglomeration testing. 518
Many studies report measurements of different endpoints reflecting 519
heteroagglomeration behaviour (e.g. agglomeration rate, sedimentation, attachment 520
efficiency) with diverse nanomaterials under various conditions (e.g. Praetorius et al 2014a, 521
Labille et al 2015, Velzeboer et al. 2014, Huynh et al 2012, Quik et al. 2014, Geitner 2017, 522
Barton et al. 2014). 523
TG 318 is in principle fit for purpose to also investigate heteroagglomeration and 524
roughly estimate the attachment efficiency (αhetero values). An important question of interest 525
is: What is the time frame (seconds-hours, days-weeks, months or more) we need to 526
consider until the majority of free nanomaterials has turned into SPM-attached 527
nanomaterials and therewith their transport regime (SPM attached nanomaterials are 528
transported like SPM) or bioavailability might be changed? In most cases an orders-of-529
magnitude based category of αhetero (e.g. “low”, “medium” and “high”) will be sufficient to 530
address this question. αhetero can be used as an indicator for the expected half-life (t1/2) of 531
free nanomaterials under certain conditions (e.g. SPM concentrations). An example for 532
CeO2 is shown in table 2 (Walch et al. 2019). In multimedia fate modelling a similar regime 533
of sensitivity to αhetero for predicted environment concentrations is observed (Meesters et 534
al. 2019). Thus, based on the available scientific knowledge and methods, guidance for 535
heteroagglomeration testing and presentation of data can be provided. Necessary 536
considerations and modifications of the test setup include the following issues presented 537
below. 538
539

│ 21
Table 2: Relationship of attachment efficiency (αhetero) and expected half-life (t1/2) of free 540 nanomaterials (5ppb CeO2, d = 25nm) in presence of 1-150ppm SPM (Walch et al. 541 2019). 542
heteroagglomeration
attachment efficiency
expected free ENP (5 ppb CeO2, d =25 nm) half-life range for
150 ppm – 1 ppm SPM (dn =1.5 µm, ρ =1.5 g/cm³)
αhetero ≈ 0.1 - 1 t1/2 ≈ seconds – 1 day
αhetero ≈ 0.01 t1/2 ≈ hours – days or (few) week(s)
αhetero ≈ 0.001 t1/2 ≈ day(s) – month(s)
αhetero ≈ 0.0001 t1/2 ≈ week(s) – (few) year(s)
543
The hydrochemical background conditions suggested in TG 318 with regards to 544
electrolyte compositions and concentrations can be equally applied to heteroagglomeration, 545
as the mechanistic principles are the same. It is however suggested to use the “alternative 546
medium” as indicated in TG 318 including SO42- to cover the effects of divalent anions on 547
agglomeration, especially if one of the components (SPM or nanomaterials) is expected to 548
display a positive surface charge. 549
Obviously, the introduction of a heteroagglomeration partner into the test system 550
is required. Hence, selecting suitable SPM analogues is the first crucial step. Such 551
analogues need to be stable (for the test duration), reproducible (among test runs) 552
monodisperse and well characterised in terms of composition, size (size distribution), shape 553
and density (to allow a good approximation of the number-based SPM concentration 554
needed for estimation of αhetero, see below). The options may range from very simple 555
mineral analogues (e.g. quartz particles) up to the use of well-characterised natural samples 556
(e.g. river waters or sewage sludge) and the choice of a relevant SPM type depends on the 557
aim of the study. 558
For a general comparative assessment of nanomaterials with regards to their 559
heteroagglomeration behaviour in freshwaters, a simple mineral analogue would be too 560
simplistic, whereas natural water samples do not allow for generalisations. Therefore, in an 561
EU project (NanoFASE) researchers are on the way to create a “model SPM” (complex 562
floc-like SPM analogues that represent process-relevant characteristics of natural SPM) 563
and a standard procedure for its production. These SPM flocs are composed of naturally 564
occurring minerals, selected based on a trade-off between representing the dominant 565
mineral mass fractions and covering a broad range of physicochemical surface properties 566
(e.g. surface charge) in realistic mixing ratios, which are typically encountered in natural 567
freshwater SPM. The mix includes quartz, illite, hematite and organic macromolecules 568
associated with microbial activity (Walch et al. in preparation). This could be one “standard 569
SPM” to be used in the test, with regards to the requirements for suitable SPM analogues 570
mentioned above. 571
In order to assess the fraction of “free”, not heteroagglomerated nanomaterials 572
after a certain or several (necessary to estimate alpha values) specified interaction time(s), 573
a separation step needs to be introduced. Separation should be fast and non-intrusive, to 574
allow removal of the SPM-attached nanomaterials from suspension while minimising 575
artefacts on the “free” nanomaterial fraction. That can be achieved by centrifugation at each 576
time interval. If the analytical detection limits allow, dilution before centrifugation helps to 577
avoid non-attached nanomaterials being removed via “screening” by the SPM during 578
centrifugation. Gravitational separability of nanomaterials and SPM hence becomes a 579
prerequisite, meaning that the size and/or density of the SPM needs to exceed that of the 580

22 │
tested nanomaterials, to an extent at which (at a selected centrifugation speed and time) the 581
SPM will be removed from suspension, while free nanomaterials will not. This can be 582
ensured by employing centrifugation cut-off calculations and verified by preliminary 583
testing. If significant sedimentation of the SPM over the test duration is likely, agitation by 584
shaking or stirring during the reaction time might be necessary. However, it cannot be ruled 585
out that shaking and stirring affects the apparent rates of heteroagglomeration. Stirring 586
should be effected in a controlled way to allow at least an approximate calculation of shear 587
forces in the system (shear rate G), for collision frequency calculations (Equations 1 588
below). Principles of stirred batch reactor design (Zlokarnik 2001) can be applied. Changes 589
in shear force from ~40-180s-1 only had minor impact on the size of mentioned model SPM 590
analogue flocs (results from laboratory pre-tests). The shear force necessary to avoid 591
sedimentation, being the dominant collision mode, depends on the diameters of the 592
nanomaterials and SPM employed and can be calculated using Equations 1 (below). 593
The selection of the nanomaterial mass concentration needs to be based on the 594
analytical limits in the matrix (as a rule of thumb, the quantification of remaining “free” 595
nanomaterials should be possible down to ~10 % of the initially added nanomaterials). One 596
can either quantify the elemental mass concentration or the particle number concentration 597
in the supernatant by ICP-MS (after digestion) or single particle ICP-MS, respectively. 598
Next to analytical limitations, there are process-determined limitations in 599
selecting ENP and SPM concentrations to optimise the system for selective 600
heteroagglomeration testing. Both, homo- and heteroagglomeration kinetics are driven by 601
the particle number concentration in the system (for heteroagglomeration more precisely 602
the number ratio of nanomaterials and SPM (Labille et al. 2015)), as well as the collision 603
rate constant, which depends on the nanomaterial and SPM size and density and the G in 604
the system (see equations 1 in chapter 3.4). Shear forces are not part of the original TG 318, 605
as particles in the nm-size range are not affected by shear forces and diffusion is the 606
dominant transport mechanism (Elimelech 1995), meaning that nanomaterial 607
homoagglomeration is independent of G. In the µm-size range typical for SPM flocs, 608
however, shear forces start playing a role. Since heteroagglomeration is the process of 609
interest, the selection of the nanomaterial/SPM number concentrations and shear forces 610
needs to ensure that potentially simultaneously occurring homoagglomeration2 remains 611
negligible (in case of unfavourable hydrochemical conditions for homoagglomeration or 612
very low expected αhomo) or is at least significantly dominated by heteroagglomeration (in 613
case of homoagglomeration not being negligible). Such an optimisation of a stirred test 614
system for heteroagglomeration can be based on model calculations (see equations 1 in 615
chapter 3.4) depicting the interplay between SPM and nanomaterial sizes and densities, 616
their number concentrations and applied shear forces (figure 9). Knowing (or 617
approximating) the size3 and density of both nanomaterial and SPM, the mass-618
corresponding number concentrations can be calculated assuming (if not known) spherical 619
shape for both. Taking the necessary minimum nanomaterial number concentration 620
determined by the analytical limitations, modifying the SPM number concentration and the 621
G-value at “worst case” conditions, i.e. assigning the highest attachment efficiency value 622
of unity for both, αhomo and αhetero (where each collision results in attachment), allows 623
defining suitable conditions. An example is shown in figure 9, where homoagglomeration 624
2 Even if homoagglomeration takes place, homoagglomerates may be too small to be removed from
suspension by centrifugation. 3 Note that e.g. light-scattering-based size measurements are biased towards larger sizes and
applying such particle diameters may lead to a significant underestimation of the particle number.

│ 23
of 5 ppb 30 nm CeO2 is certainly dominated by heteroagglomeration when 45 ppm SPM 625
(d = 6 µm, ρ = 1.5g/cm³) is used at stirring which effected a G = 100s-1. Additionally, the 626
model gives a first indication of the necessary temporal resolution. 627
628
629
630
In order to support the model calculation and the assumption of negligible loss of 631
nanomaterials other than by heteroagglomeration, an additional control test should be 632
conducted. This is done using the same concentration of nanomaterials in the same 633
background hydrochemistry (pH, electrolytes, NOM) but without any SPM. Sampling and 634
sample treatment should be performed in the same way as for the heteroagglomeration test 635
to measure free nanomaterial. Digesting the remaining samples (after centrifugation and 636
sampling supernatant aliquots for free nanomaterial quantification) can serve to close the 637
mass balance and account for losses to the vessels or tubes. 638
The test duration window needs to capture the nanomaterial removal over time, 639
which depends on the expected αhetero value, the nanomaterial and SPM number 640
concentrations and collision frequency (equations 1 in chapter 3.4). Hence, the selected 641
particle number concentrations, test-duration and the decision if agitation is necessary or 642
not, can be optimised. Model calculations may also serve to get an idea about the relevant 643
reaction-time window to be investigated. The more complex and heterogeneous the chosen 644
SPM, the more likely it seems that heteroagglomeration is a very fast process. Thus, it is 645
recommended to aim for a high time-resolution of the initial agglomeration phase (e.g. 646
Figure 9. Model calculations employing equations 1 (see below) to find suitable SPM
concentrations at which heteroagglomeration is dominating over homoagglomeration in
case of both ( αhomo and αhetero being unity). CeO2 has been chosen as example for low
analytical limits (ICP-MS), allowing experiments at 5 ppb (10% remaining would still be
> 5 × limit of quantification). Number concentrations were converted from mass
concentrations assuming spherical shape for both SPM and nanomaterial and the given
diameters and densities (CeO2: 7.22 g/cm³). In both, homo- (red line), and
heteroagglomeration cases (black lines) the nanomaterial concentrations were 5 ppb.
With increasing SPM concentrations in the heteroagglomeration case, the nanomaterial-
SPM number ratio changes and at 45 ppm SPM the decrease of “free” nanomaterials due
to heteroagglomeration will clearly dominate over homoagglomeration, whereas at 15
ppm SPM homoagglomeration might have a similar share (unless αhomo << αhetero).
0
10
20
30
40
50
60
70
80
90
100
0 10 20 30 40 50 60
"fre
e"
part
icle
s [
%]
time [min]
5 ppb ENP homo_α1
45 ppm SPM hetero_α1
25 ppm SPM hetero_α1
15 ppm SPM hetero_α1
SPM d = 6 µm (ρ = 1.5 g/cm³)CeO2 d = 30 nm
G =100/s

24 │
every few minutes during the first 30 minutes of the test). Intervals can be steadily increased 647
up to e.g. 6 hours and a final “stable” nanomaterial fraction can be determined after e.g. 24 648
hours. 649
3.4. Data evaluation and derivation of attachment efficiency 650
Attachment efficiencies, beside the dissolution rate constant, are considered an 651
important parameter for exposure assessment of nanomaterials. During the last years 652
scientists developed fate models for nanomaterials that use attachment efficiencies as input 653
parameters to predict nanomaterial concentrations in environmental compartments (e.g. 654
SimpleBox4Nano [Meesters et al. 2014], models provided by EU Horizon Project 655
NanoFASE [available at: http://nanofase.eu/show/fate-and-exposure-modelling-of-656
nanomaterials-the-nanofase-model-catalogue_1963/#]). The models might be able to 657
estimate more reliable and relevant predicted environmental concentrations (PECs) and 658
will contribute to nanomaterials risk assessment. 659
Based on Smoluchowski’s agglomeration theory (Elimelech 1995), the 660
heteroagglomeration attachment efficiency (depicted as αhetero) can be defined as the 661
fraction of nanomaterial-SPM collisions resulting in nanomaterial attachment to SPM. 662
αhetero can take values from 0 to 1 to modulate the collision rate constant between 663
nanomaterials and SPM reflecting their physicochemical surface affinity for each other 664
(under the respective hydrochemical conditions). Assuming irreversible attachment, both 665
can be calculated according to equation 1. With a constant number of SPM particles, 666
heteroagglomeration turns out to be a pseudo first-order reaction (nSPM can be included into 667
khet, further on denounced as khet*) (Praetorius et al. 2012). The collision rate constant (kcoll) 668
combines the three modes of transport of nanomaterials and SPM towards each other 669
(diffusion, differential sedimentation and advection), assuming spherical ENP/SPM shape 670
and rectilinear collisions (Praetorius et al. 2012). Transport by advection is incorporated 671
employing the shear rate or the velocity gradient (G) introduced by Camp and Stein (1943) 672
for stirred vessels. It is defined as the square root of the energy (e.g. added by stirring) 673
dissipated by turbulence per unit time, accounting for the volume and viscosity of the 674
considered fluid. The sensitivity of the system to changes in shear is relatively low 675
compared to other parameters. To avoid sedimentation, we suggest a value of G around 40-676
100 s-1 for a stirred batch system. Shear rates in rivers are typically > 10 s-1 (Arvidsson et 677
al. 2011). 678
679
Equations 1: Rate of “free” ENPs removal from suspension due to heteroagglomeration 680
over time (based on Smoluchowski; Praetorius et al. 2012) 681
d𝑛ENP
d𝑡= − 𝑘het 𝑛ENP 𝑛SPM
khet: heteroagglomeration rate constant [m³/s]
nENP: number concentration of nanomaterials [1/m³]
nSPM: number concentration of SPM [1/m³]
𝑘het = 𝛼het 𝑘coll
αhet: attachment efficiency between nanomaterials & SPM
kcoll: collision rate constant between nanomaterials & SPM [m³/s]
Equations 2: Calculation of collision frequencies due to diffusion (perikinetic), advection 682
(orthokinetic) and differential sedimentation (DS) assuming spherical particles, laminar 683
flow and straight streamlines (rectilinear collisions) 684

│ 25
perikinetic collisions 𝑘collperikin
=2k𝑇
3µ
(𝑟SPM + 𝑟ENP)²
𝑟SPM 𝑟ENP
orthokinetic collisions
𝑘collorthokin=
4
3𝐺(𝑟SPM + 𝑟ENP)³
with 𝐺 = √𝜖
𝜈 = √
𝑃
µ𝑉
collisions due to differential
sedimentation 𝑘collDS
= π(𝑟SPM + 𝑟ENP)2|𝜐SPM − 𝜐ENP|
with 𝜐SPM; ENP =2
9
𝜌SPM; ENP−𝜌L
μg 𝑟SPM; ENP
2
summed-up to total collision frequency:
𝑘coll =2k𝑇
3µ (𝑟SPM + 𝑟ENP)²
𝑟SPM 𝑟ENP+
4
3𝐺(𝑟SPM + 𝑟ENP)3 + π(𝑟SPM + 𝑟ENP)2|𝜐SPM − 𝜐ENP|
k: Boltzmann’s constant [m²kg/s²K]
T: absolute temperature [K]
µ: dynamic viscosity of dispersion medium [Ns/m²]
r: particle/aggregate radius [m]
G: shear rate (velocity gradient) [s-1]
g: gravity acceleration [m/s²]
ρS: density of particles [kg/m³]
ρL: density of liquid [kg/m³]
υSPM; ENP: settling velocity of SPM or nanomaterials [m/s]
ϵ: power input per unit mass [Nm/skg]
ν: kinematic viscosity (µ/ρL) [m²/s]
P: power dissipated by liquid turbulence [W]
V: volume of liquid [m³]
685
These equations may on the one hand be used to design the tests (SPM and 686
nanomaterial number concentrations, test duration and time resolution, see above paragraph 687
66) and on the other hand to approximate αhetero. With heteroagglomeration being a pseudo 688
first-order reaction (in the early agglomeration phase), the natural logarithm of the particle 689
concentration plotted over time will give a linear relation (see example in Figure 10). The 690
slope equals the pseudo first-order reaction rate (𝑘ℎ𝑒𝑡∗ = 𝛼ℎ𝑒𝑡 𝑛𝑆𝑃𝑀 𝑘𝑐𝑜𝑙𝑙) and αhetero can 691
be calculated. 692
As there will be many collisions between nanomaterials and SPM, only 693
nanomaterials with very low attachment efficiencies are likely to remain “free”. Many 694
results (e.g. Praetorius et al. 2012) have shown α values (attachment efficiencies) that result 695
in almost immediate nanomaterial-SPM associations. The exception is, if the SPM number 696
concentration is very low. In the latter case homoagglomeration will be dominant (see 697
figure 9). Assuming pseudo first-order kinetics, the half-life of free nanomaterials can be 698
calculated (𝑡1/2 = ln(2) /𝑘ℎ𝑒𝑡∗). Plotting the expected half-lives at given 699
SPM/nanomaterial concentrations and shear rate, over a range of alpha-values employing 700
three different SPM concentrations (Figure 11) shows that only starting from small alpha 701
<0.01-0.001 significant numbers of free nanomaterials will remain after just one day, 702
except for very low SPM concentrations (5 ppm and lower). 703

26 │
Figure 10. An example of pseudo first-order kinetics of heteroagglomeration
704
705
Figure 11. Half-life time of free nanomaterials based on heteroaaglomeration
model calculations with the example of 5 ppb CeO2 nanomaterial (30 nm) and
three different concentrations of SPM (5 ppm blue line, 45 ppm red line, 150
ppm150ppm grey line) are shown against αhetero. The number of SPM (nSPM) and
24.4
24.6
24.8
25.0
25.2
25.4
25.6
0 1000 2000 3000 4000
ln(n
EN
P)
time [s]
slope (khet) = - 2.44*10-4 s-1
kcoll = 7.31*10-16 s-1
nSPM = 1.80*1012
24.4
24.6
24.8
25.0
25.2
25.4
25.6
0 1000 2000 3000 4000
ln(n
EN
P)
time [s]
slope (khet) = - 2.44*10-4 s-1
kcoll = 7.31*10-16 s-1
nSPM = 1.80*1012
0.001
0.01
0.1
1
10
100
1000
10000
100000
0.000001 0.00001 0.0001 0.001 0.01 0.1 1
free E
NP
t1
/2[d
]
αhetero
5 ppm
45 ppm
150 ppm
SPM: d = 6 µm (ρ 1.5 g/cm³)5 ppb CeO2, d = 30 nm (ρ 7.13 g/cm³)
G = 100 s-1

│ 27
kcoll were calculated with the given parameters assuming spherical shape. For half-
lives longer than one day, αhetero needs to be smaller than 0.1-0.001.
706
Based on the considerations above, the test duration of 6 hours defined in TG 318 707
will likely also work for heteroagglomeration. For conditions where heteroagglomeration 708
is the dominant process, transport-relevant αhetero values of 0.01 and lower are only to be 709
expected if there is a significant fraction e.g. 10-20 % of nanomaterials remaining after 3 710
(conservative) to 6 hours. With further experimental data providing proof of principle, this 711
relationship between the order of magnitude of αhetero and the test duration can be further 712
refined. 713
A suggestion for a first tier assessment could be a two-point measurement at t0 714
and e.g. t = 2 h, to assess if there is a fraction of >10% of the nanomaterials left (as 715
compared to t04). If that is the case, there is a chance that αhetero is < 0.01-0.001 and a kinetic 716
study should be conducted. Based on such an approach a comparison of different 717
nanomaterials tested under the same conditions, analogously to the homoagglomeration 718
test (TG 318), could be established e.g. less than 10% left after 2 h (= fast 719
heteroagglomeration: α >0.1 and t1/2 < 1d expected), more than 10% left after 2 h 720
(intermediate heteroagglomeration: kinetic study and alpha determination). A next useful 721
step could be a determination of a “final” stable fraction (e.g. after 24 h). However, these 722
relations are strongly depended on the chosen particle concentrations and sizes. To 723
establish generall thresholds, more experiments with prespecified concentration ranges are 724
necessary. Studies found that removal of nanomaterials can reach a plateau (Quik et al. 725
2012 and 2014), which is likely a sub-fraction of the added nanomaterials that either had 726
different intrinsic surface properties or was permanently stabilised by the testing-matrix 727
(e.g. NOM). This would be the very stable fraction that is unlikely to undergo 728
heteroagglomeration in the long run and shall to be considered “free” nanomaterials when 729
it comes to transport regimes. 730
731
4 A comparison to t0 might be substituted by a comparison to a “homoagglomeration” control
(containing the same amount of nanomaterials with the same background hydrochemistry and DOM
concentration, but without SPM). However, using the t0-heteroagglomeration concentration as
reference for comparison ensures that, at both time points, the same fraction of free nanomaterials
was removed by “screening-effects” (SPM will physically catch and remove some nanomaterials
from dispersion during centrifugation). This helps to avoid a misinterpretation of a screening-
induced removal of nanomaterials from suspension as a heteroagglomeration-induced removal.
However, if heteroagglomeration is very fast, a homoagglomeration control might provide a more
reliable initial concentration (but only if the screening effect can be considered negligible, e.g. when
very low SPM concentrations are used).

28 │
4 Use of data generated on dissolution testing and dispersion stability for 732
further testing and assessment strategies 733
Both dispersion stability and dissolution (rate) are considered to be endpoints of 734
major importance for describing environmental behaviour and fate of nanomaterials. Thus, 735
for fate assessment as well as for exposure assessment both endpoints need to be taken into 736
account, and they will also be key information for ecotoxicity testing. 737
While TG 318 for dispersion stability has been published (OECD, 2017), 738
currently no OECD TG on solubility and dissolution rate of nanomaterials is available. 739
However, existing guidance documents like the GD 29 (OECD 2001) may provide a basic 740
orientation (see Chapter 2). Other TG and GDs as well as ongoing WNT projects are also 741
dealing with areas of dissolution (see Chapter 2 and Chapter 6). 742
There is not just one single optimal strategy on how to determine solubility, 743
dissolution, and dispersion stability. The starting nanomaterial concentrations, the media 744
composition, and timeframe that is relevant to use will always depend on the purpose and 745
objective of testing (see Section 4.1). Likewise, the testing strategy employed depends on 746
whether the data is needed to inform consideration of what further ecotoxicity testing is 747
needed, as input data for modelling of environmental fate, or as basic data on environmental 748
behaviour (see Section 4.2). 749
Validity and correct interpretation of dispersion stability, and dissolution rate or 750
solubility measurements are interdependent. For instance, the measurement of dissolution 751
in a suspension where agglomeration and sedimentation has occurred will underestimate 752
dissolution (as agglomerated/precipitated material will have less surface available for 753
dissolution). Measurement of dispersion stability based on remaining particulate fraction 754
where dissolution has occurred will underestimate dispersion stability as any nanomaterial 755
missing through dissolution will be interpreted as precipitated. Further situations where 756
such caution must be shown when interpreting the data and where both types of data must 757
be viewed in concert are highlighted with some outline application examples in Section 758
4.3. 759
4.1. Purpose 760
Dissolution (rate) and dispersion stability are relevant triggers needed for the 761
safety assessment of nanomaterials. Regulatory information requirements for solubility, 762
dissolution rate and dispersion stability of nanomaterials exist in some chemical legislation 763
such as REACH (EU 2018). These parameters are also relevant as triggers for further 764
assessment strategies and decisions. Giving the current worldwide development in 765
chemicals regulations towards specific provisions for nanomaterials (e.g. US EPA, 2016), 766
it is anticipated that other chemicals legislations meet the same challenges. 767
The understanding of environmental fate and behaviour of nanomaterials is one 768
of the key aspects for environmental exposure assessment. Furthermore, it supports the 769
knowledge about uptake by, interaction with, and effects on environmental organisms. 770
Therefore, dissolution, (hetero-) agglomeration and sedimentation are important drivers for 771
environmental fate, behaviour and effects of nanomaterials. 772

│ 29
Furthermore, given the numerous manufactured nanomaterials already on the 773
market and many more expected in future, the effort for the individual investigation of 774
hazard and risk would be enormous and virtually impossible. To overcome this challenge, 775
grouping and read-across approaches of nanomaterials has been identified as one critical 776
issue by OECD (OECD 2016). Grouping and read-across approaches are already 777
established for chemical substances to meet regulatory data requirements by deviation from 778
the requirements of performing standard test for years (OECD 2007, 2014c). The aim of 779
these approaches is to predict the physico-chemical, toxicological, and fate-related 780
properties of chemical substances based on structural similarities. If sufficient evidence for 781
similarity is available between two chemical forms, then it should be possible to transfer 782
available data on the fate or hazard of one chemical substance to another one. These 783
approaches are intended to reduce the amount of testing necessary to determine the 784
behaviour and effects of all individual members of a group. 785
Grouping and read across based on molecular structural similarity alone is not 786
sufficient for any chemical. This is of special importance for nanomaterials, as nanoforms 787
of the same chemical composition but deviating in physico-chemical parameters can show 788
differences in effects and behaviour. To allow an adequate assessment of nanomaterials 789
using grouping and read-across further parameters are necessary to justify such an 790
approach. In that context, beside chemical composition, parameters like morphology, 791
surface properties, and shape as well as reactivity, and fate descriptors like dissolution rate 792
or dispersion stability in relevant media are discussed for consideration (e.g. ECHA 793
Guidance R6.1 (ECHA 2017)). 794
TG 318 for dispersion stability and the available methods for solubility and 795
dissolution rate can address the respective endpoints and might be used to compare 796
similarities or differences of nanomaterials regarding these endpoints at given conditions 797
and thus support the development of grouping and analogue approaches for nanomaterials 798
as part of integrated testing and assessment approaches (IATAs). 799
For further (hazard) testing knowledge on dispersion stability and dissolution 800
behaviour can inform on the test set-up and necessary measurements for exposure 801
characterisation during the testing. Furthermore, knowledge on dispersion stability and 802
dissolution behaviour in a test system can facilitate better interpretation of test results (e.g. 803
whether effects seen can be attributed to nanomaterials or free ions only). 804
4.2. Testing strategy 805
Based on the purpose of testing, information from solubility, dissolution rate and 806
dispersion stability testing can inform a further testing strategy. The suggested approach to 807
do so is outlined in Figure 12. The approach starts with a screening batch test on dissolution 808
followed by a dynamic dissolution test if needed. The approach furthermore includes the 809
testing of dispersion stability for nanomaterials that do not fully dissolve within a relevant 810
time scale. This approach also provides further information to guide on the effort needed 811
for appropriate analytics in further testing. 812
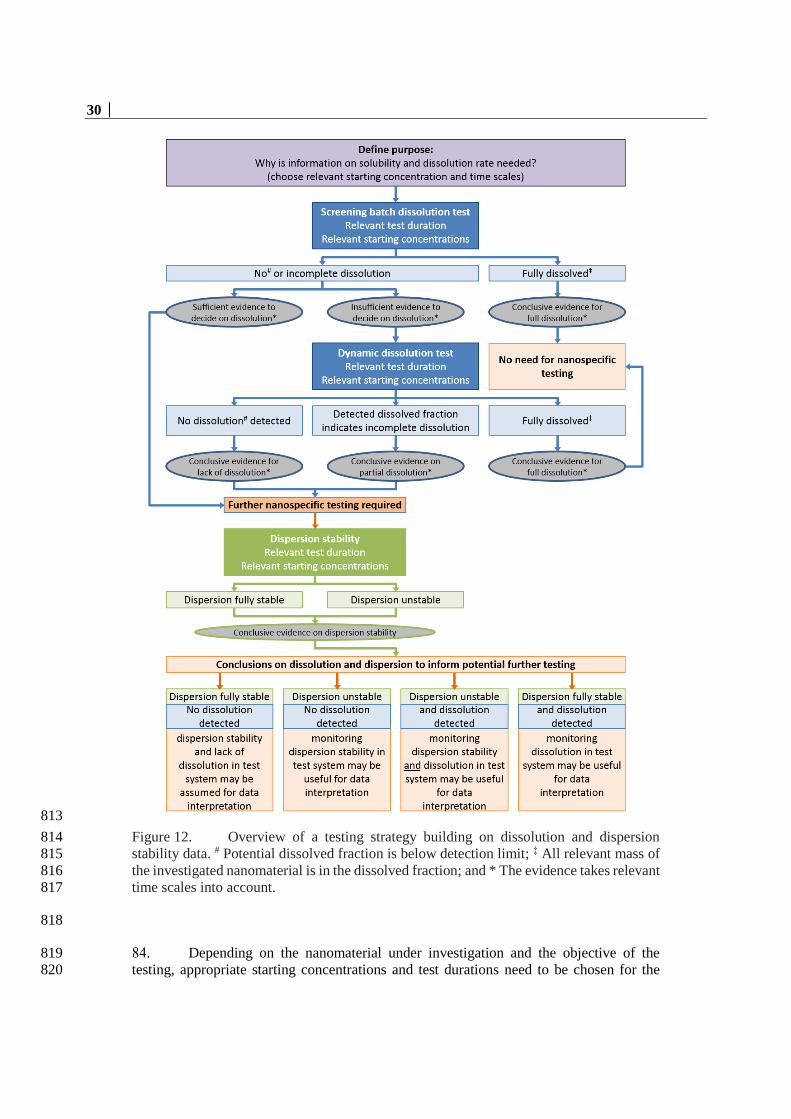
30 │
813
Figure 12. Overview of a testing strategy building on dissolution and dispersion 814
stability data. # Potential dissolved fraction is below detection limit; ‡ All relevant mass of 815
the investigated nanomaterial is in the dissolved fraction; and * The evidence takes relevant 816
time scales into account. 817
818
Depending on the nanomaterial under investigation and the objective of the 819
testing, appropriate starting concentrations and test durations need to be chosen for the 820

│ 31
initial screening dissolution batch test. When addressing triggers for safety assessment and 821
decision making for further testing, there might be the need to test concentrations which 822
are beyond environmental realism. Therefore, it is advisable to test the nanomaterials with 823
test conditions of TG 318 and the upcoming TG for dissolution, respectively, to gain 824
comparable and reliable data. Furthermore, it might be challenging to analytically verify 825
test concentrations under (mimicked) realistic environmental conditions. 826
In case the batch test gives conclusive evidence for full dissolution (all relevant 827
mass in dissolved fraction) of the investigated nanomaterial in a relevant time scale 828
(relevant refers to the actual question for which the test strategy is set up), further 829
dissolution testing by dynamic methods might not be needed. In this case also refrainment 830
from nanospecific testing can be considered. For nanomaterials that show incomplete 831
dissolution or dissolution below detection limit, it should be decided if the information 832
from the batch test provides sufficient evidence to enable a decision on the dissolution for 833
the purpose defined. For example, information on dissolution based on the batch test could 834
provide sufficient supplementary information for a subsequent ecotoxicity test. In contrast, 835
information from batch test might be insufficient to e.g. inform exposure relevant testing 836
regimes in which dissolution against an infinitive sink is of interest. Based on the question 837
also the appropriateness of the analytic equipment (e.g. concerning sensitivity) should be 838
considered. 839
In case information from the batch test is sufficient to conclude on the dissolution 840
of the investigated nanomaterial one could directly proceed with further nanospecific 841
testing. If the information from the batch test is insufficient, testing of dissolution with a 842
dynamic method should be considered. For nanomaterials that do not fully dissolve by a 843
dynamic dissolution test within a relevant time scale, again further nanospecific testing is 844
needed. For further nanospecific testing a first suggested step is testing of dispersion 845
stability. 846
For testing dispersion stability, it is recommended to use OECD TG 318 as it is 847
described. Deviation from test conditions might be possible in order to inform higher tier 848
testing. In the latter case it is suggested to choose appropriate test duration and 849
concentration based on the objective. Information from dispersion stability testing can 850
provide an indication about the analytical needs (monitoring of dissolved fraction, 851
monitoring of dispersion stability) to be performed for or during potential further 852
nanospecific testing. 853
In addition, results from solubility, dissolution rate and dispersion stability testing 854
can provide information to facilitate the choice of appropriate test performance of potential 855
further testing (e.g. frequency of water renewal rate, (semi)static vs. flow-through test 856
conditions) to maintain stable conditions. 857
4.3. Points to consider when applying information on dispersion stability 858
and dissolution for potential further testing 859
The methods presented in this GD will provide relevant data on solubility, 860
dissolution and dispersion stability. Moreover, in principle these methods can also be 861
performed with test media (e.g. natural water, ecotoxicological test media) that differ from 862
the ones presented in the respective test guideline or recommended here. However, as these 863
endpoints are influenced by properties of the nanomaterial in question as well as 864

32 │
interactions between the nanomaterial and its surroundings, results between tests may differ 865
depending on nanomaterial modification(s) and the test media used. 866
Consequently, the repeatability, reliability, and robustness should be taken into 867
account as much as possible, when using alternative test conditions. In these cases, it is 868
prerequisite to characterise and report the test media conditions as detailed as possible to 869
enable data evaluation and interpretation of data (and consider simultaneous testing). This 870
will also enable retrospective analysis of studies compared with new data produced in the 871
future. 872
While information from these methods might be directly applicable for exposure 873
estimation, conclusions for a further testing strategy on hazard should be considered 874
carefully. The relevance of the information as well as the decision how to consider data 875
generated on these endpoints for further testing will always depend on the individual 876
question and purpose of testing. 877
Solubility and dissolution rate inform about in which state (particulate, 878
completely or partly dissolved) a nanomaterial is present under respective conditions. 879
Regarding solubility and dissolution rate the main question is when it is possible to refrain 880
from nanospecific considerations in hazard assessment (i.e. when dissolution is considered 881
complete and fast enough compared to the duration of the corresponding (eco)toxicity test). 882
For an appropriate decision on the relevant hazard assessment, various aspects need to be 883
considered like the regarded nanomaterial (e.g. chemical composition), endpoint under 884
investigation (e.g. long term vs. acute testing), and test performance (e.g. media type, water 885
renewal frequency). In the evaluation of an aquatic hazard endpoint supporting information 886
on dissolution in the respective aquatic test media and with respective concentrations could 887
help to decide if it might be possible to refrain from nanospecific testing. That could be the 888
case if the nanomaterial under investigation fully dissolves in dissolution testing performed 889
for a time frame for which can be considered that the contribution to the eco-toxicological 890
impact of the particulate form is insignificant and do not very likely change the results of 891
the ecotoxicity testing. Furthermore, hazard test data for the solute needs to be available. 892
Regarding dissolution it should be considered that dissolution of some 893
nanomaterials (e.g. certain metals or metal oxides) is sensitive to light/darkness, with 894
generally a greater dissolution at visible light or UV-irradiated conditions as compared to 895
darkness. Therefore, the light/dark-conditions should be report were relevant (Hedberg et 896
al., 2012). 897
OECD TG 318 provides information on how stable a nanomaterial dispersion is 898
in aqueous media at given conditions. There is sufficient evidence that nanomaterials tend 899
to agglomerate and settle out of the water phase during sufficient long periods and thus 900
sediment, sludge and soil are expected to be the main environmental target components 901
(Hartmann et al. 2014). Thus, if nanomaterials show low stability in the water phase, 902
inclusion of data relating to the sediment or soil compartment into environmental risk 903
assessment of nanomaterials may become relevant. 904
However, agglomeration and sedimentation should not be equated per se with 905
lack of exposure in water column. For hazard testing, existing data show that agglomeration 906
and sedimentation do not necessarily prevent availability to the organisms in aquatic test 907
systems. Due to the permanently agitated test system used for testing algae toxicity, test 908
organisms also can be affected by nanomaterials unstable in the test dispersion. In addition, 909
unstable dispersed nanomaterials can be taken up by pelagic organisms like daphnia (Botha 910
et al. 2016, Tan et al. 2016, Hund-Rinke et al. 2017). Unstable nanomaterials furthermore 911

│ 33
can be available to benthic deposit-feeders and filtering organisms (Tella et al. 2014, Kühr 912
et al. 2019). In case of ion releasing nanomaterials, released ions might get back into the 913
water phase, affecting test organisms while the particulate fraction remains deposited at the 914
bottom. Strictly speaking this may not be considered nanomaterial toxicity, but by 915
constantly replenishing the ion concentration in the water phase, the particulate fraction 916
strongly influences the outcomes of the test. Also under environmental conditions it is 917
conceivable, that deposited or heteroagglomerated nanomaterials are consumed from 918
biofilms, ground or plant surfaces or taken up via sediment or natural suspended matter, 919
respectively (Geitner et al. 2018, Perrier et al. 2018). The understanding of bioavailability 920
and uptake of the various nanomaterials by aquatic organisms is also still far from complete 921
and – besides dissolution and agglomeration – also depends on other aspects of the 922
nanomaterials like size, chemical composition, synthesis methods, or nature of coating of 923
the investigated nanomaterial (Lead et al. 2018). 924
When using data from dispersion stability and dissolution testing for exposure 925
assessment it has to be taken into account that not only a singular but also a continuous 926
entry into the environment is of relevance. This can lead to a situation that even if a 927
nanomaterial dissolves relatively fast a mixed exposure of particulate and dissolved forms 928
can take place. 929
For nanomaterials that release ions or dissolve over a sufficient long period of 930
time, it is important to monitor in-depth the dissolution in the test system to inform on the 931
amounts of particulate and dissolved forms being present. It might be also of importance 932
to know how the particulate form changed in surface or bulk composition or size 933
distribution. Changes in composition might be relevant for e.g. nanomaterials that consists 934
of various substances (e.g. core-shell nanomaterials) with different dissolution behaviour 935
or nanomaterials with surface modification and should be determined where relevant. 936
Knowledge on changes in size distribution would provide details on how size distribution 937
changes (e.g. loss of smallest particle, decrease of particle size across the distribution, 938
formation of new particles) and might be relevant to decide on further hazard and fate 939
testing strategies. 940
The joint consideration of both endpoints determined by the TG 318 and available 941
methods on dissolution is of expedient importance as both endpoints strongly influence 942
each other and interpreting one in absence of the other is difficult. The dispersion state of 943
a nanomaterial will affect its dissolution, while dissolution of the nanomaterial will alter 944
the outcome of dispersion stability testing for dissolving nanomaterials. 945
Dissolution leads to an increase of ion concentration that in consequence can lead 946
to either an increased or a decreased dispersion stability. Furthermore, readily dissolution 947
can lead to a loss of particles during TG 318 performance. Therefore, care should be taken 948
when analysing and interpreting of results from TG 318 to not mistake instable dispersion 949
with dissolved nanomaterials. In TG 318 it is described that dissolution needs to be 950
evaluated during testing for ion releasing nanomaterials. On the other hand, 951
agglomeration/sedimentation will lead to a decrease in available surface, which in 952
consequence will result in a decrease in dissolution. 953
Next to (hetero-)agglomeration, sedimentation and dissolution, also potential 954
nanomaterial transformations (e.g. sulphidation, oxidation/reduction reactions and coating 955
transformations) influence the fate of nanomaterials in the environment and thus should be 956
considered when evaluating the data. Currently, in a foreseen WNT project 3.16 a GD on 957
transformation of nanomaterials in aquatic environmental media will be developed to 958

34 │
provide advice on ways to determine abiotic transformations of nanomaterials in the 959
environment. 960

│ 35
5 Use of data on dispersion stability, solubility and dissolution rate in 961
exposure modelling 962
Both data from TG 318 and the currently available methods for determining 963
solubility and dissolution rate may support the derivation of appropriate input parameters 964
for exposure modelling of nanomaterials. As a starting point for environmental fate 965
modelling, basic data as collected using TG 318 and adapted test performance of GD 29 966
might be used as input for deriving screening level estimations of predicted environmental 967
concentrations (PECs), e.g. to compare potential exposure of various nanomaterials. This 968
basic data can be a ranking in stable or instable nanomaterial dispersion (Figure 5) 969
according to TG 318, which can be linked to the degree of agglomeration expected. 970
Choosing a low or high attachment efficiency that coincides with stable or instable 971
conditions can be based on the PEC sensitivity reported by Meesters et al. (2019). 972
Similarly, such basic data on the dissolution or transformation of nanomaterials (e.g. GD 973
29) can be used to choose a relevant order of magnitude of this rate constant based on the 974
PEC sensitivity reported by Meesters et al (2019). For refinement of such data, further 975
testing like using dynamic test designs to determine dissolution (rate) and/or alternative 976
media (e.g. in order to determine heteroagglomeration with TG 318) will help to improve 977
the PEC estimations in various environmental compartments. 978
5.1. Use of data on dissolution rate in exposure modelling 979
Data on dissolution of nanomaterials is essential in environmental exposure to 980
enable distinction between the dissolved and the particulate form of a chemical or 981
nanomaterial. This distinction is also made in current environmental fate models for 982
nanomaterials, where dissolution is a process by which nanomaterials are transformed from 983
the particulate form to the dissolved form (Meesters et al. 2019). As discussed in Chapter 984
2 dissolution data can be used to estimate the dissolution rate constant. This is an input 985
parameter in environmental fate models to calculate the predicted exposure concentration. 986
Assuming first order kinetics, the dissolution rate constant can be calculated from 987
experimental data as: 988
𝑘diss =𝑙𝑛(
[ENP0]−([M𝑛+]−[M0𝑛+])
[ENP0])
𝑡 989
where [ENP0] is the nanomaterial concentration in mg/L at the start of the experiment 990
(t = 0), [Mn+] is the dissolved ionic metal concentration in mg/L at time t, [M0n+] is the 991
dissolved ionic metal concentration in mg/L at the start of the experiment (t = 0), (kdiss) is 992
the dissolution rate constant, and t is time of measurement. The dissolved ion 993
concentration is operationally defined as the portion passing a filter of 3, 5 or 10 kDa 994
MWCO at a certain media composition. If the medium contains complexing agents as 995
NOM and the NOM-metal ion complex can penetrate the membrane, the measured 996
dissolved concentration is composed out of the free metal ions and the complexed metal 997
ions. In case multiple data points (i.e. concentration measurements) in time are available 998
for [Mn+], kdiss can be derived by fitting the relationship between [Mn+]t and time by 999
using the following equation: 1000
1001 [Mn+]𝑡= [M0
n+] − ENP0 + [ENP0] ∙ 𝑒𝑘diss∙𝑡

36 │
As kdiss is only derived from ions appearing in solution over time, it is essential 1002
that the measurement technique used enables a distinction of the ionic fraction from the 1003
other metal fractions. It should be considered to use the ion concentration in the untreated 1004
medium as [M0n+] to ensure that this value is not influenced by ENP0. Some caution is 1005
needed where rapid dissolution occurs at the beginning of the experiment, as this may result 1006
in artificially low kdiss when measurements do not capture this (e.g. when measurements are 1007
only available for 0, 24, and 48 hours). 1008

│ 37
6 Links to other relevant TGs and GDs 1009
Currently there are various WNT projects underway to develop nanospecific TGs 1010
and GDs. Solubility, dissolution (rate) and dispersion stability are important parameters 1011
that need to be considered in these activities as they influence the outcome of the respective 1012
methods (Prosafe, 2017). This chapter will give a short overview how these parameters are 1013
interlinked with the ongoing environmental relevant WNT projects for nanomaterials as 1014
well as existing methods for solubility and dissolution. 1015
6.1. WNT project 2.51: GD on Aquatic and Sediment Toxicological Testing 1016
of Nanomaterials 1017
Information on nanomaterial dissolution and dispersion stability should be used in 1018
addition to the guidance given in the GD on aquatic (and sediment) toxicity testing of 1019
nanomaterials (currently under development) in order to interpret the determined aquatic 1020
and sediment toxicity data. In the present GD (Chapter 4) a testing strategy is suggested for 1021
solubility, dissolution rate, and dispersion stability to inform about in which state 1022
(particulate, completely or partly dissolved) a nanomaterial is present under conditions of 1023
an ecotoxicity study and help to interpret test results regarding the contribution of dissolved 1024
or undissolved fraction to the toxicity. 1025
Information on dispersion stability helps to identify the main routes of exposure 1026
within the test system (e.g. via water phase in case of stable dispersion, via possible dietary 1027
exposure of unstable dispersion, via sediment). 1028
In addition, results from solubility, dissolution rate and dispersion stability testing 1029
can provide information to facilitate to decide on the analytic needs and the choice of 1030
appropriate test performance of potential further testing (e.g. frequency of water renewal 1031
rate, (semi)static vs. flow through test conditions). 1032
Data on heteroagglomeration obtained using this GD may also support 1033
interpretation of ecotoxicological data of standard test results. SPM of different forms are 1034
present in high enough concentrations in some standard tests and can affect the 1035
nanomaterial that organisms are exposed to. Attachment to fish feed, if it occurs, 1036
determines how fish are exposed to nanomaterials, via gills or via the gut (Handy et al., 1037
2018). Extracellular polymers e.g. algae exudates may occur in standard aquatic tests and 1038
heteroagglomeration of nanomaterials and such polymers affects the exposure and 1039
consequent toxicity of nanomaterials to the organisms (Yang et al., 2018). 1040
Even though tests in soil systems are not included in the GD on aquatic and 1041
sediment tests, the recommendations mentioned above also apply to soil organisms. Soil 1042
pore water is expected to be an important exposure pathway of nanomaterials to soil 1043
organisms. Heteroagglomeration and dissolution in soil pore water is therefore also 1044
determining the toxicity to soil organisms. Attachment to inorganic particles such as clays 1045
or iron oxides is likely in standard soils (Miglietta et al., 2015) and determines whether 1046
organisms are exposed to individual nanomaterials and/or to heteroagglomerated 1047
nanomaterials, which may affect toxicity (Gupta et al., 2017). 1048
To broaden the significance of data on dispersion stability or dissolution for 1049
interpretation of nanomaterial behaviour in ecotoxicity test media, the simulated 1050

38 │
environmental media used in TG 318 and for dissolution testing may be amended to 1051
determine the dispersion and dissolution behaviour directly in the relevant test media for 1052
ecotoxicity testing. 1053
Comparing information on dissolution (rate) and dispersion (stability) of different 1054
nanoforms of a substance prior to ecotoxicity testing of those nanoforms, can support the 1055
development of hypotheses on expected similar behaviour and thus may guide grouping 1056
and read across. 1057
6.2. WNT project 3.14: GD to support the use of TG312 (Leaching in soil 1058
columns) for nanomaterial safety testing. 1059
A GD on how to conduct column tests to determine transport of nanomaterials in 1060
porous media based on TG 312 (OECD, 2004) was being developed at the time of drafting 1061
and includes recommendations on how to calculate a global attachment efficiency (global) 1062
for a specific nanomaterial in a specific soil. This GD provides guidance on calculating the 1063
attachment efficiency for interaction between a specific nanomaterial and specific SPM 1064
(SPM). 1065
It has to be noted that these attachment efficiencies are not the same, even if SPM 1066
material is used that is relevant for the specific soil studied. global is a lumped parameter 1067
grouping many different processes that reduce transport (and thus increase global) in soils 1068
(Baalousha et al., 2016). One of these processes may be heteroagglomeration with native 1069
SPM in the pore water, the rate quantification of which may occur as described in this GD. 1070
6.3. WNT project 3.12: Assessing the Apparent Accumulation Potential of 1071
Nanomaterials during fish bioaccumulation studies 1072
As described earlier, dispersion stability and ion dissolution will affect what the 1073
organisms are exposed to, both in standard tests as in realistic environments. Interpretation 1074
of bioaccumulation testing therefore likewise needs information on dispersion stability, 1075
heteroagglomeration and dissolution of the nanomaterial in question as, for instance, 1076
proposed for fish bioaccumulation testing (Handy et al. 2018). 1077
A dissolution rate rather than solubility is needed for bioaccumulation testing 1078
given the kinetic nature of bioaccumulation. 1079
The information from dissolution, dispersion stability, and heteroagglomeration 1080
could also be used for decision making prior to testing, or bioaccumulation test media could 1081
be used in an adapted protocol of both endpoints in order to investigate dispersion and/or 1082
dissolution under experimental settings relevant for bioaccumulation tests. 1083
6.4. OECD TG 105: Dissolution in water 1084
TG 105 (OECD, 1995) describes a column elution method and a flask method to 1085
investigate solubility of compounds. 1086
During the column elution method of TG 105, the solubility of a solid chemical 1087
is determined while attached to an inert substrate in a column. The solubility equals the 1088

│ 39
plateau concentration of a chemical dissolved from the test material reached in the eluate 1089
of the column. 1090
The flow-through testing for dissolution rate described in this GD is similar to 1091
the column elution method of TG 105 in that sense that the simulated media in contact with 1092
the nanomaterials is continuously refreshed and the concentration of dissolved substances 1093
is measured continuously. However, it is not clear how nanomaterials could be attached to 1094
such a substrate. In this GD, the nanomaterials are therefore attached to an ultrafiltration 1095
membrane or contained in a compartment formed by ultrafiltration membranes that are 1096
continuously in contact with the medium. 1097
The data interpretation in this GD is fundamentally different from that in TG 105. 1098
TG 105 describes how the solubility of compounds can be obtained, whereas this GD 1099
describes how a dissolution rate can be obtained. 1100
The flask method in TG 105 resembles the static batch test method described in 1101
this GD. However, TG 105 prescribes that solution and solid material must be separated 1102
using centrifugation after 24 hours of equilibration after which the solubility is measured. 1103
This GD prescribes using ultrafiltration as a separation technique, because centrifugation 1104
does not guarantee separation of nanomaterials and dissolved substances. Moreover, this 1105
GD encourages dissolved concentrations to be measured at several time points allowing to 1106
fit a kinetic model and calculating the dissolution rate. 1107
6.5. OECD GD 29: Guidance document on transformation/dissolution of 1108
metals and metal 1109
As in this GD, GD 29 (OECD, 2001) describes a screening level and one full 1110
dissolution/transformation test. A high loading of a solid compound is equilibrated for 24 1111
hours in a test medium during the screening test followed by a single measurement. 1112
The dissolved fraction is determined in a 0.20 m filtrate using GD 29, differing 1113
from this GD where ultrafiltration is used for separation, because nanomaterials may pass 1114
a 0.20 m filter. Further, indications on adapted needs when considering nanomaterial 1115
testing can be found in chapter 2. 1116
In the full test described by GD 29, three different concentrations of a solid 1117
compound are equilibrated at times up to 28 days, where the test medium is refreshed every 1118
24 hours. Refreshing the medium would not be possible for nanomaterials in this way, 1119
because they are suspended in the medium and would be removed during refreshing. 1120
This GD recommends continuous refreshing, more in line with TG 105 and 1121
ISO TR 19057 (ISO 2017b). As in the screening test, ultrafiltration is recommended in this 1122
GD. 1123
6.6. OECD TG 106 Adsorption - Desorption Using a Batch Equilibrium 1124
Method 1125
TG 106 (OECD, 2000) describes a batch method where a substrate, usually a 1126
dried and homogenised soil, is equilibrated with a chemical dissolved in water for a 1127
determined time. The chemical then adsorbed and this process is quantified in the form of 1128
a partitioning coefficient (Kd). This GD does not pertain to dissolved chemicals but to 1129

40 │
nanomaterials that will not establish an equilibrium with any substrate (Praetorius et al., 1130
2014b). An attachment efficiency is deducted in this GD using a kinetic approach instead 1131
of a partitioning coefficient. 1132
Finally, SPM is recommended as a substrate in this GD, whereas a soil is usually 1133
used for TG 106. 1134
6.7. OECD WNT project 3.11. TG for nanomaterial removal in wastewater 1135
This TG development project aims to provide a standard method for 1136
characterising the interaction between nanomaterials and wastewater treatment sludge. 1137
This process is thus similar to heteroagglomeration tested in this GD, but the SPM in the 1138
case of WNT project 3.11 (OECD, 2018) is specific biomass sampled from a wastewater 1139
treatment plant. 1140
The approach in WNT project 3.11 prescribes mixing biomass with 1141
nanomaterials for one hour followed by gravitational settling. The test is done at different 1142
total nanomaterial concentrations and sorption isotherms are calculated based on the 1143
nanomaterial concentration measured in the supernatant after settling. This GD conversely 1144
recommends separating free from heteroagglomerated nanomaterials by means of 1145
accelerated sedimentation using centrifugation. 1146
The parameter reported from this GD in terms of heteroagglomeration is 1147
attachment efficiency which is a dimensionless parameter that is used in kinetic models, 1148
i.e. models that assume equilibrium does not last. In contrast sorption isotherm reports 1149
isothermal trends of partitioning coefficients and the underlying model of these parameters 1150
assume an continuously equilibrium or steady-state situation. Different parameter are thus 1151
determined. 1152

│ 41
7 References 1153
Arvidsson, R., Molander, S., Sandén, B.A.., Hassellöv, M. 2011. Challenges in Exposure 1154
Modeling of Nanoparticles in Aquatic Environments. Human and Ecological Risk 1155
Assessment. An International Journal, 17:1, 245-262. 1156
Baalousha, M., Cornelis, G., Kuhlbusch, T., Lynch, I., Nickel, C., Peijnenburg, W., van 1157
den Brink, N. 2016. Modeling Nanomaterial Fate and Uptake in 1 the Environment: 1158
Current Knowledge and Future Trends. Environmental Science: Nano. 3, 323-345. 1159
Barton, L.E., Therezien, M., Auffan, M., Bottero, J-Y., Wiesner, M.R. 2014. Theory and 1160
Methodology for Determining Nanoparticle Affinity for Heteroaggregation in 1161
Environmental Matrices Using Batch Measurements. Environmental Engineering 1162
Science 31 (7) 7. 1163
Baun, A., Sayre, P., Steinhäuser, K.G, Rose, J. 2017. Regulatory relevant and reliable 1164
methods and data for determining the environmental fate of manufactured 1165
nanomaterials. NanoImpact 8, 1–10. 1166
Botha, T.L., Boodhia, K., Wepener, V. 2016. Adsorption, uptake and distribution of gold 1167
nanoparticles in Daphnia magna following long term exposure. Aquatic Toxicity 1168
170, 194-111. 1169
Bove, P., Malvindi, M.A., Kote, S.S., Bertorelli, R., Summa, M., Sabella,S. 2017. 1170
Dissolution test for risk assessment of nanoparticles: a pilot study. Nanoscale 9, 1171
6315-26. 1172
Camp, T. R and Stein, P. C. 1943. Velocity Gradients and Internal Work in Fluid Motion. 1173
Journal of Boston Society of Civil Engineering 30, 219-237. 1174
Carlander, U., Midander, K., Hedberg, Y.S., Johanson, G., Bottai, M., Karlsson, H.L., 1175
2019. Macrophage-assisted dissolution of gold nanoparticles. ACS Applied Bio 1176
Materials 2, 1006-1016. 1177
Cornelis, G., Kirby, J.K., Beak, D., Chittleborough, D., McLaughlin, M.J. 2010. A method 1178
for determination of retention of silver and cerium oxide manufactured 1179
nanoparticles in soils. Environmental Chemistry 7(3), 298-308. 1180
ECHA 2017. Guidance on information requirements and chemical safety assessment, 1181
Chapter R.6: QSAR and grouping of chemicals. Available at: 1182
http://echa.europa.eu/documents/10162/13632/information_requirements_r6_en.p1183
df 1184
Elimelech, M., Gregory, J., Jia, X., Williams, R.A. 1995. Particle Deposition and 1185
Aggregation – Measurement, Modelling and Simulation. Chapter 6 Modelling of 1186
aggregation processes. ISBN 978-0-7506-7024-1. 1187
EU, 2011. Commission Recommendation on the definition of nanomaterials. Available at: 1188
http://data.europa.eu/eli/reco/2011/696/oj 1189

42 │
EU, 2018. Commission Regulation (EU) 2018/1881 of 3 December 2018 amending 1190
Regulation (EC) No 1907/2006 of the European Parliament and of the Council on 1191
the Registration, Evaluation, Authorisation and Restriction of Chemicals (REACH) 1192
as regards Annexes I, III, VI, VII, VIII, IX, X, XI, and XII to address nanoforms of 1193
substances. O. J. L 308: 1-20. 1194
Franklin, N.M., Rogers, N.J., Apte, S.C., Batley, E., Gadd, G.E., Case, P.S. 2007. 1195
Comparative Toxicity of Nanoparticulate ZnO, Bulk ZnO, and ZnCl2 to a 1196
Freshwater Microalga (Pseudokirchneriella subcapitata): The Importance of 1197
Particle Solubility. Environmental Science and Technology 41, 8484-8490. 1198
Gao, X., Lowry, G. V. 2018. Progress towards standardized and validated characterizations 1199
for measuring physicochemical properties of manufactured nanomaterials relevant 1200
to nano health and safety risks. NanoImpact 9, January 2018, Pages 14-30. 1201
Geitner,N.K., O’Brian,N.J., Turner,A.A., Cummins,E.J., Wiesner, M.R. 2017. Measuring 1202
Nanoparticle Attachment Efficiency in Complex Systems. Environmental Science 1203
and Technology 51, 13288−13294. 1204
Geitner, N. K., Cooper, J. L., Avellan, A., Castellon, B. T., Perrotta, B. G., Bossa, N., 1205
Simonin, M., Anderson, S. M., Inoue, S., Hochella, M. F., Jr., Richardson, C. J., 1206
Bernhardt, E. S., Lowry, G. V., Ferguson, P. L., Matson, C. W., King, R. S., Unrine, 1207
J. M., Wiesner, M. R.,, Hsu-Kim, H. 2018 Size-Based Differential Transport, 1208
Uptake, and Mass Distribution of Ceria (CeO2) Nanoparticles in Wetland 1209
Mesocosms. Environmental Science and Technology 52, 9768-9776. 1210
Gupta, G.S., Senapati, V.A., Dhawan, A., Shanker, R. 2017. Heteroagglomeration of zinc 1211
oxide nanoparticles with clay mineral modulates the bioavailability and toxicity of 1212
nanoparticle in Tetrahymena pyriformis. Journal of Colloid Interface Science 495, 1213
9-18. 1214
Handy, R.D., Ahtiainen, J., Navas, J.M., Goss, G., Bleeker, E.A.J., von der Kammer, F. 1215
2018. Positional Paper – Proposal for a tiered dietary bioaccumulation testing 1216
strategy for engineered nanomaterials using fish. Environmental Science: Nano 5, 1217
2030-2046. 1218
Hartmann, N.B., Skjolding, L.M., Hansen, S.F., Kjoholt, J., Gottschalck, F., Baun, A. 2014. 1219
Environmental Fate and Behaviour of Nanomaterials: New Knowledge on 1220
Important Transformation Processes. Environmental Project No. 1594. 1221
Copenhagen, Denmark. The Danish Environmental Protection Agency. 1222
Hedberg, Y., Herting, G., Odnevall Wallinder, I. 2011. Risks of using membrane filtration 1223
for trace metal analysis and assessing the dissolved metal fraction of aqueous media 1224
- A study on zinc, copper and nickel. Environmental Pollution 159, 1144-1150. 1225
Hedberg, Y, and Odnevall Wallinder, I. 2012. Transformation/dissolution studies on the 1226
release of iron and chromium from particles in synthetic body fluids. Materials and 1227
Corrosion 63, 481-491. 1228
Hedberg, Y.S. Hedberg, J., Isaksson, S. Mei, N. Blomberg, E. Wold, S. Odnevall 1229
Wallinder, I. 2017a. Nanoparticles of WC-Co, WC, Co and Cu of relevance for 1230
traffic wear particles - Particle stability and reactivity in synthetic surface water and 1231
influence of humic matter, Environmental Pollution 224, 275–288. 1232

│ 43
Hedberg, J., Ekvall, M. T., Cedervall, T., Hansson, L.-A, Odnevall Wallinder, I. 2017b. 1233
Tungsten carbide nanoparticles in simulated surface water with natural organic 1234
matter: dissolution, agglomeration, sedimentation and interaction with Daphnia 1235
magna. Environmental Science: Nano 4, 886 – 894 1236
Hund-Rinke, K., Nickel, C., Kühnel, D. 2017. Considerations about the relationship of 1237
nanomaterial’s physical-chemical properties and aquatic toxicity for the purpose of 1238
grouping. Project financed by Environmental Research of the Federal Ministry for 1239
the Environment, Nature Conservation, Building and Nuclear Safety No. (FKZ) 1240
3714 67 417 0; Report No. (UBA-FB) 002572/ENG 1241
Huynh, K. A, McCaffery, J.M, Chen, K.L. 2012. Heteroaggregation of Multiwalled Carbon 1242
Nanotubes and Hematite Nanoparticles: Rates and Mechanisms. Environmental 1243
Science and Technology 46, 5912−5920. | 1244
ISO 2010. ISO 9277:10 Determination of the specific surface area of solids by gas 1245
adsorption — BET method 1246
ISO 2017a. ISO/TR 18401:2017 Nanotechnologies — Plain language explanation of 1247
selected terms from the ISO/IEC 80004 series. 1248
ISO 2017b. ISO/TR 19057 Nanotechnologies - Use and application of acellular in vitro 1249
tests and methodologies to assess nanomaterial biodurability. International 1250
Organisation for Standardisation. 1251
Jiang, J., Oberdörster, G., Biswas, P. 2009. Characterization of size, surface charge, and 1252
agglomeration state of nanoparticle dispersions for toxicological studies. Journal of 1253
Nanoparticle Research 11, 77–89. 1254
Jünemann D. and Dressman, J. 2012. Ananlytical methods for dissolution testing of 1255
nanosized drugs. Journal of Pharmacy and Pharmacology 64, 931-943. 1256
Kennedy, A.K., Hull, M.S., Bendar A.J., Goss J.D., Gunter, J.C., Bouldin, J.L., Vikesland, 1257
P.J., Steevens, J.A. 2010. Fractionating nanosilver: Importance for determining 1258
toxicity to aquatic test organisms. Environmental Science and Technology 44, 1259
9571-9577. 1260
Koltermann-Juelly, J., Keller, J.G., Vennemann, A., Werle, K., Müller, P., Ma-Hock, L., 1261
Landsiedel, R., Wiemann, M., Wohlleben, W. 2018. Abiotic dissolution rates of 24 1262
(nano)forms of 6 substances compared to macrophage-assisted dissolution and in 1263
vivo pulmonary clearance: Grouping by biodissolution and transformation. 1264
NanoImpact 12, 29-41. 1265
Kühr, S., Meisterjahn, B., Schröder, N., Knopf, B., Völker, D., Schwirn, K., Schlechtriem 1266
C. Testing the bioaccumulation of manufactured nanomaterials in the freshwater 1267
bivalve Corbicula fluminea using a new test method. Environmental Science 2019 1268
accepted. 1269
Labille, J., Harns, C., Bottero, J-Y., Brant, J. 2015. Heteroaggregation of Titanium Dioxide 1270
Nanoparticles with Natural Clay Colloids. Environmental Science and Technology. 1271
Lead, J. R., Batley, G. E., Alvarez, P. J. J., Croteau, M. N., Handy, R. D., McLaughlin, M. 1272
J., Judy, J. D., Schirmer, K. 2018. Nanomaterials in the Environment: Behavior, 1273
Fate, Bioavailability, and Effects-An Updated Review. Environ Toxicology 1274
Chemistry 37 (8), 2029-2063. 1275

44 │
Meesters, J. A. J., Koelmans, A.A., Quik, J. T. K., Hendriks, A. J., van der Meent, D. 2014. 1276
Multimedia Modeling of Engineered Nanoparticles with SimpleBox4nano: Model 1277
Definition and Evaluation. Environmental Science and Technology 48, 5726-5736. 1278
Meesters, J. A. J., Peijnenburg, W. J. G. M., Hendriks, A. J., van der Meent, D., Quik, J. T. 1279
K. 2019. A Model Sensitivity Analysis to Determine the Most Important 1280
Physicochemical Properties Driving Environmental Fate and Exposure of 1281
Engineered Nanoparticles. Environmental Science: Nano, 6, 2049-2060 1282
Miglietta, M.L., Rametta, G., Manzo, S., Salluzo, A., Rimauro, J., Di Franci, G. 2015. 1283
Methodological issues about techniques for the spiking of standard OECD soil with 1284
nanoparticles: evidence of different behaviours. Journal of Nanoparticle Research 1285
17(7), 312. 1286
Misra, S.K., Dybowska, A., Berhanu, D., Luoma, S N., Valsami-Jones, E. 2012. The 1287
complexity of nanoparticle dissolution and its importance in nanotoxicological 1288
studies. Science of the Total Environment 438, 225–232. 1289
Monikh, A.F., Praetorius A., Schmid A., Kozin P., Meisterjahn B., Makarova E., Hofmann 1290
T.,von der Kammer F. 2018. Scientific rationale for the development of an OECD 1291
test guideline on engineered nanomaterial stability. NanoImpact 11, 42-50. 1292
OECD, 1995. TG 105 Water solubility. OECD Test Guideline for the testing of 1293
chemicals. Organisation for Economic Co-operation and Development (OECD), 1294
Paris, France. Available at: 1295
http://www.oecd.org/env/ehs/testing/seriesontestingandassessmenttestingforenvir1296
onmentalfate.htm 1297
OECD 2000. TG 106. Adsorption - Desorption Using a Batch Equilibrium Method. 1298
Organisation for Economic Co-operation and Development (OECD), Paris, 1299
France. Available at: 1300
http://www.oecd.org/env/ehs/testing/seriesontestingandassessmenttestingforenvir1301
onmentalfate.htm 1302
OECD 2001. OECD Series on Testing and Assessment, No. 29. Guidance Document on 1303
Transformation/Dissolution of Metals and Metal Compounds in Aqueous Media. 1304
Organisation for Economic Co-operation and Development (OECD), Paris, 1305
France. Available at: 1306
http://www.oecd.org/env/ehs/testing/seriesontestingandassessmenttestingforenvir1307
onmentalfate.htm 1308
OECD 2004. OECD Guideline for the Testing of Chemicals 312: Leaching in Soil 1309
Columns. Organisation for Economic Co-operation and Development (OECD), 1310
Paris, France. OECD Guideline for the Testing of Chemicals 312: Leaching in Soil 1311
Columns. Organisation for Economic Co-operation and Development (OECD), 1312
Paris, France. Available at: http://dx.doi.org/10.1787/9789264070561-en. 1313
OECD 2014a. OECD Series on the Safety of Manufactured Nanomaterials, No. 40. 1314
Ecotoxicology and Environmental Fate of Manufactured Nanomaterials: Test 1315
Guidelines. Expert Meeting Report ENV/JM/MONO(2014)1, OECD, Paris. 1316
Available at: 1317
http://www.oecd.org/officialdocuments/publicdisplaydocumentpdf/?cote=ENV/J1318
M/MONO(2014)1&doclanguage=en 1319

│ 45
OECD 2014c. Guidance on Grouping of Chemicals, second edition. Series on Testing & 1320
Assessment No. 194 ENV/JM/MONO(2014)4, Organisation for Economic Co-1321
operation and Development (OECD), Paris, France. Available at 1322
http://www.oecd.org/chemicalsafety/testing/seriesontestingandassessmentpublicat1323
ionsbynumber.htm. 1324
OECD 2016. OECD Series on the Safety of Manufactured Nanomaterials, No. 76. 1325
Grouping and Read-Across for the Hazard Assessment of Manufactured 1326
Nanomaterials. Report from the Expert Meeting, OECD, Paris. Available at: 1327
http://www.oecd.org/chemicalsafety/nanosafety/publications-series-safety-1328
manufactured-nanomaterials.htm 1329
OECD 2017. OECD 2017. Test Guideline 318: Dispersion Stability of Nanomaterials in 1330
Simulated Environmental Media. OECD Test Guidelines for Testing Chemicals. 1331
Available at: http://www.oecd-ilibrary.org/environment/test-no-318-dispersion-1332
stability-of-nanomaterials-in-simulated-environmental-media_9789264284142-en 1333
OECD, 2018. Work plan for the test guidelines programme. Organisation for Economic 1334
Co-operation and Development (OECD), Paris, France. Available at: 1335
http://www.oecd.org/env/ehs/testing/ENV_JM_WRPR_2019__TGP-work-1336
plan.pdf 1337
Ottofuelling, S., Von Der Kammer, F., Hofmann, T. 2011. Commercial titanium dioxide 1338
nanoparticles in both natural and synthetic water: comprehensive multidimensional 1339
testing and prediction of aggregation behavior. Environmental Science and 1340
Technology 45, 10045–10052. 1341
Perrier, F., Baudrimont, M., Mornet, S., Mesmer-Dudons, Lacomme, S., Etcheverria, B., 1342
Simon, O., Feurtet-Mazel, A. 2018. Gold nanoparticle trophic transfer from natural 1343
biofilms to gazer fish. Gold Bulletin 51, 163-173. 1344
Pradhan, S. Hedberg, J. Rosenqvist, J. Jönsson, C. Wold, S. Blomberg, E. Odnevall 1345
Wallinder, I. 2017. Influence of humic acid and dihydroxy benzoic acid on the 1346
agglomeration, sedimentation and dissolution of copper, manganese, aluminum and 1347
silica nanoparticles. PlosOne, 13(2): e0192553. 1348
Praetprious, A., Scheringer, M., Hungerbuhler K. 2012. Development of Environmental 1349
Fate Models for Engineered Nanoparticles - A Case Study of TiO2 Nanoparticles 1350
in the Rhine River. Environmental Science and Technology 46, 6705−6713. 1351
Praetorius, A., Labille, J., Scheringer, M., Thill, A., Hungerbühler, K., Bottero J-Y. 2014a. 1352
Heteroaggregation of Titanium Dioxide Nanoparticles with Model Natural Colloids 1353
under Environmentally Relevant Conditions. Environmental. Science and 1354
Technolology 48 , 10690–10698. 1355
ProSafe 2017. Major International Conference: Final Report. Available at: 1356
https://www.rivm.nl/en/documenten/prosafe-d5-06-dr-major-international-1357
conference 1358
Quik J., T. K., Velzeboer, I., Wouterse, M., Koelmans, I.I., van de Meent, D. 2014. 1359
Heteroagglomeration and sedimentation rates for nanomaterials in natural waters. 1360
Water Research 48, 269-279. 1361
Quik, J. T. K., Stuart, M. C., Wouterse, M., Peijnenburg, W., Hendriks, A. J., van de Meent, 1362
D.2012. Natural colloids are the dominant factor in the sedimentation of nanoparticles. 1363
Environmental Toxicology and Chemistry 31 (5), 1019-1022. 1364

46 │
Ren, J., Li, Z., Wong, F.S. 2006. A new method for the prediction of pore size distribution 1365
and MWCO of ultrafiltration membranes. Journal of Membrane Science 279, 558-1366
569. 1367
Tan, L.Y., Huang, B., Xu, S., Wei, Z.B., Yang, L.Y., Miao, A.J. 2016. TiO2 Nanoparticle 1368
Uptake by the Water Flea Daphnia magna via Different Routes is Calcium-1369
Dependent. Environmental Science and Technology 50, 7799−7807. 1370
Tella, M., Auffan, M., Brousset, L., Issartel, J., Kieffer, I., Pailles, C., Morel, E., Santaella, 1371
C., Angeletti, B., Artells, E., Rose, J., Thiéry, A., Bottero, J.-Y. 2014. Transfer, 1372
Transformation, and Impacts of Ceria Nanomaterials in Aquatic Mesocosms 1373
Simulating a Pond Ecosystem. Environmental Science and Technology 48, 1374
9004−9013. 1375
Therezien, M., , Thill A., , Wiesner M.R. 2014. Importance of heterogeneous aggregation 1376
for NP fate in natural and engineered systems. Science of The Total 1377
Environment485–486, 309-318. 1378
US EPA 2016. Toxic Substances Control Act (TSCA), US EPA, US Gov. Available at: 1379
https://www.epa.gov/chemicals-under-tsca 1380
Velzeboer, I., Quik, J.T.K., van de Meent,D. Koelmans, I.I. 2014. Rapid settling of 1381
nanoparticles due to heteroaggregation with suspended sediment. Environmental 1382
Toxicology and Chemistry33 (8), 1766–1773. 1383
Walch, H., Praetorius, A., von der Kammer, F., Hofmann, T. 2019. A tale of an engineered 1384
nanoparticle´s affection for natural suspended particulate matter in freshwaters. 1385
Poster presentation at Environmental Nanotechnology Gordon Research 1386
Conference, Newry, USA; available at: 1387
https://ucris.univie.ac.at/portal/de/publications/a-tale-of-an-engineered-1388
nanoparticles-affection-for-natural-suspended-particulate-matter-in-1389
freshwaters(152dfb67-cc25-4d11-9469-540eb3d38a9e).html 1390
Walch, H., Praetorius, A., von der Kammer, F., Hofmann, T. A Simple Approach to a 1391
Complex (Suspended Particulate) Matter (SPM): Conceptual Framework for 1392
Reproducible Generation of Freshwater SPM Analogues for Fate Studies of 1393
Particulate Contaminants. In preparation 1394
Wasmuth C., Rudel H., During R.A., Klawonn T. 2016. Assessing the suitability of the 1395
OECD 29 guidance document to investigate the transformation and dissolution of 1396
silver nanoparticles in aqueous media. Chemosphere 144: 2018-2023. 1397
Yang, Y., Hou, J., Wang, P., Wang, C., Wang, X., You, G. 2018. Influence of extracellular 1398
polymeric substances on cell-NPs heteroagglomeration process and toxicity of 1399
cerium dioxide NPs to Microcystis aeruginosa. Environmental Pollution 242, 1400
1206-1216. 1401
Zlokarnik, M. 2001 Stirring – Theory and Practice. Ullmann's Encyclopedia of Industrial 1402
Chemistry, Wiley‐VCH, Weinheim, Germany 1403
1404

│ 47
Annex I Terminology, definitions and abbreviations 1405
One important issue is the harmonization of terminology and definitions in 1406
various TGs and GDs for environmental fate testing of nanomaterials. Currently the 1407
published OECD TG 318 (OECD 2017) for dispersion stability already contains agreed 1408
and adopted terminology and this should be taken into account when future TGs and GDs 1409
are developed, in case applicable. 1410
Agglomeration – Process of contact and adhesion whereby dispersed particles are held 1411
together by weak physical interactions ultimately leading to enhanced sedimentation by the 1412
formation of particles (agglomerates) of larger than colloidal size. In contrast to 1413
aggregation where particles held by strong bonds like sinter bridges, agglomeration is a 1414
reversible process. 1415
BET – Gas-adsorption method commonly using nitrogen (N2) gas to determine the specific 1416
surface area of powders according to the Brunauer–Emmett–Teller theory (ISO 2010). 1417
Concentrations – Concentrations of the particles and NOM in the samples are given in 1418
grams per litre (g/L), milligrams per litre (mg/L) and micrograms per litre (μg/L). In case 1419
of NOM it is given in mg/L of DOC. Concentrations of electrolytes (Ca(NO3)2 and 1420
NaHCO3) present in the samples are given in millimole per litre (mM/L). 1421
DOC – Dissolved Organic Carbon: the organic bound carbon in a water sample which 1422
passes a 0.45 µm filter, a part of dissolved organic matter (DOM). DOM in the form of 1423
humic substances have ~50 % DOC. 1424
Dispersibility – is the condition of particular material of being dispersible or a measure to 1425
which extent it is dispersible in a dispersing medium or continuous phase. Dispersion 1426
stability refers to the ability of a dispersion to resist change in its properties over time. 1427
Dissolution – Dissolution is understood as a process under which a substance solves. This 1428
means that dissolution is a process under which individual molecules/ions become fully 1429
surrounded by molecules from the solvent. 1430
Dissolution rate - is dissolution over time depending on e.g. available surface area of the 1431
material expressed as mg/L/h. 1432
Heteroagglomeration – Agglomeration of particles (here nanomaterials) with other 1433
particles (synthetic or natural). 1434
Homoagglomeration – Agglomeration of particles (here nanomaterials) with each other 1435
MWCO - pore diameter of ultrafiltration is expressed in terms of molecular weight cut-off 1436
(MWCO), i.e. the molecular weight of different molecules in the filtration process that are 1437
retained for 90 % by the membrane. 1438
NOM – Natural organic matter: the organic substances present in surface or ground water. 1439
NOM covers humic and non-humic fractions as e.g. polysaccharides. NOM is operationally 1440
divided into Dissolved Organic Matter (DOM) and Particulate Organic Matter (POM). 1441
DOM passes a 0.45 µm filter, POM is retained by the same filter. POM as defined herein 1442
should not be confused with purgeable organic carbon. 1443
Shear rate (G)- The shear rate or the velocity gradient (G) was introduced by Camp and 1444
Stein (1943) for stirred vessels. It is defined as the square root of the energy (e.g. added by 1445

48 │
stirring) dissipated by turbulence per unit time, accounting for the volume and viscosity of 1446
the considered fluid. 1447
Size – Size of the particles, aggregates or agglomerates is given in micrometres (μm) or 1448
nanometres (nm). The method for particle size determination and relevant parameters of 1449
the particle size average should be reported. 1450
Solubility - Solubility is an ability of a substance to dissolve in a solvent (max amount that 1451
can be solved under certain conditions) and this depends on chemical composition. 1452
SPM – Suspended particulate matter 1453
SRNOM – Suwannee River NOM: a standard surface water NOM material of the 1454
International Humic Substance Society (IHSS), isolated from the Suwannee River (US) by 1455
reverse osmosis and purified according to the procedures of the IHSS. The material can be 1456
purchased from the IHSS. 1457
1458