uilding asset management plan 2019 - city of bunbury
TRANSCRIPT

Building Asset Management Plan 2019

Page 2
Glossary of terms
Asset Renewal
Replacing or refurbishing an existing asset with an asset of
equivalent capacity or performance capability.
Asset Renewal Period
The estimated replacement period of the asset.
Condition Rating
An asset being physically inspected to determine its current state,
classified using a score of 1-5.
Current Replacement Cost (CRC)
The cost required to replace the given asset in todays dollars. All
dollar figures are ex GST.
Financial Data & Values
Obtained from AssetFinda reporting system as at January 2019.
Integrated Financial Plan (IFP)
The adopted Integrated Financial Plan
2019/20 to 2033/34 as at 28th May 2019.
IPWEA
The Institute of Public Works Engineering Australasia.
Maintenance
The reactive or planned work required to maintain the asset.
MARCIA
Most Accessible Regional City in Australia.
New & Expansion, Upgrade and Renewal Projects
Capital projects identified in the adopted Integrated Financial
Plan 2019/20 to 2033/34.
Operating Costs
The everyday running costs of the asset.
Useful Life
The estimated life expectancy of the asset.
Page 2

The Building portfolio consists of six building function types The City of Bunbury
Owns and maintains a building portfolio of 102 individual buildings
Current replacement value $148,229,652
High level of confidence in the data collected within this plan
$16,487,660 worth of required renewals over the 15 year period
88.88% ($131,741,992) of the Building portfolio does not fall due for renewal until
after 2035
Heritage buildings (9) do not form part of this asset management plan and are
addressed separately.
Buildings
Overview
1. Commercial Buildings (3)
> Is an independent business that operates from a City owned building.
Example: In-town Lunch Centre and Back Beach Café.
2. Community Buildings (18)
> Buildings that are either leased, occupied or visited by members of the public.
Example: Libraries, Clubrooms, Health Clinic and Bunbury Regional Entertainment Centre (BREC).
3. Corporate Buildings (10)
> Buildings that are for the sole purpose of City of Bunbury operations.
Example: City Works Depot and City Administration building.
4. Public Toilets (28)
> Amenities or ablution blocks that are available for public use.
Example: Rocky Point, Pelican Point toilet blocks and Exeloos.
5. Recreation Buildings (39)
> Buildings that are for the purpose of sporting organisations and activities.
Example: South West Sports Centre (SWSC), grand stands, pavilions and change rooms.
6. Transport & Regulation Buildings (4)
> Buildings for the sole purpose of administering City services to the community.
Example: Regional Animal Facility and Airport buildings.
Page 3

74 Buildings have a 50 year or greater useful life
with a replacement cost of $143,910,190
Current Replacement Cost Breakdown
Group Count CRC
Commercial 3 $ 3,604,719 2.43%
Community 18 $ 49,814,440 33.61%
Corporate 10 $ 18,330,420 12.36%
Public Toilets 28 $ 7,650,690 5.16%
Recreation 39 $ 68,404,910 46.15%
Transport /Regulation 4 $ 424,473 0.29%
Total 102 $148,229,652 100%
Overview
Total of 102 buildings with a current replacement cost of $148,229,652.
Building useful life and current replacement costs were obtained from an
independent valuation in June 2017 by Australian Valuation Solutions.
Currently the Building replacement cost is based on the ‘whole’ building which
includes the following elements;
1. Building - Structure: walls, beams and flooring
2a. Internal Services - Electrical: lighting, fire & security systems and smoke alarms
2b. Internals Services - Hydraulics: lifts and elevators
2c. Internal Services - Mechanical: air-conditioning units and hot water system
3. Fixtures: blinds, curtains, carpet, cupboards & fit out
Due to the above building elements having such varied useful lives the City is
currently working towards componentising each building to ensure that sufficient
renewal funding is available. As per the adjacent useful life graph 60.97% of all
buildings have an 80 year life expectancy, however this does not accurately reflect the
required renewal expenditure.
Current Replacement Cost,
Useful Life & Age Profile
Useful Life - based on current building value
Page 4

Excellent (25) Graham Bricknell Music Shell Shed—Airport
City Administration Building Toilet Block—Pelican Point 3 Shed—Forrest Park 1
City Works Depot Toilet Block—Queens Gardens Shed—Forrest Park 2
Shed—Athletics Toilet Block—Upper Esplanade Shed—Hands Oval
Toilet Block—Athletics Transmitter Hutt—Boulters Shed—Hockey 1
Kiosk—Koombana Foreshore Clubrooms—Woodturners Ass. Shed—Hockey 2
Clubrooms— Bethanie Average (49) Shed—Payne Park 1
BREC Apex Scout Hall Shed– Payne Park 2
Exeloo—Stephen St Changerooms—AR Clarke (M) Shed—Rec Ground
Exeloo—Holman St Business Building—Souths Clubrooms—Soccer Drome
City Library Changerooms—Ocean Dr Toilet Block—Jaycee Park
Regional Animal Facility Changerooms—Hands Oval Toilet Block—Maidens Park
Office—SES Headquarters Chemical Shed—Waste Depot Toilet Block—Ocean Drive
South West Sports Centre Clubrooms—Badminton Toilet Block—Payne Park
Changerooms—Hay Park 1 Clubrooms—Bowling Club Toilet Block—St Marks
Changerooms—Hay Park 2 Clubrooms—Hockey Toilet Block—Hands Oval 1 (F)
Shed—Works Depot Clubrooms—Netball Toilet Block—Hands Oval 2 (F)
Toilet Block—Airport Clubrooms—PCYC Toilet Block—Hands Oval 1 (M)
Toilet Block—Big Swamp Clubrooms—Hands Oval Changerooms—Payne Park
Toilet Block—Glen Iris Skate Clubrooms—Tennis Tool Shed—Wildlife Park
Toilet Block—Hungry Hollow Changerooms—Kelly Park (F) Poor (13)
Toilet Block—Jetty Baths Health Clinic—DC Foster Toilet Block—Athletic Track
Toilet Block—Pelican Point 1 Ronald McDonald House Toilet Block—BMX Track
Toilet Block—Pelican Point 2 Pavilion—Kit Keddie Clubrooms—Forrest Park
Toilet Block—Rocky Point Pavilion—Len Nisbett Shed—Payne Park 3
Workshop—Works Depot Pavilion—Ned Myles Shed—Tennis Club 1
Good (15) Pavilion—Neville Eastman Shed—Tennis Club 2
Café—In Town Centre Landscape Shed—Waste Depot Signage Shed—Waste Depot
Changerooms—Hockey Withers Library Toilet Block—Frank Buswell
Clubrooms—Surf Life Saving Clubrooms—Moorbinda Croquet Toilet Block—Hands Oval (M+F)
Cottage—Morrisey Homestead Office– Waste Depot Toilet Block—Rec Ground (F)
Exeloo—Jetty Road Miniature Railway Roundhouse Toilet Block—Rec Ground (M)
Grandstand—Hay Park Community Hall– Hay Park Toilet Block—Hands Oval 2 (M)
Office & Kiosk—Wildlife Park Power Boat Club Bunbury Croquet Club
Café—Back Beach Toilet Block—Airport
Shed—Bush Fire Brigade Waste Oil Unit—Waste Depot
Overview “The Objective of a condition assessment is to provide sufficient information on asset condition to allow informed
strategic asset planning and management decisions to be made” [IPWEA Practice Note 3].
Buildings are currently condition rated on the overall structure and not on the various individual components
of the building. Australian Valuation Solutions condition rated the City's Buildings in May 2016.
The previous Building asset management plan listed 120 individual building however over the 2018/19 financial
year several buildings have been disposed (23) such as the Nuytsia Avenue depot, Waste Facility sheds and SES
facilities. In-conjunction with the disposed assets the City has also attained new buildings (5), such as the South’s
Building, Jetty Baths toilet block and the new Works Depot at Sutherland Way.
Condition IPWEA Parameters Count
Excellent 25 (24.51%) As new and structurally sound. No evidence of deterioration, damage or discoloration.
Well maintained.
Good 15 (14.71%) Structurally sound although with minor deterioration, discolouration and wear to surface.
Minor maintenance only required.
Average 49 (48.04%) Asset is functional but shows signs of moderate wear and tear.
Deterioration surfaces require attention. Services are functional, but require attention.
Poor 13 (12.75%) Asset has significant defects affecting major components.
Deterioration surfaces require attention. Frequent maintenance inspections essential.
Very Poor 0 (0.00%) Serious structural problems. General appearance is poor.
Significant number of major defects exists.
Building Condition (based on 102 buildings externally assessed in 2016)
Page 5
Condition
Assessment

Maintenance and
Operating Budget
Operating Budget
The costs associated with the everyday running of the building asset
e.g. electricity, gas, insurance, water, security patrol
Total Operation budget (15 years) $32,114,653
Total Operation budget (average per annum) $ 2,140,977
Electricity: $11,483,382
Aqwest: $ 3,213,077
Insurance: $3,023,382
Cleaning: $9,029,470
Gas: $4,601,138
Water $764,204
Corporation
The City is developing a comprehensive maintenance
plan for buildings as the existing allocated budget is
not sufficient to fund both scheduled and reactive
maintenance works.
An increase in the maintenance budget will ensure
the capacity to deliver the
required works within the appropriate timeframe.
Maintenance Budget
Building maintenance is the repairs and upkeep of the asset i.e. Fire & smoke alarm testing, painting and servicing of air conditioning units.
Building maintenance is split into two types:
Scheduled - all work required to keep buildings functioning and to minimise unscheduled breakdowns.
Reactive - all unplanned works required to keep the building functional and operational.
Building Maintenance budgets have been modelled on the following;
1. Existing IFP Maintenance Budget
The City’s allocated maintenance budget = $17,250,315.
2. Future Growth Increase of New & Expansion and Capital Projects
As per the adopted IFP 2019/20 to 2033/34 the City has made allowance of 2 & 3% for the impact that
New & Expansion and Capital Projects ($11,630,000) will have on future building maintenance = $19,895,815.
Please note that the 2 & 3% growth has been applied to maintenance only and not split between operating and maintenance budgets.
3. Projected Maintenance Modelling based on Industry Standards and South West Sports Centre Identified Works
a) An allowance of 2% of the buildings current replacement value for maintenance which is standard practice within
the building industry until such time as a detailed maintenance plan is implemented.
b) External audit by Aquatic Services of South West Sports Centre plant, completed March 2019.
Total building maintenance required = $48,153,490.
Modelling on Maintenance Budget
Page 6

New & Expansion
Projects and Future Drivers New & Expansion and Capital Upgrade Overview
New and Expansion works refer to the creation of assets that did not previously exist and addresses growth,
social or environmental needs.
Example: Hay Park South Sports Pavilion.
Capital Upgrade works refer to improvement and expansion of an existing assets capacity and functionality.
Example: expansion works at Bunbury Regional Entertainment Centre.
Capital new funding can be sourced from a number of resources including grant funding, external loan, City of
Bunbury reserves and cash.
As per the Integrated Financial Plan $11,630,000 has been allocated to various New & Expansion and Capital
Upgrade projects over the 15 year period.
The financial impact of New and Expansion and Capital Upgrade projects in regards to operating and maintenance
costs has been included in the budget modelling (refer to page 6—maintenance and operating budgets).
Disability Access & Inclusion Plan and MARCIA
In-line with the City's Disability Access and Inclusion Plan 2017-2022 and the Strategic Community Plan
2018—2028 to establish Bunbury as the most accessible regional city in Australia, the City is now looking to
install and retrofit existing buildings to meet the needs of the community and visitors to our City.
Examples of projects already completed to strive to the above aspirations:
2017 Koombana Foreshore: ‘changing places’ public toilet facility with full sized change tables and hoist
2018 South West Sports Centre: additional family and accessible change rooms
2018 Bunbury Regional Entertainment Centre: accessible toilet
Strategic plans driving future projects
1. City of Bunbury Strategic Community Plan
2. Community Sports and Recreation Strategy (in development)
3. Public Open Space Strategy: Parks and Playgrounds (in development)
4. Buildings Levels of Service (to be completed)
5. Disability & Access Inclusion Plan and MARCIA
6. TPS8—Town Planning Scheme 8
New & Expansion and Capital Upgrade Projects
Year Project ID Description Budget
2020-2021 PR-4786 Construct Youth Precinct $ 5,500,000
2020-2022 PR-4112 Upgrade facilities to meet MARCIA goals $ 300,000
2020 PR-4734 Upgrade building fire suppression - SWSC $ 350,000
2021 PR-4739 Construct stairs—Regional Animal Facility $ 20,000
2021 PR-4415 Reconfigure PC computer space - City Library $ 20,000
2022 PR-4418 Reconfigure refreshments area—City Library $ 10,000
2024-2025 PR-4444 Construct education centre—Wildlife Park $ 220,000
2024 + PR-4029 Infrastructure redevelopment—Hay Park $ 4,800,000
2025 PR-4397 Reconfigure front service desk area—City Library $ 30,000
2025 PR-4442 Upgrade Wildside Café—Wildlife Park $ 80,000
2031 PR-1856 Install ablution block—Eliot Street $ 300,000
Total Projects $11,630,000
Page 7

Backlog
assets that fall due for
renewal prior to 2019
but have not yet been
replaced or
refurbished.
Backlog Dispersed
spreading the
backlog of asset
renewals over the
renewal
period.
1st Renewal
an asset due for
renewal for the first
time within
the 15 year period.
IFP Budget
projects that have
been identified and
included in the
Integrated
Financial Plan.
Beyond 2035 Breakdown
Year Count CRC CRC % Count %
2035 to 2044 24 $ 15,649,927 11.88% 38.71%
2045 to 2054 15 $ 12,417,290 9.43% 24.19%
2055 to 2064 12 $ 3,781,075 2.87% 19.35%
2065 to 2074 7 $ 32,809,850 24.90% 11.29%
2075 to 2084 2 $ 43,850,500 33.28% 3.23%
2085 to 2094 2 $ 23,233,350 17.64% 3.23%
Total 62 $131,741,992 100% 100%
Whilst the budget indicates a
surplus of $4,047,340 over the 15 year
period, it has to be noted that
88.88% ($131,741,992)
of the building portfolio does not fall
due for renewal until after 2035.
Componentising buildings will significantly alter the required
renewals within the 15 year renewal and beyond 2035 period.
Page 8
Renewal Overview
Asset Renewal is the replacement or refurbishment of an existing asset to
return it to its original performance and service level (like for like).
Renewal planning is essential to ensure that adequate funding is available
and assets are replaced at an optimum time thus maintaining the desired
service levels.
The Building renewal budget is calculated on the age of the asset.
Using the year of acquisition and the useful life determines the year each
building falls due for replacement. The physical condition of each building
is not yet a driving factor determining replacement.
Renewal Period Backlog $ 197,925 (0.13%)
15 year renewal $ 16,289,735 (10.99%)
Beyond 2035 $131,741,992 (88.88%)
Renewal Budget
Total Required Renewals (15 years) $ 16,487,660
Total IFP Renewal Budget (15 years) $ 20,535,000
Total Renewal Surplus (15 years) $ 4,047,340
Total renewal Surplus (per annum) $ 269,823
Whilst there is currently a surplus of renewal funds once componentisation
of buildings commences this year, the required renewals will increase thus
absorbing the excess funds.
The spike in the 2027 required renewals graph is the replacement of
various sporting pavilions and facilities ($5,572,350).
Top Four Building Renewals
1. South West Sports Centre (Recreation)
$42M in 2082
2. BREC (Community)
$25M in 2069
3. City Administration Building (Corporate)
$14M in 2087
4. Bunbury Regional Library (Community)
$9M in 2089
Renewals
Asset Ratio
Evaluation
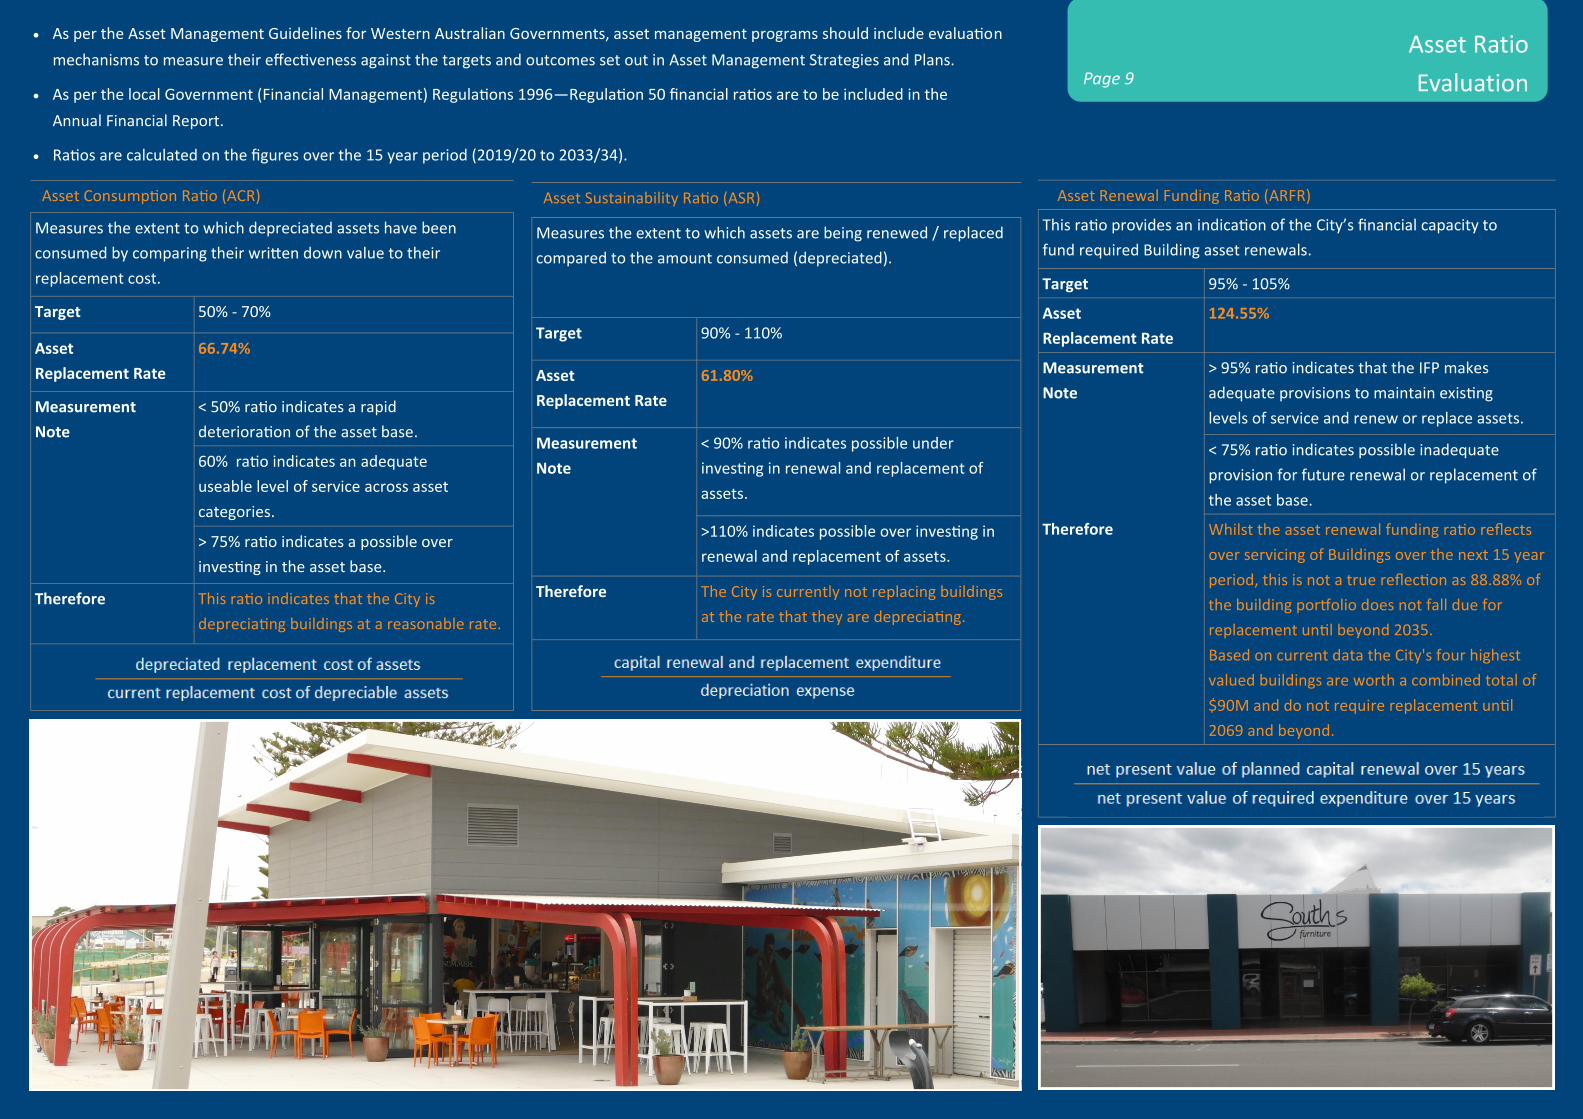
As per the Asset Management Guidelines for Western Australian Governments, asset management programs should include evaluation
mechanisms to measure their effectiveness against the targets and outcomes set out in Asset Management Strategies and Plans.
As per the local Government (Financial Management) Regulations 1996—Regulation 50 financial ratios are to be included in the
Annual Financial Report.
Ratios are calculated on the figures over the 15 year period (2019/20 to 2033/34).
Asset Consumption Ratio (ACR)
Measures the extent to which depreciated assets have been
consumed by comparing their written down value to their
replacement cost.
Target 50% - 70%
Asset
Replacement Rate
66.74%
Measurement
Note
< 50% ratio indicates a rapid
deterioration of the asset base.
60% ratio indicates an adequate
useable level of service across asset
categories.
> 75% ratio indicates a possible over
investing in the asset base.
Therefore This ratio indicates that the City is
depreciating buildings at a reasonable rate.
Asset Sustainability Ratio (ASR)
Measures the extent to which assets are being renewed / replaced
compared to the amount consumed (depreciated).
Target 90% - 110%
Asset
Replacement Rate
61.80%
Measurement
Note
< 90% ratio indicates possible under
investing in renewal and replacement of
assets.
>110% indicates possible over investing in
renewal and replacement of assets.
Therefore The City is currently not replacing buildings
at the rate that they are depreciating.
Asset Renewal Funding Ratio (ARFR)
This ratio provides an indication of the City’s financial capacity to
fund required Building asset renewals.
Target 95% - 105%
Asset
Replacement Rate
124.55%
Measurement
Note
> 95% ratio indicates that the IFP makes
adequate provisions to maintain existing
levels of service and renew or replace assets.
< 75% ratio indicates possible inadequate
provision for future renewal or replacement of
the asset base.
Therefore Whilst the asset renewal funding ratio reflects
over servicing of Buildings over the next 15 year
period, this is not a true reflection as 88.88% of
the building portfolio does not fall due for
replacement until beyond 2035.
Based on current data the City's four highest
valued buildings are worth a combined total of
$90M and do not require replacement until
2069 and beyond.
Page 9