uintah parallelism infrastructure: a performance
TRANSCRIPT

c c
c c
University of Utah Institutional Repository Author Manuscript
The Uintah Parallelism Infrastructure: A Performance Evaluation on the SGI Origin 2000
John McCorquodale, J. Davison de St. Germain, Steven G. Parker, Chris Johnson Scientific Computing and Imaging Institute
University of Utah, Salt Lake City, UT 84112 { mcq, dav, sparker, crj} @cs.utah.edu
http://www.csafe.utah.edu and http://www.sci.utah.edu
Keywords
Performance Analysis, Parallelism, Origin 2000
Abstract
Uintah is a component-based visual problem solving environment (PSE) designed to specifically address the unique prob
lems inherent in running massively parallel scientific compu
tations on terascale computing platforms. In particular, development of the Uintah system is part of the C-SAFE [2] ef
fort to study the interactions between hydrocarbon fires, struc
tures and high-energy materials (explosives and propellants).
In this paper we describe methods for generating meaning
ful peiformance measurements for the Uintah PSE running on
the SGI Origin 2000 multiprocessor architecture (these methods are applicable to many other applications.) These tech
niques include utilizing the non-intrusive peiformance counters built into the RIOk and R12k processors, controlling pro
cess placement, controlling memory layout, and utilization of a task graph approach to specifying and solving the problem.
INTRODUCTION
Computational scientists continue to push the capabilities of current computer hardware to its limits in order to simulate complex real world phenomena. These simulations necessitate the use of ever increasing computational resources. C-SAFE's [2] Uintah PSE (Problem Solving Environment) is a massively parallel, component based, problem solving environment designed to simulate large-scale scientific problems, while allowing the scientist to interactively visualize, steer, and verify his simulation results. The Uintah PSE is being developed specifically to study interactions between hydrocarbon fire, structures, and high-energy materials (explosives and propellants).
Solving a typical C-SAFE problem involves running multiple large-scale physically coupled simulations. For example, a f1uid-dynamics-based combustion model can be coupled with a particle-based solid mechanics simulation to investigate the effects of fire on metal structures. Within the duration of the project, these models may employ representations involving 109 finite volume
cells and 108 solid material points. In order to handle the large number of operations necessary to process such immense datasets, we have designed the Uintah Parallelism Infrastructure (UPI). The UPI is the foundation upon which the simulation components are built and handles the difficult task of balancing between simplicity and efficiency.
In this paper we begin by introducing our target platform, the SGI Origin 2000. Due to fluctuations of measurements on this platform, we spend some time detailing various architectural barriers to repeatable measurement and the ways we have addressed them. We then collect statistics for an example UPI computation including cache utilization, cycle counts, and retired floating point instruction counts. We collect similar statistics for the UPI data transport and scheduling mechanisms. This allows us to understand instantaneous resource utilizations and bottlenecks at a fine granularity throughout an entire distributed computation. We present the results of this instrumentation and summarize lessons learned to date about where the difficulties in irregular computations such as ours truly lie.
INSTRUMENTING THE ORIGIN 2000
The initial target platform of the Uintah PSE is "nirvana," the SGI Origin 2000 (02k) cluster at Los Alamos National Labs [1]. Despite the nondeterminism of performance measurements on the 02k architecture [7], we have found it possible to perform meaningful and repeatable measurements of architectural events with the hardware performance counters built into the RlOk processor. With careful attention to eliminating sources of nondeterminism we can, for example, repeatably measure cycle counts to an accuracy of a few cycles per ten million.
The Origin 2000 [8] is a cache-coherent non-uniform memory access (ccNUMA) distributed shared memory architecture with up to 128 processors per shared address space, and pure message passing between shared address spaces. Machines we measured use MIPS RlOk [5] and R12k processors, each of which has separate 32k 2-way associative instruction and data caches. A node consists of exactly two processors, which share a unified second-level cache typically 4 or 8 megabytes in size,
c c
c c
University of Utah Institutional Repository Author Manuscript
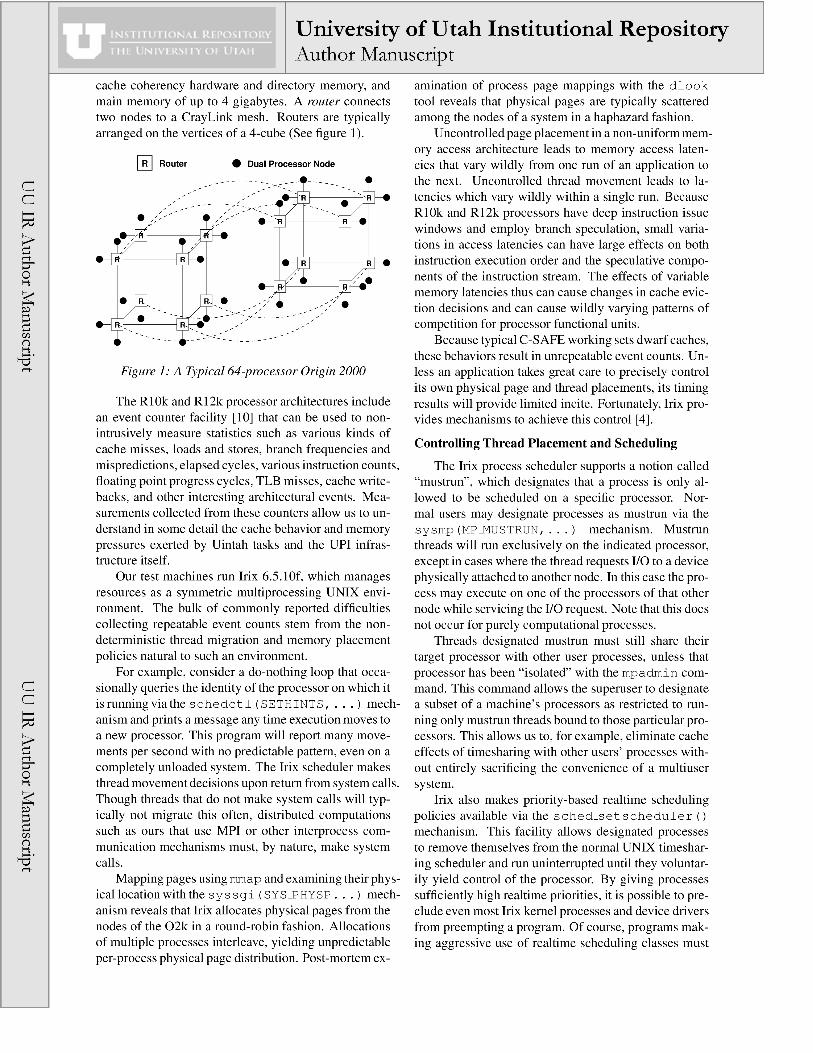
cache coherency hardware and directory memory, and main memory of up to 4 gigabytes. A router connects two nodes to a CrayLink mesh. Routers are typically arranged on the vertices of a 4-cube (See figure 1).
~ Router • Dual Processor Node
- -----~?- - ---
Figure 1: A Typical 64-processor Origin 2000
The R10k and R12k processor architectures include an event counter facility [10] that can be used to nonintrusively measure statistics such as various kinds of cache misses, loads and stores, branch frequencies and mispredictions, elapsed cycles, various instruction counts, floating point progress cycles, TLB misses, cache writebacks, and other interesting architectural events. Measurements collected from these counters allow us to understand in some detail the cache behavior and memory pressures exerted by Uintah tasks and the UPI infrastructure itself.
Our test machines run Irix 6.S.lOf, which manages resources as a symmetric multiprocessing UNIX environment. The bulk of commonly reported difficulties collecting repeatable event counts stem from the nondeterministic thread migration and memory placement policies natural to such an environment.
For example, consider a do-nothing loop that occasionally queries the identity of the processor on which it is running via the schedctl (SETHINTS, ... ) mechanism and prints a message any time execution moves to a new processor. This program will report many movements per second with no predictable pattern, even on a completely unloaded system. The Irix scheduler makes thread movement decisions upon return from system calls. Though threads that do not make system calls will typically not migrate this often, distributed computations such as ours that use MPI or other interprocess communication mechanisms must, by nature, make system calls.
Mapping pages using mmap and examining their physicallocation with the syssgi (SYS_PHYSP ... ) mechanism reveals that Irix allocates physical pages from the nodes of the 02k in a round-robin fashion. Allocations of multiple processes interleave, yielding unpredictable per-process physical page distribution. Post-mortem ex-
amination of process page mappings with the dlook
tool reveals that physical pages are typically scattered among the nodes of a system in a haphazard fashion.
Uncontrolled page placement in a non-uniform memory access architecture leads to memory access latencies that vary wildly from one run of an application to the next. Uncontrolled thread movement leads to latencies which vary wildly within a single run. Because RlOk and R12k processors have deep instruction issue windows and employ branch speculation, small variations in access latencies can have large effects on both instruction execution order and the speculative components of the instruction stream. The effects of variable memory latencies thus can cause changes in cache eviction decisions and can cause wildly varying patterns of competition for processor functional units.
Because typical C-SAFE working sets dwarf caches, these behaviors result in unrepeatable event counts. Unless an application takes great care to precisely control its own physical page and thread placements, its timing results will provide limited incite. Fortunately, Irix provides mechanisms to achieve this control [4].
Controlling Thread Placement and Scheduling
The Irix process scheduler supports a notion called "mustrun", which designates that a process is only allowed to be scheduled on a specific processor. Normal users may designate processes as mustrun via the sysmp (MP..MUSTRUN, ... ) mechanism. Mustrun threads will run exclusively on the indicated processor, except in cases where the thread requests 110 to a device physically attached to another node. In this case the process may execute on one of the processors of that other node while servicing the 110 request. Note that this does not occur for purely computational processes.
Threads designated mustrun must still share their target processor with other user processes, unless that processor has been "isolated" with the mpadmin command. This command allows the superuser to designate a subset of a machine's processors as restricted to running only mustrun threads bound to those particular processors. This allows us to, for example, eliminate cache effects of timesharing with other users' processes without entirely sacrificing the convenience of a multiuser system.
Irix also makes priority-based realtime scheduling policies available via the sched_setscheduler ()
mechanism. This facility allows designated processes to remove themselves from the normal UNIX timesharing scheduler and run uninterrupted until they voluntarily yield control of the processor. By giving processes sufficiently high realtime priorities, it is possible to preclude even most Irix kernel processes and device drivers from preempting a program. Of course, programs making aggressive use of realtime scheduling classes must

c c
c c
University of Utah Institutional Repository Author Manuscript
carefully use Irix kernel services having lower priorities in order to avoid deadlock.
Additionally, the mpadmin tool may be used to disable the "clock scheduler" on particular processors, thus disabling timer interrupts and effectively making the normal timesharing scheduler on that processor nonpreemptive. This mechanism used in conjunction with isolated processors and mustrun threads gives normal users similar benefits to realtime scheduling without requiring user programs to be specially privileged and without the danger of deadlock.
Controlling Page Placement
Irix provides dplace, a command-line tool that can be used to control thread placement and achieve perthread memory localization under the control of a "placement file." The user specifies a collection of abstract "memories", each embodying a placement policy which may express place (a particular collection of "center" nodes on which to allocate), and notions of radius (distance in the NUMA interconnection graph from center nodes). The configuration file provides convenient syntax to establish placement policies suitable for many algorithm topologies.
Like all convenient tools, dplace has its limitations. Most important is the fact that thread counts and placement policies per thread are specified statically; a dynamic computation whose threads migrate to avoid data transfer or in which threads die and are dynamically created cannot be effectively controlled with dplace. There are no mechanisms to allow optimization of interthread communication by topological awareness. Threads are named in the configuration file by the order in which they are created, which may require complex, fragile, unwritten cooperation between the dplace and application to achieve a desired placement.
The dplace tool is designed to improve the performance of existing programs, which it effectively does. It is not suitable for use as the placement mechanism for a program designed to make very subtle and effective use of the machine or that has adaptive or dynamic behavior.
The alternative to dplace is for an application to dynamically place memory pages by making C function calls to the Memory Management Control Interface (MMCI). [3] MMCI allows the creation of policy modules, which embody the same notions as the abstract memories of the dplace placement file. Policy modules (PMs) specify desired page placement, physical size, RW page migration and RO page replication. A user may bind a PM's page placement policy to a particular set of memory locality descriptors (MLDs). MLDs may be bound to particular nodes' memories, memories within a specified radius or a particular node, or may bind to memories in particular topologies on whatever nodes are available. Any number of policy modules may
be created and bound to arbitrary spans of a shared virtual address space. Policy modules may also be made the stack and text default policies, causing subsequent stack and code pages to be allocated according to a specified policy.
Thus, threads bound to particular processors can use memory on their processors' nodes under direct program control, and are free to access other nodes' memories as required. An adaptive algorithm with dynamic memory usage and placement requirements may thus be crafted to manage communication on the router mesh and achieve deterministic, scalable performance.
Using the RIOk Event Counters
In the case of the processor event counters, Irix again provides a convenient command-line front-end, called pe r f e x, to profile programs. The tool can collect counts from particular event counters (up to two at a time), or can multiplex measurements of all 32 possible events, two at a time, switching every clock interrupt.
Multiplexing counters in this way leads to poor repeatability, especially for short running programs, or programs with nonhomogeneous behaviors, like adaptive distributed message-passing (in some sense eventdriven) simulations. Further, perfex can only collect statistics for an entire program run. Therefore it is necessary to instrument programs at a much finer granularity, under the control of the application, in order to learn meaningful things about their behavior.
A program has access to the event counters itself via the PIOC_EVCTRS ioctls on a thread's entry in /proc. Though it is cumbersome, a process may specify a subset of events for the kernel to count. The kernel will multiplex the processor's counters if more than two events are specified. The overhead of invoking the ioctls varies from about 300-500 instructions with some unavoidable variation, an average value of this overhead can be subtracted from measurements, but some noise remains. Alternatively a "measurement thread" can measure counters on other threads in the program. U sing a lightweight memory-based synchronization mechanism between these two threads can enable virtually noiseless measurements of a thread.
Unavoidable Problems
Despite all of this sophistication, there are some unavoidable factors which contribute to measurement noise in Irix. Most notable is the apparent lack of an easy way to isolate a node's physical memory from the rest of the system. Even on a node with two isolated processors, Irix may allocate kernel data structures and user programs to that memory. Additionally, Irix makes heavy use of shared libraries. With shared libraries, the physical pages holding that library's code may be scattered throughout the system. Newer versions of the MIPSpro compiler appear not to include static versions of libc.

c c
c c
University of Utah Institutional Repository Author Manuscript
This can lead to nondeterministic instruction load times on i-cache misses, with all the subtle microarchitectural effects thereof.
Getting Good Measurements
We have found that using mustrun threads on isolated processors is necessary in order to achieve repeatable results. System load must be light to ensure that remote accesses to an isolated node's memory are rare. Neither disabling the clock scheduler on the isolated processors nor placing threads in a realtime scheduling class appear to provide noticeable benefit (at least on unloaded systems). Scheduling threads this way in combination with explicitly specifying all of a program's data and stack page locations with the MMCI interface lead to repeatable measurements of events for cache-resident instruction sequences. We have not yet experimented with static linking and controlled text page placement as mechanisms for eliminating instruction cache miss effects, but we expect doing so to extend measurement determinism to whole runs of non-event-driven programs.
UPI ABSTRACTIONS
The Uintah Parallelism Infrastructure exposes flexibility in dynamic application structure by adopting an execution model based on software or "macro" dataflow. Computations are expressed as directed acyclic graphs of tasks, each of which produces some output and consumes some input (which is in turn the output of some previous task). These inputs and outputs are specified for each patch in a structured grid. Tasks extend a UPI data structure called the task graph, which represents imminent computation.
In natural agreement with the functional nature of its pure macro-dataflow execution model, the UPI presents developers with a global single-assignment memory abstraction, with automatic data lifetime management and storage reclamation. Storage is abstractly presented to the scientific programmer as a dictionary mapping names to values. The value associated with a name can be written only once, and once written is communicated by UPI to all tasks awaiting that value. Values are typically array-structured.
Communication is scheduled by a local scheduling algorithm that approximates the true globally optimal communication schedule. Because of the flexibility of single-assignment semantics, the UPI is free to execute tasks close to data or move data to minimize future communication.
The UPI storage abstraction is sufficiently high-level that it can be efficiently mapped onto both messagepassing and share-memory communication mechanisms. Threads sharing a memory can access their input data directly; single-assignment dataflow semantics eliminate the need for any locking of values. The UPI is free to optimize allocation of physical memory to minimize
remote memory accesses. Threads running in disjoint address spaces communicate by message-passing protocol, and the UPI is free to optimize such communication by message aggregation. Tasks need not be aware of the transports used to deliver their inputs and thus UPI has complete flexibility in control and data placement to optimize communication both between address spaces and within the shared ccNUMA memory hierarchy of the Origin 2000. Solving this optimization problem for CSAFE simulations is difficult and is a subject of ongoing investigation.
, cr' ",- .~ ___ /-' m ~"", ',/' V " ,", m
~ __ -.I..- .'<, -.: .~---L
\------:~ -y\ 'a
-----.. Particle Data ----~ Grid Data
M Mass X Position V Velocity cr Stress ro Constituents
Figure 2: An Example UP! Task Graph
Consider the task graph in Figure 2. Ovals represent tasks, each of which is a simple array program and easily treated by traditional compiler array optimizations. Edges represent named values stored by UPI. Solid edges have values defined at each material point (Particle Data) and dashed edges have values defined at each grid vertex (Grid Data). Variables denoted with a prime C) have been updated during the time step. The figure shows the slice of the actual Uintah Material Point Method (MPM) task graph concerned with advancing Newtonian material point motion on a single patch for a single timestep.
The idea of the dataflow graph as an organizing structure for execution is well known. The SMARTS dataflow engine that underlies the POOMA [6] toolkit shares goals and philosophy with UPI. SISAL compilers used dataflow concepts at a much finer granularity to structure code
c c
c c
University of Utah Institutional Repository Author Manuscript
generation and execution. Dataflow is a simple, natural and efficient way of exposing parallelism and managing computation, and is an intuitive way of reasoning about parallelism. What distinguishes implementations of dataflow ideas is that each caters to a particular higher-level presentation. SMARTS caters to POOMA's C++ implementation and stylistic template-based presentation. The SISAL compiler was of course developed to support the SISAL language. UPI is implemented to support a presentation catering to C++ and Fortran based mixed particle/grid algorithms on a structured adaptive mesh. The primary algorithms of importance to C-SAFE are the Material Point Method (MPM), and Eulerian CFD algorithms. Separating the common dataflow-related elements from the impacts of higherlevel presentation is an interesting problem worth further study.
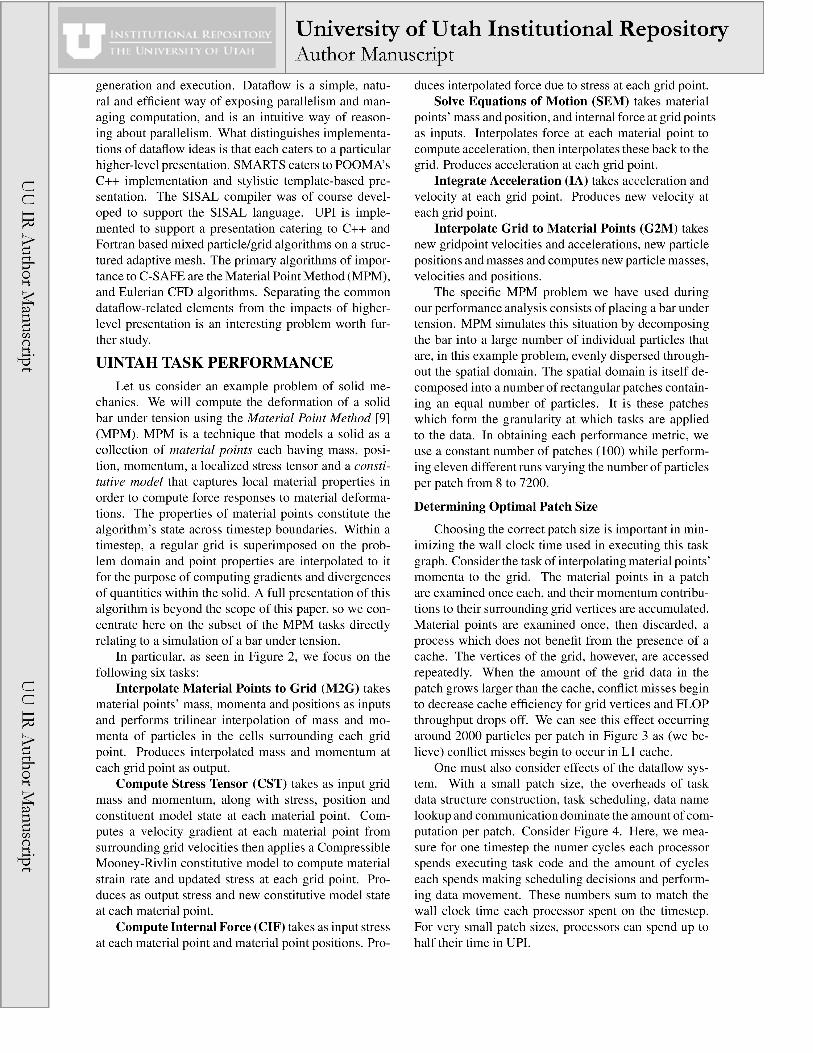
UINTAH TASK PERFORMANCE
Let us consider an example problem of solid mechanics. We will compute the deformation of a solid bar under tension using the Material Point Method [9] (MPM). MPM is a technique that models a solid as a collection of material points each having mass, position, momentum, a localized stress tensor and a constitutive model that captures local material properties in order to compute force responses to material deformations. The properties of material points constitute the algorithm's state across timestep boundaries. Within a timestep, a regular grid is superimposed on the problem domain and point properties are interpolated to it for the purpose of computing gradients and divergences of quantities within the solid. A full presentation of this algorithm is beyond the scope of this paper, so we concentrate here on the subset of the MPM tasks directly relating to a simulation of a bar under tension.
In particular, as seen in Figure 2, we focus on the following six tasks:
Interpolate Material Points to Grid (M2G) takes material points' mass, momenta and positions as inputs and performs trilinear interpolation of mass and momenta of particles in the cells surrounding each grid point. Produces interpolated mass and momentum at each grid point as output.
Compute Stress Tensor (CST) takes as input grid mass and momentum, along with stress, position and constituent model state at each material point. Computes a velocity gradient at each material point from surrounding grid velocities then applies a Compressible Mooney-Rivlin constitutive model to compute material strain rate and updated stress at each grid point. Produces as output stress and new constitutive model state at each material point.
Compute Internal Force (CIF) takes as input stress at each material point and material point positions. Pro-
duces interpolated force due to stress at each grid point. Solve Equations of Motion (SEM) takes material
points' mass and position, and internal force at grid points as inputs. Interpolates force at each material point to compute acceleration, then interpolates these back to the grid. Produces acceleration at each grid point.
Integrate Acceleration (IA) takes acceleration and velocity at each grid point. Produces new velocity at each grid point.
Interpolate Grid to Material Points (G2M) takes new gridpoint velocities and accelerations, new particle positions and masses and computes new particle masses, velocities and positions.
The specific MPM problem we have used during our performance analysis consists of placing a bar under tension. MPM simulates this situation by decomposing the bar into a large number of individual particles that are, in this example problem, evenly dispersed throughout the spatial domain. The spatial domain is itself decomposed into a number of rectangular patches containing an equal number of particles. It is these patches which form the granularity at which tasks are applied to the data. In obtaining each performance metric, we use a constant number of patches (100) while performing eleven different runs varying the number of particles per patch from 8 to 7200.
Determining Optimal Patch Size
Choosing the correct patch size is important in minimizing the wall clock time used in executing this task graph. Consider the task of interpolating material points' momenta to the grid. The material points in a patch are examined once each, and their momentum contributions to their surrounding grid vertices are accumulated. Material points are examined once, then discarded, a process which does not benefit from the presence of a cache. The vertices of the grid, however, are accessed repeatedly. When the amount of the grid data in the patch grows larger than the cache, conflict misses begin to decrease cache efficiency for grid vertices and FLOP throughput drops off. We can see this effect occurring around 2000 particles per patch in Figure 3 as (we believe) conflict misses begin to occur in Ll cache.
One must also consider effects of the dataflow system. With a small patch size, the overheads of task data structure construction, task scheduling, data name lookup and communication dominate the amount of computation per patch. Consider Figure 4. Here, we measure for one time step the numer cycles each processor spends executing task code and the amount of cycles each spends making scheduling decisions and performing data movement. These numbers sum to match the wall clock time each processor spent on the timestep. For very small patch sizes, processors can spend up to half their time in UPI.

c c
c c
University of Utah Institutional Repository Author Manuscript
0.3
0.25
OJ u
0.2 >. u U5 a.. 0 0.15 ....J LL OJ OJ ro Q; 0.1 > «
0.05
---+-- Interpolate Material Points To Grid .... x.... Compute Internal Force ••••• J< •••• Compute Stress Tensor
·El Solve Equations of Motion ..... . .. - ... -.. Integrate Acceleration .......... • . ... <>-- Interpolate Grid To Materi.ilHsoints
10 100 1000
Particles Per Patch
---- ... ..
10000
Figure 3: FLOP throughputs dropping off due to Ll conflict misses
0.95
0.9
c 0.85 0 . ~
0.8 ~ :5 0.75 0 (/) (/) 0.7 OJ ()
e 0.65 a..
OJ OJ
0.6 ~ OJ > « 0.55
0.5
0.45 10 100 1000 10000
Particles Per Patch
Figure 4: Processor Utilization vs. Patch Size
On the other hand, if patches are too large then there are not enough to expose sufficient parallelism to keep processors from stalling waiting for runnable tasks. Fortunately, patch sizes which maximize Ll utilization tend, in our experience, to avoid both of these pitfalls.
CONCLUSION
The Uintah Parallelism Infrastructure is a high-performance facility for building scalable scientific applications. Using careful placement of processors and memory, we can minimize variability in application execution. Furthermore, we utilize processor features to enable the application to measure its own performance, in situ. Using these measurements we can control scheduling of tasks on the parallel machine.
Currently we are running computational fluid dynamics (CFD) (specifically fire simulations) on up to 128 processors. The CFD code began as a serial Fortran code and has now been restructured on top of the UPI to achieve this parallelism. We are also running MPM simulations on up to 1024 processors.
Future Work
U sing the techniques discussed in this paper we have identified important performance bottlenecks in the Uintah PSE. In the future we will use this information to improve the overall performance and scaling of Uintah. In addition, we plan to extend these techniques to provide repeatable application performance for MPI-based applications.
REFERENCES [1] Blue mountain supercomputing platform.
http://www.lanl. gov /ascilbluemtnlbluemtn.html.
[2] Center for the Simulation of Accidental Fires and Explosions - Annual Report, Year 2. http://www.csafe.utah.edu/documents.
[3] mmci - memory management control interface. IRIX man page mmci(5).
[4] numa - non uniform memory access. IRIX man page numa(5) .
[5] R10000 Microprocessor User's Manual Version 2.0. http://www.sgi.com/processors/r 1 Oklmanual.html.
[6] S. Atlas, S. Banerjee, J.e. Cummings, PJ. Hinker, M. Srikant, J.VW. Reynders, and M. Tholburn. POOMA: A high-performance distributed simulation environment for scientific applications. In Supercomputing '95 Proceedings, December 1995.
[7] Sheila A. Faulkner. Performance impli-cations of process and memory placement using a multi-level parallel programming model on a cray origin 2000. http://www.nas.nasa.govrfaulknerinuma.html.
[8] Jim Laudon and Daniel Lenoski. The SGI Origin: A ccNUMA Highly Scalable Server. In Proceedings of the 24th International Symposium on Computer Architecture (ISCA), pages 241-251, June 1997.
[9] D. Sulsky, Z. Chen, and H. L. Schreyer. A Particle Method for History Dependent Materials. Comp . Methods Appl. Mech. Engrg, 118, 1994.
[10] Marco Zagha, Brond Larson, Steve Turner, and Marty Itzkowitz. Performance Analysis Using the MIPS R10000 Performance Counters. In Proceedings of Supercomputing '96, November 1996.
ACKNOWLEDGMENTS
This work was supported in part by awards from the DOE ASCI Program. We would like to thank our CSAFE Fire Spread, Container Dynamics, and High Energy Transformations colleagues for there input.