uk annuity price series, 1957–2002people.exeter.ac.uk/ipt201/research/cannon and tonks fhr... ·...
TRANSCRIPT

165
Financial History Review 11.2 (2004), pp. 165–96. © Cambridge University Press 2004Printed in the United Kingdom DOI: 10.1017/S0968565004000125
UK annuity price series, 1957–2002
EDMUND CANNON and IAN TONKS 1University of Bristol and University of Exeter
. . . but if you observe, people always live for ever when there is an annuity to be paid them;and she is very stout and healthy, and hardly forty. An annuity is a very serious business; itcomes over and over every year, and there is no getting rid of it.
Jane Austen, Sense and Sensibility (1811)
I
A life annuity is an income stream, which, in exchange for a lump sum, is paid to anannuitant over his or her remaining lifetime, and as such insures the annuitantagainst longevity risk. The existence of annuities can be traced back to Roman timesin valuing legacies2 and they were used throughout the Middle Ages, becomingpopular with governments as a method of raising money. The Equitable LifeAssurance Society was founded in 1762, and the following centuries saw the growthof life assurance companies and societies competing with the government to sellannuities. The UK government stopped selling annuities in 1928.3
The annuities market was given a boost under the 1956 Finance Act, whichimplemented the main recommendations of the 1954 Millard Tucker No. 2Committee on the introduction of tax-efficient personal pensions for the self-employed. This meant that the self-employed were treated the same as theemployed sector who had enjoyed the benefits of tax-efficient occupational pensionschemes for a number of years. Ever since 1956 the annuities market has been linkedwith pensions policy in the UK.
Following the 1956 Act, individuals could obtain tax relief on contributions intoan approved pension contract, and at retirement would be required to annuitise thefund that had been built up. Further, the returns to investments in the pension fundof life assurance companies during the accumulation part of the pension contract
1 This research was funded by the ESRC ‘Understanding the Evolving Macroeconomy’ Programmeunder grant L138 25 1031. We should like to thank Becca Fell, Alexa Hime and Sally Lane forentering the data; Pensions World for assistance in obtaining back copies; and helpful comments fromDuncan Ross and the anonymous referees.2 E. J. W. Dyson, ‘The history of individual annuity contracts’, Insurance Institute of London, 1969.3 M. Wadsworth, A. Findlater and T. Boardman, ‘Reinventing annuities’, Staple Inn Actuarial
Society, 2001.

166 edmund cannon and ian tonks
would be exempt from tax. An additional part of the 1956 Act also affected the taxtreatment of voluntary annuities: a fixed proportion of the annuity payment forpurchased life annuities was to be regarded as a run-down of capital, and an annui-tant would only be liable for income tax on the balance. These changes stimulatedthe demand for annuities in the UK, and Table 1 shows the sales of voluntaryannuities averaged over five-yearly intervals from the 1950s to the present day.
The numbers of annuities purchased each year vary greatly, though the value ofthe lump sum used to purchase an annuity contract has grown steadily from £106million pounds in the late 1960s to £650 million in the first half of the 1990s.Subsequently in the latter half of the decade the value of annuities premiums fell.
The 1956 changes introduced a new compulsory-purchase annuities market forthose who had built up a personal pension fund, distinct from the existing voluntaryannuities market. As noted by Finkelstein and Poterba,4 the difference between thevoluntary and compulsory annuities markets is that it is likely that selection effectsare more important in the former than the latter. Only individuals who expect tolive for a long time are likely to purchase a voluntary annuity, whereas compulsoryannuities are purchased as part of the terms of the pension contract. Initially thepensions annuity market had zero sales, since it would have been the young workingcohort in the late 1950s who would have started saving through a personal pension,and it is unlikely that this cohort would have annuitised immediately. By the 1990sthis compulsory annuity market was ten times larger than the voluntary annuitiesmarket, and it will continue to grow as the percentage of the population withpersonal pensions grows. Table 1 also records the growth in personal pensionsthroughout the second half of the last century.
The UK currently has three tiers of pension provision in operation. The first tieris the basic state scheme, which is unfunded and pays a flat-rate pension. With anunfunded scheme there is no underlying fund of assets (so current workers pay thepensions of the retired) and this type of scheme represents an intergenerational trans-fer between the working population and the retired population. Membership of thebasic state scheme is compulsory for all employed and self-employed workers withearnings above a small exception limit, and contributions are collected through thenational insurance system. The second tier is the State Earnings-Related PensionScheme (SERPS), which is also unfunded and pays a defined-benefit pension which isrelated to average earnings over the employee’s life. Membership is compulsory forall employees (but not the self-employed) unless the employee has contracted outinto a private pension scheme, and contributions are collected through the nationalinsurance system. SERPS was replaced in April 2002 by the State Second Pension,which provides more generous pensions to persons on low and moderate incomes,and gives pension entitlements to carers.
4 A. Finkelstein and J. M. Poterba, ‘Selection effects in the United Kingdom individual annuitiesmarket’, Economic Journal, 112 (2002).

167uk annuity pr ice ser ies , 1957–2002
Tab
le 1
.G
row
th in
num
ber a
nd v
alue
of p
urch
ased
life
ann
uitie
s, p
ensio
n an
nuiti
es a
nd o
utsta
ndin
g pe
rson
al p
ensio
n sc
hem
es 1
954–
2000
: an
nual
ave
rage
sov
er s
ucce
ssiv
e fiv
e-ye
ar p
erio
ds
1954
/55
1956
/60
1961
/65
1966
/70
1971
/75
1976
/80
1981
/85
1986
/90
1991
/95
1996
/00
Pan
el A
: N
ew p
urc
has
ed life
annuitie
s (im
med
iate
and d
efer
red)
No.
of n
ew a
nnui
ty p
olic
ies
per
year
. .
.33
.817
3.2
67.6
84.2
67.8
65.4
13.8
(000
s)Pr
emiu
ms
on n
ew im
med
iate
ann
uity
. .
.10
6.0
235.
315
9.6
394.
543
2.2
650.
444
4.8
polic
ies
(£m
)A
nnui
ty p
ay-o
uts
per
annu
m (
£m
)0.
71.
6.
12.7
44.0
25.1
66.2
80.5
129.
843
.8
Pan
el B
: N
ew p
ensi
on a
nnuitie
sPr
emiu
ms
on n
ew im
med
iate
pen
sion
annu
ities
(£
m)
2,79
4.6
5,17
8.4
Pens
ion
annu
ity p
ay-o
uts
per
annu
m (
£m
)27
6.4
440.
0
Pan
el C
: Per
sonal
pen
sions
in f
orc
eN
o. o
f Pol
icie
s (0
00s)
.83
.9.
.
620.
01,
309.
43,
151.
48,
835.
217
,916
.020
,634
.8Y
earl
y pr
emiu
ms
(£m
).
10.6
.
.68
.021
2.6
758.
12,
451.
64,
876.
26,
277.
3
Sour
ce: L
ife O
ffice
s’ A
ssoc
iatio
n; A
ssoc
iatio
n of
Bri
tish
Insu
rers
.

168 edmund cannon and ian tonks
In the third tier are forms of voluntary private pension provision, of which thereare two types: occupational and personal pension schemes. Contributions into theseschemes are made out of pre-tax income, so that contributions are effectivelysubsidised by the government. Occupational pension schemes are usually funded andrequire contributions throughout the employees’ working life. In a funded schemean employee (and/or employer) pays into a fund, which accumulates over time, andthen is allowed to draw on this fund in retirement. These schemes are provided byan employer and may pay on a defined-benefit or a defined-contribution basis. Defined-benefit schemes offer a pension, guaranteed by the employer, usually defined interms of some proportion of final-year earnings, and are related to the numberof years of employment. Defined-contribution (or money purchase) schemesare always funded and convert the value of the pension fund at retirement into anannuity. Under a defined-benefit scheme, the employer bears the risk of fundunder-performance; under defined-contribution schemes, the pensioner bears therisk of fund under-performance. In addition, a defined-contribution plan alsoexposes the pensioner to the risk of converting the fund into an annuity at a particu-lar point in time, although the 1995 Pensions Act allows a pensioner to defer theconversion of the fund into an annuity until age 75 and ‘draw-down’ the fund toprovide an income until annuitisation.
In the tax year ending in April 1996, 24.27 million persons paid national insurancecontributions which will entitle them to some part of the basic state pension atretirement.5 The percentage of the working population covered by each of thesecond and third tier schemes is given in Table 2. This table shows that out of about35 million people of working age, roughly 80 per cent are covered by a second- orthird-tier pension.
Up until the 1980s, pension provision had been a fundamental bedrock of thewelfare state (from the National Insurance Act 1946, which introduced the basic
Table 2. Employees covered by type of pension in UK
Numbers of persons Percentage of workingType of pension scheme (millions) population covered
Occupational pensions 10.5 30Appropriate personal pensions 5.6 16Personal pensions 4.6 13
(Not eligible for SERPS)SERPS 7.1 20Not covered by second/third tier 7.4 21
Source: Government Green Paper (ch. 2, paras. 15, 25, December 1998), and owncalculations.
5 Annual Abstract of Statistics, 1999, Table 10.2.

169uk annuity pr ice ser ies , 1957–2002
flat-rate pension, and the Social Security Pensions Act 1975 which introducedSERPS). Concerns about the state’s ability to pay for the state pension commit-ments, coupled with demographic trends of an ageing population, resulted in achange of policy in the 1980s, with an emphasis on the private-sector provision ofpensions. The government Green Paper 1998 reported that in 1960 there were overfour persons of working age for every pensioner; but by 2060 it is projected thatthere will only be two and a half persons of working age for every pensioner. Theimplication is that a declining workforce will have to support a growing number ofpensioners.
The Social Security Act 1980 replaced the indexation of the basic pension fromearnings growth to the change in the retail price index. Further, the Social SecurityAct 1986 reduced the pension benefits of SERPS, and encouraged individualemployees to opt out of SERPS and into a funded personal pension scheme, whichexplains the dramatic growth in personal pensions since 1988. The governmentGreen Papers of 1998 and 2002 both emphasise that the state provision of pensionswill decline, and individuals will be expected to contribute to third-tier schemes.This emphasis on the private sector to provide for pensions relies on a well-functioning annuities market in the decumulation phase of the pension plan,whereby individuals or group schemes can exchange their accumulated savings foran income until death. The government has become increasingly concernedabout the functioning of the annuities market, as evidenced by the publication of aconsultative document on the topic and the emphasis on annuities in the 2002Green Paper on pensions.6 Although, as shown by Yaari, risk-averse individualsshould optimally annuitise all of their capital at retirement, Mitchell, Poterba,Warshawsky and Brown note that the private annuity market remains small. Poterbasuggests a number of explanations for this ‘annuity puzzle’: load factors, the bequestmotive, precautionary savings, adverse selection, substitutes for the private annuitymarkets and behavioural reasons.7 But our ability to understand the reasons for thispuzzle is limited by the lack of data on annuity markets.
The UK annuities market is well developed and is of considerable interest toresearchers on pensions. Cross-sectional data on annuity rates for the last few years isreadily available from the web or commercial organisations and has already beenanalysed.8 There is, however, no long time-series data, in contrast to the USA where
6 Department of Social Security, A New Contract for Welfare: Partnership in Pensions (1998) Cm 4179;Inland Revenue, Modernising Annuities: A Consultative Document, 2002; Department for Work andPensions, Simplicity, Security and Choice: Working and Saving for Retirement (2002), Cm 5677.7 M. Yaari, ‘Uncertain lifetime, life assurance, and the theory of the consumer’, Review of Economic
Studies, 32 (1965); O. S. Mitchell, J. M. Poterba, M. J. Warshawsky and J. R. Brown, ‘New evidenceon the money’s worth of individual annuities’, American Economic Review, 89 (1999); J. M. Poterba,‘Annuity markets and retirement security’, Fiscal Studies, 22 (2001).8 M. Murthi, J. M. Orszag and P. R. Orszag, ‘The value for money of annuities in the UK: theory,
experience and policy’, Birkbeck College, London, discussion paper (1999); Finkelstein and Poterba,‘Selection effects’.

170 edmund cannon and ian tonks
annuity data are available from 1918.9 In this article we present annual UK annuityrates for 1957 to 2002 and describe how the data were collected. All of our data arefor voluntary annuities, since compulsory annuities were not quoted on the openmarket for most of the period: where both series are available they move closelytogether.
Our data are divided into two parts. From 1972 to 2002 we have collected data forlevel annuities with a five-year guarantee period for both men and women at a rangeof ages; over the period 1957 to 1973 we have data for level annuities with noguarantee period for men aged 65 only. The difference with respect to the guaranteeperiod is driven by availability of data. We only provide data for men aged 65 forthe earlier years because in the later period the series move so closely together thatthere is little to be gained by having series for a variety of ages.
All of our data are for level annuities, which have the disadvantage that they donot insure against inflation and have provided a steadily falling real income stream inthe inflationary environment of the second half of the twentieth century. However,the vast majority of annuities purchased over the relevant period were levelannuities, and although more sophisticated index-linked or escalating annuitiesexist, they are less popular.10 For purposes of comparisons across time, level annui-ties provide the best guide to the products readily available and actually chosen andwe believe that these would be the most appropriate prices to analyse given a choice.Since data on other annuities are not easily available for most of the period,however, this is a moot question.
The rest of this article is arranged as follows: Section II enumerates the issues andproblems raised by our data sources and how we ensure that these do not lead tosystematic biases in our data. Section III provides a detailed description of our datasources and the way that we have obtained an aggregate series. In Section IV weillustrate the data and discuss briefly the annual and monthly properties of the dataseries.
I I
Our data are constructed from quoted annuity prices in two trade magazines, Policyand Pensions World, with data from Money Management and Money Facts to fill in themissing periods. Annuity prices are usually quoted in the form of an annual annuitypayment of £X per £10,000 purchased (consideration or premium), which we referto as an annuity rate of X/10,000 per cent. On a monthly basis, annuity rates areavailable for a selection of annuity providers (life offices): the size and compositionof this selection changes over time, partly due to firms entering or leaving the
9 Department for Social Security, The Changing Welfare State: Pensioners’ Incomes (1986) has a graph ofsome data, but no further information. USA data is in M. J. Warshawsky, ‘Private annuity markets inthe United States: 1919–1984’, Journal of Risk and Insurance, 55 (1988).10 J. Stark, ‘Annuities: the consumer experience’, ABI Research Report (2002).
171uk annuity pr ice ser ies , 1957–2002
market, but partly due to rates not being quoted. There is nearly always a consider-able variation between the lowest and highest annuity rate quoted and for this reasonthe main series that we report are simple averages (means or medians) of the annuityrates that we have at each point in time as well as measures of the dispersion ofannuity rates.
If we wanted to know the best value annuity available at any point in time, theaverage measures would be inappropriate, since a well-informed investor wouldchoose to purchase an annuity with the highest rate available. For this reason we alsopresent data on the maximum annuity rate for which we have data, although thisstatistic is more susceptible to changes in the composition of annuity providers forwhich we have data. We do not know how easy it was for a potential annuitant toobtain information on annuity rates for much of the period: both Policy and PensionsWorld are specialist publications and unlikely to be widely available. The consumersmagazine Which? has both a wider readership and easier availability (e.g. throughpublic libraries) and this published surveys of annuity rates in 1964 and 1970. In bothissues readers were advised to contact Policy for more detailed information as well asan additional publication, Planned Savings. An additional consideration in comparingannuity rates is possible variation in levels of service, a consideration that we ignore.
Alternatively, if we wanted to know the typical annuity rate actually purchased, amore appropriate measure might be a weighted average of annuity rates, whereannuity rates were weighted by the number of policies sold by different companies.Unfortunately we do not have the relevant data to construct such weights.
Finally, we should also note that the rate offered for an annuitant of a given sexand age is also dependent on other considerations such as health and it might be thatsome life offices had customers with above or below average life expectancy (this isa separate consideration for annuities offered explicitly for impaired lives). Evidencethat variation in life expectancy experienced by different life offices is both large andstable over time is provided in reports of the Continuous Mortality InvestigationBureau.11 Since the inter-office comparisons are anonymised, we are unable tomatch the annuity rates with the life expectancies, but it is likely that some of thevariation in annuity rates is linked to variation in life expectancy.
During the periods September 1972 to November 1977 and monthly fromApril 1980 to May 1998, Pensions World published consistent series of data of non-escalating purchase annuities guaranteed for five years, for both men and women ofdifferent ages from a variety of different annuity providers. We have also used datafrom Money Management and Money Facts to fill in the missing periods 1978–80 and1998–2002 respectively. Unfortunately the annuity rates in Money Management andto a lesser extent those in Money Facts are not directly comparable with those ofPensions World and this means that we need to make some adjustments to fit theseries together: since this is a case of relatively small inter- or extrapolation, theseadjustments can be made with some confidence. The other major source of data is
11 Continuous Mortality Investigation Bureau, 13 (1993) and 20 (2001), Institute of Actuaries.
172 edmund cannon and ian tonks
The Policy for 1957–73. Again, this is not directly comparable to the data in PensionsWorld as it is for annuities with no guarantee period; we have accordingly presentedthese data as a separate series.
This leaves two issues the importance of which can be estimated internally fromour data, namely composition bias and stale/inaccurate prices. We discuss thegeneral problems that these issues raise before looking in detail at the publishedsources.
We know that the composition and number of firms quoted changes over time aswell as between sources. Where the sample of firms chosen is random, this will noton average affect our estimate of the average annuity rate but may affect any measureof the dispersion. More problematic, however, is the fact that the sample of firmschosen may not be random. This may happen in two ways. In the Pensions Worlddata from 1980 to 1998, the number of firms quoted regularly falls over time. Wehave been able to test the effect of this by looking at a constant subsample of firmsover the entire period and found that it makes no difference to our estimate of themean.
Annuity providers in the UK are life assurance companies, and the UK lifeassurance industry has witnessed a number of mergers over the last fifteen years.Table A6 provided by Watson Wyatt lists the major significant mergers over the lastfifteen years. The Sandler review of the retail savings industry noted that althoughthere had been a trend towards demutualization and mergers in the UK life industrythroughout the 1990s, ‘the market share of the leading (10 UK life) companies hadnot increased materially’.12 The reason that concentration has not been greatlyaltered is because most of this M&A activity has been from overseas firms, and therise of integrated financial organizations called bancassurance. Stark reports thatthere are approximately 13 life offices that regard individual annuity business asstrategically important, though she predicts that this number could fall to six overthe following ten years.13
In the Money Management data from 1978–9, the prices are for the best 20 firms.This would impart an upward bias to our average compared with a random sample,which in principle could be corrected by subtracting a suitable number from theseries (this is impossible in practice because we have no overlap period upon whichto calculate the correction factor). However, these data are being used to interpolatefor a small period and we overcame the upward bias problem by splicing the series.
The second problem is that some of the prices quoted might be stale or misquotedin the magazine: this certainly happens at least once in Money Management, when inthe April 1979 issue there are two annuity rates quoted for the firm ‘English’ for menaged 60 and 70: the previous month’s quote and a new quote (it is noteworthy thatthe same mistake is made in two separate tables). We overcome this problem by
12 R. M. Sandler ‘Medium and long-term retail savings in the UK’, HM Treasury (2002), p. 172.13 J. Stark, ‘The future of the pension annuity market – summary report’, Association of British
Insurers (2003).

173uk annuity pr ice ser ies , 1957–2002
looking at the prices of only those firms which have changed prices in a givenmonth. The disadvantage of using changed rates is that it sometimes reduces or eveneliminates the sample.
I I I
Figure 1 illustrates annual data series (simple averages of monthly data) for bothmales and females at a variety of ages. It can be seen that the different series movevery closely together, which is unsurprising since most of the time-series variation isdue to changes in interest rates. General findings are that annuity rates increase theolder the person is (and hence the lower life expectancy is) and are lower for womenthan men. These differences are roughly consistent with actuarial considerations oflife expectancy.
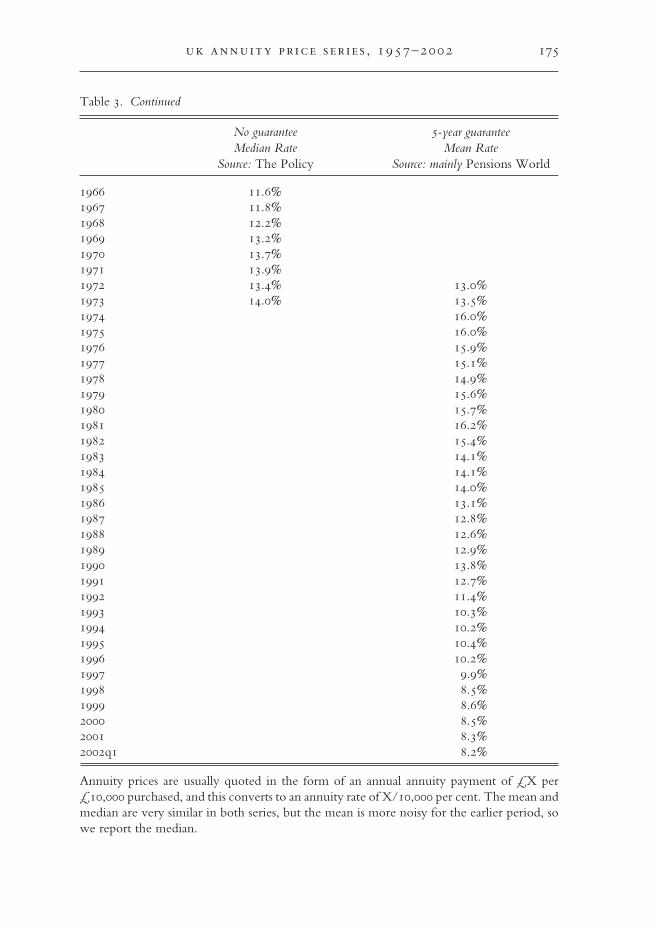
Figure 2 illustrates the complete annual series for males aged 65 over the longertime period. For 1972–2002 we plot the mean: as we discuss in Section IV, there issome evidence that for 1957–73 the mean is biased down by stale prices and so weplot the median for the earlier period. For comparison, the consol rate is also plottedas a representative long-term interest rate. On this graph it is clear to the eye that thedifference between the two series has narrowed over the entire time period, consis-tent with increased life expectancy. The gap narrows when interest rates are high,which is also unsurprising: if annuity rates are priced actuarially fairly, then the effectof mortality will be least when future payments are most heavily discounted. Ourpreferred data series, as most representative of UK annuity rates over the period1957–2002, are given in Table 3.
Figure 1. Annual annuity seriesSource: see text.

174 edmund cannon and ian tonks
Figures 3 and 4 show the maximum and minimum annuity rates (monthly data)for 1957–73 and 1980–98, respectively. The spread is often about 2 per cent,although, if the worst rates were not actually published then these figures mayunder-estimate the true spreads. To give some idea of the importance of stale pricesin our data, Figure 4 includes the maxima and minima based upon changed pricesalone: the picture is broadly similar. Indeed it is notable that the graphs for theminimum, maximum and average annuity price all move very closely together,showing how insensitive our conclusions are to the choice of summary statistic forthese data.
Figure 2. Annuity rate, male 65, levelSource: see text.
Table 3. Male aged 65, voluntary level annuities
No guarantee 5-year guaranteeMedian Rate Mean Rate
Source: The Policy Source: mainly Pensions World
1957 10.4%1958 10.8%1959 10.7%1960 10.7%1961 10.9%1962 11.1%1963 11.1%1964 11.0%1965 11.3%
175uk annuity pr ice ser ies , 1957–2002
Table 3. Continued
No guarantee 5-year guaranteeMedian Rate Mean Rate
Source: The Policy Source: mainly Pensions World
1966 11.6%1967 11.8%1968 12.2%1969 13.2%1970 13.7%1971 13.9%1972 13.4% 13.0%1973 14.0% 13.5%1974 16.0%1975 16.0%1976 15.9%1977 15.1%1978 14.9%1979 15.6%1980 15.7%1981 16.2%1982 15.4%1983 14.1%1984 14.1%1985 14.0%1986 13.1%1987 12.8%1988 12.6%1989 12.9%1990 13.8%1991 12.7%1992 11.4%1993 10.3%1994 10.2%1995 10.4%1996 10.2%1997 9.9%1998 8.5%1999 8.6%2000 8.5%2001 8.3%2002q1 8.2%
Annuity prices are usually quoted in the form of an annual annuity payment of £X per£10,000 purchased, and this converts to an annuity rate of X/10,000 per cent. The mean andmedian are very similar in both series, but the mean is more noisy for the earlier period, sowe report the median.

176 edmund cannon and ian tonks
Figure 3. Annuity rates, male 65, no guarantee, 1957–73Source: The Policy, 1957–73, various issues.
Figure 4. Maximum and minimum annuity rates, 1980–98Source: Pensions World, 1980–98, various issues.
Our final consideration is the extent to which annuity rates vary with size ofpurchase. Data are available for adjustments based on size of annuity in both ThePolicy and Pensions World in the 1970s. Figures 5 and 6 illustrate the net annuity rate(after all adjustments and charges are taken into account) for annuity purchases ofmultiples of £1,000 for two sample months. Figure 5 shows a steep increase in theannuity rate for relatively small purchases, but this is driven largely by two or threecompanies which pull down the average and the minimum and perhaps ought to be

177uk annuity pr ice ser ies , 1957–2002
ignored. Other than this, in both cases the annuity rate rises very slightly with thesize of purchase.
Our data do not allow us to determine how annuity rates depended uponpurchase price for later periods. However, Finkelstein and Poterba14 report that the
Figure 5. Annuity rates and purchase price, January 1965Source: see text.
Figure 6. Annuity rates and purchase price, Sept–Oct 1972Source: see text.
14 A. Finkelstein and J. M. Poterba, ‘Adverse selection in insurance markets: policyholder evidencefrom the UK annuity market’, Journal of Political Economy, 112 (2004).

178 edmund cannon and ian tonks
anonymous insurance company in their analysis used the following formula forpricing annuities over the period 1981 to 1998: if the annuity rate for a £10,000purchase is X, then annuity rate for a purchase of P is
PX P f+ −( )10 000
10 000
,
,
where the policy fee f = £18 in 1998. The differences in the average annuity rate fora £5,000 purchase and a £15,000 purchase illustrated in Figures 5 and 6 are 0.11 percent and 0.05 per cent respectively, slightly lower than the 0.18 per cent suggestedby this formula. Since there is some evidence that there is non-linearity in therelationship and given changes in prices over the period due to inflation, thesefigures seem reasonably close to each other.
IV
This section describes in detail the construction of our time series on annuity ratesusing the original sources. The data from Pensions World, The Policy, Money Manage-ment and Money Facts were single-typed directly in Excel. Where data were providedfor ages other than 60, 65 and 70 it was ignored as were special rates for smokers.The entry for ‘Equity and Law’ female aged 65 in issues January/February 1975 toMarch 1977 was amended from 1500 to 150 and no other alterations were made.The data from Pensions World from 1980 to 1998 was typically electronically scannedand recognised using the software package FineReader 4.0, after training the softwareto recognise the particular font: apart from occasional difficulty in recognising thedecimal point the software had 100 per cent success in recognition. All of these serieswere then manually checked. The final series were also checked whenever the meanand median deviated significantly or the average for a subsample was much differentfrom the average for the whole.
(a) The Pensions World dataThe longest consistent series in our data is taken from the trade magazine PensionsWorld, which was first published in 1972. Initially the magazine was publishedbimonthly, converting to a monthly publication in July 1975. Data was published for1972–7 and 1980–98. From May 1998 annuities data have continued to be publishedbut only for three companies (initially top three, then first, fifth and tenth). At thesame time as this change there were two other changes: first, the data switched fromannuities guaranteed five years to annuities with no guarantee; second the quotesgiven are for £1,000 purchased for 1972–98 and then for £100,000 purchased from1998 onwards. To the extent that annuity rates vary with the amount purchased andthat the real value of £1,000 has changed over the period, we should attempt toadjust for the annuity rates paid on an annuity of a typical size. However, it isimpossible for us to do this even for the period 1972–98, since we have no idea ofthe typical size of annuity purchase: also we have no data on how annuity ratesvaried with purchase price over the period 1980–98. We shall discuss below the
179uk annuity pr ice ser ies , 1957–2002
evidence we have on this issue for the period 1972–7. What is clear is that there is aconsiderable discontinuity in 1998, with a big change in the size of the annuity forwhich a rate is quoted and a considerable reduction in the number of firms quoted,making it impossible to estimate a mean annuity rate after 1998 from this datasource. For this reason we have not made extensive use of the Pensions World data forthe period from 1998–2002.
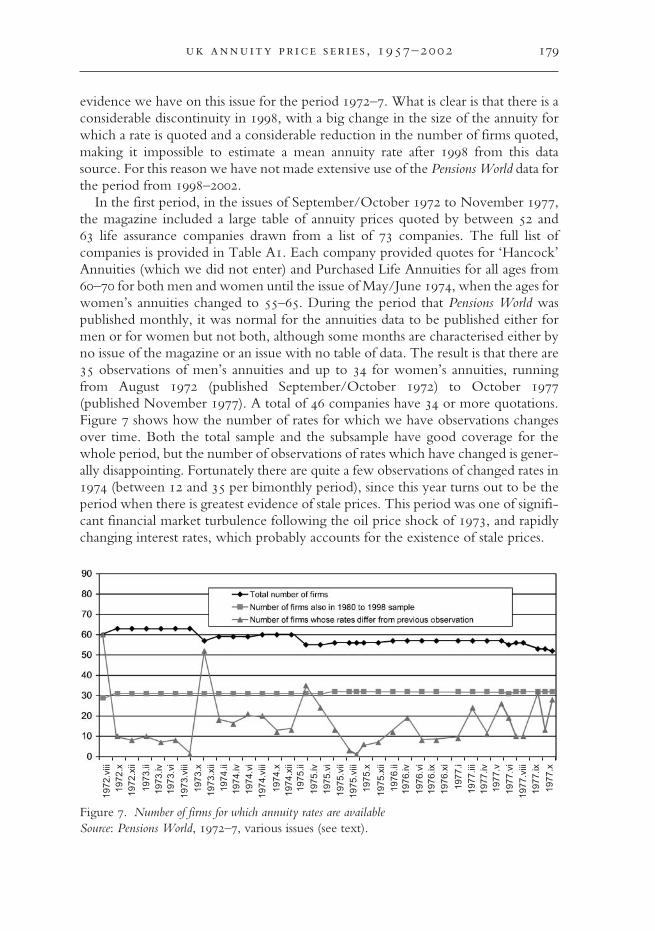
In the first period, in the issues of September/October 1972 to November 1977,the magazine included a large table of annuity prices quoted by between 52 and63 life assurance companies drawn from a list of 73 companies. The full list ofcompanies is provided in Table A1. Each company provided quotes for ‘Hancock’Annuities (which we did not enter) and Purchased Life Annuities for all ages from60–70 for both men and women until the issue of May/June 1974, when the ages forwomen’s annuities changed to 55–65. During the period that Pensions World waspublished monthly, it was normal for the annuities data to be published either formen or for women but not both, although some months are characterised either byno issue of the magazine or an issue with no table of data. The result is that there are35 observations of men’s annuities and up to 34 for women’s annuities, runningfrom August 1972 (published September/October 1972) to October 1977(published November 1977). A total of 46 companies have 34 or more quotations.Figure 7 shows how the number of rates for which we have observations changesover time. Both the total sample and the subsample have good coverage for thewhole period, but the number of observations of rates which have changed is gener-ally disappointing. Fortunately there are quite a few observations of changed rates in1974 (between 12 and 35 per bimonthly period), since this year turns out to be theperiod when there is greatest evidence of stale prices. This period was one of signifi-cant financial market turbulence following the oil price shock of 1973, and rapidlychanging interest rates, which probably accounts for the existence of stale prices.
Figure 7. Number of firms for which annuity rates are availableSource: Pensions World, 1972–7, various issues (see text).
1972
.viii
1972
.x19
72.x
ii
1973
.ii19
73.iv
1973
.vi
1973
.viii
1973
.x19
73.x
ii19
74.ii
1974
.iv19
74.v
i19
74.v
iii
1974
.x19
74.x
ii19
75.ii
1975
.iv19
75.v
i19
75.v
ii19
75.v
iii19
75.x
1975
.xii
1976
.ii19
76.iv
1976
.vi
1976
.ix19
76.x
i
1977
.i19
77.ii
i19
77.iv
1977
.v19
77.v
i19
77.v
iii19
77.ix
1977
.x

180 edmund cannon and ian tonks
As a result of requests from the readership of Pensions World, the magazineresumed publication of annuity rates monthly in April 1980, quoting rates for malesaged 60, 65 and 70 and females aged 55, 60 and 65. There were no marginal- orfootnotes to these tables and hence we have no information on charges, on howrates varied with the size of the annuity or any other conditions or late alterations.
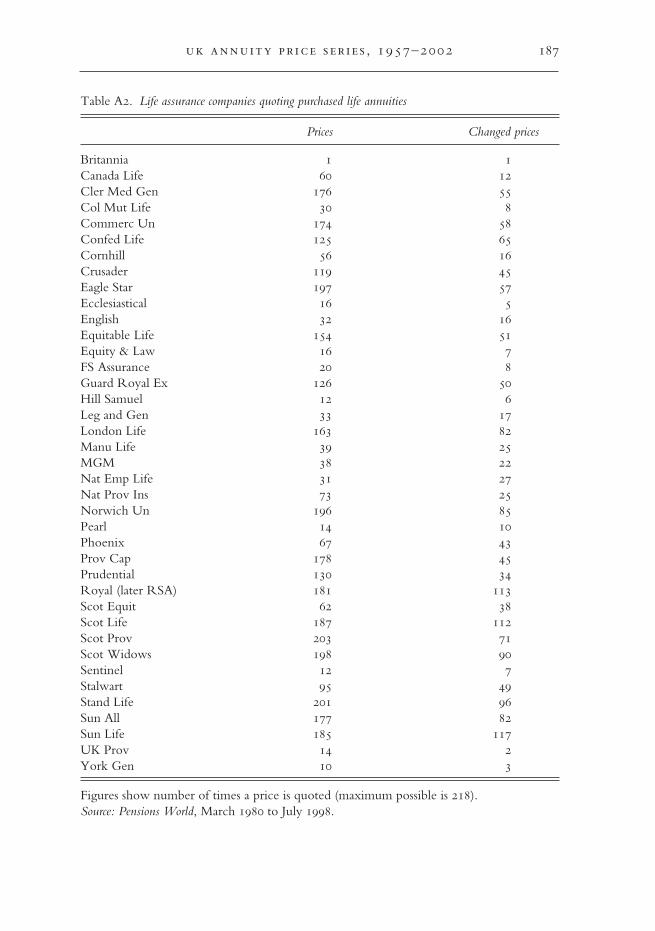
The list of firms from which quotations were obtained was reduced to 39 with thetypical number of firms quoted being 18 (see Table A2). The 39 firms can be dividedinto two groups: for 18 of the firms there is an annuity rate quoted for over half ofthe months and for 18 there is an annuity rate quoted for less than 20 per cent of themonths. Figure 8 shows the number of firms on which our average is based overthe period 1980–98. It can be seen that the firms for which relatively few prices arereported are particularly prominent in the early years and thus the compositionof firms changes systematically over the period. For this reason we use not only theaverage of all firms reported in any given month but also the average of the 18heavily reported firms. We isolate these 18 firms for the previous period 1972–7 aswell to ensure that the averages from the two period are comparable.
As discussed above, we are concerned about the possibility of stale or inaccurateprices. To overcome this situation we have also considered using only those rates offirms which have changed since the previous month. The corresponding numbersof firms for which a changed rate is available are also shown in Figures 7 and 8:since the number is often quite small, the average rate arising from this subset iscorrespondingly more volatile.
Figure 8. Number of firms for which annuity rates are available, 1980–98Source: Pensions World, 1980–98, various issues (see text).
181uk annuity pr ice ser ies , 1957–2002
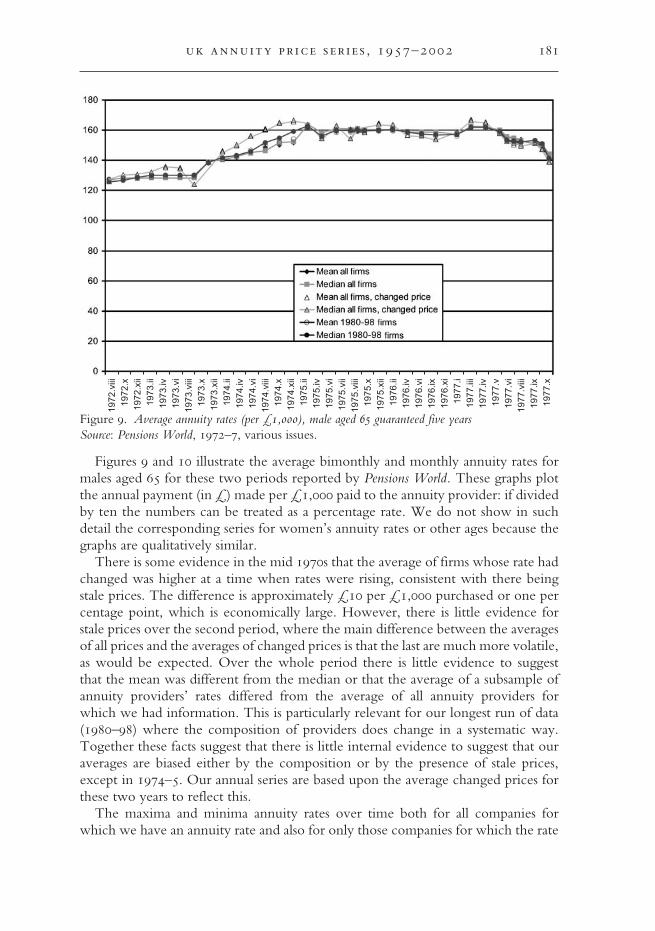
Figures 9 and 10 illustrate the average bimonthly and monthly annuity rates formales aged 65 for these two periods reported by Pensions World. These graphs plotthe annual payment (in £) made per £1,000 paid to the annuity provider: if dividedby ten the numbers can be treated as a percentage rate. We do not show in suchdetail the corresponding series for women’s annuity rates or other ages because thegraphs are qualitatively similar.
There is some evidence in the mid 1970s that the average of firms whose rate hadchanged was higher at a time when rates were rising, consistent with there beingstale prices. The difference is approximately £10 per £1,000 purchased or one percentage point, which is economically large. However, there is little evidence forstale prices over the second period, where the main difference between the averagesof all prices and the averages of changed prices is that the last are much more volatile,as would be expected. Over the whole period there is little evidence to suggestthat the mean was different from the median or that the average of a subsample ofannuity providers’ rates differed from the average of all annuity providers forwhich we had information. This is particularly relevant for our longest run of data(1980–98) where the composition of providers does change in a systematic way.Together these facts suggest that there is little internal evidence to suggest that ouraverages are biased either by the composition or by the presence of stale prices,except in 1974–5. Our annual series are based upon the average changed prices forthese two years to reflect this.
The maxima and minima annuity rates over time both for all companies forwhich we have an annuity rate and also for only those companies for which the rate
Figure 9. Average annuity rates (per £1,000), male aged 65 guaranteed five yearsSource: Pensions World, 1972–7, various issues.
1972
.viii
1972
.x19
72.x
ii19
73.ii
1973
.iv19
73.v
i19
73.v
iii19
73.x
1973
.xii
1974
.ii19
74.iv
1974
.vi
1974
.viii
1974
.x19
74.x
ii19
75.ii
1975
.iv19
75.v
i19
75.v
ii19
75.v
iii19
75.x
1975
.xii
1976
.ii19
76.iv
1976
.vi
1976
.ix19
76.x
i19
77.i
1977
.iii
1977
.iv19
77.v
1977
.vi
1977
.viii
1977
.ix19
77.x

182 edmund cannon and ian tonks
Figure 10. Different average annuity rates (per £1,000), male aged 65, level, guaranteed five yearsSource: Pensions World, 1980–98, various issues.
has changed have already been illustrated in Figure 4. It is not possible to make anystrong inferences about the difference between the maximum and minimum overthe period because the composition of firms is changing: a constant set of firmswould be relatively small and hence tend to underestimate the range of pricesavailable. This is even more so with the series based on changed prices: indeed inSeptember 1992 we only have a record of one company changing price and hencethe maximum and minimum are the same on the graph, which is obviously a poorguide to the range of prices available at that time. If anything, however, the range ofannuity rates seems to be fairly constant and to remain about £10 per £1,000 or1 per cent. Since annuity rates at the end of the period are about £100 per £1,000,this implies that choosing the wrong provider could reduce the value of one’spension by one-tenth, which is economically very large.
(b) Filling the missing observations using Money Facts and Money ManagementThe gaps in the Pensions World series are filled with data from Money Management andMoney Facts, which brings us to the problem of maintaining consistency between thedata in Pensions World and the data in the other two sources.
Annuities in Money Management are quoted for men and women aged 65 and menaged 70: summary details are provided in Table A3. Annuity rates are always quotedfor twenty companies, although unlike in Pensions World the twenty companies inany given month may differ for different ages and genders. The rates quoted appearto be from the best twenty annuity providers, rather than a random sample ofcompanies. The rates are drawn from a total of 48 annuity providers for males aged65 and 50 annuity providers for females aged 65. We exclude the annuity rate for theRoyal National Pension Fund for Nurses (RNPFN), which is noted as beingunavailable to the general public, so our average is sometimes based on 19 providers’rates. There are very few footnotes and we do not have any data for November
183uk annuity pr ice ser ies , 1957–2002
1978, so the maximum number of observations is fifteen: twelve annuity providershave rates quoted for ten or more months.
The data in Money Management are available from December 1977 to March1979, so there is no overlap period with Pensions World. Furthermore the MoneyManagement data are for a purchase of £10,000 instead of £1,000 and are for adifferent form of annuity, namely for annuities paid half yearly in arrears and notguaranteed, whereas the data in Pensions World are for annuities paid monthly inadvance, guaranteed for five years: fortunately the data in Money Management arebeing used merely to fill in a small gap in the otherwise consistent Pensions Worldseries. As discussed above, the difference between rates for £1,000 and £10,000 maynot be economically significant. The final issue is that the average annuity rate fromthis source may be biased upwards because the rates are taken disproportionatelyfrom firms offering good rates, but we are unable to correct for this problem.
Since the objective is to have a consistent time series despite having data on twodifferent sorts of annuity, we infer guaranteed monthly rate from the Money Manage-ment data on non-guaranteed half-yearly annuity rates. Our inference to correct forthis definitional difference is based on some simple actuarial calculations as follows.Annuities paid half yearly in arrears result in payments being made on average aquarter of a year later, so we subtracted one-quarter of the then prevailing consolrate (actually 11.5 per cent) to effect the increased discount given to payments madefurther in the future.
The probabilities of dying for a man between the age of 65 and the ages of 66–70can be written 1 − pt,66,65, 1 − pt,67,65, etc., where pt,k,65, is the probability of someoneaged 65 in year t living to age k (and hence receiving the annuity payment) for thetwo years 1978 and 1979. We write the headline annuity rate (i.e. the payment peryear) as A per £1 paid to the annuity provider on retirement and assume a constantinterest rate r equal to the contemporaneous consol rate. The present value (ormoney’s worth) of an annuity guaranteed five years is
( ) ( )70
, ,6566 71
1 1k kt t t k
k k
M A r rπ∞
− −
= =
≡ + + + ∑ ∑
whereas that not guaranteed five years is
( ){ }, ,6566
1 kN Nt t t k
k
M A rπ∞
−
=≡ +∑ .
Finkelstein and Poterba have argued that the money’s worth for the two types ofannuities will differ because of adverse selection effects: individuals with privateinformation that they are likely to be shorter-lived self-select into annuities guaran-teed for five years and thus the true money’s worth for the guaranteed annuityshould be based on lower survival probabilities.15 Since we are unable to identify thetrue survival probabilities the money’s worth appears to be higher. Then, assuminga constant interest rate,
15 Finkelstein and Poterba, ‘Selection effects’.

184 edmund cannon and ian tonks
( )( )π −
=− = − + ≈∑
7065
, ,6566
1 1 0.37N
kt tt kN
kt t
M Mr
A A
where the number 0.37 arises from the data for a male aged 65 and the interest ratesprevailing at that time. Rearranging this expression we obtain
=+
.0.37
tt N N
t t
MA
M A
Finkelstein and Poterba report 1998 money’s worth figures of 0.862 for annuities,male 65 with no guarantee and 0.85 for a guarantee of five years and we use thesefigures to construct Figure 2, with analogous adjustments made for other ages.16
The data in Money Facts are defined similarly to those in Pensions World, but aredrawn from a somewhat different and much shorter list of companies: the total listcontains 24 companies, detailed in Table A4. In addition the rates are for a purchaseof £10,000 instead of £1,000, which problem we ignore. As with the other datasources there are many firms whose rate does not change for considerable periodsof time and thus we compare the average of all annuity rates with the average ofannuity rates which have changed in the previous month. However, the totalnumber of prices only averages just over eleven and the number of changed pricesaverages just under four. This means analysing the changed prices is not particularlyinformative and we only report the averages of all prices in our final series. Althoughthis is a smaller sample than in Pensions World, the difference between the minimumand average price remains about one percentage point.
More worrying, the annuity rates for the subset of companies in both sources aredifferent. We have contacted the relevant annuity providers to seek an explanationfor this and have been told that it arises due to different commission charges beingincluded in the two quotes (e.g. one included a commission of 1 per cent and theother a commission of 1.3 per cent). To overcome this difference we have splicedthe series together using a shift factor derived from the overlap period of fourmonths (1998 January–April), which turns out to be 0.38 per cent, comfortably closeto the figure we might expect given the commission charges quoted.
(c) The Policy dataThe data from Policy start in 1957: we cannot find earlier data and there is a goodreason why data were published from that time on, namely the boost given tothe voluntary annuity market by the 1956 Finance Act, which removed a taxdiscrepancy on voluntary annuities. The number of firms quoted rises fairly steadilyfrom 63 to 101, with the total number of firms quoted over the whole period being129; these are listed in Table A5. Of these, 79 provide a quote for more than 50 percent of the months for 1957–73. Prices appeared to change for this period even lessthan in the later period, perhaps indicative of relatively stable long-term interestrates: for 70 per cent of the months the number of firms who changed their rates wasin single figures.
16 Finkelstein and Poterba, ‘Selection Effects’, Table 5.

185uk annuity pr ice ser ies , 1957–2002
The maxima and minima prices have already been plotted in Figure 3. Averagesare plotted in Figure 11. It is certainly the case that the mean of all prices is differentfrom averages of changed prices or the mean: there appears to be a lower tail ofpossibly stale prices. For this reason we have used the median in constructingthe annual series: it is slightly smoother than the changed series and has the samecharacteristics.
V
This article has explained the construction of a representative annuity price series forthe UK annuity market in the period 1957–2002. The start of this period marked awatershed in pensions policy in general and annuities in particular, since the 1956Finance Act allowed for the introduction of tax-efficient personal pensions, andremoved the distortionary capital taxes on voluntary annuities. Our annuityseries were constructed from the quotes of annuity providers from various trademagazines. We have allowed for a composition bias – changing identities of annuityproviders, and the problem of stale price quotes – and demonstrated that ourconstructed series are robust to these concerns. We have found some evidence thatannuity rates rise slightly with the size of purchase.
Authors’ address:Department of EconomicsUniversity of Bristol8 Woodland RoadBristol BS8 [email protected]@ex.ac.uk
Figure 11. Annuity rates, male 65, no guaranteeSource: Policy, 1957–73, various issues.

186 edmund cannon and ian tonks
Table A1. Life assurance companies quoting purchased life annuities
Arrow Life 5 Nat Mut of Austral 35Aust Mut Prov 35 Nat Mut Life Ass 15Avon 29 Nat Prov Inst 19Bedford Life 32 NFU Mutual 18British Life 13 New Ireland 14Canada Life 7 Norwich Union 35Cannon 27 Pearl 35Charter Japhet 23 Phoenix 35Clerical, Med + Gen 28 Pioneer Life 7Ciy of Glasgow 7 Prov Life Assoc of London 35Colonial Mut Life 35 Prov Mut Life 35Commercial Union 34 Prov Life 35Confed Life 35 Prudential 35Cornhill 35 Reliance Mut 34Crusader 35 Royal 35Eagle Star 35 Royal Nat Nurses 35Ecclesastical 35 Scot Amicable 31Economic 28 Scot Equitable 35English 34 Scot Life 35Equit Life 35 Scot Mutual 34Equity and Law 35 Scot Prov 35Friends Prov 35 Scot Widows 35FS Assurance 35 Sentinal 35Guardian 34 Slater Walker 30Hill Samuel Life 34 Standard Life 35Hodge 14 Sun Alliance 35International Life 5 Sun Life 35Irish Life 7 Swiss Life 35Legal & Gen 35 Trident 35Life Assoc of Scot 35 Ulster 14Lifeguard 35 UK Prov 35London Indem 14 Welfare 35London Life 35 Windsor Life 35Marine 35 Yorkshire 35Minster 14 Zurich Life 3Nat Farm Union 14
Figures show number of times a price is quoted (maximum possible is 35).Source: Pensions World, 1972–7, various issues.
APPENDIX
187uk annuity pr ice ser ies , 1957–2002
Table A2. Life assurance companies quoting purchased life annuities
Prices Changed prices
Britannia 1 1Canada Life 60 12Cler Med Gen 176 55Col Mut Life 30 8Commerc Un 174 58Confed Life 125 65Cornhill 56 16Crusader 119 45Eagle Star 197 57Ecclesiastical 16 5English 32 16Equitable Life 154 51Equity & Law 16 7FS Assurance 20 8Guard Royal Ex 126 50Hill Samuel 12 6Leg and Gen 33 17London Life 163 82Manu Life 39 25MGM 38 22Nat Emp Life 31 27Nat Prov Ins 73 25Norwich Un 196 85Pearl 14 10Phoenix 67 43Prov Cap 178 45Prudential 130 34Royal (later RSA) 181 113Scot Equit 62 38Scot Life 187 112Scot Prov 203 71Scot Widows 198 90Sentinel 12 7Stalwart 95 49Stand Life 201 96Sun All 177 82Sun Life 185 117UK Prov 14 2York Gen 10 3
Figures show number of times a price is quoted (maximum possible is 218).Source: Pensions World, March 1980 to July 1998.

188 edmund cannon and ian tonks
Table A3. Life assurance companies quoting purchased life annuities
Male 65 Female 65 Male 65 Female 65
AMP 1 2 Phoenix 5 6Avon = NFU 12 9 Pioneer Life 8 11Canterbury Life 6 6 Property, Equity and Life 5 6Coop 3 2 Providence Capitol 0 0Cornhill 1 0 Provident Mutual 10 7Crusader 15 15 Provident Life 1City of Westminster 2 1 Provincial Life 60Eagle Star 13 13 Prudential 2 4Ecclesiastical 2 1 Reliance Mut 6 6English 13 10 Royal 10 11Equitable Life 9 9 Schroder Life 1 6Equity & Law 0 1 Scot Am 7 7Excess Life 7 6 Scot Equit 11 10Friends’ Provident 5 7 Scot Life 13 11Guardian 2 2 Scot Mut 1 3Hill Samuel 0 0 Scot Prov 10 14Irish Life 3 3 Scot Widows 4 5Legal & General 1 1 Sentinel 6 6Life Assoc of Scot 7 9 Sun Alliance 1 2London Life 11 11 Sun Life 12 13Manulife 6 6 Target Life 15 10MGM 11 11 Time 3 4NEL 9 8 Trident Life 6 6Norwich Union 1 1 UK Provident 1 1Pearl 5 2 Yorks General 3
Figures show number of times a price is quoted (maximum possible is 15). The companiesalso quoted for annuity rates for different ages.Source: Money Management, Dec. 1977 to March 1979.

189uk annuity pr ice ser ies , 1957–2002
Table A4. Life assurance companies quoting purchased life annuities
Prices Changed prices
AXA Equity & Law 1 1Abbey Life 21 11AXA Sun Life 14 1Btittannic Assce 0 0Canada Life 50 21Carlyle Life 23 8Commercial Union 8 3Equitable Life 35 16Friends Provident 46 11Genrali 5 4Norwich Union 43 12RNPF Nurses 4 2GE Life 27 1Hodge Life 13 1Royal Liver 33 6Scot Amicable 46 16Scot Equitable 50 17Scot Life 8 4Scot Widows 11 5Stalwart 21 15Stalwart Assurance 21 14Standard life 50 18Sun Life 27 10Sun Life of Canada 2 0
Figures show number of times a price is quoted (maximum is 51).Source: Money Facts, Jan. 1998 to March 2002.

190 edmund cannon and ian tonks
Table A5. Life assurance companies quoting purchased life annuities
Prices Changed prices
Abbey Life 96 4African Life 195 6Alliance 123 9American Life 11 1Atlas 171 25Australian Mut Prov 137 13Avon 195 23Beacon 123 10Bedford Life 144 26Bradford 96 14Britannic 195 17British Life 144 9British National 195 20Caledonian 195 21Canada Life 195 47Cannon 12 5Citibank 12 1City of Glasgow 36 1City of Westminster 60 6Champion 24 2Clerical, Medical 195 14Colon Mutual 183 11Commercial Union 195 36Confed Life 84 16Consumers life 108 7Contingency 48 4Coop 195 18Cornhill 84 10Coronet 84 6Crown Life 24 1Crusader 195 26Dominion-Lincoln (later Schroder) 85 4Eagle Star 195 29Ecclesiastical 144 19Economic 84 11English 60 8Equit Life 195 29Equity and Law 195 22Excess Life 84 16Fordham Life 24 1Friends Prov 195 20General Life 183 13Gresham 195 26Guardian 195 27Hill Samuel (see Noble Lowndes)

191uk annuity pr ice ser ies , 1957–2002
Table A5. Continued
Prices Changed prices
Hodge Life 96 18Imperial Life of Canada 84 9Indemnity Guarantee 72 8International Life UK 48 7Investment Annuity 84 8Irish Assurance 38 2Irish Life 157 25Langham Life (see Migdal-Binyan)Law Union and Rock 195 25Legal & Gen 195 30Licenses and General 171 20Life Assoc of Scot 195 29Life Casualty and Gen (later Windsor) 106 7Lifeguard 120 20Lloyds Life 12 3Liverpool London & Globe 87 10London & Edinburgh 96 4London and Manchester 195 15London Assurance 123 12London Indemnity 108 26London Life 195 50Manufacturers Life 147 17Marine and General 195 12Medical Sickness 195 15Midland 183 15Migdal-Binyan (later Langham Life) 168 4Minister 114 21Nat & Colonial 39 3Nation life 120 6Nat Emp Life 167 13Nat Farmers 195 24Nat Mut of Austral 171 16Nat Mut Life 159 11Nat Provident 195 24New Ireland 55 8Noble Lowndes Annuities 144 33North Brit & Mercantile 171 25Northern 147 13Norwich Union 195 32Occidental 96 3Pearl 195 25Pendle 12 1Phoenix 195 19Pioneer 195 29

192 edmund cannon and ian tonks
Table A5. Continued
Prices Changed prices
Provident Life Ass 195 19Prov Mut 195 26Provincial Life 60 14Prudential 195 37Refuge 195 19Reliance Mut 195 20Royal Exchange 171 25Royal Insurance 195 40Royal London 195 9Royal Nat PF Nurses 188 14Save & Prosper 12 2Schroder Life (see Dominion Lincoln)Scot Amicable 183 16Scot Equitable 195 25Scot Life 195 21Scot Mutual 195 18Scot Prov 195 40Scot Union &Nat 135 18Scot Widows 195 27Sentinel 195 17Slater, Walker 24 7Southampton 96 8Stamford 96 12Standard 195 27Sun Alliance and London (previously three 84 14
companies: Alliance; Beacon and London)Sun Life of Canada 144 38Sun Life Assurance 111 14Swiss Life 72 12Target Life 0 0Time 36 1Trident 48 14Triumph 36 1Ulster Scot 84 9UK Temperance 195 15Unitholders Prov 48 10University Life 167 21Welfare 84 11Wesleyan and General 195 8Western Australian 87 2Windsor Life (see Life Casualty and General)Yeoman 96 16Yorks 159 16Yorkshire General Life 60 13
Figures show number of times a price is quoted (maximum is 213).Source: Policy, March 1957 to Dec. 1973.

193uk annuity pr ice ser ies , 1957–2002
Table A6. Acquisitions of UK life assurers, 1986–2000
Approximate Nationalitydate Insurer acquired Acquirer of acquirer
Jan-86 British National Citibank USJan-86 Cornhill Allianz GermanyJan-86 Providence Capitol Old Mutual South AfricaFeb-86 Tyndall Aetna USApr-86 UKPI* Friends Provident UKSept-86 Schroder National Mutual AustraliaMay-87 City of Westminster AGF FranceJune-87 Target TSB Group UKAug-87 Merchant Investors Cornhill UKOct-87 Equity & Law Axa FranceOct-87 Hill Samuel TSB Group UKOct-87 Consolidated RCK Holdings USMay-88 London Lifei AMP AustraliaSept-88 Financial Assurance Allegiance Capitol USDec-88 Abbey Lifei Lloyds Bank UKMar-89 Sentinel Century UKJuly-89 Framlington Skandia Life UKAug-89 Prolific Hafnia DenmarkSept-89 City of Edinburgh Life Century UKOct-89 Windsor Life New York Life USNov-89 Devonshire Life American Express USNov-89 FS Assurance* Britannia Building Society UKNov-89 Pearl AMP AustraliaJan-90 General Portfolio GAN FranceJan-90 Premium Life Management buy-out UKApr-90 Time Assurance* Templeton International USJune-90 NEL Group UNUM/Century US/UKJuly-90 Victory Re Nationale Nederlanden NetherlandsOct-90 Pioneer Mutual* Swiss Life SwitzJan-91 Regency Life Aegon NetherlandsJune-91 Crusader Britannia Building Society UKDec-91 Gresham Life Windsor Life UKDec-91 Scottish Mutual* Abbey National UKDec-91 Sun Life UAP/Liberty Life France/
South AfricaSept-92 CCL Century UKDec-92 Prolific Scottish Provident UKDec-92 Sterling Life Consolidated Life UKMay-93 Interlife SE Banken SwedenMay-93 Aetna Windsor Life UKJune-93 Citibank Lincoln National UK

194 edmund cannon and ian tonks
Table A6. Continued
Approximate Nationalitydate Insurer acquired Acquirer of acquirer
Sept-93 Life Association of Britannia Building Society UKScotland
Oct-93 Acuma United Friendly UKOct-93 NM Life Friends Provident UKOct-93 City of Westminster Irish Life IrelandDec-93 Scottish Equitable* Aegon, 40% stake initially NetherlandsDec-93 Economic Management Buy Out UKMay-94 Templeton Life Family Assurance UKMay-94 Stalwart European Acquisition CapitalMay-94 Victory Re (NRG) Employers ReAug-94 Confederation Life Sun Life of Canada UKSept-94 Consolidated Life GE Capital USDec-94 Windsor Life St James’ Place Capital (part only) UKJan-95 Prosperity Financial Century Life UK
ServicesFeb-95 Liberty Life Lincoln National UKFeb-95 Pegasus Assurance Scottish Mutual UKFeb-95 ManuLife Financial Canada Life CanadaFeb-95 Crown Financial Windsor Life UK
ManagementApr-95 Laurentian Financial Lincoln National UKJune-95 Permanent Insurance Equitable Life (majority stake) UKJuly-95 Sun Life Holdings UAP remaining 50% stake FranceAug-95 Premium Life Assurance Hambro Assured UKDec-95 Provident Mutual* General Accident UKJan-96 Leeds Life** Halifax Life UKJan-96 Lifetime Assurance LAHC UK
(UK branch)Jan-96 Midland Life (remaining Midland Bank UK
20% stake from CU)Mar-96 Clerical Medical* Halifax Building Society UKMar-96 Terra Nova (life business) Cornhill Insurance UKAug-96 N&P Life** Abbey National Life UKMay-96 Royal Insurance** Sun Alliance UKMay-96 Refuge** United Friendly UKMay-96 Mercantile & General Swiss Reinsurance Switz
ReinsuranceOct-96 Combined Life Assurance Life Assurance Holdings Corp UKJan-97 Medical Sickness Annuity Wesleyan Assurance Society UK
& Life Assurance Society*

195uk annuity pr ice ser ies , 1957–2002
Table A6. Continued
Approximate Nationalitydate Insurer acquired Acquirer of acquirer
Mar-97 Scottish Amicable* Prudential UKApr-97 No companyii Norwich Union UKApr-97 J Rothschild Assurance St James’s Place Capital UK
HoldingsJuly-97 Permanent Insurance Equitable Life (remaining stake) UKJuly-97 AXA Equity & Law Sun Life & Provincial Holdings UKJuly-97 Direct Line Life Scottish Widows (50% stake)Sept-97 Stalwart Group GE Capital USASept-97 Albany Life Canada Life CanadaDec-97 PPP Healthcare Guardian Royal Exchange UKJan-98 Gan Life & Pensions Life Assurance Holdings Corp.June-98 General Accident Plc** Commercial Union Plc UKSept-98 London & Manchester Friends Provident UKSept-98 Allied Dunbar-Eagle Zurich Financial Services Group Switz
Star-Zurich Life**May-99 National Provident AMP Australia
Institution*Feb-99 Guardian Royal Exchange AXA FranceMay-99 M&G Prudential UKAug-99 Guardian Royal Exchange Aegon NV UK
Group (life, pensionsand UT business)
Sept-99 Britannia Lifeiii Britannic Assurance UKOct-99 British & European World-Wide Reassurance UK
Reinsurance Company(life reinsurance portfolio)iv
Jan-00 Old Mutualv Century LifeMar-00 Scottish Widows Lloyds TSB UKFeb-00 United Assurance Royal London UKMay-00 CGU** Norwich Union UKMay-00 St James’s Place Capitalvi Halifax UKMay-00 Liberty International Schroders Plc UK
PensionsJune-00 Colonial (UK) Winterthur Life UKSept-00 Scottish Provident Abbey National Plc UKOct-00 Scottish Life Royal London UKOct-00 Woolwich** Barclays UKDec-00 Permanent Insurance Liverpool Victoria Friendly UK
Society

196 edmund cannon and ian tonks
Table A6. Continued
Source: Watson Wyatt.Notes:*These transactions involved the reconstruction of a mutual.**Merger.iIn a complex transaction involving Black Horse Life Assurance, its own insurancesubsidiary, Lloyds Bank acquired a controlling interest in Abbey Life.iiFlotation.iiiBritannic acquired Britannia as part of a transaction to acquire a 75% stake in BritanniaAsset Management. Britannia Life has been closed to new business since end 1997.ivSeller was CGU plc (UK).vImmediate annuity book is to be transferred to XL Mid Ocean Reinsurance in Bermuda.Remaining non-linked and linked life business is to be bought by Century for £75m.vi£750m tender offer for 60% of St James’s Place Capital, the holding company for JRothschild Assurance.