uk best practice fish screening trials study
TRANSCRIPT

UK Best Practice fish screening trials study
R. Bromley, S. Coyle, K. Hawley, K. Anderson & A. W. H. Turnpenny Jacobs Engineering UK Ltd, UK
Abstract
The testing of two types of fish screens; passive wedge wire cylinder screens and travelling screens, was undertaken in the lower River Thames, UK. This work was part of a bigger study jointly commissioned by Thames Water Utilities Ltd and Veolia Water Central Ltd (formerly Three Valleys Water plc) as part of their AMP4 business plan to investigate and assess entrainment and test screening solutions. The testing of the selected fish screens provides an update and supplement to the Environment Agency’s ‘Screening for Intakes and Outfalls: a best practice guide’. The aims of the screening study were to provide a better estimate of the rate of fish fry entrainment at water intake sites and to assess the impacts in population terms using the Equivalent Adult Value method (an empirical estimate equating the loss of fry in adult terms). In the course of producing this assessment, a review of the River Thames standing stock populations and the construction of species lifetables, was undertaken. It is estimated that the number of fry entrained during 2007 at all intake sites could have amounted to 31% of the total adult stock in the lower Thames in Equivalent Adult terms. With the introduction of the best performing screens on test in this study the percentage of adult equivalents entrained would be less than 6% of the standing stock, an improvement of 25%. Keywords: fish screening, passive wedge wire screens, travelling screens, entrainment, intakes, equivalent adult value, water abstraction.
1 Introduction
In recent years there has been increasing recognition of the risk of entrainment (fish drawn into an abstraction facility) of juvenile freshwater fish during their downstream dispersal phases, from the pinhead fry stage (newly hatched) onwards. This is usually a one-way journey, at the end of which the fish are
International Fish Screening Techniques 2011 89
doi:10.2495/978-1-84564-849-7/008
www.witpress.com, ISSN 1755-8336 (on-line) WIT Transactions on State of the Art in Science and Engineering, Vol 71, © 2013 WIT Press
either trapped in storage reservoirs or killed by the water treatment process. In response to Environment Agency (EA) concerns about the possible risk of entrainment to the sustainability of coarse fish stocks, Thames Water Utilities Ltd and Veolia Water Partnership, on behalf of Three Valleys Water plc, jointly commissioned a study to examine the rates of entrainment and level of impact at ten intake sites. Field studies testing the efficiency of screens were undertaken using screening measures that were in line with, or considered an improvement upon, UK Best Practice as set out in the Environment Agency’s Science Report SC030231 (Turnpenny and O’Keeffe [1]). This paper presents key findings from the field tests.
2 Selected fish screening options
All fish screens tested in this study were designed and sized to meet UK Best Practice in achieving slot velocities of less than 0.15 ms-1, utilising smooth external surfaces and maintaining narrow slot widths.
2.1 Johnson’s Passive Wedge-Wire Cylinder (PWWC) screens
Three Johnson stainless steel (316L) PWWC screens consisting of 1, 2 and 3 mm mesh were tested over 15 weeks during 2006 and 2007 in the River Thames. The screen heads were orientated so that river flow was across the diameter of the screen as opposed to the blank end of the screen facing into the flow. A 210 litre capacity compressor (Ingersoll Rand) was employed to air-backwash each of the three PWWC screens periodically. The back-washing of screens was designed to remove any debris away from the face of the screens. The air compressor was set to deliver bursts of approximately 160 litres at 8 bar pressure, in line with the screen manufacturer’s recommendations.
2.2 Hydrolox Series 1800 screen
A Hydrolox Series 1800 screen consisting of slotted mesh of 1.75 mm x 19 mm (“1.75 mm mesh”) was tested in 2007 for a period of approximately 15 weeks. The screen surface was orientated parallel to the riverbank, so that the river flow sheared across the open face of the screen. Abstraction used a through-flow pattern where water was passed through both sides of the screen.
2.3 EIMCO Water Technologies (EWT) CF100 screen
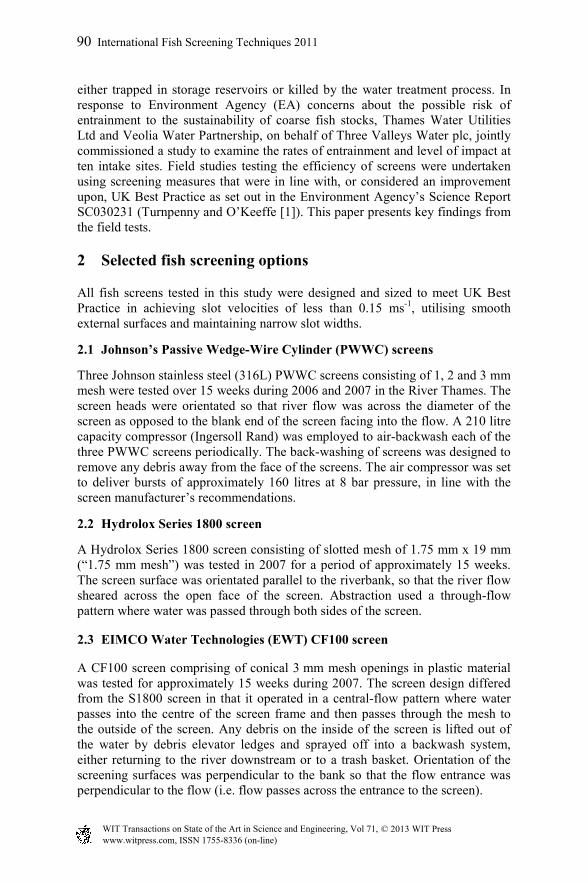
A CF100 screen comprising of conical 3 mm mesh openings in plastic material was tested for approximately 15 weeks during 2007. The screen design differed from the S1800 screen in that it operated in a central-flow pattern where water passes into the centre of the screen frame and then passes through the mesh to the outside of the screen. Any debris on the inside of the screen is lifted out of the water by debris elevator ledges and sprayed off into a backwash system, either returning to the river downstream or to a trash basket. Orientation of the screening surfaces was perpendicular to the bank so that the flow entrance was perpendicular to the flow (i.e. flow passes across the entrance to the screen).
90 International Fish Screening Techniques 2011
www.witpress.com, ISSN 1755-8336 (on-line) WIT Transactions on State of the Art in Science and Engineering, Vol 71, © 2013 WIT Press
3 Experimental set-up
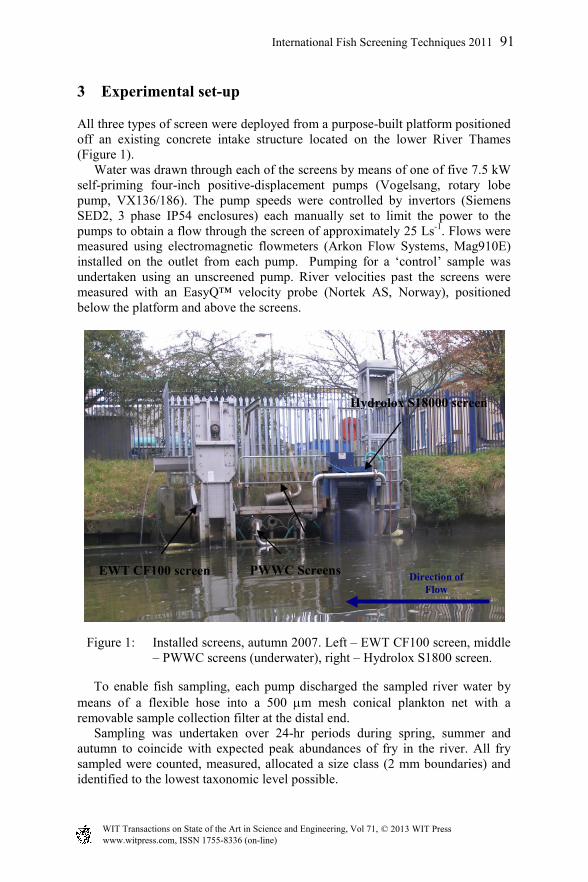
All three types of screen were deployed from a purpose-built platform positioned off an existing concrete intake structure located on the lower River Thames (Figure 1). Water was drawn through each of the screens by means of one of five 7.5 kW self-priming four-inch positive-displacement pumps (Vogelsang, rotary lobe pump, VX136/186). The pump speeds were controlled by invertors (Siemens SED2, 3 phase IP54 enclosures) each manually set to limit the power to the pumps to obtain a flow through the screen of approximately 25 Ls-1. Flows were measured using electromagnetic flowmeters (Arkon Flow Systems, Mag910E) installed on the outlet from each pump. Pumping for a ‘control’ sample was undertaken using an unscreened pump. River velocities past the screens were measured with an EasyQ™ velocity probe (Nortek AS, Norway), positioned below the platform and above the screens.
Figure 1: Installed screens, autumn 2007. Left – EWT CF100 screen, middle – PWWC screens (underwater), right – Hydrolox S1800 screen.
To enable fish sampling, each pump discharged the sampled river water by means of a flexible hose into a 500 µm mesh conical plankton net with a removable sample collection filter at the distal end. Sampling was undertaken over 24-hr periods during spring, summer and autumn to coincide with expected peak abundances of fry in the river. All fry sampled were counted, measured, allocated a size class (2 mm boundaries) and identified to the lowest taxonomic level possible.
Direction of Flow
EWT CF100 screen PWWC Screens
Hydrolox S18000 screen
International Fish Screening Techniques 2011 91
www.witpress.com, ISSN 1755-8336 (on-line) WIT Transactions on State of the Art in Science and Engineering, Vol 71, © 2013 WIT Press
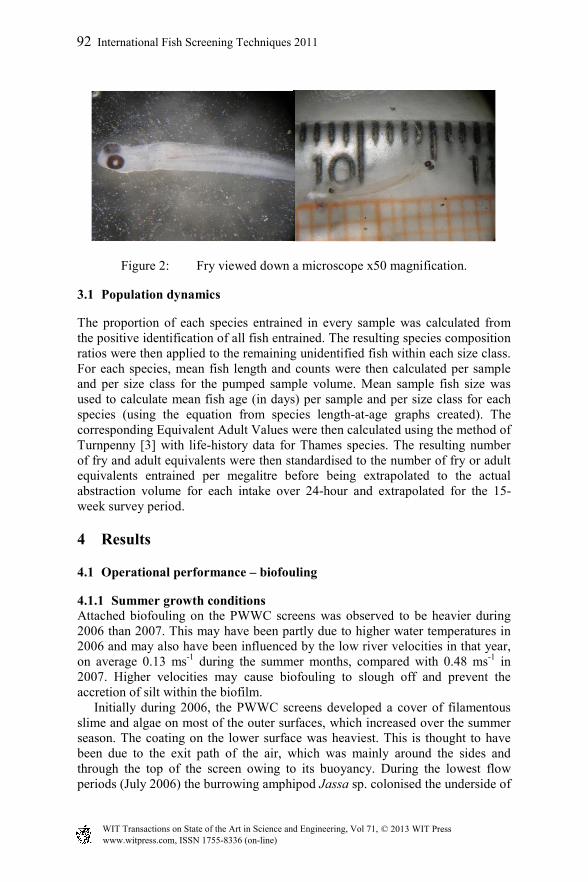
Figure 2: Fry viewed down a microscope x50 magnification.
3.1 Population dynamics
The proportion of each species entrained in every sample was calculated from the positive identification of all fish entrained. The resulting species composition ratios were then applied to the remaining unidentified fish within each size class. For each species, mean fish length and counts were then calculated per sample and per size class for the pumped sample volume. Mean sample fish size was used to calculate mean fish age (in days) per sample and per size class for each species (using the equation from species length-at-age graphs created). The corresponding Equivalent Adult Values were then calculated using the method of Turnpenny [3] with life-history data for Thames species. The resulting number of fry and adult equivalents were then standardised to the number of fry or adult equivalents entrained per megalitre before being extrapolated to the actual abstraction volume for each intake over 24-hour and extrapolated for the 15-week survey period.
4 Results
4.1 Operational performance – biofouling
4.1.1 Summer growth conditions Attached biofouling on the PWWC screens was observed to be heavier during 2006 than 2007. This may have been partly due to higher water temperatures in 2006 and may also have been influenced by the low river velocities in that year, on average 0.13 ms-1 during the summer months, compared with 0.48 ms-1 in 2007. Higher velocities may cause biofouling to slough off and prevent the accretion of silt within the biofilm. Initially during 2006, the PWWC screens developed a cover of filamentous slime and algae on most of the outer surfaces, which increased over the summer season. The coating on the lower surface was heaviest. This is thought to have been due to the exit path of the air, which was mainly around the sides and through the top of the screen owing to its buoyancy. During the lowest flow periods (July 2006) the burrowing amphipod Jassa sp. colonised the underside of
92 International Fish Screening Techniques 2011
www.witpress.com, ISSN 1755-8336 (on-line) WIT Transactions on State of the Art in Science and Engineering, Vol 71, © 2013 WIT Press

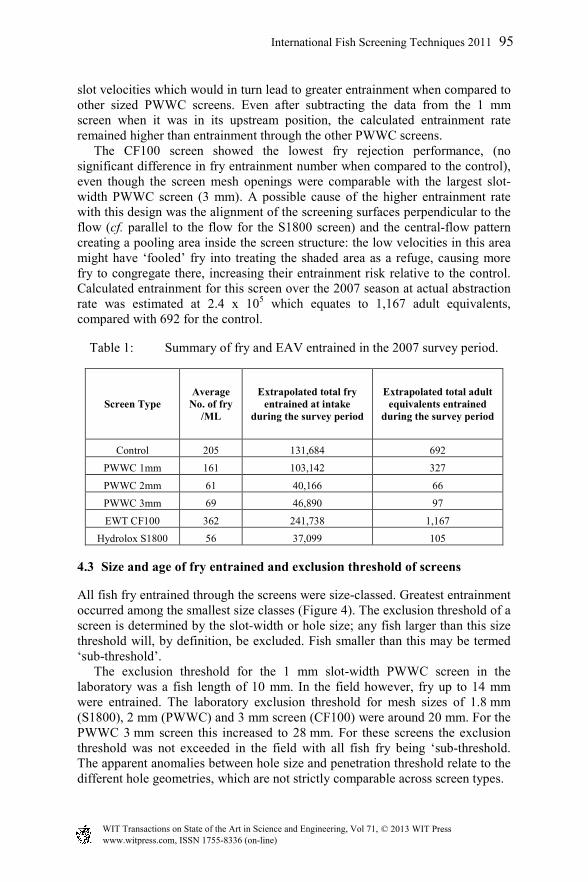
Figure 3: Screens showing summer fouling. Top images are the PWWC
screens, bottom left the S1800 and bottom right the CF100 screen.
the screen. However, when higher flows in the river returned these were sloughed off, along with some of the algae. Most of the fouling was confined to the outer surface of the solid wire parts of the mesh screen and there was limited slime inside the test screen or in the screen slots. It appeared that the air backwash cleared debris within the slots but not debris adhered to the outside solid sections of the screen. One additional problem during 2006 was the collection of loose, drifting weed around the screens. Greater amounts of drifting weed were present during 2006 because of a hot summer. The air backwash cleared weed only in areas where the air exited the screen. Despite levels of summer biofouling, no noticeable reductions in summer abstraction rates were observed through the PWWC screens during 2006 or 2007 and, in 2007 when pressure transducers were fitted to the screens, no sustained pressure drops across the screen surfaces were recorded. The travelling screens fared better in terms of avoiding the development filamentous slime and almost no biofouling was observed on the mesh of either screen throughout the trials. Even when screens were turned off for several weeks during high river levels, no algal growth was observed on the screens. No significant carryover of debris was observed with the S1800 screen (which would have appeared in the plankton nets) and any debris collected by the CF100 screen was effectively deposited downstream via the screen backwash facility.
International Fish Screening Techniques 2011 93
www.witpress.com, ISSN 1755-8336 (on-line) WIT Transactions on State of the Art in Science and Engineering, Vol 71, © 2013 WIT Press

4.1.2 Autumn leaf fall conditions During autumn 2006, large amounts of leaf litter collected on the PWWC screens, which resulted in reduced flows (reduced to 16 Ls-1). The air backwash was not effective in completely clearing the screens and thus restoring flows and abstraction was severally effected until screens were cleared manually. Sections of screens that were cleared by the backwash quickly became covered again because of such high volumes of leaf litter present in the river and flows were once again reduced. During autumn 2007, the PWWC screens performed better and no significant leaf impingement was observed. Flow rates and pressures across the screens remained constant throughout the period. The different observations made between 2006 and 2007 were probably due to the different pattern of leaf fall. The autumn of 2006 was very warm, still and dry and most leaves fell during a very windy, wet period at the end of the season. Autumn of 2007 was observed to start earlier than normal and leaf fall was spread out over several months. The travelling screens performed well during autumn 2007, with no screen blockages, reduced flows or increasing pressures. All debris impinged on the CF100 screen was sprayed off and debris returned downstream and there was no significant carryover of leaves from the S1800 screen.
4.2 Fry screening performance
The numbers of fry entrained during 2007 through each of the test screens are summarised in Table 1, with data expressed as Equivalent Adult Values. The estimated entrainment of fry through the control during the 2007 season at actual flow rates was calculated as 1.3 x 10⁵, which EAV analysis showed is equivalent to 692 adult fish. Catch rates with the test screens in place were in all but one case lower than this, the lowest capture rate (2 mm PWWC screen) being less than 10% of the unscreened total at 66 adult equivalents. The best performing screen in terms of raw numbers of fry entrained was the S1800 screen, with an average of 56 fry entrained per megalitre, as compared with the PWWC, 3 mm and 2 mm screen, with 69 and 61 fish per megalitre respectively. In comparison to the control this difference was significant (one-sample t-test; P = 0.000 for all tests). In adult equivalent terms, the 2 mm PWWC performed the best, mainly due to the smaller sized fry entrained, which have a smaller EAV. Surprisingly, the highest entrainment through a PWWC screen was observed through the 1 mm slot-width and no significant difference in fry number was found when compared to the control. This tendency was noted early in the study and it was thought that it could be an effect of having the 1 mm screen in the most upstream position of the PWWC screens, with the result being a positional effect or possibly a flow pattern effect, the S1800 screen was upstream of all the screens and may have cast a flow shadow on the immediately downstream PWWC screen. The PWWC screen positions were subsequently rotated approximately every 10 days to override both possible effects as far as possible. Despite this, highest entrainment was not always observed on the upper most PWWC screen, leading to the possibility that fouling of the screen created higher
94 International Fish Screening Techniques 2011
www.witpress.com, ISSN 1755-8336 (on-line) WIT Transactions on State of the Art in Science and Engineering, Vol 71, © 2013 WIT Press
slot velocities which would in turn lead to greater entrainment when compared to other sized PWWC screens. Even after subtracting the data from the 1 mm screen when it was in its upstream position, the calculated entrainment rate remained higher than entrainment through the other PWWC screens. The CF100 screen showed the lowest fry rejection performance, (no significant difference in fry entrainment number when compared to the control), even though the screen mesh openings were comparable with the largest slot-width PWWC screen (3 mm). A possible cause of the higher entrainment rate with this design was the alignment of the screening surfaces perpendicular to the flow (cf. parallel to the flow for the S1800 screen) and the central-flow pattern creating a pooling area inside the screen structure: the low velocities in this area might have ‘fooled’ fry into treating the shaded area as a refuge, causing more fry to congregate there, increasing their entrainment risk relative to the control. Calculated entrainment for this screen over the 2007 season at actual abstraction rate was estimated at 2.4 x 10⁵ which equates to 1,167 adult equivalents, compared with 692 for the control.
Table 1: Summary of fry and EAV entrained in the 2007 survey period.
Screen Type Average
No. of fry /ML
Extrapolated total fry entrained at intake
during the survey period
Extrapolated total adult equivalents entrained
during the survey period
Control 205 131,684 692 PWWC 1mm 161 103,142 327
PWWC 2mm 61 40,166 66 PWWC 3mm 69 46,890 97
EWT CF100 362 241,738 1,167 Hydrolox S1800 56 37,099 105
4.3 Size and age of fry entrained and exclusion threshold of screens
All fish fry entrained through the screens were size-classed. Greatest entrainment occurred among the smallest size classes (Figure 4). The exclusion threshold of a screen is determined by the slot-width or hole size; any fish larger than this size threshold will, by definition, be excluded. Fish smaller than this may be termed ‘sub-threshold’. The exclusion threshold for the 1 mm slot-width PWWC screen in the laboratory was a fish length of 10 mm. In the field however, fry up to 14 mm were entrained. The laboratory exclusion threshold for mesh sizes of 1.8 mm (S1800), 2 mm (PWWC) and 3 mm screen (CF100) were around 20 mm. For the PWWC 3 mm screen this increased to 28 mm. For these screens the exclusion threshold was not exceeded in the field with all fish fry being ‘sub-threshold. The apparent anomalies between hole size and penetration threshold relate to the different hole geometries, which are not strictly comparable across screen types.
International Fish Screening Techniques 2011 95
www.witpress.com, ISSN 1755-8336 (on-line) WIT Transactions on State of the Art in Science and Engineering, Vol 71, © 2013 WIT Press

0
100
200
300
400
500
600
700
< 6
6.1
- 88.
1 - 1
010
.1 -
1212
.1 -
1414
.1 -
1616
.1 -
2020
.1 -
2424
.1 -
28 < 6
6.1
- 88.
1 - 1
010
.1 -
1212
.1 -
1414
.1 -
1616
.1 -
20 < 6
6.1
- 88.
1 - 1
010
.1 -
1212
.1 -
1414
.1 -
1616
.1 -
20 < 6
6.1
- 88.
1 - 1
010
.1 -
1212
.1 -
1414
.1 -
1616
.1 -
20 < 6
6.1
- 88.
1 - 1
010
.1 -
1212
.1 -
1414
.1 -
1616
.1 -
20 < 6
6.1
- 88.
1 - 1
010
.1 -
1212
.1 -
1414
.1 -
1616
.1 -
20
Num
ber o
f fry
Control 1mm PWWC 2mm PWWC 3mm PWWC CF100 S1800
Figure 4: Numbers of fish by size class entrained by each screen and control during the 2007 survey period.
Table 2: The estimated age (days) of species that physically pass through the various screens.
Species Age (days)
PWWC 1mm
PWWC 2mm
PWWC 3mm CF100 S1800
Bleak 32 97 159 97 97
Bullhead 19 53 83 53 53 Chub 24 147 263 147 147
Common Bream 20 114 191 114 114 Dace 14 43 72 43 43
Gudgeon 55 135 201 135 135 Roach 39 95 141 95 95 Perch 29 67 97 67 67
The size of fry that physically pass through each screen was applied to the look-up tables and length-age graphs produced from the lifetables study to ascertain the average age (days) for each species that would physically pass through the various screens. Table 2 shows the ages of fry that would theoretically be excluded; with the 1 mm screen all fish over 55 days old would be excluded; for the 2 mm PWWC, CF100 and S1800 screen all fish over 147 days old would be excluded and for the 3 mm PWWC screen all fish over 264 days old would be excluded.
96 International Fish Screening Techniques 2011
www.witpress.com, ISSN 1755-8336 (on-line) WIT Transactions on State of the Art in Science and Engineering, Vol 71, © 2013 WIT Press
4.4 Relative exclusion performance for sub-threshold fish
The data collected for the size class range of fish entrained by each screen showed that the PWWC 2 mm and 3 mm screens and the travelling screens did not entrain fry above their sub-threshold limit. However, the PWWC 1 mm screen did. One possible explanation could be that, as a result of fouling and therefore blockage of small areas of screen, the slot velocity through the screens was increased. This increase in velocity may distort the shape of fry and suck them through. Very high numbers of small fry (< 6 mm) were entrained through the 1 mm screen (Figure 4). Why this should occur is unclear as very small fry were able to pass through all protective screen sizes. A possible explanation is that this was a random event due to the spatial distribution of fry. For example, currents in the river associated with various sized whirlpools and transverse circulation coupled with a particularly large pulse in density of fry may result in fry being clumped into a particularly small area. Patchiness, created by turbulent stirring, has been previously reported in the distribution of phytoplankton (Abraham [2]) and by Turnpenny [3]) in marine larval fry. Alternatively, as fouling of the 1 mm screen was observed to be slightly worse than the other PWWC screens, this may have in effect blocked parts of the slots resulting in increase through slot velocity in the open areas of the screen, as explained above. This increase over the other PWWC screens may have contributed to greater entrainment. Although the CF100 screen did not entrain fry above its sub-threshold, there was a substantially higher number of entrained fry (362 fry per megalitre) in comparison to all other screens. It is thought likely that this was due to the design of this screen, in that the central-flow pattern may create a pooling area inside the middle of the screen and fry may perceive this as a refuge. A number of studies have demonstrated the preferential use of low velocity patches by fry and juvenile fish. Garner [4]) showed that juvenile cyprinids moved to slower flowing water when water velocity increased. This was also reported by Stahlberg and Peckmann [5]) who noted that when fish were exposed to increasing velocities in a flume they increasingly moved to areas where velocities were lower.
4.5 Sweeping velocity and screening performance against sub-threshold fish
Presently in England and Wales, the most widely used screening system conforming to Environment Agency Best Practice for protecting juvenile fish and fry uses PWWC screens with a 3 mm mesh (Turnpenny and O’Keeffe [1]). Low through-slot velocity (allowing fish to swim away) and the relatively smooth external surface (reducing physical damage to fish) are important features making these screens suitable for fish fry exclusion. Coupled with this, the sweeping velocity has been considered to be an important factor in the reduction of fish fry entrainment. Previous work carried out by Thatcher [6]) estimated the critical swimming speed of fry amounts to 6.5 body lengths per second and a suitable escape criterion (or through slot velocity) for coarse fish, suggested by Solomon [7], is 15 cm.s-1. Coupled with a 3 mm screen slot
International Fish Screening Techniques 2011 97
www.witpress.com, ISSN 1755-8336 (on-line) WIT Transactions on State of the Art in Science and Engineering, Vol 71, © 2013 WIT Press

width (presently used in the UK) these design parameters are considered protective of fry >20 mm, providing that the channel velocity is above 0.3 ms-1 (Turnpenny [8]). It was evident from this study, however, that during the period when drift densities were greatest, (May), there was no apparent relationship between the numbers of fry entrained and sweeping velocity. Perhaps then when very large numbers of fry are drifting, density rather sweeping velocity becomes the most important factor in fry entrainment. Alternatively, the accumulation of fish within the zone of abstraction, rather than the concentration of fish in the current may be of primary importance in the magnitude of fish entrapment (Pavlov [9]). Thus, maximum entrapment occurs when large numbers of small fish cannot swim away from an intake and indeed this was demonstrated in this study, with the greatest entrainment occurring in the smallest size classes.
4.6 Potential fish savings by installing fine screens
Table 3 shows the predicted adult equivalents entrained at each study site and compared to the standing stock of fish. With the current non-screening arrangement potentially 31% of the adult fish stock is being entrained. With the introduction of either the 2 mm, 3 mm PWWC or the Hydrolox S1800 travelling screen the percentage adult equivalent entrained would be reduced to ≤6% of the standing stock, an improvement of 25%. The screens selected in this study are considered fish-friendly, achieved by a combination of low intake velocity, smooth surfaces and positioning within a sweeping flow of the river. Under these conditions there is minimal risk of impingement and injury of fish. Although testing of this was outside of the scope
Table 3: Calculated entrainment as adult equivalents through the control and each test screen at actual intake abstraction rates.
Intake Site Control PWWC 1mm
PWWC 2mm
PWWC 3mm CF100 S1800
Site 1 2,414 1,143 231 340 4,077 368 Site 2 133,859 63,361 12,826 18,843 226,082 20,401
Site 3 25,114 11,888 2,406 3,535 42,416 3,828 Site 4 26,131 12,369 2,504 3,678 44,134 3,983 Site 5 41,127 19,467 3,941 5,789 69,462 6,268
Site 6 102,811 48,665 9,851 14,473 173,643 15,669 Site 7 3,979 1,883 381 560 6,720 606
Site 8 27,562 13,046 2,641 3,880 46,551 4,201 Total EAV entrained 362,997 171,822 34,781 51,099 613,086 55,324
% entrained of standing stock
31% 17% 4% 6% 43% 6%
98 International Fish Screening Techniques 2011
www.witpress.com, ISSN 1755-8336 (on-line) WIT Transactions on State of the Art in Science and Engineering, Vol 71, © 2013 WIT Press

of this study and probably more suited to laboratory testing, observations in this study included underwater filming of screens which gave no indication of impinged fish. For the S1800 screen, if any fish had become impinged, they would most likely have been carried over into the sample, where they would have been included in the count. The fact that the S1800 screen entrained the least number of fish indicated that impingement was not occurring and hence the saving of fish to entrainment is likely to benefit the river system rather than these saved fish being lost to impingement.
4.7 Site-specific factors in choice of screening type
There are a number of important factors to be taken into account in the decision of which screen is most suitable for a particular location. Fish screening performance and operational performance are just two. The footprint of a screen array will depend on the amount of water abstracted at a given site. At those sites where a large amount of water is abstracted, more and/or larger screens will be necessary and with the PWWC screens this effect is compounded by mesh size. For example, to maintain a flow rate of ≤0.15 ms-1 additional and larger 1 mm slot-opening screens would be required than if the screen mesh size was 3 mm. This in turn would necessitate a larger area within the river to accommodate the screens and to prevent damage from river traffic would require piles to be fitted around the instillations. This may impede or hinder the movement of boats and so river depth and width may be of primary importance in the choice of best performing screens. Different, but no less important factors may come into play when installing travelling screens. Consideration needs to be given to aesthetics and possibly, operating noise. In particular, these factors could be a significant problem in urban areas. Incidentally, these particular problems are not encountered with the static and submerged PWWC screens. Additionally, at some sites civil engineering works such as the re-designing of the intake associated with housing screens may be necessary and this must also be taken into account when deciding which type of screen is most suitable at a particular given location. While this project has focused upon mitigation of entrainment impacts through implementation of fish screens, it is recognised that the level of impact at some sites may not merit costs of screening but that some reduction may be achievable through simple modifications to the intake or by avoiding pumping at critical times.
References
[1] Turnpenny, A.W.H. and O’Keeffe, N.J. Screening for intakes and outfalls: a best practice guide. Environment Agency, Science Report SC030231, 2005.
[2] Abraham, E. R. The generation of plankton patchiness by turbulent stirring. ISBN: 1 84432 361 7, February 2005.
Nature, 391, 577–580 (1998).
International Fish Screening Techniques 2011 99
www.witpress.com, ISSN 1755-8336 (on-line) WIT Transactions on State of the Art in Science and Engineering, Vol 71, © 2013 WIT Press
[3] Turnpenny, A.W.H. Fish impingement at estuarine power stations and its significance to commercial fishing. Journal of Fish Biology 33 (Sup A), 1988.
[4] Garner, P. Swimming ability and differential use of velocity patches by 0+ cyprinids. Fisheries Management and Ecology 8, pp. 55-58, 1999.
[5] Stahlberg, S. and Peckman, P. The critical swimming speed of small teleost fish species in a flume. Archiv fuer Hydrobiologie 110, pp. 995-101, 1987.
[6] Thatcher, K. Entrainment of 0-group fish in riverine power-plant cooling-water systems: A Review. Fawley Aquatic Research Laboratory. Report No. FCR 019/92, 1992.
[7] Solomon D.J. Diversion and entrapment of fish at water intakes and outfalls. R&D Report No. 1, National Rivers Authority, Bristol: 51 pp., 1992.
[8] Turnpenny, A.W.H. AMP4 Obligations for fish screens on River Thames raw water intakes. Fawley Aquatic Research Laboratory Ltd, Client Report to Thames Water Utilities, No. FCR 392/03, 2003.
[9] Pavlov, D.S. Structures assisting the migrations of non-salmonid fish FAO Fisheries Technical Paper No. 308. USSR. Fisheries and Agriculture Organisation of the United Nations 97 pp., 1989.
100 International Fish Screening Techniques 2011
www.witpress.com, ISSN 1755-8336 (on-line) WIT Transactions on State of the Art in Science and Engineering, Vol 71, © 2013 WIT Press