uk commercial property prime rental values continue … · marketview uk commercial property prime...
TRANSCRIPT
MARKETVIEW
UK commercial property prime
rental values continue to
increase.
UK Prime Rent and Yield, Q2 2015
Q2 2015 CBRE Research © 2015 CBRE Ltd. | 1
164
*Arrows indicate change from previous quarter.
Source: CBRE, Q3 2014.
30 230 6
-180
-120
-60
0
60
120
180
Q2 2012 Q3 2012 Q4 2012 Q1 2013 Q2 2013 Q3 2013 Q4 2013 Q1 2014 Q2 2014 Q3 2014 Q4 2014 Q1 2015 Q2 2015
Risers Fallers
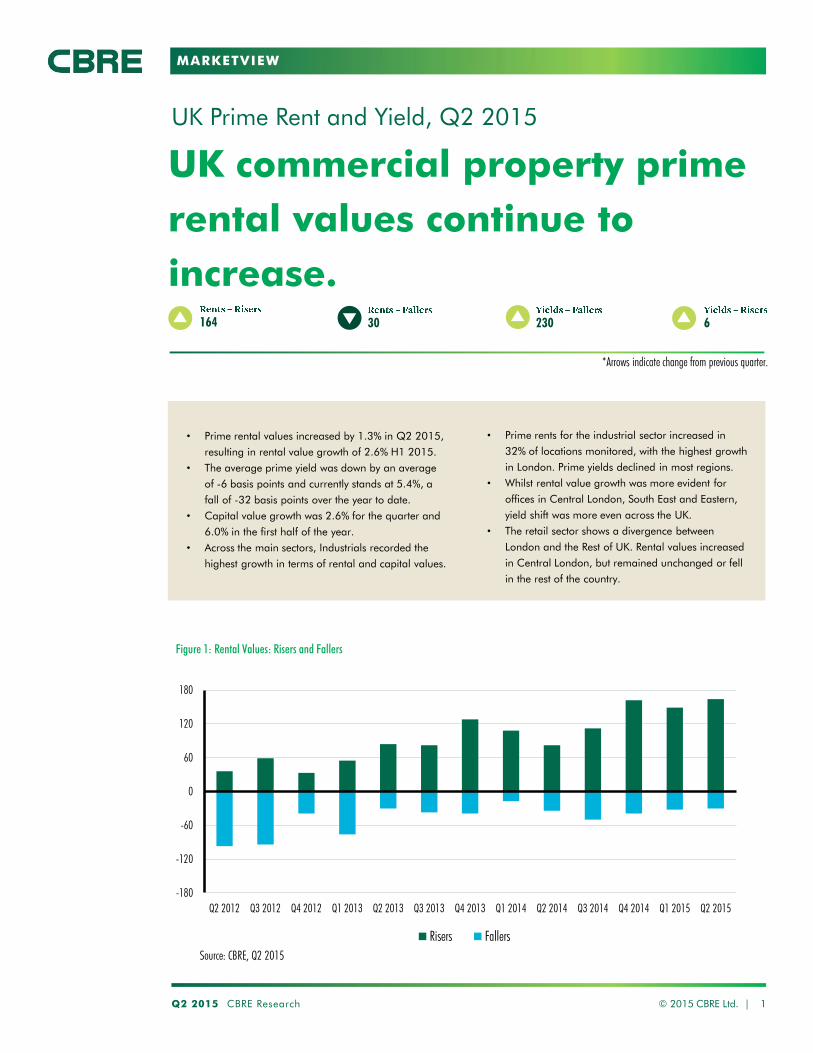
Figure 1: Rental Values: Risers and Fallers
• Prime rental values increased by 1.3% in Q2 2015,
resulting in rental value growth of 2.6% H1 2015.
• The average prime yield was down by an average
of -6 basis points and currently stands at 5.4%, a
fall of -32 basis points over the year to date.
• Capital value growth was 2.6% for the quarter and
6.0% in the first half of the year.
• Across the main sectors, Industrials recorded the
highest growth in terms of rental and capital values.
• Prime rents for the industrial sector increased in
32% of locations monitored, with the highest growth
in London. Prime yields declined in most regions.
• Whilst rental value growth was more evident for
offices in Central London, South East and Eastern,
yield shift was more even across the UK.
• The retail sector shows a divergence between
London and the Rest of UK. Rental values increased
in Central London, but remained unchanged or fell
in the rest of the country.
Source: CBRE, Q2 2015

MARKETVIEW
Q2 2015 CBRE Research © 2015 CBRE Ltd. | 2
UK PRIME RENT AND YIELD
Source: CBRE, Q2 2015
Source: CBRE, Q2 2015
Source: CBRE, Q2 2014
Figure 3: Nominal Prime Rental Growth (%)
Q/Q Y/Y
Shops 1.4 2.4
Shopping Centres 0.2 0.6
Retail Warehouses 0.1 -0.4
Offices 1.6 8.3
Industrials 2.6 7.1
All Property 1.3 4.7
Figure 4: Prime Yields (%)
Q4 2014
Q1 2015
Q/Q bps
Y/Y bps
Shops 5.2 5.2 -7 -23
Shopping Centres 4.8 4.8 0 -43
Retail Warehouses 5.2 5.2 0 -13
Offices 5.4 5.3 -10 -34
Industrials 6.2 6.1 -8 -32
All Property 5.5 5.4 -6 -32
Figure 5: Capital Value Growth (%)
Q/Q Y/Y
Shops 3.0 7.4
Shopping Centres 0.3 9.9
Retail Warehouses 0.2 2.2
Offices 3.6 15.4
Industrials 4.0 13.0
All Property 2.6 11.1

MARKETVIEW
PRIME RENTS
OFFICES
RETAIL
INDUSTRIALS
Q2 2015 CBRE Research © 2015 CBRE Ltd. | 3
UK PRIME RENT AND YIELD
-25
-20
-15
-10
-5
0
5
10
Q2 2
009
Q4 2
009
Q2 2
010
Q4 2
010
Q2 2
011
Q4 2
011
Q2 2
012
Q4 2
012
Q2 2
013
Q4 2
013
Q2 2
014
Q4 2
014
Q2 2
015
Shops Retail Warehouses
Offices Industrial
Shopping Centres
Source: CBRE, Q2 2015
Figure 6: Annual Prime Rental Growth by Sector (%pa)
-25
-20
-15
-10
-5
0
5
10
15
20
Q2 2
009
Q4 2
009
Q2 2
010
Q4 2
010
Q2 2
011
Q4 2
011
Q2 2
012
Q4 2
012
Q2 2
013
Q4 2
013
Q2 2
014
Q4 2
014
Q2 2
015
Central London South East
Eastern Rest of UK (escl. SE and Eastern)
Figure 8: Regional Prime High Street Rental Growth (%pa)
-40
-30
-20
-10
0
10
20
30
Q2 2
009
Q4 2
009
Q2 2
010
Q4 2
010
Q2 2
011
Q4 2
011
Q2 2
012
Q4 2
012
Q2 2
013
Q4 2
013
Q2 2
014
Q4 2
014
Q2 2
015
West End City Midtown Docklands
Figure 7: Central London Prime Office Submarket Rental Growth (%pa)
Source: CBRE, Q2 2015
Source: CBRE, Q2 2015

MARKETVIEW
PRIME YIELDS
OFFICES
RETAIL
INDUSTRIALS
Q2 2015 CBRE Research © 2015 CBRE Ltd. | 4
UK PRIME RENT AND YIELD
Figure 9: UK All Sector Average Prime Yields (%)
Figure 11: Industrial Market Yields (%)
4
5
6
7
8
9
10
Q2 2
009
Q4 2
009
Q2 2
010
Q4 2
010
Q2 2
011
Q4 2
011
Q2 2
012
Q4 2
012
Q2 2
013
Q4 2
013
Q2 2
014
Q4 2
014
Q2 2
015
West End City South East West Midlands
Figure 10: Prime Office Market Yields (%)
4
5
6
7
8
9
10
Q2 2
009
Q4 2
009
Q2 2
010
Q4 2
010
Q2 2
011
Q4 2
011
Q2 2
012
Q4 2
012
Q2 2
013
Q4 2
013
Q2 2
014
Q4 2
014
Q2 2
015
Shops Shopping Centres
Retail Warehouses Offices
Industrial
4
5
6
7
8
9
10
Q2 2
009
Q4 2
009
Q2 2
010
Q4 2
010
Q2 2
011
Q4 2
011
Q2 2
012
Q4 2
012
Q2 2
013
Q4 2
013
Q2 2
014
Q4 2
014
Q2 2
015
London South East West Midlands
Source: CBRE, Q2 2015
Source: CBRE, Q2 2015
Source: CBRE, Q2 2015

MARKETVIEW
PRIME CAPITAL VALUES
OFFICES
RETAIL
INDUSTRIALS
Q2 2015 CBRE Research © 2015 CBRE Ltd. | 5
UK PRIME RENT AND YIELD
-40
-30
-20
-10
0
10
20
30
40
Q2 2
009
Q4 2
009
Q2 2
010
Q4 2
010
Q2 2
011
Q4 2
011
Q2 2
012
Q4 2
012
Q2 2
013
Q4 2
013
Q2 2
014
Q4 2
014
Q2 2
015
Shops Retail Warehouses
Offices Industrial
Shopping Centres
Figure 12: Annual prime Capital Value Growth by Sector (%pa)
-40
-30
-20
-10
0
10
20
30
40
Q2 2
009
Q4 2
009
Q2 2
010
Q4 2
010
Q2 2
011
Q4 2
011
Q2 2
012
Q4 2
012
Q2 2
013
Q4 2
013
Q2 2
014
Q4 2
014
Q2 2
015
Central London
South East
Rest of UK (excl. SE & E)
Figure 14: Regional Prime High Street Capital Value Growth (%pa)
-50
-40
-30
-20
-10
0
10
20
30
40
Q2 2
009
Q4 2
009
Q2 2
010
Q4 2
010
Q2 2
011
Q4 2
011
Q2 2
012
Q4 2
012
Q2 2
013
Q4 2
013
Q2 2
014
Q4 2
014
Q2 2
015
Central London
Rest of UK (excl. SE and Eastern)
Key Provincial City
Figure 13: Prime Office Submarket Capital Value Growth (%pa)
Source: CBRE, Q2 2015
Source: CBRE, Q2 2015
Source: CBRE, Q2 2015
MARKETVIEW
Q2 2015 CBRE Research © 2015 CBRE Ltd. | 6
UK PRIME RENT AND YIELD
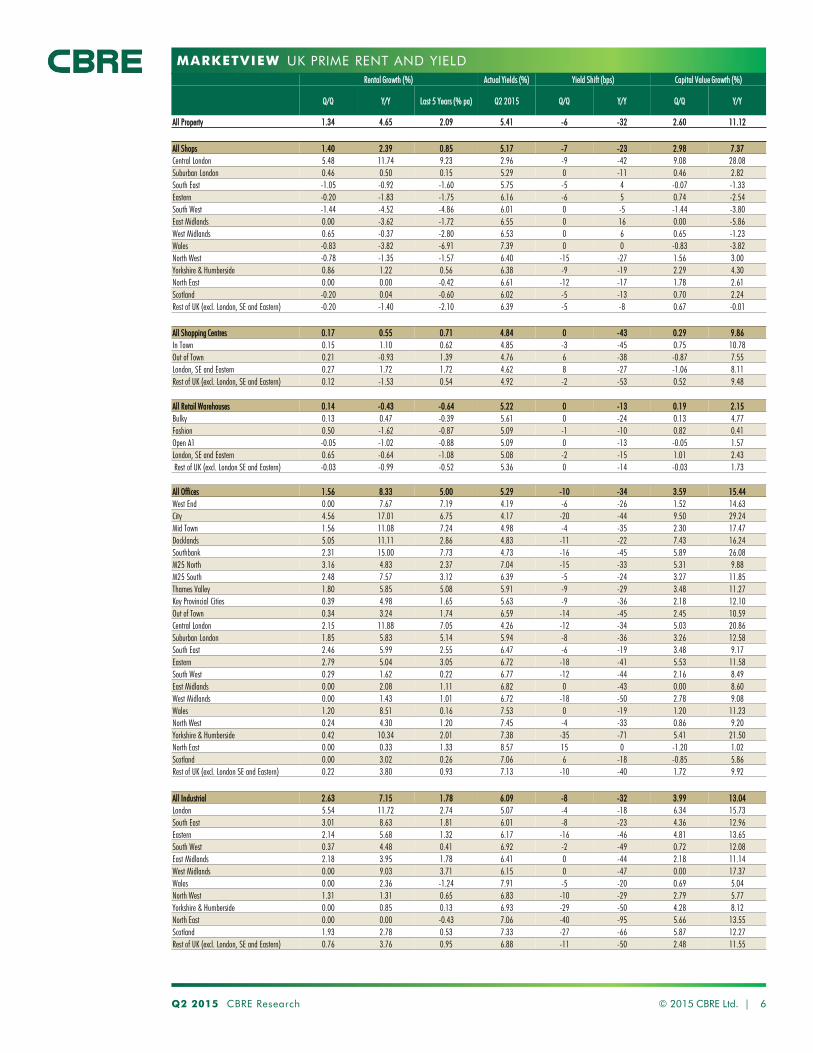
Rental Growth (%) Actual Yields (%) Yield Shift (bps) Capital Value Growth (%)
Q/Q Y/Y Last 5 Years (% pa) Q2 2015 Q/Q Y/Y Q/Q Y/Y
All Property 1.34 4.65 2.09 5.41 -6 -32 2.60 11.12
All Shops 1.40 2.39 0.85 5.17 -7 -23 2.98 7.37
Central London 5.48 11.74 9.23 2.96 -9 -42 9.08 28.08
Suburban London 0.46 0.50 0.15 5.29 0 -11 0.46 2.82
South East -1.05 -0.92 -1.60 5.75 -5 4 -0.07 -1.33
Eastern -0.20 -1.83 -1.75 6.16 -6 5 0.74 -2.54
South West -1.44 -4.52 -4.86 6.01 0 -5 -1.44 -3.80
East Midlands 0.00 -3.62 -1.72 6.55 0 16 0.00 -5.86
West Midlands 0.65 -0.37 -2.80 6.53 0 6 0.65 -1.23
Wales -0.83 -3.82 -6.91 7.39 0 0 -0.83 -3.82
North West -0.78 -1.35 -1.57 6.40 -15 -27 1.56 3.00
Yorkshire & Humberside 0.86 1.22 0.56 6.38 -9 -19 2.29 4.30
North East 0.00 0.00 -0.42 6.61 -12 -17 1.78 2.61
Scotland -0.20 0.04 -0.60 6.02 -5 -13 0.70 2.24
Rest of UK (excl. London, SE and Eastern) -0.20 -1.40 -2.10 6.39 -5 -8 0.67 -0.01
All Shopping Centres 0.17 0.55 0.71 4.84 0 -43 0.29 9.86
In Town 0.15 1.10 0.62 4.85 -3 -45 0.75 10.78
Out of Town 0.21 -0.93 1.39 4.76 6 -38 -0.87 7.55
London, SE and Eastern 0.27 1.72 1.72 4.62 8 -27 -1.06 8.11
Rest of UK (excl. London, SE and Eastern) 0.12 -1.53 0.54 4.92 -2 -53 0.52 9.48
All Retail Warehouses 0.14 -0.43 -0.64 5.22 0 -13 0.19 2.15
Bulky 0.13 0.47 -0.39 5.61 0 -24 0.13 4.77
Fashion 0.50 -1.62 -0.87 5.09 -1 -10 0.82 0.41
Open A1 -0.05 -1.02 -0.88 5.09 0 -13 -0.05 1.57
London, SE and Eastern 0.65 -0.64 -1.08 5.08 -2 -15 1.01 2.43
Rest of UK (excl. London SE and Eastern) -0.03 -0.99 -0.52 5.36 0 -14 -0.03 1.73
All Offices 1.56 8.33 5.00 5.29 -10 -34 3.59 15.44
West End 0.00 7.67 7.19 4.19 -6 -26 1.52 14.63
City 4.56 17.01 6.75 4.17 -20 -44 9.50 29.24
Mid Town 1.56 11.08 7.24 4.98 -4 -35 2.30 17.47
Docklands 5.05 11.11 2.86 4.83 -11 -22 7.43 16.24
Southbank 2.31 15.00 7.73 4.73 -16 -45 5.89 26.08
M25 North 3.16 4.83 2.37 7.04 -15 -33 5.31 9.88
M25 South 2.48 7.57 3.12 6.39 -5 -24 3.27 11.85
Thames Valley 1.80 5.85 5.08 5.91 -9 -29 3.48 11.27
Key Provincial Cities 0.39 4.98 1.65 5.63 -9 -36 2.18 12.10
Out of Town 0.34 3.24 1.74 6.59 -14 -45 2.45 10.59
Central London 2.15 11.88 7.05 4.26 -12 -34 5.03 20.86
Suburban London 1.85 5.83 5.14 5.94 -8 -36 3.26 12.58
South East 2.46 5.99 2.55 6.47 -6 -19 3.48 9.17
Eastern 2.79 5.04 3.05 6.72 -18 -41 5.53 11.58
South West 0.29 1.62 0.22 6.77 -12 -44 2.16 8.49
East Midlands 0.00 2.08 1.11 6.82 0 -43 0.00 8.60
West Midlands 0.00 1.43 1.01 6.72 -18 -50 2.78 9.08
Wales 1.20 8.51 0.16 7.53 0 -19 1.20 11.23
North West 0.24 4.30 1.20 7.45 -4 -33 0.86 9.20
Yorkshire & Humberside 0.42 10.34 2.01 7.38 -35 -71 5.41 21.50
North East 0.00 0.33 1.33 8.57 15 0 -1.20 1.02
Scotland 0.00 3.02 0.26 7.06 6 -18 -0.85 5.86
Rest of UK (excl. London SE and Eastern) 0.22 3.80 0.93 7.13 -10 -40 1.72 9.92
All Industrial 2.63 7.15 1.78 6.09 -8 -32 3.99 13.04
London 5.54 11.72 2.74 5.07 -4 -18 6.34 15.73
South East 3.01 8.63 1.81 6.01 -8 -23 4.36 12.96
Eastern 2.14 5.68 1.32 6.17 -16 -46 4.81 13.65
South West 0.37 4.48 0.41 6.92 -2 -49 0.72 12.08
East Midlands 2.18 3.95 1.78 6.41 0 -44 2.18 11.14
West Midlands 0.00 9.03 3.71 6.15 0 -47 0.00 17.37
Wales 0.00 2.36 -1.24 7.91 -5 -20 0.69 5.04
North West 1.31 1.31 0.65 6.83 -10 -29 2.79 5.77
Yorkshire & Humberside 0.00 0.85 0.13 6.93 -29 -50 4.28 8.12
North East 0.00 0.00 -0.43 7.06 -40 -95 5.66 13.55
Scotland 1.93 2.78 0.53 7.33 -27 -66 5.87 12.27
Rest of UK (excl. London, SE and Eastern) 0.76 3.76 0.95 6.88 -11 -50 2.48 11.55

MARKETVIEW
Disclaimer: Information contained herein, including projections, has been obtained from sources believed to be reliable. While we do not doubt its accuracy, we have not verified it and make no guarantee, warranty or representation about it. It is your responsibility to confirm independently its accuracy and completeness. This information is presented exclusively for use by CBRE clients and professionals and all rights to the material are reserved and cannot be reproduced without prior written permission of CBRE.
CONTACTS
CBRE OFFICES
UK PRIME RENT YIELD