uk economy and globalisation revision notes if you do … · · 2017-05-17uk economy and...
TRANSCRIPT
UK Economy and Globalisation
Revision Notes – if you do one thing…..
Globalisation - A Cause for Celebration or Not? This unit is about globalisation and
international trade. There are both benefits and drawbacks of international trade:
Benefits Drawbacks
Specialisation means countries can focus on the areas they are best at (where they have an absolute advantage) which should lead to increased global output
Allows individuals and firms to obtain goods that are not available in their country
Increases choice for consumers
Enables goods and services to be obtained at lower prices (raises living standards and may reduce inflation)
Increases competition helping to prevent monopolies
Bigger market enabling firms to gain from economies of scale and increase sales and profits
Reduces firms’ reliance on domestic markets (risk bearing economies of scale)
How trade reduces poverty – trade can help people to earn more money and therefore buy more goods and services. For example, as China has developed, many people are now paid more for working in factories than they used to get from working on farms etc in rural areas.
Increased competition from foreign firms may lead to domestic firms closing and jobs being lost
Global Interdependence rises as a result of trade. When economies are doing well this will lead to higher growth and employment but when a global shock hits, such as the credit crunch, the resulting recession spread to other countries. – eg if the USA has a recession they will buy less products from China causing problems for Chinese business.
Environment – International trade can bring with it a variety of negative externalities such as pollution, increased CO2 emissions etc. Increased trade means increasing these costs, eg environmental costs associated with transporting goods
How trade leads to income inequality – Often the benefits of trade are not shared out equally. Some countries tend to benefit more from trade than other countries. Also within countries the benefits may not be shared out equally. Entrepreneurs and business people may see more of the benefits than the workers, particularly in developing countries where wages are often low. Trade may also lead to income inequality if people are made unemployed due to foreign competition.

Does trade benefit all?
Developing countries and their people sometimes face problems gaining the benefits from
trade. Factors such as those below can limit the benefits to be had from trade:
Poor infrastructure
Poor education and training
Health and population problems
Debt
Weak government and corruption
Low inward investment
Lack of foreign currency
In addition, sometimes trade can pose problems for people in/and for developed countries.
Jobs may be lost and people unemployed due to competition from cheap goods produced
overseas. Countries may experience balance of payments problems if they are not
competitive.
Increasing Globalisation
Globalisation – an expansion of world trade in goods and services leading to greater
international interdependence
Benefits of globalisation to the UK
Low Inflation – due to greater competition and ability to produce in low cost countries
Wider Choice of Products and Services
Larger Market for UK Products
Rising Productivity – caused by foreign companies setting up in the UK and bringing with them new
methods and ideas (skills and technology transfer)
High Levels of FDI
Costs of globalisation to the UK
Increased Competition
Loss of Jobs due to above
FDI may leave – to move to low cost countries
Increased Vulnerability to External Shocks – due to international interdependence
Environmental Problems – negative externalities associated with trade and economic development
Factors Contributing to Globalisation Improvements in Transportation The costs of moving goods between countries have been reduced due to new technologies and competition. Containerisation means that goods can quickly move from ship to lorry so handling and hence costs can be reduced. With lower transport costs goods can be traded competitively around the world. Improvements in ICT ICT has made sending and communicating information very quick and very cheap. Contracts, orders, information and payments can be sent between countries immediately and at low cost. The promotion of products via the internet to a worldwide market has greatly encouraged world trade.
Rising Living Standards As countries have become richer, their citizens have demanded not only more goods but a wider variety. This growth in consumer demand has stimulated world trade.
Decline in Protectionism More countries now encourage trade. There are fewer barriers to trade with fewer tariffs on imports. Organisations such as the WTO promote world trade.
Economies of Scale Technological improvements often mean that companies have to mass produce and sell to large markets. This means that domestic markets are not enough, and large businesses have to look overseas. Not only this but they often open up factories overseas to take advantage of cheaper production costs.

Page 2.) Globalisation – A Cause for Celebration or Not?
Interdependence – the evidence points out one disadvantage of globalisation,
interdependence. When the global recession hit, many countries experienced negative
growth. It also suggests that the growth of China has become especially important with
many countries relying on Chinese demand for their commodities.
At present Chinese growth has been slowing (although it is still growing by over 6.5%). This
has been causing problems for some countries.
The evidence says that there has been a lot of debate as to whether globalisation has
been a success or not. The intro suggests the focus of the case study is:
The impact of globalisation on different countries
Changing trade patterns and how that affects countries
China and the potential impact of a slowdown in its economic growth
International Competitiveness – how countries can ensure they compete in a global
economy
The evidence sets the scene for the case study and also provides us with some possible
clues for the last question. Could it be something like?
• Using the information in the case study and your own knowledge of economics, evaluate the extent to which the benefits of international trade outweigh the costs for less developed countries such as Zambia
• Using the information in the case study and your own knowledge of economics, evaluate the extent to which the benefits of international trade outweigh the costs for the UK economy
• To what extent does globalisation benefit the UK /China/ less developed countries
• To what extent has increased trade benefited all countries? Use the evidence from the data to
give reasons for your answer
• Using the information in the case study and your own knowledge of economics, to what extent does the growth of China benefit countries through international trade
• Using the information in the case study and your own knowledge of economics, evaluate why
some countries benefit more from trade/globalisation than others
• Using the information in the case study and your own knowledge of economics, evaluate strategies to increase the growth of less developed countries
• Using the information in the case study and your own knowledge of economics evaluate the
impact of changing patterns of trade on the UK economy
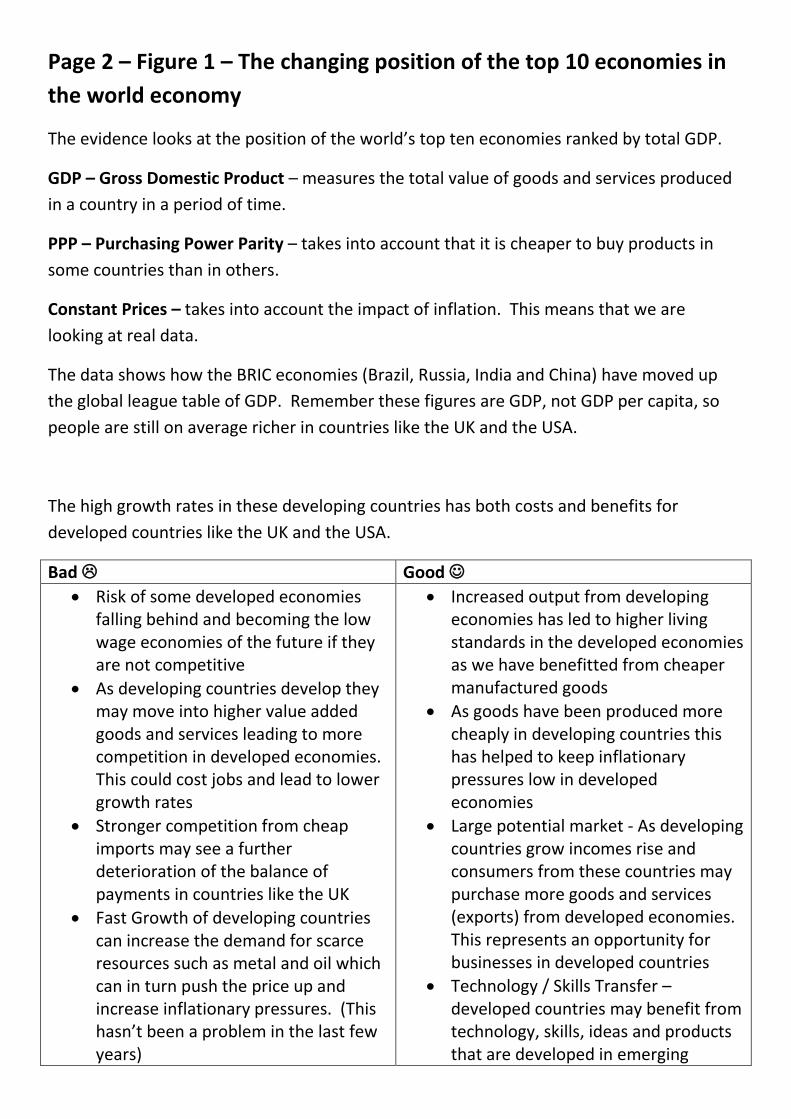
Page 2 – Figure 1 – The changing position of the top 10 economies in
the world economy
The evidence looks at the position of the world’s top ten economies ranked by total GDP.
GDP – Gross Domestic Product – measures the total value of goods and services produced
in a country in a period of time.
PPP – Purchasing Power Parity – takes into account that it is cheaper to buy products in
some countries than in others.
Constant Prices – takes into account the impact of inflation. This means that we are
looking at real data.
The data shows how the BRIC economies (Brazil, Russia, India and China) have moved up
the global league table of GDP. Remember these figures are GDP, not GDP per capita, so
people are still on average richer in countries like the UK and the USA.
The high growth rates in these developing countries has both costs and benefits for
developed countries like the UK and the USA.
Bad Good
Risk of some developed economies falling behind and becoming the low wage economies of the future if they are not competitive
As developing countries develop they may move into higher value added goods and services leading to more competition in developed economies. This could cost jobs and lead to lower growth rates
Stronger competition from cheap imports may see a further deterioration of the balance of payments in countries like the UK
Fast Growth of developing countries can increase the demand for scarce resources such as metal and oil which can in turn push the price up and increase inflationary pressures. (This hasn’t been a problem in the last few years)
Increased output from developing economies has led to higher living standards in the developed economies as we have benefitted from cheaper manufactured goods
As goods have been produced more cheaply in developing countries this has helped to keep inflationary pressures low in developed economies
Large potential market - As developing countries grow incomes rise and consumers from these countries may purchase more goods and services (exports) from developed economies. This represents an opportunity for businesses in developed countries
Technology / Skills Transfer – developed countries may benefit from technology, skills, ideas and products that are developed in emerging

Rapid development may lead to negative externalities such as pollution and may increase climate change
Interdependence – Countries like China are now much more important players in the global economy. If growth in these countries slows it can have negative repercussions for economies around the world.
economies.
Page 3 – Figure 2. The changing pattern of UK trade in goods
The evidence looks at the value of UK exports and imports of goods. From this information
we can calculate the balance of trade in goods with different countries.
• Exports – Goods and services which UK firms provide and sell to people and firms
not resident here. They result in money coming into the country
• Imports – Goods and services provided by firms based overseas to residents of the
UK. They result in money leaving the country
Balance of Trade in Goods (Visible Balance) = the value of exports of goods minus the
value of imports of goods.
• Calculate the UK Balance of Trade in goods with the USA in 2014
= 47959-42505 = 5454 million $ trade surplus
• Calculate the UK Balance of Trade in goods with the Netherlands in 2014
• = 37330-51100 = - 13770 million $ a trade deficit
Visible Trade Deficit – the evidence suggests we have a visible trade deficit with many of
our main trade partners. It is worth noting though that we only have data here for trade in
goods. To some extent this is offset by a trade surplus in services.
CHINA – We can see from the data China becoming an increasingly important source of
imports for the UK.

Overall Balance of Payments Deficit – Overall in the UK we have a balance of payments
deficit on current account.
The current account of the balance of payments is the balance of trade in goods and
services plus net investment incomes from overseas assets.
Potential Reasons for the Deficit
Loss of advantage in many industries – eg decline of traditional manufacturing industries due to
cheaper imports
Globalisation – cheaper to produce goods where labour costs are low – eg China
Growth in people’s real income – Pre 2008 the UK had a long period of uninterrupted economic
growth. As incomes rose people bought more imports BUT then recession hit….we still have a
deficit
Exchange rate – A strong exchange rate can affect competitiveness BUT £ low in 2010 and 2011 so
not this
Low levels of productivity and Investment – Our productivity has been lower than many of our
competitors due to a lack of capital investment
Relatively weak product innovation – this can be linked to low spending by UK business on R&D
Dealing with the current account deficit – May be demand side in short term BUT mostly supply side
Manipulate the Exchange Rate – low interest rates should encourage the exchange rate to fall
increasing competitiveness
Keep Inflation Under Control
Encourage More Spending on R&D – tax incentives
Improve Productivity - tax incentives, training, education
Tariffs – No, No, No

Page 4 & 5 - Figure 3 and Figure 4 – The changing pattern of
Chinese and Indian trade in goods
The data shows the increasing importance of China and India in the global economy.
Some key things to note:
Both China and India have seen a large increase in imports and exports
Both export much more than they import
Both countries export a lot to the UK (we import a lot from them)
The UK does not feature in either India or China’s top ten imports of goods
suggesting we currently do not export a great deal of goods to these countries
Impact of China and India on the UK (see earlier table as well)
Larger Market for Products – As countries such as China and India have developed
they are buying more products from the developed economies. These countries are
highly populated and as incomes rise within these countries they are buying more
products. Car manufacturers for example have seen this as a huge opportunity.
HOWEVER – they have also purchased more raw materials which has seen the price
of scarce resources such as metals etc soar (may add to cost push inflationary
pressures in the future)
Source of Cheap Products – many manufactured goods are now being made in
countries such as India and China where there is a large supply of labour and wages
are low. This has meant products can be produced at low cost. This has helped keep
our inflation rate low
Costs of Growth of China and India – Loss of (mainly) manufacturing jobs, rising prices of
raw materials, increased negative externalities

Page 6 – Figure 5 and Figure 6 - Zambian exports to the UK and China
The data shows how trade patterns in Zambia have changed as a result of the growth of
China.
Figure 5 shows:
At the start of the period Zambia exported more to the UK than China.
From 2005 to late 2012 exports to China rose significantly from less than $50 million
to almost $2500 million
In 2013 exports to China fell from almost $2500 million to $900 million
Over the whole period exports to the UK have fallen from $250 million to about
$100million
Exports to China have grown substantially from almost nothing to just under $1000
million although this is much lower than the peak in 2012
Figure 6 shows:
In the year 2000 the UK was the biggest market for Zambian exports with China only
50th
By 2014 the UK had fallen to Zambia’s 10th most important export market whilst
China had risen to become Zambia’s 2nd most important export market.
Why is this important?
Zambia has undoubtedly benefitted from the growth of China, because as China has
grown, there has been an increased demand for Zambian exports of copper.
BUT Zambia is now quite dependent on Chinese demand for its Copper. Figure 5
shows a large fall in Zambian exports to China as a result of a slowdown in the
Chinese economy.
REMEMBER – China is the number two destination for Zambian exports. Number 1 is
Switzerland! Why Switzerland? Many economists think this is purely for accounting
reasons and actually most of these exports are also going to China.

Page 7 – Figure 7 – The Supply and Demand of Copper
The evidence shows market supply and demand for copper.
The supply of copper has increased every year from 2009 to 2014. We can show this on a
diagram. (see below)
The demand for copper has increased in most years from 2009 to 2014. We can show this
on a diagram. (see below)
BUT – demand did fall in 2011 as the Chinese economy slowed down.
Over the whole period both supply and demand for copper have increased BUT supply
has grown faster than demand which is likely to have led to a fall in the price of copper.
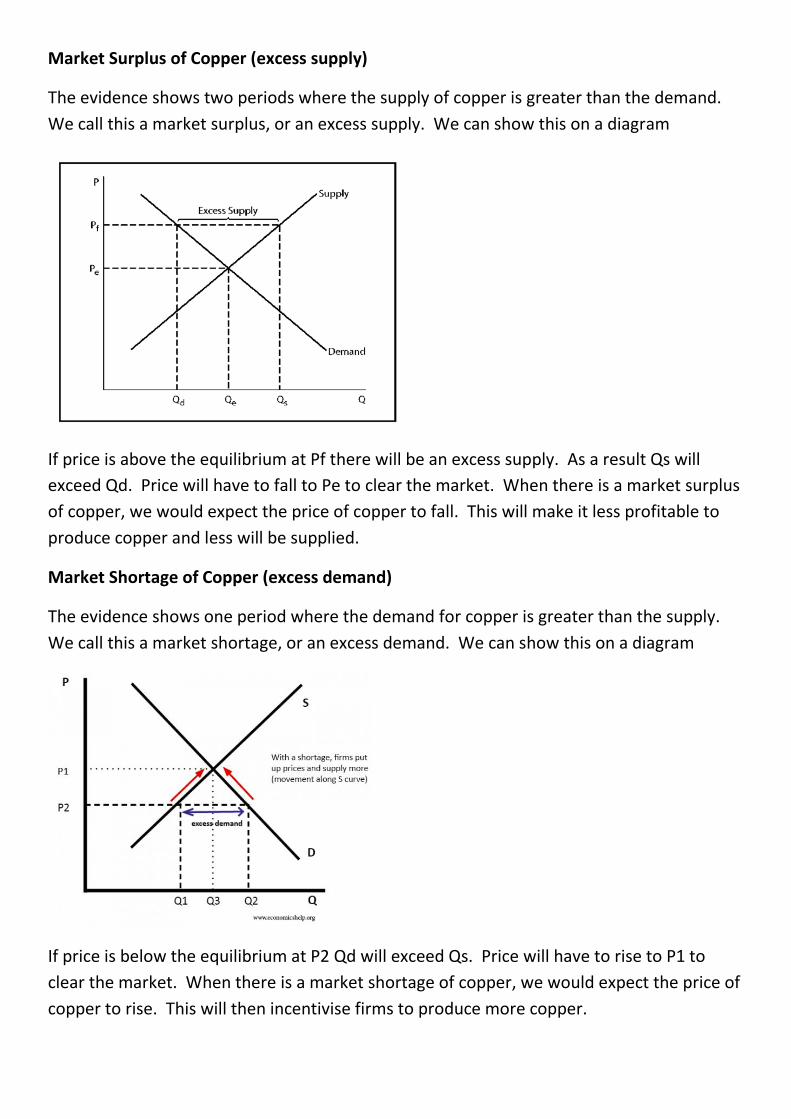
Market Surplus of Copper (excess supply)
The evidence shows two periods where the supply of copper is greater than the demand.
We call this a market surplus, or an excess supply. We can show this on a diagram
If price is above the equilibrium at Pf there will be an excess supply. As a result Qs will
exceed Qd. Price will have to fall to Pe to clear the market. When there is a market surplus
of copper, we would expect the price of copper to fall. This will make it less profitable to
produce copper and less will be supplied.
Market Shortage of Copper (excess demand)
The evidence shows one period where the demand for copper is greater than the supply.
We call this a market shortage, or an excess demand. We can show this on a diagram
If price is below the equilibrium at P2 Qd will exceed Qs. Price will have to rise to P1 to
clear the market. When there is a market shortage of copper, we would expect the price of
copper to rise. This will then incentivise firms to produce more copper.

Page 8 – Figure 8 – The Impact of a Chinese Economic Slowdown
The Chinese economy has slowed from 10% economic growth to 6.5% today. This has had a serious impact
on countries that export commodities to China. Many countries have expanded supply of commodities
anticipating a higher level of Chinese demand than has actually occurred. This has led to a collapse in some
commodity prices.
The analysis below shows the potential impact a falling price of copper can have on countries like
Zambia. These points will also apply to countries like Australia and Brazil that also specialise in the
production of commodities
The Exchange Rate – The fall in the price of commodities has caused currencies such as the Australian
Dollar and the Zambian Kwacha to depreciate. The analysis below focuses on the Kwacha but could apply
to the Aussie Dollar as well
What determines the value of the Kwacha?
• In a floating exchange rate system, the value of the currency is determined on a minute by minute
basis by free market forces (supply and demand).
ER1
Kwacha
Kwacha
Kwacha

As the price of copper falls the value of Zambian exports will decrease; as a result the
demand for Kwacha will fall and the currency will depreciate.
Don’t foget the multiplier effect!
Page 9 – Figure 9 – The price of Primary Commodities
Commodity – a raw material or primary product that can be bought and sold, such as
copper or coffee. It is uniform in quality between companies that produce/sell it. You
cannot tell the difference between one firm's product and another
The evidence shows the price of commodities from 1990 to 2015.
All commodities show a sharp increase in price from 2003 onwards.
All commodities see falling prices in 2008 as the global economic recession hit
demand. With falling GDP the demand for commodities fell. Less goods were being
produced, so less commodities were needed.
All commodities see a recovery in price in 2009/2010
Most see a further fall in price from 2011 onwards as the growth rate of China slows
BUT – for most prices are still much higher than pre 2003

Specialisation and Absolute Advantage - International Trade allows countries to specialise
in producing goods in which they have an advantage over another country. As countries
specialise in what they do best, costs of production should be lower and global output and
GDP should rise. Absolute Advantage is where a country is able to provide a good or
service using fewer resources and at a lower cost than another country. Zambia specialises
in the production of Copper
Is Specialisation always good? – Zambia and Dependency on Copper
We have talked about the benefits of specialisation and absolute advantage but is this
always good?
Interdependence - Is Zambia Vulnerable to External Shocks? - Copper accounts for 85% of
Zambia’s exports. As Zambia is so specialised it does mean that Zambia is vulnerable to any
changes in demand for and the price of copper
Page 10 - Figure 10 - Productivity in the G7 countries in 2014 The data shows productivity in the G7 countries. The data suggests that on average the 6 other G7 countries are 18% more productive than the UK. This is important as it affects our international competitiveness. Productivity – Output per worker per period of time International Competitiveness – The ability of a country to compete successfully internationally and maintain improvements in real output and wealth. Potential Impact of Lower Productivity on the UK Economy
• May make UK firms less competitive internationally as their average costs of producing goods and services may be higher than in other countries
• If UK firms are less competitive they may export less and we may buy more imports. As a result our trade deficit may increase
• With less exports our GDP may be lower than it otherwise might have been. This also means lower economic growth
• If firms are less competitive we may also see job losses in those industries where we struggle to compete. This may increase unemployment
• UK workers may have lower wages because of lower productivity. This may mean lower living standards and lower levels of Aggregate Demand than if productivty was higher.
Ways by which the UK government can tackle the UK’s productivity problem
• Spend more on education and training. This means workers are more skilled. As a result they may be able to produce more goods and services in a period of time, meaning productivity rises. However this may take a long time to have an impact. In addition more money spent does not always mean the quality of education will increase
• Cut corporation tax. This means firms have more profit after tax to invest in capital such as machinery. With more and better capital more can be produced per worker boosting productivity. However if this capital is labour saving it may mean some job losses which could increase unemployment
• Subsidise firms for capital investment. This could encourage firms to invest in capital. With more and better capital more can be produced per worker boosting productivity. However if this capital is labour saving it may mean some job losses which could increase unemployment
• Invest more in infrastructure. They could spend more on improving transport networks. This could make it easier for employees to move around the country and make it quicker to transport goods. As a result each worker may be able to produce more on average. However this will involve large increases in government spending when the government has been trying to eliminate its large budget deficit.

Page 11 - Fig. 11 GDP per capita (US$) and percentage of labour force that completed primary, secondary and tertiary education in selected countries (2012) The data shows the link between GDP per capita and education levels.
• GDP measures the total value of goods and services produced in a country in a period of time.
• GDP per capita is per person, or per head. It is calculated by dividing the GDP by the population
Does the data suggest a link between GDP per capita and levels of education?
• The data does suggest a link. In most cases countries with higher levels of education have higher GDP. For example in Switzerland 99.7% of people have completed education of some form and they have a GDP of $83, 000. In Cambodia and Morocco only 51% and 65% of the population are educated to some level and they have much lower levels of GDP ($2800 and $948)
• The countries with the highest percentages of people that have completed P, S and T education have a higher GDP in general. This suggests tertiary education to be particularly important.
• However there are some countries that buck the trend. The UK has very high levels
of people with tertiary education but has lower GDP than Switzerland, Singapore and Germany
• Malaysia has a high percentage of people that have completed P, S and T education but its GDP per capita is relatively low
How does education boost competitiveness?
• Education can increase productivity. If workers are more productive, firms in a country can produce at a lower Average Cost. This may enable them to cut prices and therefore the country will be more competitive.
• Higher levels of education can increase the skill levels of employees in a country. This may mean firms are more innovative or can produce better quality products. As a result the demand for a country’s exports will rise and it will be more competitive.


Page 12 - Fig. 12 The top 10 countries for inflows and outflows of FDI (US$ billions 2014) The data shows inflows and outflows of FDI. Asian countries are increasingly important in both providing and receiving FDI. FDI – Foreign Direct Investment - The investment by foreign companies in the production of goods and services in another country How can the UK attract more FDI?
• Lower corporation tax rates • Remain in the EU • Reduce minimum wage and bureaucracy • Offer incentives such as grants, tax relief etc
How does receiving FDI benefit countries like the UK?
• Creates jobs in the firm itself and in supporting industries • Multiplier Effect • Adds to UK GDP • Contributes to tax revenue for UK government • Helps our balance of payments • Skills and technology transfer • However….. • There may be more competition for existing firms • Above effects may be limited • Profits may be repatriated • Tax avoidance from transfer pricing
How does providing FDI benefit countries like China?
• May enable access to needed raw materials such as copper, which help it to grow • Profits flow back to China helping its balance of payments • Allows firms from these countries to circumvent tariff barriers, access new markets,
reduce transport costs etc

Page 13 - Fig. 13 Selected costs and benefits of MNCs on host countries The evidence shows costs and benefits of MNCs to host countries. You need to make sure you can explain each cost and benefit fully.
Some Key Terminology to Use Multinational Company - A business which has its headquarters in one country but has operations in a range of other countries. Transfer Pricing - Transfer pricing happens whenever two companies that are part of the same multinational group trade with each other. This can be used to avoid paying tax in countries where corporation tax is high and instead declare high profits and pay more tax in countries where rates are low. Skills and Technology Transfer – MNCs will often bring new skills and new technology to the countries in which they operate. These skills and technologies can spread to other sectors and boost economic growth. Negative Externalities – negative third party impacts of production or consumption of a good or service – eg pollution caused by MNCs Multiplier Effect – Where an injection of spending into an economy creates more spending than the initial amount. Eg If an MNC employs local people these people will spend more in the local economy Impact of MNCs?
Are generally good – even if wages are low by our standards they are usually at least as high as what local firms would pay
Can often depend upon the relative power of the MNC and the country. Developed countries and some developing countries like China have strong government and are able to control the power of MNCs. Some countries like Zambia may need the MNC more than the MNC needs the country and so the MNC may be able to get away with more if the government turns a blind eye.

The Big Question – worth 12 marks
Here are all the previous 12 mark questions we have had
2015 Question - Using information in the stimulus material and your own knowledge of
economics, evaluate the effectiveness of international trade as a method of supporting
economic growth in developing countries - 12 marks
2016 Question - Using information in the stimulus material and your own knowledge of
economics, evaluate the case for the UK joining the Eurozone - 12 marks
2017 - Possible Big Mark Questions
Using the information in the case study and your own knowledge of economics, evaluate the extent to which the benefits of international trade outweigh the costs for less developed countries such as Zambia
Using the information in the case study and your own knowledge of economics, evaluate the extent to which the benefits of international trade outweigh the costs for the UK economy
To what extent does globalisation benefit the UK /China/ less developed countries
To what extent has increased trade benefited all countries? Use the evidence from the data to give reasons for your answer
Using the information in the case study and your own knowledge of economics, to what extent does the growth of China benefit countries through international trade
Using the information in the case study and your own knowledge of economics, evaluate why some countries benefit more from trade/globalisation than others
Using the information in the case study and your own knowledge of economics, evaluate strategies to increase the growth of less developed countries
Using the information in the case study and your own knowledge of economics evaluate the impact of changing patterns of trade on the UK economy
Examiner’s Report - feedback from previous year. Read this and take note:
Data – don’t just trawl through. Pick out key trends and use the data to illustrate points
Answer the Specific Question! & be specific
Evaluation – prioritise, discuss which might have a larger influence. Look for counter
arguments to points you have made
Conclusion – prioritise or offer something new. Don’t just repeat points
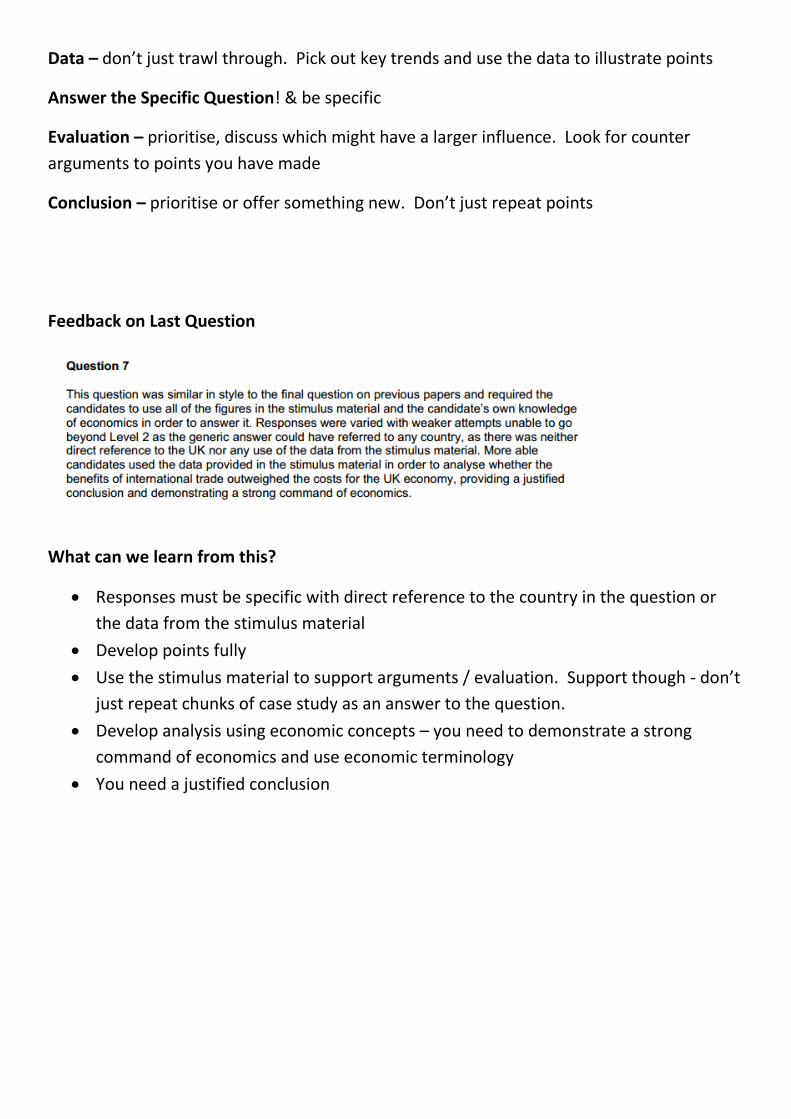
Feedback on Last Question
What can we learn from this?
Responses must be specific with direct reference to the country in the question or
the data from the stimulus material
Develop points fully
Use the stimulus material to support arguments / evaluation. Support though - don’t
just repeat chunks of case study as an answer to the question.
Develop analysis using economic concepts – you need to demonstrate a strong
command of economics and use economic terminology
You need a justified conclusion