uk green growth index
TRANSCRIPT

UK GREEN
GROWTH INDEX
CHALLENGES AND OPPORTUNITIES FROM
THE NET ZERO TRANSITION ACROSS THE
NATIONS AND REGIONS OF THE UK
SEPTEMBER 2021
Commissioned by

UK Green Growth Index
2
ABOUT OXFORD ECONOMICS
Oxford Economics was founded in 1981 as a commercial venture with Oxford University’s business
college to provide economic forecasting and modelling to UK companies and financial institutions
expanding abroad. Since then, we have become one of the world’s foremost independent global
advisory firms, providing reports, forecasts and analytical tools on more than 200 countries,
250 industrial sectors, and 7,000 cities and regions. Our best-in-class global economic and industry
models and analytical tools give us an unparalleled ability to forecast external market trends
and assess their economic, social and business impact.
Headquartered in Oxford, England, with regional centres in New York, London, Frankfurt, and
Singapore, Oxford Economics has offices across the globe in Belfast, Boston, Cape Town, Chicago,
Dubai, Dublin, Hong Kong, Los Angeles, Melbourne, Mexico City, Milan, Paris, Philadelphia, Stockholm,
Sydney, Tokyo, and Toronto. We employ 400 full-time staff, including more than 250 professional
economists, industry experts, and business editors—one of the largest teams of macroeconomists and
thought leadership specialists. Our global team is highly skilled in a full range of research techniques
and thought leadership capabilities from econometric modelling, scenario framing, and economic impact
analysis to market surveys, case studies, expert panels, and web analytics.
Oxford Economics is a key adviser to corporate, financial and government decision-makers and
thought leaders. Our worldwide client base now comprises over 2,000 international organisations,
including leading multinational companies and financial institutions; key government bodies and trade
associations; and top universities, consultancies, and think tanks.
September 2021
All data shown in tables and charts are Oxford Economics’ own data, except where otherwise stated
and cited in footnotes, and are copyright © Oxford Economics Ltd.
This report is property of Lloyds Banking Group and may not be published or distributed
without their prior written permission.
The analysis and results presented here are based on information provided by third parties, upon
which Oxford Economics has relied in producing its report and forecasts in good faith. Any
subsequent revision or update of those data will affect the assessments shown.
To discuss the report further please contact:
Andrew P Goodwin: [email protected]
Oxford Economics
4 Millbank, London SW1P 3JA, UK
Tel: +44 203 910 8000
UK Green Growth Index
3
FOREWORD
Lloyds Banking Group commissioned Oxford Economics to help share the story
of the opportunities and challenges that the green economy presents for the
UK.
Ultimately, we want to highlight the opportunities for the UK, showing how
green investments can grow our economy across all nations and regions of the
country and help it to recover, while also helping to improve our environment
and reduce harmful carbon emissions.
Following a foundational paper released in July 2021, this second paper
examines the opportunities for green growth across the different nations and
regions of the UK.
During this critical year, we need to ensure that actions coming out of the
United Nations Climate Change Conference (COP26) in November, as well as
other government climate policies, are relevant to the UK’s nations and
regions. To help inform this discussion, we have asked Oxford Economics to
take stock of how different parts of the UK could be impacted by the challenges
and opportunities that will emerge from the net zero transition.
This research shows clear signs that the UK’s green economy is starting to
take shape. Every nation and region has its own story, but each has an
important role to play in transitioning to a greener economy. In line with this
research, Lloyds Banking Group is committed to supporting regional
regeneration to ensure no part of the UK is left behind by the transition. We will
mobilise support across our business help to make sure every nation and
region can seize the huge opportunities that the green economy represents.
Lloyds Banking Group
September 2021

UK Green Growth Index
4
TABLE OF CONTENTS
Executive summary ............................................................................................. 5
1. Introduction...................................................................................................... 7
1.1 The great green opportunity ..................................................................... 7
1.2 Aims of this study ..................................................................................... 8
2. Developing a UK green growth index ............................................................. 9
2.1 Conceptual framework ............................................................................. 9
2.2 Indicators ................................................................................................ 10
2.3 Calculating the indices ........................................................................... 13
3. Results across nations and regions .............................................................. 14
3.1 Green Growth Challenge Index ............................................................. 14
3.2 Green Growth Opportunity Index ........................................................... 15
3.3 Challenges and opportunities ................................................................ 17
4. East of England ............................................................................................. 19
5. London .......................................................................................................... 21
6. Midlands ........................................................................................................ 23
7. North .............................................................................................................. 25
8. Northern Ireland ............................................................................................ 27
9. Scotland ........................................................................................................ 29
10. South East ................................................................................................... 31
11. South West .................................................................................................. 33
12. Wales .......................................................................................................... 35
13. Yorkshire and the Humber .......................................................................... 37
Appendix 1: Methodology .................................................................................. 39
Appendix 2: Indicators used in the Green Growth Challenge Index ................. 45
Appendix 3: Indicators used in the Green Growth Opportunity Index............... 53
Appendix 4: Sources for regional economic indicators ..................................... 64

UK Green Growth Index
5
EXECUTIVE SUMMARY
In 2019 the UK parliament passed legislation to commit the country to reducing
net emissions of greenhouse gases by 100% by 2050. Reaching this goal will
require substantial investment: the Climate Change Committee estimates that
the UK will need to invest some £1.4 trillion between 2020 and 2050 to reach
net zero. This includes an average of £50 billion per year between 2025 and
2050—an amount broadly comparable to the government’s annual spending on
schools. The need to invest is particularly great in areas such as low-carbon
power, the electrification of transport, and the upgrading of homes to improve
insulation and fit low-carbon sources of heat and hot water.
This need to invest means there is a unique opportunity for British businesses
to innovate, produce, and supply the goods and services needed to enable the
transition, not only in the UK but across the globe.
At the same time, for many parts of the economy the transition will create
challenges due to the need to adapt products, processes, and skills. For
example, agriculture is anticipated to undergo significant changes in response
to reduced consumption of meat and dairy products, and an increased need to
use land for tree planting and the growth of biofuel crops. In some industries,
particularly those linked to fossil fuels, activity will need to be scaled back.
The nature and scale of these opportunities and challenges will inevitably vary
across the UK. Disruption may be greater in areas where there are
concentrations of high emitting industries, while areas which already have an
emerging base of green economy activity may be able to more quickly
capitalise on the new opportunities. Broader competitiveness factors,
particularly those related to skills and innovation, will also create differences in
the experience of the transition across the nations and regions of the UK.
While there remains considerable uncertainty in exactly how the transition
could evolve across different parts of the UK, it is informative to start taking
stock of which areas may be most affected, both positively and negatively.
To do this we have reviewed a range of data to develop a broad sense of
where challenges and opportunities may be greatest. We have amalgamated
these data into a “UK Green Growth Index” to assess the degree to which each
UK nation and region may be impacted by the challenges of transition, and how
well placed they may be to capitalise on green growth opportunities.
Our research suggests that green growth opportunities are especially strong in
Scotland, given its existing base of green economy activity (particularly in the
energy sector) and its access to a workforce with relevant skills. Similarly,
Wales appears well placed to capitalise on green growth opportunities,
although it may face greater disruption in the nearer term due to its reliance on
high emitting industries. Northern Ireland is also relatively exposed to disruption
and may need to accelerate efforts to put in place the factors needed to fully
exploit green economy opportunities.

UK Green Growth Index
6
Amongst English regions, the South East and South West appear to be best
placed to capitalise on the green economy and are less exposed to disruption
from the transition than many other parts of the UK. In contrast, Yorkshire and
the Humber may face greater disruption and, like Northern Ireland, has further
to go to develop some of the factors needed to capitalise on green growth.
London is somewhat of an outlier: its status as a city-region with a service-
orientated economy means it is much less exposed to the challenges than
areas which rely more on industrial activity, but it also has less scope to
capitalise on green economy opportunities in fields such as manufacturing and
energy (although it is well positioned to develop as a centre for green finance
and other professional services).
Fig. 1. Green growth challenges and opportunities across the UK
In exploring these themes, it is important to emphasise that across all parts of
the UK considerable thought and effort is being dedicated to determining how
to make economies more sustainable and how to capitalise on green growth.
Every part of the UK has centres and clusters of expertise in particular aspects
of the green economy. Through this research we hope to inform discussion
around how each part of the UK may make the most of its own attributes and
characteristics to thrive in a net zero future.
North
Yorkshire and the Humber
Midlands
East of England
London
South East
South West
Wales
Scotland
Northern Ireland
30
40
50
60
70
80
90
10 20 30 40 50 60 70 80 90
Source: Oxford Economics
Greater opportunity
Less challenge
Opportunity
Challenge
Less opportunityLess challenge
Greater opportunity
Greater challenge
Less opportunityGreater challenge

UK Green Growth Index
7
1. INTRODUCTION
1.1 THE GREAT GREEN OPPORTUNITY
The Climate Change Committee (CCC) estimates that the UK will need to
invest £1.4 trillion between 2020 and 2050 to reach net zero.1 This includes an
average of £50 billion per year between 2025 and 2050—an amount broadly
comparable to the government’s annual spending on schools.2
The CCC suggests that some 40% of the investment between 2020 and 2050
will need to be directed to the power sector, and a further 24% will be needed
in land transport to electrify the UK’s vehicle fleet. Another substantial area of
investment will be homes, where there is a need to invest some £253 billion to
improve home insulation and fit low-carbon sources of heat and hot water. The
estimated investment need is smaller for agriculture, although the sector is
nonetheless anticipated to undergo significant changes in response to reduced
consumption of meat and dairy products, and an increased need to use land for
tree planting and the growth of biofuel crops.
Governments around the world are seeking solutions to similar challenges and
considering how their own transitions can be financed. But this need to invest
means that there is also a unique opportunity for British businesses to
innovate, produce, and supply the goods and services needed to enable the
transition, not only in the UK but across the globe.
Official estimates suggest that the UK’s green economy already supports
200,0003 to 400,0004 jobs. And while there is considerable uncertainty
surrounding future growth, two recent studies have suggested that by 2050 the
number of jobs in the green economy could grow to between 1.4 million5 and
2.5 million6.
While there is undoubtedly significant growth potential for the UK’s green
economy, the impact of this growth on the overall size of the economy is so far
unclear. Many of the new green jobs will emerge as a result of the
transformation of existing roles, for example as heating engineers switch to
fitting heat pumps instead of gas boilers, or car manufacturers switch
production from petrol-powered to electric vehicles. What is more, certain
carbon-intensive activities, such as those linked to fossil fuels, will need to
scale back over the next 10 years or so.
1 Climate Change Committee, The Sixth Carbon Budget: The UK’s Path to Net Zero, 2020. 2 HM Treasury, Policy paper: Budget 2020, accessed April 2021.
Table 1.9 shows that the Departmental Resource Budget for Schools was £47.6 billion in 2020-21. 3 ONS, Low carbon and renewable energy economy estimates, accessed April 2021. 4 ONS, Environmental goods and services sector (EGSS) estimates, accessed April 2021. 5 Ecuity, Local green jobs – accelerating a sustainable economic recovery, 2020. 6 McCullough et al., UK business opportunities of moving to a low-carbon economy, 2017.

UK Green Growth Index
8
1.2 AIMS OF THIS STUDY
This study builds on our earlier research for Lloyds Banking Group which
reviewed existing evidence on the economic implications for the UK of the
transition to a net zero future.7 From that review it was clear that different
industries would face very different challenges and opportunities. It was also
clear that other enabling factors will be central to the UK’s ability to capitalise
on green growth opportunities, most notably ensuring the workforce has the
right skills to adapt to and embrace new approaches and activities, and that the
UK can build on its strengths in research and engineering to help deliver the
innovation upon which the net zero economy will rely.
It follows from these conclusions that different parts of the UK will similarly face
different challenges and opportunities from the net zero transition, reflecting
differences in their industrial structures, skills endowments, and innovative
capacities.
Our previous research also highlighted that growth prospects for the UK’s
green economy are extremely uncertain, as reflected in the wide range of
green growth forecasts produced by different researchers. This uncertainty is
likely to be even greater for any single part of the UK. The location of green
economy activity may be strongly influenced by the decisions of policymakers
and investors, and such decisions are difficult to predict, particularly over a
period of decades.
Nonetheless, it appears reasonable to believe that parts of the UK with greater
existing bases of green industry and other “green economy success factors”
should be better placed to capitalise on green growth opportunities.
Similarly, parts of the UK which rely more on those industries and activities that
will experience more disruption from the transition may face greater challenges
as the country moves towards net zero.
In this study we build on these observations to develop a “UK Green Growth
Index”. In doing so our aim is to give a sense of which UK nations and regions
may be most exposed to the challenges posed by the net zero transition, and
where there may be greatest scope to capitalise on the growth of the green
economy.
We start in Chapter 2 by outlining our approach, and in Chapter 3 we provide
an overview of our findings. Subsequent chapters present detailed results for
each UK nation and region. The appendices set out further details of our
methodology and data sources.
7 Oxford Economics, Green Growth: opportunities for the UK, 2021

UK Green Growth Index
9
2. DEVELOPING A UK GREEN
GROWTH INDEX
The UK’s path to net zero is not yet fully mapped out. In certain crucial areas
the route to decarbonisation relies on new technologies which are still in
development, while the extent to which UK businesses may capture the global
market for green goods and services is similarly unclear. It is arguably even
more challenging to identify how specific parts of the UK may be affected by
these uncertain trends.
Nonetheless, by looking across a range of indicators we can start to build up a
picture of where challenges and opportunities may be greatest across the
nations and regions of the UK. To do this we have brought together a range of
sub-national data sets into a “UK Green Growth Index” to summarise the
degree of challenge and opportunity that each part of the UK could face.
In this chapter we outline the main principles and elements of our index.
Further details of the methodology and data sources are presented in the
appendices.
2.1 CONCEPTUAL FRAMEWORK
Our starting point is that the net zero transition is likely to create challenges
and opportunities for the economies of the nations and regions which make up
the UK. Our index is therefore constructed across two “domains” to reflect this:
• Green growth challenge: the degree to which the net zero transition
could create economic challenges.
• Green growth opportunity: the degree to which the conditions are in
place to capitalise on the growth of the green economy.
Within each domain we have identified a set of themes which may be expected
to influence an area’s prospects. These themes were informed by the literature
review and consultations undertaken for our first phase of research.8
To consider the degree of challenge that different parts of the UK could face we
identified the following three themes:
• Dependence on carbon-intensive industry. Parts of the UK that are
more reliant on carbon-intensive industry may be more exposed to
labour market and other economic disruption from scaling back or re-
orientating such activity during the transition.
• Emissions. Parts of the UK with greater current emissions will need to
make greater efforts and investments to adapt.
• Fossil fuel power infrastructure. Reaching net zero will drive greater
demand for electricity and this will need to be generated from clean
8 Oxford Economics, Green Growth: opportunities for the UK, 2021

UK Green Growth Index
10
sources. Areas where there is still a large reliance on fossil fuels are
likely to face a greater need for investment and adaptation.
For the green growth opportunity domain we identified four themes:
• Base of green industry. Parts of the UK with a current or expected
future base of green activity may be better placed to capitalise on
green growth opportunities.
• Skills and training. Areas with highly skilled workers in relevant fields
may be better placed to adapt to and enable the innovation needed to
drive the transition.
• Innovation. A stronger base of innovative activity may mean that a
nation or region is better placed to develop the technologies and
techniques needed to decarbonise its economy and capitalise on green
growth opportunities.
• Renewable energy. Areas with a larger existing renewable energy
sector may be more likely to have the skills, expertise and
infrastructure to build on this in future.
It is important to acknowledge that there is a degree of overlap between the
themes. For example, emissions are likely to be greater in parts of the country
more reliant on carbon-intensive industry. Areas with more research,
development, and innovation may also have a greater concentration of highly-
skilled workers. And so on. Nonetheless, our intention is to take a broad
perspective and capture as many considerations as possible. The statistical
techniques applied within the scoring process take into account the scope for
overlap and help us to avoid “double counting”.
2.2 INDICATORS
Guided by the themes outlined above, we searched existing literature and data
sources to identify data sets to help us understand the prospects for each
nation and region of the UK. We filtered the long lists of variables identified into
a final list of indicators from which to calculate index values for each of the two
domains. This shortlisting sought to avoid including too many variables which
would essentially do the same job within the index, and to ensure that the
factors driving the results could be clearly identified and explained. The
shortlisting was informed by a combination of statistical analysis and expert
judgement.
The final lists of indicators are presented below. There are further details of the
indicators and data sources in the appendices.

UK Green Growth Index
11
Fig. 2. Indicators included in the degree of challenge domain
Theme Indicators and rationale
Dependence on carbon-intensive
industry
Jobs in high emitting industries The share of jobs within the 10 highest-emitting industries. Examples of these industries include fossil fuel extraction and processing, utilities, transport, and agriculture. A greater reliance on such activities may indicate a greater risk of labour market disruption, as well as a greater need for investment and adaptation. Jobs requiring upskilling The share of jobs that will require skills to be significantly adapted to meet the needs of the net zero economy (based on the Place-based Climate Action Network’s Just Transition Jobs Tracker).9
Reliance on livestock farming The share of regional gross value added (GVA) which relies on livestock farming—the element of agriculture which may be most exposed to disruption from the transition.
Emissions
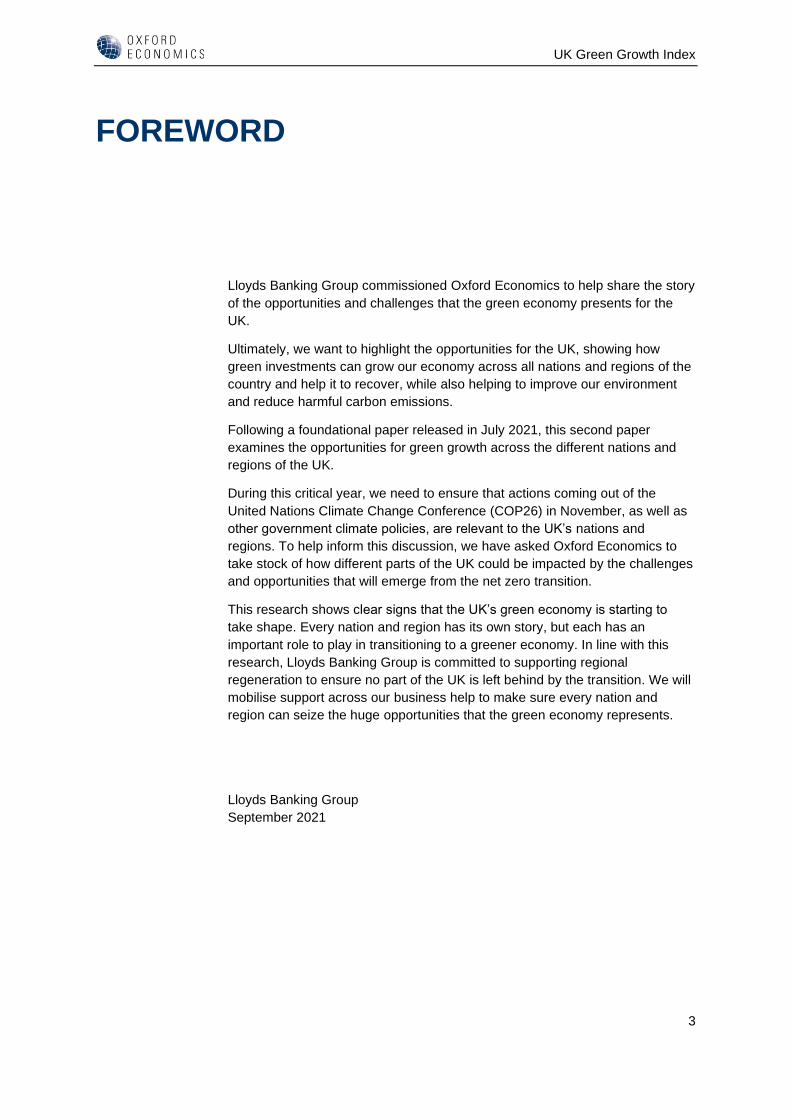
Commercial emissions The overall level of emissions from industrial and commercial sources, relative to the size of the area’s workforce.
Commercial emissions -v- expected The extent to which emissions are higher or lower than would be expected given the area’s industrial structure. If emissions are lower than expected, this may indicate that the area is more advanced with the decarbonisation process or that the area’s specialisms within industries are more orientated towards lower emitting activity.
Household emissions The level of emissions from domestic sources, relative to the area’s population. A higher value may indicate a greater need to invest in lower emissions technologies for homes.
Transport emissions Emissions from transport, relative to the area’s population. A higher value may indicate a greater need for investment or behaviour change to reduce transport emissions.
Fossil fuel power infrastructure
Fossil fuelled generating capacity The overall scale of electricity generating capacity that relies on fossil fuels. A greater value implies a greater need to invest in cleaner replacement technologies. Considered in absolute terms since the power generated is assumed to be distributed nationally.
9 Place-based Climate Action Network (PCAN), Just Transition Jobs Tracker, 2019.

UK Green Growth Index
12
Fig. 3. Indicators included in the green growth opportunity domain
Theme Indicators and rationale
Base of green industry
Green economy jobs Current jobs in the low carbon and renewable energy economy relative to the overall size of the workforce. A strong existing base of green industry may provide a good foundation for future growth. Values for English regions have been imputed based on each region’s sector mix.
Energy jobs needed by 2050 National Grid forecasts of the jobs needed in the energy sector and its supply chains to meet net zero.10 Estimated as a share of current jobs.
Vehicle manufacturing Share of regional GVA which comes from motor vehicle manufacturing. Future growth in electric vehicle manufacturing might be expected to occur in areas where there is already a strong base of vehicle manufacturing.
Innovation
Research and development The value of research and development expenditure, relative to the nation or region’s population. Indicates the overall intensity of innovation activity.
Firms innovating to reduce their environmental impact Based on the BEIS UK Innovation Survey. Indicates the share of firms for which sustainability is already an important factor in the decision to innovate.11
Skills and training
Science, technology, engineering, mathematics (STEM) workers The share of workers employed in STEM occupations. Indicates the degree to which an area already has a stock of workers in the types of occupations which may be most important to driving innovation and adaptation efforts.
Higher education students in green-related subjects The number of higher education students enrolled in green-related subjects, relative to the area’s population. Indicates the potential future supply of highly-skilled workers in relevant fields.
Renewable energy
Domestic renewable energy installations The share of households with renewable energy installations. Indicates the area’s propensity to be an early adopter of domestic renewable energy.
Commercial renewable energy capacity Renewable energy capacity installed by businesses, relative to the size of the area’s workforce. Indicates the propensity of businesses to be an early adopter of renewable technologies.
Grid renewable energy capacity Total grid renewable energy capacity relative to population. Indicative of the existing base of green energy expertise and support infrastructure.
Electric vehicle charging points Number of charging points relative to population size. Indicates the uptake of electric vehicles and influences their desirability for potential new users.
10 National Grid, Building the Net Zero Energy Workforce, 2020. 11 Department for Business, Energy & Industrial Strategy, UK innovation survey 2019, 2020.

UK Green Growth Index
13
2.3 CALCULATING THE INDICES
The final step in our analysis was to normalise, aggregate, and weight the
indicators to obtain an overall index value for each nation and region in each of
the two domains.
The indices are presented such that a value of 50 is equivalent to the UK
average. The index values also provide insights into the degree to which
performance differs from the UK average: for example, a value of 25 or 75 is
one standard deviation less or greater than the UK average. Index values were
capped such that they could not fall below zero or exceed 100.
Our results are presented in the next chapter. Full details of the methodology
can be found in Appendix 1.

UK Green Growth Index
14
3. RESULTS ACROSS NATIONS AND
REGIONS
In this section we provide a comparative overview of the challenge and
opportunity indices across the different parts of the UK.
It is important to emphasise at the outset that even in parts of the UK receiving
lower index values, considerable efforts are underway to work towards a more
sustainable economy. Every part of the UK has important green economy
assets, such as innovation centres, universities, and clusters or corridors of
enterprises in particular fields (some examples are provided in the chapters
focusing on each region). We hope that the index will stimulate debate and
discussion around how each area may best manage the challenges of
transition and capitalise on its own unique set of attributes and assets to realise
green growth.
3.1 GREEN GROWTH CHALLENGE INDEX
The values from the Green Growth Challenge Index are presented in the chart
below. The bar for each area is shaded to show how each of the three themes
contributes to a nation or region’s index value, taking into account the
weightings applied.
Our analysis suggests the net zero transition could present the greatest
challenges for Wales and Northern Ireland. These nations have the greatest
share of employment in high-emitting sectors and the some of the highest rates
of emissions across all of the nations and regions. This implies that there could
be the greatest potential for economic disruption in these parts of the UK, and
relatively high levels of investment will be needed to re-orientate infrastructure
and economic activity towards cleaner activities and technologies.
At the other end of the scale, London receives the lowest value on the
challenge index, indicating that it may be less affected by many of the
challenges the net zero transition will present. This finding is perhaps
unsurprising given the unique nature of London as the UK’s only city-region,
with an economy that is much more orientated towards services and much less
reliant on industry. Emissions from households and transport are also lower on
average, reflecting a housing mix with a greater share of smaller properties12
and the greater availability and use of public transport.
Other regions in the south and east of England also appear relatively well
placed to face the challenges of the net zero transition. In the South East there
is a relatively low dependence on carbon-intensive industries such as oil
extraction and heavy manufacturing. Across the South East, South West, and
East, rates of emissions are generally below the UK average (although an
12 Ministry of Housing, Communities & Local Government, English Housing Survey 2018-19, accessed July 2021

UK Green Growth Index
15
important exception is transport emissions, which are relatively high in the East
and South East).
Fig. 4. Green Growth Challenge Index
A higher value denotes that a nation or region is more exposed to disruption
from the net zero transition
Our index suggests that Yorkshire and the Humber could face the greatest
degree of challenge amongst English regions. While it has a similar degree of
dependence on carbon-intensive industry to most other English regions,
emissions rates are relatively high, and the region is home to a large amount of
fossil fuelled power generating capacity. In fact, only the Midlands has more
fossil-fuelled generating capacity. We also find that the Midlands has the third
greatest dependence on carbon-intensive industry. In part this reflects that a
relatively high share of jobs (more than 11%) is estimated to require upskilling
to meet the needs of the net zero economy.13
3.2 GREEN GROWTH OPPORTUNITY INDEX
Across all parts of the UK there is scope to capitalise on the opportunities
presented by the green economy. Our analysis suggests that these
opportunities could be particularly strong in Scotland, where there are already
some 21,000 green economy jobs. This means that Scotland is home to 11%
of the UK’s green jobs, compared to the nation’s 8% share of jobs across all
industries. Scotland also appears well placed for further green growth, due to a
strong concentration of higher education students in green-related subjects and
a well-developed base of renewable energy infrastructure (although take up of
domestic renewables is lower than in other parts of the UK).
Green growth opportunities also appear strong for Wales. Similar to Scotland,
the current share of green economy jobs in the Welsh workforce is above the
UK average, with the energy sector expected to drive further demand over the
13 Place-based Climate Action Network (PCAN), Just Transition Jobs Tracker, 2019.
80.0
74.3
66.0
58.8
56.1
53.8
53.5
48.5
40.7
19.8
Wales
Northern Ireland
Yorkshire and the Humber
Midlands
Scotland
North
East of England
South West
South East
London
0 20 40 60 80 100
Dependence on carbon-intensive industry Emissions Fossil fuel power infrastructure
Source: Oxford Economics

UK Green Growth Index
16
coming decades. Wales also has a relatively high take up of renewable energy
infrastructure across households, businesses and the grid. Wales does,
however, have scope to build its innovation ecosystem: an average of £251 per
resident is spent on research and development, which is less than half the UK
average.
Fig. 5. Green Growth Opportunity Index
A higher value denotes where green economy opportunities could be strongest
In sharp contrast to the challenge index, our analysis suggests that green
growth opportunities may be limited in London. While London has the greatest
density of electric vehicle charge points out of all nations and regions (almost
70 per 100,000 residents), it has relatively little renewable energy capacity.
Once again, this may reflect a lack of space suited to wind energy, and less
private roof space for domestic solar installations. More broadly, opportunities
are limited for London to capitalise on green growth in the energy and
manufacturing industries. Nonetheless, London has a large base of workers in
science, technology, engineering, and mathematics roles and relatively high
rates of spending on research and development. It could therefore offer good
potential to act as an enabler of the transition through its role as a centre of
financial and other advanced services, even if this potential is not well reflected
within the variables used in our model.
Northern Ireland sits just above London in the index. Although its industry
composition is favourable to green economy opportunities, its overall index
value is held back by lower rankings for innovation and skills.
Amongst English regions, opportunities appear slightly stronger in the South
West and South East. The former is mid-ranked in terms of its base of green
industry and innovation, but benefits from a strong showing in the renewable
energy intensity theme (the South West is the highest ranked area for
renewable energy installations amongst households and businesses). The
South East appears well placed to capitalise on its strong base of research and
development activity and skilled workforce.
80.6
63.5
54.6
52.0
48.7
48.3
45.6
45.1
42.7
36.5
Scotland
Wales
South West
South East
Midlands
North
East of England
Yorkshire and the Humber
Northern Ireland
London
0 20 40 60 80 100
Base of green industry Innovation
Skills and training Renewable energySource: Oxford Economics

UK Green Growth Index
17
Relatively little separates the Midlands and the North in our index. The
Midlands is mid-ranked across most of the themes, although has a lower
concentration of renewable energy than many other parts of the UK. The North
benefits from strong opportunities in green industry, particularly the energy
sector and vehicle manufacturing.
The degree of opportunity is also very similar for the East of England and
Yorkshire and the Humber. The East scores highly for innovation, but this is
offset by a lower ranking on skills and training due to a relatively low
concentration of higher education students in green-related subjects. The key
strengths for Yorkshire and the Humber are its base of green industry and
renewable energy capacity, although the region is expected to have less
growth potential in the energy sector than some other parts of the UK.
3.3 CHALLENGES AND OPPORTUNITIES
We can plot the challenge and opportunity index values for each nation and
region to identify groups that may be affected in similar ways by the net zero
transition.
In bringing together the two indices we find a central cluster of English regions
which may face similar degrees of challenge and opportunity. But around this
cluster are a number of outliers which warrant particular consideration.
Wales and Northern Ireland appear on the right-hand side of the diagram,
reflecting that they may experience some of the greatest disruption from the
transition. However, Wales has a high score on the opportunity index,
indicating there is already a firm foundation of green economy activity upon
which to build, particularly within the energy sector. In contrast, for Northern
Ireland there is a greater need to develop some of the factors needed to drive
its green economy towards a smooth transition.
Scotland is another outlier. While our analysis suggests the transition could
present a similar degree of challenge to many English regions, Scotland
already has a strong base of green economy activity and assets from which to
build and is well positioned to become one of the UK’s green growth leaders.
The other clear outlier is London, where the service-based economy is likely to
be much less impacted by the transition, but where it will also be more difficult
to develop aspects of the green economy based on manufacturing or natural
resources (although there is clearly potential for London to capitalise on its
position to become a centre of green finance and other services).

UK Green Growth Index
18
Fig. 6. Green growth challenges and opportunities
Turning to the cluster of English regions in the centre of the diagram, we
observe that for the most part those in the south are slightly better placed in
terms of both challenges and opportunities. This may imply a need for more
investment in northern regions of England, in line with the government’s
“levelling up” agenda.
In the next chapters of our report we take a more detailed look at individual
nations and regions to identify the key strengths, opportunities, and assets in
each case.
North
Yorkshire and the Humber
Midlands
East of England
London
South East
South West
Wales
Scotland
Northern Ireland
30
40
50
60
70
80
90
10 20 30 40 50 60 70 80 90
Source: Oxford Economics
Greater opportunity
Less challenge
Opportunity
Challenge
Less opportunityLess challenge
Greater opportunity
Greater challenge
Less opportunityGreater challenge

UK Green Growth Index
19
4. EAST OF ENGLAND
The transition to net zero poses less of a
challenge to the economy of the East of
England than for many other parts of the UK.
Only London and the South East are
estimated to have a lower dependence on
carbon-intensive industry, while rates of
emissions from businesses and households
are below average.
The East of England is a knowledge leader for
the UK, with a very strong base of innovative
activity and a high share of workers with skills
in science, technology, engineering, and
mathematics (STEM) occupations. However,
there is scope to further capitalise on these
attributes to increase the role of green
industry.
STRENGTHS
• The East benefits from a substantial base of innovation infrastructure, centred on
universities and research centres. The East has the highest rate of investment in research
and development amongst all UK nations and regions, with more than £1,000 per resident
spent in 2018. The East’s position as a knowledge leader is reinforced by its workforce:
some 37% of workers are in science, technology, engineering, and mathematics
occupations, the third highest share in the UK.
• There is a lower dependence on carbon-intensive industry than in many other parts of the
UK, and rates of household and commercial emissions are below average.
• There is established base of renewable energy: nearly 4% of households have renewable
installations—the third highest share amongst UK nations and regions, while renewable
generating capacity from the region’s power stations is also slightly above average.
7th out of 10
CHALLENGE
INDEX
7th out of 10
OPPORTUNITY
INDEX

UK Green Growth Index
20
14 See Appendix 4: Sources for regional economic indicators for details of the data sources used in this section.
INVESTMENT NEEDS AND OPPORTUNITIES
• While there are clusters of green economy activity, there is further scope to leverage the
region’s innovation investment and infrastructure to grow the size of energy and other
green economy sectors.
• Investment is needed to reduce emissions from transport: the East has the highest rates of
transport emissions in the UK relative to its population. There are just 21 electric vehicle
charging points per 100,000 residents, compared to an average of 31 across the UK.
• There may be scope to leverage the region’s educational infrastructure to develop the skills
needed for net zero. Some 10.9% of jobs are estimated to need upskilling to meet the
needs of the net zero economy (the second highest share in the UK). Despite the presence
of Cambridge University, the overall number of higher education students in green-related
subjects is relatively low, potentially limiting the supply of future green economy workers.
Nonetheless, the region has a dedicated Skills for Energy programme which seeks to
ensure an ongoing pipeline of qualified individuals to support current and future needs
across the energy sector.
• There is further potential to increase the focus on sustainability as a driver for innovation
amongst businesses: only 5.5% of firms cited reducing environmental impact as an
important driver of innovation—the lowest share in our comparison.
KEY GREEN ECONOMY ASSETS
• The Cambridge-Norwich tech corridor incorporates a number of science and business
clusters at the heart of the region. Areas of specialism include some that will be key to
delivering net zero, such as agricultural technology and renewable energy.
• The Cambridge Cleantech cluster connects companies, academics, investors, and
innovators to facilitate innovation in clean technologies.
• The East of England benefits from a concentration of clean energy expertise, including a
strong focus on offshore wind. This is supported by the Offshore Renewable Energy
Catapult, which works with innovators, companies, and academics to facilitate research,
development and innovation, and to accelerate the development of new technologies.
ECONOMIC INDICATORS14
GVA
£165 billion
9% of the UK total
Jobs
3.2 million
9% of the UK total
Population
6.2 million
9% of the UK total
Emissions
32.4Mt CO2
9% of the UK total

UK Green Growth Index
21
5. LONDON
The net zero transition poses less of a
challenge for London compared to all other
parts of the UK across the three themes in
our Green Growth Challenge Index. London
has a low dependence on carbon intensive
industry and rates of emissions from
businesses, households, and transport are
below average. These factors reflect
London’s status as a city region with a
service-orientated economy and high
population density.
London has the potential to act as an enabler
of the net zero transition through its role as a
centre of financial and other advanced
services. The region has the innovation and
skills base needed to adapt and capitalise on
green growth opportunities. However, spatial
constraints and a service-driven economy
mean that there are fewer opportunities for
industrial- and energy-related green growth.
STRENGTHS
• London benefits from a highly-skilled workforce: 42% of workers are in science,
technology, engineering, and mathematics occupations, the highest share in the UK, while
there is an above-average concentration of higher education students in green-related
subjects. London’s skills based is complemented by above-average levels of investment in
research and development.
• While London contributes 24% of UK GVA, 17% of jobs, and is home to 13% of the
population, it accounts for just 8% of the UK’s emissions. In part this reflects a very
service-orientated economy which results in much lower levels of emissions than in areas
10th out of 10
CHALLENGE
INDEX
10th out of 10
OPPORTUNITY
INDEX

UK Green Growth Index
22
15 See Appendix 4: Sources for regional economic indicators for details of the data sources used in this section.
with a greater dependence on industry. Even after accounting for London’s industry profile
commercial emissions are below-average, suggesting a degree of comparative efficiency.
• Household emissions are lower than the UK average, reflecting the benefits of greater
housing density to reducing emissions. Transport emissions are significantly lower than in
all other regions, reflecting the widespread availability of public transport and the density of
the urban economy, which means that many journeys are relatively short.
INVESTMENT NEEDS AND OPPORTUNITIES
• The region has strong potential to act as an enabler of the transition through its role as a
centre of financial and other advanced services, even if this potential is not well reflected
within the variables used in our model. It is estimated that London supports 12% of jobs in
the UK green economy, but these represent a relatively small proportion of London’s 5.9
million jobs.
• There is potential to increase the focus on renewable energy: London has the lowest
penetration of domestic and commercial renewable energy installations across all UK
nations and regions.
KEY GREEN ECONOMY ASSETS
• London is one of the main locations for the Connected Places Catapult which connects
industry, academics, investors, and the public sector with the aim of accelerating
innovation for cities, transport, and places.
• The Government’s 10 Point Plan for a Green Industrial Revolution identifies a clear role for
London in the Green transition, envisaging the City as a world leader in carbon markets.
• The London Cleantech Cluster is a platform founded by organisations undertaking clean
technology initiatives. It supports, coordinates, and promotes these activities to boost the
deployment and growth of clean technologies.
ECONOMIC INDICATORS15
GVA
£447 billion
24% of the UK total
Jobs
5.9 million
17% of the UK total
Population
8.9 million
13% of the UK total
Emissions
28.9Mt CO2
8% of the UK total

UK Green Growth Index
23
6. MIDLANDS
The Midlands sits close to the UK average
across most of the indicators in our Green
Growth Challenge Index. However, a
relatively high share of workers is estimated
to need re-training to meet the needs of the
net zero economy. The region is also home to
a high concentration of coal-fired power
stations, which the UK government has
announced will be closed by 2024.
The Midlands is the UK’s main centre for
motor vehicle manufacturing. As such, it is
well-placed to capitalise on the growing market
for electric vehicles. The specialism is one
element of the Midlands’ strong overall base of
green economy activity, which should provide
a solid foundation for growth in the years
ahead.
STRENGTHS
• Some 61,000 workers were employed in the automotive manufacturing industry in the
Midlands in 2019 and, as such, the region should be well placed to capitalise on the
growing market for electric vehicles. More broadly, the Midlands is estimated to already
have a relatively high concentration of green economy jobs upon which to build.
• A relatively high share of firms in the region are already innovating to reduce their
environmental impact. An estimated 8.5% of firms reported that sustainability was an
important driver of their innovation—the second highest share in our comparison.
• The take up of renewable energy equipment amongst households and businesses is
slightly ahead of the UK average.
4th out of 10
CHALLENGE
INDEX
5th out of 10
OPPORTUNITY
INDEX

UK Green Growth Index
24
16 See Appendix 4: Sources for regional economic indicators for details of the data sources used in this section.
INVESTMENT NEEDS AND OPPORTUNITIES
• The Midlands is an important generator of energy for the UK. However, it is home to much
of the UK’s gas-fired power generating capacity and the majority of the country’s coal-fired
power generation capacity is located in the region (the government has announced the
latter will close by 2024). This implies a need for investment to shift generation towards
renewables, as well as the development of carbon capture, usage, and storage to enable
gas power stations to operate more cleanly.
• Just over 11% of jobs are estimated to need reskilling to meet the needs of the net zero
economy—the highest share across all nations and regions. There is therefore a need to
leverage the region’s skills and training infrastructure to ensure the workforce is equipped
for the future and to enable the Midlands to realise its full green growth potential.
KEY GREEN ECONOMY ASSETS
• The Energy Systems Catapult, has its headquarters in Birmingham and a second site in
Derby. The Catapult centre, overseen by Innovate UK, was set up to accelerate the
decarbonisation of the UK’s energy system. It does this by bringing together innovative
businesses and researchers to foster collaboration and accelerate the development of new
goods and services.
• The Black Country is one of seven UK strategic industrial clusters to receive support from
BEIS and Innovate UK to develop the world’s first net zero industrial cluster by 2040. The
Black Country has a base of more than 3,000 energy-intensive businesses, many of them
working in metal processing. The programme will seek to provide cost-efficient energy
infrastructure; help manufacturers to use resources more efficiently; and help businesses
to benefit from new opportunities in the circular economy.
ECONOMIC INDICATORS16
GVA
£251 billion
13% of the UK total
Jobs
5.3 million
15% of the UK total
Population
10.7 million
16% of the UK total
Emissions
60.1Mt CO2
17% of the UK total

UK Green Growth Index
25
7. NORTH
Our Green Growth Challenge Index indicates
that the North is placed mid-table amongst the
nations and regions of the UK. It scores at
around the UK average across most of the
indicators reviewed. It does, however, have a
slightly above-average dependence on jobs in
carbon-intensive industry, and rates of
emissions from businesses and households
are also slightly above average.
The net zero transition presents an opportunity
for the North to build on its base of green
economy jobs. The region has particular
strengths in energy and electric vehicle
manufacturing. However, to realise its full
potential the region will need to increase
investment in innovation, and to boost the
supply of workers in science, technology,
engineering, and mathematics occupations.
STRENGTHS
• The North benefits from an established green economy, which already supports an
estimated 14% of UK jobs in the sector. Almost 8% of firms in the region cite reducing
environmental impact as an important driver of innovation.
• The energy sector is a significant employer, and renewables already play an important role
in the North’s grid generating capacity. Renewable energy activity includes offshore wind
on the North East coast, and an important support base at the Port of Blyth. The energy
sector’s transition to net zero will present a major opportunity for the North, with an
estimated 80,000 job opportunities by 2050 including in offshore wind, carbon capture,
storage, and usage, and support to the decarbonisation of other industries through the
development of advanced fuels.
6th out of 10
CHALLENGE
INDEX
6th out of 10
OPPORTUNITY
INDEX

UK Green Growth Index
26
17 See Appendix 4: Sources for regional economic indicators for details of the data sources used in this section.
• There is a significant motor vehicle manufacturing industry in the North—the second
largest amongst UK nations and regions behind the Midlands. Nissan plans to build a £1
billion electric vehicle hub in the region, creating 1,650 new jobs with a further 4,550
expected to be created in the supply chain. The development, supported by around £100
million of government funding, will include an electric battery plant, a battery recycling
facility, and production of a new all-electric car.
INVESTMENT NEEDS AND OPPORTUNITIES
• There is a need to reduce industrial emissions through the increased use of sustainable
fuels and process innovation. A number of initiatives are underway in this area (see below).
• To maximise the region’s green growth potential it will be necessary to increase investment
in innovation and skills. Investment in research and development of £375 per inhabitant is
significantly below the UK average of £558, while the share of workers employed in
science, technology, engineering, and mathematics occupations is also below average.
• Transport emissions are below the UK average and there is an opportunity to reduce these
further by increasing the availability of electric vehicle charging points: there are currently
just 22 per 100,000 residents (compared to a UK average of 31) and electric vehicle
ownership rates in the North of England are significantly lower than in the south.
• There is scope for greater investment in renewables amongst businesses: installed
capacity relative to the size of the workforce is currently only around half the UK average.
KEY GREEN ECONOMY ASSETS
• The government has identified clusters for decarbonisation, including areas in Merseyside
and Teesside as part of its Industrial Decarbonisation Strategy. Decarbonisation efforts
should create growth opportunities, and government investment is already supporting a
number of projects in the region, including the Net Zero Teesside carbon capture, usage,
and storage project, while Net Zero North West has recently launched its Economic
Investment Prospectus stating the investment case for decarbonising and clean growth.
• The region benefits from a cluster of clean energy, including a strong focus on offshore
wind. This is supported by the Offshore Renewable Energy Catapult, which works with
innovators, companies, and academics to facilitate research, development, and innovation,
and to accelerate the development of new technologies.
• The Net Zero NW Cluster Plan will set out the transition to net zero for industry in the North
West of England and North East Wales, describing the investments, technologies,
infrastructure, and sequencing required to fulfil the UK’s Industrial Clusters Mission.
Through the new green economy opportunities created, the plan hopes to create 33,000
jobs and secure £4 billion of investment.
ECONOMIC INDICATORS17
GVA
£237 billion
13% of the UK total
Jobs
4.9 million
14% of the UK total
Population
10 million
15% of the UK total
Emissions
53.4Mt CO2
15% of the UK total

UK Green Growth Index
27
8. NORTHERN IRELAND
Northern Ireland faces challenges in the
transition to net zero given its heavy
dependence on jobs in carbon intensive
sectors. There is also a strong need to reduce
emissions from businesses, households, and
transport.
Northern Ireland already has a solid base of
green economy activity upon which to build
and the energy sector could provide an
important source of new jobs in the coming
decades. However, to realise its green
economy potential Northern Ireland will need
to further develop its skills base and increase
investment in innovation.
STRENGTHS
• The green economy accounts for 5,000 jobs in Northern Ireland. This means that the
current share of jobs in the green economy is broadly in line with the UK average and
should provide a solid base for further growth. Within the green economy, particular
specialisms include low emissions vehicles and low carbon heat, within which Northern
Ireland contributes 8% and 4% of the UK total, respectively.
• There is further potential for employment growth in the energy sector to support the net
zero transition. Despite a high dependence on jobs in high emitting sectors, the proportion
of Northern Ireland’s jobs requiring upskilling for the net zero economy is relatively low.
• Northern Ireland generates almost 50% of its electricity from renewable sources, mainly
from onshore wind for which it is second only to Scotland in terms of installed capacity. The
net zero transition will require an estimated 13,000 energy-related jobs in Northern Ireland.
2nd out of 10
CHALLENGE
INDEX
9th out of 10
OPPORTUNITY
INDEX

UK Green Growth Index
28
18 See Appendix 4: Sources for regional economic indicators for details of the data sources used in this section.
INVESTMENT NEEDS AND OPPORTUNITIES
• Emissions rates are considerably higher than the UK average, particularly household
emissions, which are the highest across all UK nations and regions. The CCC has
identified that considerable savings could be made in Northern Ireland by switching
conventional oil boilers to heat pumps. This implies an important investment need which
could potentially support green economy jobs in the household renewables sector.
• Commercial emissions are also much higher than the UK average, partly reflecting
Northern Ireland’s relatively high degree of dependence on manufacturing. Northern
Ireland does not have large industrial clusters so the ability for individual companies to
decarbonise their operations is critical. One such example is Encirc, which has shown how
sustainable glass bottles can be created without fossil fuels.
• Agriculture is an important sector and accounts for more than a quarter of Northern
Ireland’s emissions, compared to an average of 10% for the UK as a whole. The Northern
Ireland government’s consultation on its proposed Energy Strategy identified opportunities
for agriculture to support the growth of biogas to help decarbonise the gas network.
• The CCC recommends a more rapid deployment of electric vehicles in Northern Ireland to
reduce transport emissions. There is scope to invest in electric vehicle charging points: at
present there are 17 per 100,000 inhabitants, compared to the UK average of 31.
KEY GREEN ECONOMY ASSETS
• Two battery storage sites in Northern Ireland, with a total operational capacity of 100MW,
have been developed by Low Carbon and Gore Street Energy Storage Fund. The sites
near Drumkee, County Tyrone, and Mullavilly, County Armagh, will be critical in supporting
Northern Ireland’s transition to a low-carbon electricity system, helping to smooth peaks
and troughs in the supply and demand for renewable energy.
• The Collaborative Circular Economy Network (CCEN) network brings together five
councils, four manufacturing businesses, and a social enterprise. It covers more than 1,000
people employed in recycling glass, plastic, paper, and food waste. The network enables
collaboration to promote recycling and the circular economy, and provides a platform for
manufacturers to export recyclable products.
• There are proposals for new waste management infrastructure in Mallusk that will operate
alongside other recycling programmes to help divert residual municipal waste from landfill
through the extraction of materials for recycling and the generation of sustainable energy. It
can also contribute to other low carbon technologies such as hydrogen production, district
and industrial heating, and energy storage.
ECONOMIC INDICATORS18
GVA
£42 billion
2% of the UK total
Jobs
887,000
3% of the UK total
Population
1.9 million
3% of the UK total
Emissions
12.7Mt CO2
4% of the UK total

UK Green Growth Index
29
9. SCOTLAND
Our Green Growth Challenge Index suggests
that Scotland is mid-ranking in terms of the
degree of challenge it could face during the
transition to net zero. There is a need to
reduce emissions rates, which are above the
UK average, particularly for households. In
common with other parts of the UK there is
also a need to reduce economic reliance on
carbon-intensive industry.
Scotland is particularly well-placed to take
advantage of the opportunities that the green
economy presents and has set a target for net-
zero emissions of all greenhouse gases by
2045. The nation already has around 21,000
green economy jobs—more than 10% of the
UK total. Low-carbon energy is a particular
specialism, with a large volume of capacity
already in place. Scotland also benefits from a
strong supply of skilled workers to support and
enable the transition.
STRENGTHS
• Scotland produces by far the most low-carbon energy of any other part of the UK, with
more on-shore wind capacity than the rest of the UK combined. Scotland is also one of the
UK’s main locations for hydroelectric power. The National Grid’s forecasts indicate strong
further potential for energy sector growth to 2050.
• Partly driven by the well-developed renewable energy sector, Scotland’s green economy is
the largest in the UK, relative to the size of the overall workforce.
• Green prospects are further enhanced by Scotland’s universities, which accommodate a
relatively large number of students in green-related subjects.
5th out of 10
CHALLENGE
INDEX
1st out of 10
OPPORTUNITY
INDEX

UK Green Growth Index
30
19 See Appendix 4: Sources for regional economic indicators for details of the data sources used in this section.
INVESTMENT NEEDS AND OPPORTUNITIES
• Household emissions rates are above the UK average, while only 2.4% of households
have renewable energy installations—compared to an average of 3.0% across Great
Britain. This may, in part, reflect colder outside temperatures and a greater reliance on
heating oil in some areas. Nonetheless, there is scope for investment to improve insulation
and install low-carbon heating and hot water systems. One example of this is underway in
Fife, where 300 homes are testing boilers powered by zero carbon hydrogen.
• Scotland is a key centre for the UK’s fossil fuel industries. Carbon capture, usage, and
storage, as well as hydrogen power, could provide opportunities for oil and gas workers to
transition to the green economy. This objective which is supported by the UK government’s
North Sea Transition Deal, which should secure investment in Scotland and support jobs.
• Scotland’s economy is relatively more reliant on livestock farming than many other parts of
the UK. There is an opportunity to explore alternative uses of the land currently used for
this purpose, for example through “re-wilding” and tree planting.
KEY GREEN ECONOMY ASSETS
• Scotland is home to the Offshore Renewable Energy Catapult, based in Glasgow, with
another site at Fife. The Catapult provides facilities and expertise for businesses to
develop, test, and demonstrate new innovations in offshore renewable energy. For
example, EchoBolt developed a wind turbine bolt inspection technology that uses
ultrasonics and promises to reduce bolt maintenance costs by 90%.
• Scotland’s “Hydrogen Coast” is a cluster of hydrogen projects along the east coast that aim
to reduce the nation’s carbon footprint, including the Fife domestic heating project
described above. Other examples include Acorn Hydrogen, a production plant powered by
fossil fuels, with the carbon captured and sent for storage in the North Sea; HyStorPor,
which is investigating the storage of hydrogen in geological formations, and Aberdeen
Vision, which is exploring the potential to incorporate hydrogen into the gas distribution
network.
ECONOMIC INDICATORS19
GVA
£142 billion
7% of the UK total
Jobs
2.8 million
8% of the UK total
Population
5.4 million
8% of the UK total
Emissions
28.6Mt CO2
8% of the UK total

UK Green Growth Index
31
10. SOUTH EAST
Our Green Growth Challenge Index suggests
the South East could face fewer challenges in
the transition to net zero than most other parts
of the UK. It has a relatively low dependence
on carbon-intensive industries and rates of
emissions from businesses are below the UK
average. However, the South East still has a
relatively large amount of fossil fuelled
electricity generating capacity and transport
emissions rates are above average.
The South East is well placed to capitalise on
green growth opportunities. The region has a
strong base of innovation infrastructure and a
skilled workforce with a high concentration of
workers in science, technology, engineering,
and mathematics occupations. There is,
nonetheless, scope to further increase take up
of renewable energy.
STRENGTHS
• The South East has a relatively low dependence on carbon-intensive industries, with its
economy characterised by high levels of activity in high-value services, and below-average
concentrations of agriculture and manufacturing. The region’s industrial mix helps to
explain its highly skilled workforce: almost 39% of workers are in science, technology,
engineering, and mathematics occupations, the second highest share in the UK.
• Alongside its skills base, the region benefits from high levels of innovation. Research and
development investment is equivalent to £770 per resident—the second highest in the UK.
9th out of 10
CHALLENGE
INDEX
4th out of 10
OPPORTUNITY
INDEX

UK Green Growth Index
32
20 See Appendix 4: Sources for regional economic indicators for details of the data sources used in this section.
Reducing environmental impact is an important driver of innovation for 10% of firms in the
South East, the highest share in the UK.
• Emissions from businesses in the South East are the lowest in the UK outside of London,
and the region’s businesses are found to be relatively low emitters, even after controlling
for differences in industrial structure.
INVESTMENT NEEDS AND OPPORTUNITIES
• Relative to its population the South East is below the UK average in terms of its renewable
energy capacity, and the region still has a number of large natural gas-fired power stations.
There is therefore scope for investment in grid renewable energy infrastructure to shift the
focus away from fossil fuel power generation into low carbon sources and to introduce
carbon capture, usage, and storage.
• We estimate that the South East has just over 26,000 green economy jobs, which is
equivalent to 13% of the UK total. However, as a share of the region’s employment this is
slightly below the UK average. Similar to London, the South East may be well placed to
build on its expertise in high value services to support green growth.
• Investment is needed to reduce emissions from transport: the South East has the second
highest rates of transport emissions in the UK relative to its population. While the density of
electric vehicle charging points is in line with the UK average, it is considerably lower than
in London and Scotland.
KEY GREEN ECONOMY ASSETS
• The European Regional Development Fund supports the Low Carbon Across the South
East (LOCASE) programme. LOCASE aims to support businesses in boosting their
competitiveness and increasing their profitability in an environmentally sustainable manner.
To do so, the programme offers grants and training to businesses with a green offering.
• Greentech South, which is shared with the South West, is part of a wider technology and
innovation cluster and supports businesses with the commercialisation of low carbon
initiatives by bringing together academia, industry, and public sector organisations.
• Growing Kent and Medway is a collaborative cluster bringing together businesses,
academics, and entrepreneurs to conduct innovative research in the fields of horticulture,
fresh produce packaging, and food and drink supply chains. They aim to catalyse
environmentally friendly commercial technologies in these areas and to reduce waste.
ECONOMIC INDICATORS20
GVA
£277 billion
15% of the UK total
Jobs
4.8 million
14% of the UK total
Population
9.1 million
14% of the UK total
Emissions
42.7Mt CO2
12% of the UK total

UK Green Growth Index
33
11. SOUTH WEST
Our Green Growth Challenge Index suggests
that the net zero transition could present
fewer challenges for the South West than for
many other parts of the UK. Emissions rates
are relatively low, with the exception of
transport. One of the main areas of challenge
may arise from the region’s reliance on
agriculture, which is set to undergo significant
transformation due to reductions in meat
consumption and the need to adjust land use
patterns.
The South West appears well placed to
capitalise on the opportunities that the green
economy will present. The region leads the UK
in terms of the take up of renewable energy
installations amongst households and
businesses. The energy sector is expected to
be a further source of jobs growth over the
coming decades. Greater investment in the
innovation and skills needed for the net zero
transition could enable the South West to
further enhance its green growth prospects.
STRENGTHS
• The South West leads the UK in terms of the take up of renewable energy equipment
amongst households and businesses. Some 4.8% of households have renewable energy
installations, compared to the UK average of 3.0%. Along similar lines, businesses have
installed 241 KW of renewables capacity per 1,000 jobs, compared to the UK average of
less than 100 KW. These findings may, in part, reflect differences in climate, which mean
that the South West is better suited to solar power than other parts of the UK.
• Current rates of emissions from businesses are the lowest outside of London and the
South East, and the South West’s businesses are found to be relatively low emitters, even
after controlling for differences in industrial structure. Household emissions rates are the
8th out of 10
CHALLENGE
INDEX
3rd out of 10
OPPORTUNITY
INDEX

UK Green Growth Index
34
21 See Appendix 4: Sources for regional economic indicators for details of the data sources used in this section.
second lowest amongst UK regions. This may be linked to relatively high rates of take up of
renewables, and a warmer climate which implies less need for domestic heating.
INVESTMENT NEEDS AND OPPORTUNITIES
• There is scope for investment in grid renewable energy generating infrastructure: relative to
its population the South West is below the UK average on this indicator, in contrast to the
region’s strong showing for renewables take up amongst households and businesses.
• There is scope to increase the density of electric vehicle charging points: there are
currently 28 per 100,000 residents, which is just below the national average of 31.
• The South West already has a solid base of green economy activity: this is estimated to
support around 17,000 jobs, or 9% of the UK total. To further unlock the region’s potential
there is a need to increase investment in research and development: the South West
invests an average of £444 per resident at present, compared to a UK average of £558.
• Another area of potential focus is the region’s skills base: both the share of workers in
science, technology, engineering, and mathematics occupations and the density of higher
education students in green-related subjects are slightly below the UK average.
• Investment in innovation and skills could also ensure the region is well placed to address
some of its key challenges, such as how to best manage and enable the net zero transition
in the agricultural sector and to reduce transport emissions.
KEY GREEN ECONOMY ASSETS
• Greentech South brings together academia, industry, and the public sector to collaborate
on innovation and research. In doing so the network seeks to help small and medium
businesses through the transition to net zero, and to help businesses to bring new low
carbon goods and services to market. While the cluster is shared with the South East, it
has become the South West hub of Clean Growth UK—a network of green-oriented
businesses led by universities.
• The National Composites Centre, part of the UK’s High Value Manufacturing Catapult,
provides facilities, expertise, and collaboration opportunities to support innovation in
composites engineering. This has important applications for sustainability, for example by
making things lighter and more durable, and by reducing waste. Key sectors the Centre
works with include aerospace, energy, transport, construction, and infrastructure.
• Bristol is also home to the Wind Blades Research Hub, a collaboration between the
Offshore Renewable Energy Catapult and the University of Bristol. The hub is undertaking
research into wind turbines, with aim of making them larger, more powerful, and more
durable.
ECONOMIC INDICATORS21
GVA
£140 billion
7% of the UK total
Jobs
3 million
8% of the UK total
Population
5.6 million
8% of the UK total
Emissions
26.7Mt CO2
8% of the UK total

UK Green Growth Index
35
12. WALES
The net zero transition could present
important challenges for Wales. Emissions
rates from businesses and households are
relatively high, while a high proportion of jobs
fall within the 10 highest emitting industries.
This implies that significant efforts and
investment will be needed to re-orientate
activity and infrastructure to greener
alternatives.
Despite the challenges of the transition, Wales
has a considerable opportunity to capitalise on
the green economy. Green jobs already
represent a relatively high share of
employment (Wales is second only to Scotland
on this metric). Wales is one of the UK’s most
important areas for onshore wind power, which
contributes to a strong existing base of
capacity and skills in renewable energy, while
the car industry presents opportunities to
capitalise on the growing market for electric
vehicles.
STRENGTHS
• Wales has a well-established renewable energy sector. Relative to its population, Wales
has some of the largest amounts of renewable generating capacity in the UK. This includes
power for the grid, as well as small installations amongst households and businesses. A
particular specialism is onshore wind energy, of which Wales has more capacity than any
other part of the UK except Scotland. The energy sector offers significant potential for
further jobs growth over the coming decades.
• Automotive manufacturing is another important industry, employing 11,000 people in 2019.
Key automotive employers include Toyota’s Deeside Engine Plant, which produces hybrid
1st out of 10
CHALLENGE
INDEX
2nd out of 10
OPPORTUNITY
INDEX

UK Green Growth Index
36
22 See Appendix 4: Sources for regional economic indicators for details of the data sources used in this section.
electric engines. Given this existing base of skills and expertise, Wales could be well-
placed to take advantage of opportunities in the growing electric vehicle market.
• Wales benefits from a relatively high concentration of students in green-related subjects,
which could offer an important source of future skills to support the nation’s green growth.
INVESTMENT NEEDS AND OPPORTUNITIES
• A relatively high share of jobs in Wales are within the 10 highest emitting sectors. In part,
this reflects that the manufacturing sector accounts for a relatively large share of the Welsh
economy. There is therefore a need for investment and innovation to de-carbonise
processes, for example through the increasing use of clean energy and the implementation
of carbon capture, usage, and storage. Such changes will require a significant increase in
investment in research and development: Wales current invests just £251 per person in
these activities, the lowest amount across all UK nations and regions.
• The Welsh economy has a high degree of dependence on livestock farming. Reductions in
meat consumption could therefore impact this part of the UK particularly strongly. There will
be an important need to embrace changes in the agricultural sector, for example by
changing land use to support efforts to remove emissions from the atmosphere.
• While almost 4% of households in Wales have renewable energy equipment, household
emissions rates remain relatively high. This may reflect that Wales has a greater proportion
of homes not connected to mains gas than England and Scotland, and that some of these
homes rely on heating oil for domestic heating and hot water. As such there may be further
scope to increase the take-up of renewable energy across Welsh households.
KEY GREEN ECONOMY ASSETS
• The South Wales Industrial Cluster brings together businesses in energy and heavy
industry with the aim of achieving a net zero emissions cluster by 2040 through
technologies such as low carbon power and carbon capture, usage, and storage.
• Wales has the vast majority of the UK’s “pumped storage” power generation capacity,
including the largest single facility at Dinorwig in North Wales. These facilities use excess
electricity generated during periods when supply exceeds demand to pump water uphill. It
is later released to generate electricity through hydroelectric turbines at times when
demand exceeds supply. In this way pumped storage helps to smooth the peaks and
troughs in energy supply which occur as the grid’s reliance on renewables increases.
• Pembroke Dock is receiving a significant investment in the form of the Marine Energy
Engineering Centre of Excellence, a collaboration between the Offshore Renewable
Energy Catapult and Welsh universities. The Centre will deliver research, development,
and demonstration activities to support the commercialisation of technologies in the wave,
tidal, and offshore wind sectors.
ECONOMIC INDICATORS22
GVA
£65 billion
3% of the UK total
Jobs
1.5 million
4% of the UK total
Population
3.1 million
5% of the UK total
Emissions
23.6Mt CO2
7% of the UK total

UK Green Growth Index
37
13. YORKSHIRE AND THE HUMBER
Our Green Growth Challenge Index suggests
that Yorkshire and the Humber could face the
highest degree of challenge from the net zero
transition amongst English regions. Emissions
rates from businesses and households are
amongst the highest in the UK, while the
region’s economy is relatively reliant on
carbon-intensive industry, and there remains
a relatively large amount of fossil-fuelled
electricity generating capacity.
Yorkshire and the Humber has a relatively
high share of renewables within its electricity
generating mix, although prospects for future
energy sector growth appear more limited than
in some other regions. More broadly, the share
of the region’s jobs that are in the green
economy is slightly above average, indicating
a solid foundation for future growth. However,
to maximise the region’s green growth
potential it will be necessary to boost
investment in research and development and
to increase the supply of workers with
expertise in science, technology, engineering,
and mathematics.
STRENGTHS
• We estimate that the green economy supports around 17,000 jobs in Yorkshire and the
Humber, or around 8% of the UK total. This means that the green economy accounts for a
slightly above-average share of the region’s employment, which should provide a strong
foundation for future growth.
• Relative to its population, Yorkshire and the Humber has the third highest concentration of
grid renewable energy capacity in the UK, after Scotland and Wales. Yorkshire and the
3rd out of 10
CHALLENGE
INDEX
8th out of 10
OPPORTUNITY
INDEX

UK Green Growth Index
38
23 See Appendix 4: Sources for regional economic indicators for details of the data sources used in this section.
Humber is leading the UK in terms of renewable energy generation powered by biomass:
the Drax power station in North Yorkshire is fuelled by compressed wood pellets sourced
from sustainably managed forests and waste from existing forestry work.
INVESTMENT NEEDS AND OPPORTUNITIES
• Yorkshire and the Humber has a relatively high share of jobs in high-emitting industries,
partly reflecting an above-average reliance on manufacturing. Linked to this, an above-
average share of workers will need re-training to meet the needs of the net zero economy.
• The region still has one of the highest amounts of natural gas-fired power capacity in the
country. There is therefore further potential to invest to re-orientate power generation
towards renewables, and to incorporate carbon capture technologies into existing facilities.
• There is scope to increase investment in research and development to support the
innovations needed for the net zero transition. Yorkshire and the Humber spends £300 per
person on research and development—the second lowest amount across the nations and
regions of the UK.
• Around 3.4% of households have installed renewable energy equipment, slightly above the
UK average of 3.0%. However, household emissions are slightly above the UK average,
suggesting there is further scope to improve energy efficiency and increase the take up of
renewables. There is also scope to invest in electric vehicle charging infrastructure: there
are 19 charging points per 100,000 residents at present, compared to a UK average of 31.
KEY GREEN ECONOMY ASSETS
• In 2020, the National Grid and several major energy companies formed the Northern
Endurance Partnership to develop offshore carbon dioxide transport and storage
infrastructure in the North Sea. This infrastructure will serve the proposed Zero Carbon
Humber (ZCH) project that aims to establish a decarbonised industrial cluster in
Humberside. ZCH hopes to be commissioned by 2026 with a pathway to achieve net zero
emissions through a combination of carbon capture, usage, and storage, and switching to
fuels such as low carbon hydrogen.
• The University of Leeds is host to an office of the Connected Places Catapult. It enables
innovation by connecting industry, academics, investors, and the public sector with the aim
of accelerating innovation for cities, transport, and places. Leeds has also been chosen as
the home of the new national infrastructure bank, which will support green investment, the
transition to net zero, and the government’s levelling-up agenda.
• The Advanced Manufacturing Research Centre, part of the High Value Manufacturing
Catapult, has branches in Sheffield and Rotherham. This provides a further focal point of
innovation facilities and expertise in sectors such as aerospace, transport, construction,
and energy.
ECONOMIC INDICATORS23
GVA
£124 billion
7% of the UK total
Jobs
2.7 million
8% of the UK total
Population
5.5 million
8% of the UK total
Emissions
35.8Mt CO2
10% of the UK total

UK Green Growth Index
39
APPENDIX 1: METHODOLOGY To develop the UK Green Growth Index we worked through a four-stage process as outlined below.
Overview of the development process
STEP 1: CONCEPTUAL FRAMEWORK
The future growth potential and location of the UK’s green economy is extremely uncertain.
Nonetheless, by looking across a wide range of indicators we can build up a broad indication of where
challenges and opportunities may be greatest. Our UK Green Growth Index is constructed across two
“domains” as follows:
• Green growth challenge: the degree to which the net zero transition could create economic
challenges.
• Green growth opportunity: the degree to which the conditions are in place to capitalise on
the growth of the green economy.
We identified a set of themes to reflect the main considerations that could affect an area’s prospects
in each of the two domains. These themes were informed by the literature review and consultations
undertaken as part of the first phase of our research with Lloyds Banking Group.24
To consider the degree of challenge that different parts of the UK could face we identified the
following three themes:
• Dependence on carbon-intensive industry. Parts of the UK that are more reliant on
carbon-intensive industry may be more exposed to labour market and other economic
disruption from scaling back or re-orientating such activity during the transition.
• Emissions. Parts of the UK with greater current emissions levels will need to make greater
efforts and investments to adapt.
• Fossil fuel power infrastructure. Reaching net zero will drive greater demand for electricity
and this will need to be generated from clean sources. Areas where there is still a large
reliance on fossil fuels are likely to face a greater need for investment and adaptation.
For the green growth opportunity domain we identified four themes:
24 Oxford Economics, Green Growth: opportunities for the UK, 2021

UK Green Growth Index
40
• Base of green industry. Parts of the UK with a current or expected future base of green
activity may be better placed to capitalise on green growth opportunities.
• Skills and training. Areas with highly skilled workers in relevant fields may be better placed
to adapt to and enable the innovation needed to drive the transition.
• Innovation. A stronger base of innovative activity may ensure a nation or region is better
placed to develop the technologies and techniques needed to decarbonise their economy and
capitalise on green growth opportunities.
• Renewable energy. Areas with a larger existing renewable energy sector may be more likely
to have the skills, expertise and infrastructure to build on this in future.
It is important to acknowledge that there is a degree of overlap between the themes. For example,
emissions are likely to be greater in parts of the country more reliant on carbon-intensive industry.
Areas with more research, development, and innovation may also have a greater concentration of
highly-skilled workers. And so on. Nonetheless, our intention is to take a broad perspective and
capture as many considerations as possible. The statistical techniques applied within the scoring
process take into account the scope for overlap and help us to avoid “double counting”.
STEP 2: DEVELOPING LONG LISTS OF INDICATORS
With the themes in place we searched existing literature and data sources to identify potential
indicators for each of the themes. Our search focused on identifying datasets which provided values
for all nations and regions of the UK. The types of indicators identified in this initial search are outlined
below.
Fig. 7. Overview of the types of indicators reviewed for the degree of challenge domain
Domain and theme Types of indicator identified
Dependence on carbon-intensive industry
Data identifying the share of economic activity which relies on high emissions sectors; associated supply chains; and in occupations most likely to require upskilling.
Emissions Measures of domestic, commercial and transport emissions.
Fossil fuel power infrastructure
Fossil fuel generating capacity.
Fig. 8. Overview of the types of indicators reviewed for the green growth opportunity domain
Domain and theme Types of indicator identified
Base of green industry Indicators of the current level of green economy activity; existing forecasts of green growth by nation or region.
Skills and training Workers and higher education students in occupations and subjects expected to be most in demand to enable the net zero transition.
Innovation Indicators of investment and activity linked to research and development, both overall and in specific fields of relevance to the transition.
Renewable energy Indicators of domestic and commercial renewable energy installations; electric vehicle charging points; current and planned renewables capacity in the power sector.
The data points gathered are inevitably measured using many different units. We therefore
normalised the data using z-scores, which express each nation or region’s position relative to the UK
average.

UK Green Growth Index
41
STEP 3: SHORTLISTING THE INDICATORS
The initial long lists of indicators in our database presented two main challenges. Firstly, many of the
indicators were similar in nature and could have performed a similar job within the indices. And
secondly, including too many indicators would make it difficult to identify the factors driving the results
and explain rankings. We therefore worked through an iterative process to shortlist the indicators to
be included in the final index. This comprised the following steps:
(1) We identified groups of indicators which were similar in nature, either conceptually or statistically.
This assessment was based on correlation analysis and analysts’ judgement.
(2) We created early experimental versions of the two indices using principal component analysis
(PCA) to compare different combinations of substitute indicators. For each of these combinations
we used the loading factors from the first principal component to derive weights. This iterative
process guided further analysis into combinations which appeared unstable or which produced
counter-intuitive results. In turn, this enabled us to identify and consider the removal of indicators
which were problematic, for example because they included significant outliers which created
distortions, or if further analysis identified concerns about the validity or robustness of the data
source.
(3) We used PCA to identify the “explanatory power” of different combinations of indicators
(measured in terms of the proportion of variance combination explained by the first principal
component of each combination). Our final selections for each domain reflect the combinations of
indicators and weights for which this explanatory power was high relative to other combinations
tested. In making our final selection we also took into account the balance of weights across
indicators: given our objective to look across a broad range of indicators in each domain we
avoided combinations of variables in which the PCA allocated a very high weight to any single
indicator.
The final lists of indicators included within each index are shown below, along with their respective
weightings.

UK Green Growth Index
42
Fig. 9. Shortlisted indicators for the Green Growth Challenge Index
Theme Indicators and rationale Weight
Dependence on carbon-intensive
industry
Jobs in high emitting industries The share of jobs within the 10 highest-emitting industries. Examples of these industries include fossil fuel extraction and processing, utilities, transport, and agriculture. A greater reliance on such activities may indicate a greater risk of labour market disruption, as well as a greater need for investment and adaptation.
18%
Jobs requiring upskilling The share of jobs that will require skills to be significantly adapted to meet the needs of the net zero economy (based on the Place-based Climate Action Network’s Just Transition Jobs Tracker).25
8%
Reliance on livestock farming The share of regional gross value added (GVA) which relies on livestock farming—the element of agriculture which may be most exposed to disruption from the transition.
14%
Emissions
Commercial emissions The overall level of emissions from industrial and commercial sources, relative to the size of the area’s workforce.
16%
Commercial emissions -v- expected The extent to which emissions are higher or lower than would be expected given the area’s industrial structure. If emissions are lower than expected, this may indicate that the area is more advanced with the decarbonisation process or that the area’s specialisms within industries are more orientated towards lower emitting activity.
15%
Household emissions The level of emissions from domestic sources, relative to the area’s population. A higher value may indicate a greater need to invest in lower emissions technologies for homes.
15%
Transport emissions Emissions from transport, relative to the area’s population. A higher value may indicate a greater need for investment or behaviour change to reduce transport emissions.
10%
Fossil fuel power infrastructure
Fossil fuelled generating capacity The overall scale of electricity generating capacity that relies on fossil fuels. A greater value implies a greater need to invest in cleaner replacement technologies. Considered in absolute terms since the power generated is assumed to be distributed nationally.
3%
25 Place-based Climate Action Network (PCAN), Just Transition Jobs Tracker, 2019.

UK Green Growth Index
43
Fig. 10. Shortlisted indicators for the Green Growth Opportunity Index
Theme Indicators and rationale Weight
Base of green industry
Green economy jobs Current jobs in the low carbon and renewable energy economy relative to the overall size of the workforce. A strong existing base of green industry may provide a good foundation for future growth. Values for English regions have been imputed based on each region’s sector mix.
16%
Energy jobs needed by 2050 National Grid forecasts of the jobs needed in the energy sector and its supply chains to meet net zero.26 Estimated as a share of current jobs.
14%
Vehicle manufacturing Share of regional GVA which comes from motor vehicle manufacturing. Future growth in electric vehicle manufacturing might be expected to occur in areas where there is already a strong base of vehicle manufacturing.
0.1%
Innovation
Research and development The value of research and development expenditure, relative to the nation or region’s population. Indicates the overall intensity of innovation activity.
10%
Firms innovating to reduce their environmental impact Based on the BEIS UK Innovation Survey. Indicates the share of firms for which sustainability is already an important factor in the decision to innovate.27
5%
Skills and training
Science, technology, engineering, mathematics (STEM) workers The share of workers employed in STEM occupations. Indicates the degree to which an area already has a stock of workers in the types of occupations which may be most important to driving innovation and adaptation efforts.
8%
Higher education students in green-related subjects The number of higher education students enrolled in green-related subjects, relative to the area’s population. Indicates the potential future supply of highly-skilled workers in relevant fields.
14%
Renewable energy
Domestic renewable energy installations The share of households with renewable energy installations. Indicates the area’s propensity to be an early adopter of domestic renewable energy.
2%
Commercial renewable energy capacity Renewable energy capacity installed by businesses, relative to the size of the area’s workforce. Indicates the propensity of businesses to be an early adopter of renewable technologies.
13%
Grid renewable energy capacity Grid renewable energy capacity relative to population. Indicative of the existing base of green energy expertise and support infrastructure.
17%
Electric vehicle charging points Number of charging points relative to population size. Indicates the uptake of electric vehicles and influences their desirability for potential new users.
0.9%
26 National Grid, Building the Net Zero Energy Workforce, 2020. 27 Department for Business, Energy & Industrial Strategy, UK Innovation Survey 2019, 2020.

UK Green Growth Index
44
STEP 4: CALCULATING INDEX VALUES
We aggregated and weighted the z-scores for each indicator to calculate an overall index value for
each nation and region in each of the two domains. We also re-based the values to generate more
intuitive results using the following formula:
Re-based index value = 50 + (25 x z-score)
This re-basing means that a value of 50 is equivalent to the UK average, with values greater (less)
than 50 indicating that prospects are above (below) the UK average. The index values also provide
insight into the degree to which performance differs across nations and regions since 25 points is
equivalent to one standard deviation. For example, a value of 75 is one standard deviation greater
than a value of 50.
Index values are capped such that they could not fall below zero or exceed 100. An area which is two
or more standard deviations above the UK average receives the maximum value of 100, while an
area which is two or more standard deviations below the UK average receives the minimum value of
zero.28
To produce theme and domain index values, we multiplied the re-based index values for each
indicator by its associated weight, and summed these weighted index values across all indicators in a
theme or domain.
Once the indices were in place we undertook further sensitivity testing to ensure the resulting
rankings were stable to alternative formulations.
28 Our analysis suggested that constraining the index values in this way had very little impact on the final results.

UK Green Growth Index
45
APPENDIX 2: INDICATORS USED IN
THE GREEN GROWTH CHALLENGE
INDEX DEPENDENCE ON CARBON-INTENSIVE INDUSTRY
Share of jobs in high emissions sectors, 2018
We used data from ONS on total greenhouse gas emissions (GHG) emissions by 2-digit SIC industry
to identify the top 10 highest emitting industries.29 These were found to be:
(01) Crop and animal production, hunting and related service activities
(06) Extraction of crude petroleum and natural gas
(19) Manufacture of coke and refined petroleum products
(20) Manufacture of chemicals and chemical products
(23) Manufacture of other non-metallic mineral products
(24) Manufacture of basic metals
(35) Electricity; gas; steam and air conditioning supply
(38) Waste collection; treatment and disposal activities; materials recovery
(49) Land transport and transport via pipelines
(51) Air transport
We calculated the share of each nation and region’s employment which falls within these 10
industries using our own estimates derived through a combination of the ONS Business Register and
Employment Survey and ONS Workforce Jobs series.
29 ONS, Atmospheric emissions: greenhouse gases by industry and gas, accessed July 2021.
Northern Ireland
Wales
Yorkshire and the Humber
Scotland
North
Midlands
South West
East of England
South East
London
UK
0% 1% 2% 3% 4% 5% 6% 7% 8% 9%
Source: Oxford Economics analysis of ONS data
% of jobs

UK Green Growth Index
46
Share of jobs requiring upskilling for net zero
These data were taken from a research paper by Robins et al.30 The researchers drew on earlier
research in the US which estimated the share of jobs in each industry that would be affected in
different ways by the green transition. They then applied these findings to UK labour market data to
estimate the share of jobs in each area that could be substantively impacted. Results for Northern
Ireland are based on 2013 data and for England, Wales and Scotland they are based on 2011 figures.
30 Robins, N. et al., Investing in a just transition in the UK: How investors can integrate social
impact and place-based financing into climate strategies, 2019.
Midlands
Yorkshire and the Humber
East of England
North
South East
Scotland
London
South West
Wales
Northern Ireland
UK
9% 9% 10% 10% 11% 11% 12%Source: Robins, N. et al.
% of jobs

UK Green Growth Index
47
Reliance on livestock farming: share of GVA in livestock and livestock products, 2018
Data on GVA from livestock and livestock products were obtained from DEFRA for England, Welsh
Government for Wales, Scottish Government for Scotland and DAERA for Northern Ireland.31,32,33
We converted these data to a share of each nation or region’s GVA using data from the ONS Annual
Business Survey. The data shown above therefore represent GVA from livestock farming as a share
of total GVA in the non-financial business economy.
31 Agriculture and Rural Economy Directorate, Scottish agriculture tables – economic report: 2020 edition,
accessed July 2021. 32 Statistics for Wales, Aggregate agricultural output and income, 2020, accessed July 2021. 33 Department of Agriculture, Environment and Rural Affairs, Statistical review of NI agriculture 2007 onward,
accessed July 2021.
Wales
South West
Northern Ireland
Scotland
Midlands
North
East of England
Yorkshire and the Humber
South East
London
UK
0.00% 0.02% 0.04% 0.06% 0.08% 0.10% 0.12%
Source: ONS, DEFRA, Scottish Government, Welsh Government, DAERA Northern Ireland
% of GVA
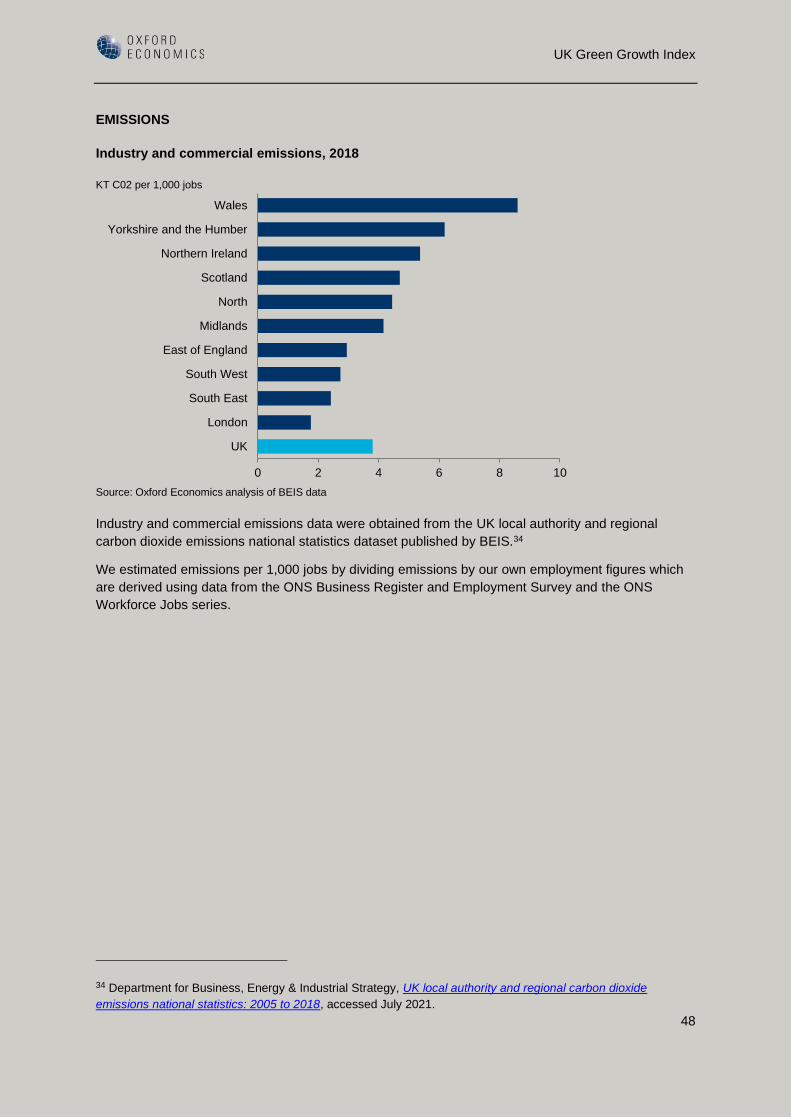
UK Green Growth Index
48
EMISSIONS
Industry and commercial emissions, 2018
Industry and commercial emissions data were obtained from the UK local authority and regional
carbon dioxide emissions national statistics dataset published by BEIS.34
We estimated emissions per 1,000 jobs by dividing emissions by our own employment figures which
are derived using data from the ONS Business Register and Employment Survey and the ONS
Workforce Jobs series.
34 Department for Business, Energy & Industrial Strategy, UK local authority and regional carbon dioxide
emissions national statistics: 2005 to 2018, accessed July 2021.
Wales
Yorkshire and the Humber
Northern Ireland
Scotland
North
Midlands
East of England
South West
South East
London
UK
0 2 4 6 8 10
Source: Oxford Economics analysis of BEIS data
KT C02 per 1,000 jobs

UK Green Growth Index
49
Commercial emissions relative to expected level given sector mix, 2018
A value greater (less) than 100 indicates that a nation or region has above (below) average emissions
after controlling for its industrial structure.
These values were estimated by Oxford Economics using data from ONS and BEIS. To do so we
divided two indices as follows:
(Actual emissions per job index) / (Expected emissions per job index) * 100
Actual emissions per job index:
• Actual industry and commercial CO2 emissions by region were sourced from BEIS.35
• We divided industry and commercial CO2 emissions by employment in each region to
estimate the actual level of industrial and commercial CO2 emissions per job.
• We then divided each nation and region’s value by actual industrial and commercial CO2
emissions per job in the UK to create an index. A value of less than 100 indicates actual
industrial and commercial CO2 emissions per job are below the UK average.
Expected emissions per job index:
• We estimated average CO2 emissions per job in each 2-digit industry at the national level,
using emissions by industry from the ONS36 and our own employment figures which are
derived using data from the ONS Business Register and Employment Survey and the ONS
Workforce Jobs series.
• We then multiplied the results for CO2 emissions per job by the share of jobs in each industry
in each nation and region to obtain an estimate of the expected level of CO2 emissions per
job in each region.37 These results represent the level of commercial and industrial CO2
35 Department for Business, Energy & Industrial Strategy, UK local authority and regional carbon dioxide
emissions national statistics: 2005 to 2018, accessed July 2021. 36 ONS, Atmospheric emissions: greenhouse gases by industry and gas, accessed July 2021. 37 We excluded emissions in the transport sector, since actual industry and commercial CO2 emissions excludes
emissions relating to transport, which are measured separately.
Wales
Northern Ireland
Yorkshire and the Humber
East of England
Midlands
North
London
South East
South West
Scotland
UK
0 50 100 150 200
Source: Oxford Economics analysis of BEIS data
Index, UK=100

UK Green Growth Index
50
emissions per job that would prevail in the area if CO2 emissions in each industry were in line
with the UK average.
• We divided the expected level of CO2 emissions per job in each nation and region by the
expected level of CO2 emissions per job in the UK to create an index. A value of less than
100 indicates expected CO2 emissions per job are below the UK average.
Household emissions, 2018
Domestic emissions data were obtained from the UK local authority and regional carbon dioxide
emissions national statistics dataset published by BEIS and refer to CO2 emissions within the
dwelling. Domestic emissions include those related to the domestic use of electricity, gas and other
fuels.38
We estimated emissions per 1,000 residents by dividing emissions by the ONS Mid-Year Population
Estimates.39
38 Department for Business, Energy & Industrial Strategy, UK local authority and regional carbon dioxide
emissions national statistics: 2005 to 2018, accessed July 2021. 39 ONS, Estimates of the population for the UK, England and Wales, Scotland and Northern Ireland, accessed
July 2021.
Northern Ireland
Scotland
Wales
Yorkshire and the Humber
North
Midlands
South East
East of England
South West
London
UK
0.0 0.5 1.0 1.5 2.0
Source: Oxford Economics analysis of BEIS data
KT C02 per 1,000 residents
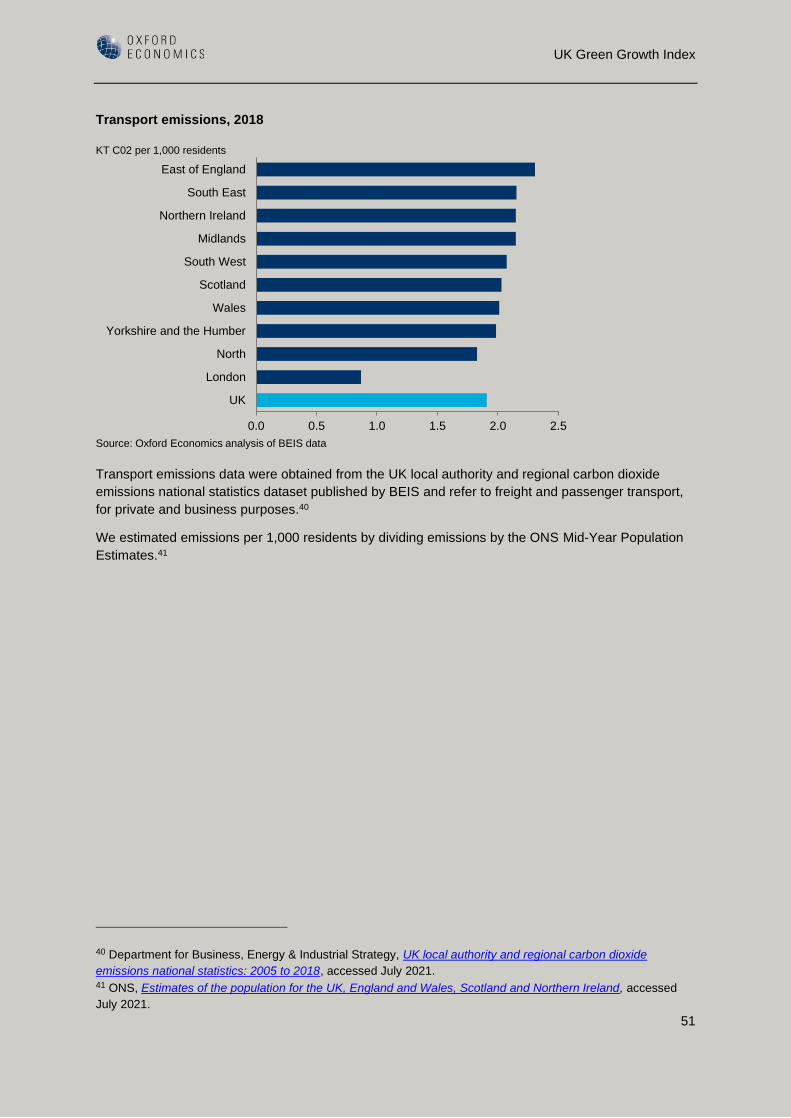
UK Green Growth Index
51
Transport emissions, 2018
Transport emissions data were obtained from the UK local authority and regional carbon dioxide
emissions national statistics dataset published by BEIS and refer to freight and passenger transport,
for private and business purposes.40
We estimated emissions per 1,000 residents by dividing emissions by the ONS Mid-Year Population
Estimates.41
40 Department for Business, Energy & Industrial Strategy, UK local authority and regional carbon dioxide
emissions national statistics: 2005 to 2018, accessed July 2021. 41 ONS, Estimates of the population for the UK, England and Wales, Scotland and Northern Ireland, accessed
July 2021.
East of England
South East
Northern Ireland
Midlands
South West
Scotland
Wales
Yorkshire and the Humber
North
London
UK
0.0 0.5 1.0 1.5 2.0 2.5
Source: Oxford Economics analysis of BEIS data
KT C02 per 1,000 residents

UK Green Growth Index
52
FOSSIL FUEL POWER INFRASTRUCTURE
Fossil fuelled generating capacity, end of May 2020
We used the BEIS Digest of UK Energy Statistics published in 2020 and aggregated the installed
capacity of fossil fuel power stations operational at the end of May 2020 at the regional and country
level to obtain an estimate of total installed capacity in the nation or region.42
42 Department for Business, Energy & Industrial Strategy, Digest of UK Energy Statistics (DUKES): electricity,
accessed July 2021.
9,820
6,777
6,250
4,981
2,920
2,339
2,121
1,900
1,318
562
Midlands
Yorkshire and the Humber
South East
Wales
East of England
South West
North
Northern Ireland
Scotland
London
0 2,000 4,000 6,000 8,000 10,000 12,000
Source: BEIS Digest of UK Energy Statistics 2020
MW

UK Green Growth Index
53
APPENDIX 3: INDICATORS USED IN
THE GREEN GROWTH OPPORTUNITY
INDEX
BASE OF GREEN INDUSTRY
Current green economy jobs, 2019
We used ONS estimates of jobs in the Low Carbon and Renewable Energy Economy (LCREE) and
our own employment figures (derived using data from the ONS Business Register and Employment
Survey and the ONS Workforce Jobs series) to estimate LCREE jobs relative to total employment in
each UK country.43
Estimates for English regions were imputed using the share of employment in the UK that
corresponds to an LCREE category at the industry level and then applying those shares to the
industry mix of each region. We re-scaled the results to align with the reported LCREE figure for
England.44
43 ONS, Low carbon and renewable energy economy estimates, accessed April 2021. 44 The ONS LCREE estimates are presented on a full-time equivalent (FTE) basis, whereas our total employment
figures are only available on a headcount basis. Under the assumption that the relationship between FTE and
headcount employment is relatively consistent across the UK, this slight discrepancy should not substantively
impact on the operation of the index.
Scotland
Wales
Midlands
Yorkshire and the Humber
Northern Ireland
North
South West
East of England
South East
London
UK
0.0% 0.1% 0.2% 0.3% 0.4% 0.5% 0.6% 0.7% 0.8% 0.9%
Source: Oxford Economics analysis of ONS LCREE data
% of total employment

UK Green Growth Index
54
Energy jobs need by 2050
The National Grid estimated the future workforce required to support the UK energy sector in reaching
net zero by 2050.45 Their estimates of employment include direct activity in the energy sector—
through the operation, generation, transmission, distribution, and retail of energy—as well as supply
chain activity related to building, upgrading, maintaining, and operating infrastructure required to
reach net zero.
The National Grid estimates include both the new jobs created in the energy sector, and the need to
fill existing roles of those who will leave the workforce (e.g. through retirement). Their sub-national
estimates were compiled using a range of sources, including existing employment and labour market
trends, planned infrastructure through the development pipeline, desk-based research and
independent future forecasts.
To reflect the relative opportunity within each nation or region, we considered future jobs as a
proportion of current employment within each area, drawn from Oxford Economics’ estimates of total
employment, which are in turn based on ONS survey data.
45 National Grid, Building the Net Zero Energy Workforce, 2020.
Scotland
Wales
North
Northern Ireland
South West
South East
Midlands
East of England
Yorkshire and the Humber
London
UK
0.0% 0.5% 1.0% 1.5% 2.0%
Source: National Grid, Building the Net Zero Energy Workforce, 2020
% of current jobs

UK Green Growth Index
55
Motor vehicle manufacturing, 2018
These data were taken from ONS Annual Business Survey data for GVA at a 2-digit industry level in
each nation and region of the UK.46 The data show GVA from the manufacture of motor vehicles,
trailers and semi-trailers as a share of total GVA in the non-financial business economy.
46 ONS Annual Business Survey, Non-financial business economy, UK regional results; sections A to S,
accessed July 2021.
Midlands
North
Wales
South West
South East
Yorkshire and the Humber
Northern Ireland
East of England
Scotland
London
UK
-1% 0% 1% 2% 3% 4% 5%Source: ONSNote: The ONS reports a negative GVA figure of minus £425 million for London's automotive industry.Firms participating in the ONS survey can report a negative GVA if they report larger values of purchases than their total turnover in the same period. ONS has noted that low levels of acitivity in this industry in London mean that the region's results are likely to be sensitive to the figures reported by a small number of firms.
% of GVA

UK Green Growth Index
56
INNOVATION
Research and development expenditure, 2018
These datapoints were calculated using Eurostat’s Gross Domestic Expenditure on Research and
Development (GERD) by sector of performance and NUTS 2 regions dataset.47 We divided these
data by ONS Mid-Year Population Estimates to obtain values per resident.48
47 Eurostat, GERD by sector of performance and NUTS 2 regions, accessed July 2021. 48 ONS, Estimates of the population for the UK, England and Wales, Scotland and Northern Ireland, accessed
July 2021.
1,064
770
661
513
498
444
380
375
300
251
558
East of England
South East
London
Midlands
Scotland
South West
Northern Ireland
North
Yorkshire and the Humber
Wales
UK
0 200 400 600 800 1,000 1,200Source: Eurostat, ONS
£ per resident

UK Green Growth Index
57
Firms innovating to reduce their environmental impact
These data were derived by combining two responses from the BEIS UK Innovation Survey.49 The
first was the share of firms identified as a “broad innovator” in each region or nation.50 The second
was the share of “broad innovators” who cited reducing environmental impact as highly important in
their decision to innovate.
To obtain an indicator relative to the overall stock of firms in each part of the UK we multiplied the first
data point by the second.
49 Department for Business, Energy & Industrial Strategy, UK innovation survey 2019: main report, accessed July
2021. 50 A business that has engaged in any of the following activities is defined as a “broad innovator”:
- Introduction of a new or significantly improved product (good or service) or process
- Engagement in innovation projects not yet complete or abandoned
- New and significantly improved forms of organisation, business structures or practices and marketing
concepts or strategies
- Activities in areas such as internal research and development, training, acquisition or external
knowledge or machinery and equipment linked to innovation activities.
South East
Midlands
South West
North
London
Yorkshire and the Humber
Scotland
Wales
Northern Ireland
East of England
UK
0% 2% 4% 6% 8% 10% 12%
Source: BEIS UK Innovation Survey 2016-18
% of firms

UK Green Growth Index
58
SKILLS AND TRAINING
Science, technology, engineering, maths (STEM) workers, 2020
We combined the employment by occupation figures published by the ONS in its Annual Population
Survey51 with a separate list of Core STEM occupations published by the ONS52. The ONS classifies
27 occupations as core STEM and these include, for example, engineering professionals,
conservation and environment professionals, and research and development managers.
51 ONS, Annual population survey – regional – employment by occupation, accessed July 2021. 52 ONS, Employment in science, technology, engineering and mathematics (STEM) occupations and industries,
Scotland, 2011 and 2017, accessed July 2021.
London
South East
East of England
Scotland
South West
Midlands
Yorkshire and the Humber
Wales
North
Northern Ireland
UK
0% 10% 20% 30% 40% 50%
Source: ONS
% of workers

UK Green Growth Index
59
Higher education students in green-related subjects, 2019/20
We used data from the Higher Education Statistics Agency on the number of Higher Education
student enrolments in the academic year of 2019/20 by subject of study at the most detailed level
available.53 We analysed the full list of subjects available and identified those that are green-related,
such as subjects within agriculture, food and related studies, mathematical sciences, engineering and
technology, biology, and information technology.
We present the data per 1,000 residents using ONS Mid-Year Population Estimates.54
53 HESA, HE provider and subject of study 2019/20, accessed July 2021. 54 ONS, Estimates of the population for the UK, England and Wales, Scotland and Northern Ireland, accessed
July 2021.
Scotland
Wales
London
Midlands
South East
Yorkshire and the Humber
North
Northern Ireland
South West
East of England
UK
0 5 10 15
Source: HESA, ONS
Students per 1,000 residents

UK Green Growth Index
60
RENEWABLE ENERGY
Domestic renewable energy installations, 2019
We used the BEIS Sub-national Feed-in Tariff Statistics dataset which presents data on the number
of domestic renewable installations registered in the Feed-In Tariff for England, Scotland, and
Wales.55 These include Photovoltaics, Wind, Hydro, Anaerobic Digestion, and Micro CHP
installations. The number of households was obtained from household projections for 2019 from the
Department for Communities and Local Government in England, the Welsh Government in Wales,
and the National Records of Scotland in Scotland.56
55 Department for Business, Energy & Industrial Strategy, Sub-regional Feed-in Tariffs statistics, accessed July
2021. 56 Ministry of Housing, Communities & Local Government, Live tables on household projections, accessed July
2021.
South West
Wales
East of England
Yorkshire and the Humber
Midlands
North
South East
Scotland
London
Great Britain
0% 1% 2% 3% 4% 5% 6%
Source: BEISNote: Data unavailable for Northern Ireland. Within the scoring, NI was assumed to receive the GB average value to avoid distorting its score either positively or negatively.
% of households

UK Green Growth Index
61
Commercial renewable energy capacity, as at end of March 2019
We used BEIS Sub-national Feed-in Tariff Statistics on the capacity of renewable non-domestic
installations registered for the Feed-In Tariff in England, Scotland, and Wales at the end of March
2019. These include Photovoltaics, Wind, Hydro, Anaerobic Digestion and Micro Combined Heat and
Power installations.57
We calculated the installed renewable non-domestic capacity registered in the programme per 1,000
jobs in each area using our own employment estimates derived through a combination of the ONS
Business Register and Employment Survey and ONS Workforce Jobs series.
57 Department for Business, Energy & Industrial Strategy, Sub-regional Feed-in Tariffs statistics, accessed April
2021.
South West
Scotland
Wales
Midlands
East of England
Yorkshire and the Humber
South East
North
London
Great Britain
0 50 100 150 200 250 300Source: BEIS, Oxford Economics
KW per 1,000 jobs
UK Green Growth Index
62
Grid renewable energy capacity, as at end of May 2020
Data were based on the BEIS Digest of UK Energy Statistics published in 2020.58 We aggregated to
calculate the installed capacity of renewable source power stations operational at the end of May
2020 in each nation and region. We divided the installed renewable capacity measure by 2019 ONS
Mid-Year Population Estimates by region.59
58 Department for Business, Energy & Industrial Strategy, Digest of UK Energy Statistics (DUKES): electricity,
accessed July 2021. 59 ONS, Estimates of the population for the UK, England and Wales, Scotland and Northern Ireland, accessed
July 2021.
Scotland
Wales
Yorkshire and the Humber
East of England
North
South West
South East
Northern Ireland
Midlands
London
UK
0.0 0.5 1.0 1.5 2.0 2.5
Source: BEIS Renewable Energy Planning Database, Oxford Economics
MW per 1,000 residents

UK Green Growth Index
63
Electric vehicle charging points, 2021
Data were taken from the Department for Transport’s Electric Vehicle Charging Device Statistics
which provide figures for the number of publicly available electric vehicle charging devices per
100,000 residents.60 Population figures were sourced from 2019 ONS Mid-Year Population Estimates
(the latest available at the time we undertook the analysis).61
60 Department for Transport, Electric vehicle charging device statistics: January 2021, accessed July 2021. 61 ONS, Estimates of the population for the UK, England and Wales, Scotland and Northern Ireland, accessed
July 2021.
68.7
40.1
31.3
27.6
25.5
22.3
21.4
20.7
19.2
16.9
31.1
London
Scotland
South East
South West
Wales
North
Midlands
East of England
Yorkshire and the Humber
Northern Ireland
UK
0 20 40 60 80
Source: Department of Transport, ONS
Charging points per 100,000 residents

UK Green Growth Index
64
APPENDIX 4: SOURCES FOR
REGIONAL ECONOMIC INDICATORS
GVA
Oxford Economics’ estimates for 2018, which are derived using data from the ONS Regional
Accounts.
JOBS
Oxford Economics’ estimates for 2018, which are derived using data from the ONS Business Register
and Employment Survey and the ONS Workforce Jobs series.
POPULATION
2018 ONS Mid-Year Population Estimates.62
EMISSIONS
Total emissions in 2018 from the UK local authority and regional carbon dioxide emissions national
statistics dataset published by BEIS (the latest available at the time we undertook the analysis).63
62 ONS, Estimates of the population for the UK, England and Wales, Scotland and Northern Ireland, accessed
July 2021. 63 Department for Business, Energy & Industrial Strategy, UK local authority and regional carbon dioxide
emissions national statistics: 2005 to 2018, accessed July 2021.