uk productivity and skills in an international context · during and after the crisis, overall...
TRANSCRIPT

BIS RESEARCH PAPER NUMBER 262
UK skills and productivity in an international context
DECEMBER 2015

Prepared for the Department for Business, Innovation and Skills by:
The National Institute of Economic and Social Research (NIESR)
2, Trench Street, Smith Square SW1P 3HE London
Authors: Ana Rincón Aznar (NIESR), John Forth (NIESR), Geoff Mason (NIESR), Mary O'Mahony (NIESR and Kings College London) and Michele Bernini (NIESR).
The views expressed in this report are the authors’ and do not necessarily reflect those of the Department for Business, Innovation and Skills.
2

Contents Contents .............................................................................................................................. 3
Abstract ............................................................................................................................... 5
Executive summary ............................................................................................................ 6
1. Literature review ........................................................................................................... 10
1. 1 Introduction .............................................................................................................. 10
1.1.1 Aims and objectives ........................................................................................... 10
1.1.2 Approach ............................................................................................................ 10
1.1.3 Structure............................................................................................................. 10
1.2. The UK’s Productivity Performance .......................................................................... 11
1.2.1 International comparisons of productivity ............................................................ 11
1.2.2 Productivity growth before and after the crisis .................................................... 12
1.3. The Role of Human Capital in Productivity Growth ................................................... 13
1.3.1 The role of human capital in the standard growth model ..................................... 13
1.3.2. The role of human capital in endogenous theories of growth ............................. 14
1.4. Methods for Estimating the Contribution of Skills to Productivity Growth .................. 15
1.5. Evidence on the Contribution of Skills to Productivity Growth ................................... 16
1.5.1 Growth accounting estimates ............................................................................. 17
1.5.2 Econometric estimates ....................................................................................... 20
1.6. The Related Role of Intangible Assets in Economic Growth ..................................... 24
1.7. Skills Supply and Utilisation in Comparative Perspective ......................................... 25
1.7.1 Educational participation and qualifications ........................................................ 26
1.7.2. Internationally-standardised measures of cognitive skills ................................... 26
1.7.3 Evidence on skill demand and skill utilisation ..................................................... 26
3

1.7.4 Future trends in education levels ........................................................................ 27
1.7.5 Economy-wide measures of human capital ........................................................ 27
1.7.6 Summary ............................................................................................................ 28
1.8. Next steps ................................................................................................................ 29
2. Descriptive Analysis ..................................................................................................... 29
2.1. Analysis of Trends .................................................................................................... 29
2.1.1 Recent aggregate productivity trends ................................................................. 30
2.1.2 Skill groups ......................................................................................................... 34
2.1.3 Trends in aggregate employment by skill group.................................................. 40
2.1.4 Wages ................................................................................................................ 45
2.2. Overview of Data Sources ........................................................................................ 48
3. Growth Accounting Analysis ....................................................................................... 50
3.1. Methodology............................................................................................................. 50
3.1.1. Calculating the contribution of skills to growth ................................................... 51
3.1.2. Calculating the contribution of on-the-job training to growth .............................. 53
3.2. Results of the growth accounting decomposition ...................................................... 57
4. Econometric Analysis ................................................................................................... 70
4.1. Methodology............................................................................................................. 70
4.2. Some descriptive statistics ....................................................................................... 74
4.3. Econometric results .................................................................................................. 77
5. Key Findings ................................................................................................................. 88
6. Conclusions .................................................................................................................. 89
7. References .................................................................................................................... 91
4

Abstract A nation's prosperity depends largely on its ability to raise the level of its productivity. The education level of its workforce, and how effectively the skills are used in the production processes, are considered important factors in this process. In this report we investigate the extent to which skills have contributed to recent productivity performance in the UK. We do this within a cross-country framework, where we compare the UK's productivity trajectories with those of other close competitors. We quantify the role played by different types of certified skills, both academic and vocational, taking account of the influence of other factors, such as capital investment and technological change. Furthermore, we assess the influence of intangible investments, usually excluded from published data and traditional growth studies. We use a wide range of data sources, and employ growth accounting and panel data econometric techniques.
The study begins with a comprehensive review of the literature on the role of human capital in productivity and growth, from both a theoretical and empirical point of view (section 1). We then provide a description of aggregate productivity and employment trends in section 2. Section 3 contains detailed results of the growth accounting decomposition and Section 4 summarises the econometric analysis. Sections 5 and 6 outline the key findings and conclusions emerging from this analysis.
The main research questions addressed in this report are:
• What have been the main sources of growth in the UK and other major economies since the recession? How have these differed relative to the previous periods?
• What is the link between skills and productivity/growth? How have skills contributed to growth over recent years?
• What is the contribution of different types of skills to growth? Where does the UK fare better and worse compared to international competitors?
• What is the role of training and other intangible assets in explaining productivity and growth outcomes? Do they interact differently with different types of skilled workers?
5

Executive summary In this study, we estimate the contributions of skills to productivity growth in the UK. The report is divided into four sections: a literature review, descriptive analysis, growth accounting analysis and an econometric approach.
Literature review
Education and skills are important drivers of productivity. Higher levels of educational attainment and skills raise productivity directly by expanding an individual’s economic capabilities - enabling them to accomplish more difficult tasks and to address more complex problems. But education and skills are also argued to raise productivity through indirect mechanisms - facilitating technological diffusion and innovation which may enable a nation to move to a higher growth path. Growth accounting studies have found that changes in labour composition (i.e. skills improvements) have tended to directly account for around a fifth of the growth in average labour productivity in the UK over recent decades. This study updates previous analyses and confirms this.
Various econometric studies have also confirmed the importance of skills and education for productivity growth. For example:
• Holland et al. (2013) found that a 1 per cent rise in the share of the workforce with a university education raises the level of productivity by 0.2-0.5 per cent in the long-run.
• Evidence from the US suggests that skills play a key role in the effective use of ICTs (Bresnahan et al., 2002).
• Brandenburg et al. (2007) find that innovation performance at firm level is enhanced by a combination of skills and R&D investments.
Recent evidence has shown that economic success is determined by the availability of a broad set of skills developed at different levels, both in general and vocational education. As information and communication technologies become more widespread, vocational skills are increasingly more important for the effective use of these technologies (Mason et al., 2014). Vocational skills – deployed in conjunction with high-level skills -- can also make useful contributions to absorptive capacity, which firms require to make effective use of knowledge, ideas and technologies generated outside their own organisations. However the contribution of this type of skills is not uniform across countries; vocational skills tend to play a more important role in countries with a stronger base of apprenticeship training.
The UK performs relatively well in terms of higher skills (bachelor’s degree and above), and there is ample evidence on the impact of higher skills. However, compared to other countries, the UK’s intermediate (practical, technical and occupational) skills are of more concern. There is also much less research into the extent to which these drive productivity growth.
6

Descriptive analysis
In the period considered (2001– 2013), the percentage of UK employment with upper-intermediate and lower-intermediate vocational qualifications remained at around 35%, but the proportion with low or no qualifications fell from 43% to around 30%, and the proportion with higher-level skills increased from around 20% to around 35%. For the UK, the stock of on-the-job training capital has been declining, or stagnating, since even before the financial crisis.
Growth accounting analysis
Growth accounting-based estimates seek to capture the direct effects of growth in measured skills on economic performance. While it is unable to account for any positive effects arising from the indirect effects of skills or from complementarities between skills and other production inputs, it allows us to examine how much of the observed rate of change of an economy or industry's output can be explained by the rate of change of the different inputs (broadly, labour quality and quantity, capital, and total factor productivity) over the same period.
The contribution of labour composition (sometimes known as labour quality) has remained positive through the whole period analysed, indicating an on-going increase in the average skill level of the UK's employed population. In the run-up to the financial crisis, the up-skilling of the UK's workforce accounted for around 20% of total labour productivity growth. During and after the crisis, overall growth in labour productivity was negative on average – largely because of declining total factor productivity -- but the contribution of skills continued to make a positive contribution (Figure 3.2). The implication of this finding is that labour productivity growth could have been even weaker in the UK in recent years had it not been for the significant up-skilling of the workforce. However this result needs to be treated with caution as a full assessment of changes in the contributions in a counterfactual scenario is beyond the scope of our research.
7

Figure 3.2. Growth contributions of labour, capital and productivity in United Kingdom (%), 2002-2013.
Sources: Conference Board Total Economy Database (TED), UK LFS, EU LFS, own calculations.
Looking at types of skills, the main story is of expansion in high-skilled employment over the time period studied. The higher-skilled group accounted for the largest contribution to labour productivity growth, both before and after the financial crisis. The contribution of upper-intermediate and lower-intermediate skills was positive up to 2007 but negative thereafter; this was largely due to changes in labour composition.
Econometric approach
Econometric techniques (panel data analysis) look to regress the rate of growth in an economy on a variety of different determinants, including indicators of human capital. This allows a closer inspection of spillovers and interaction of capital and labour with other factors of production, not picked up by the growth accounting analysis. Key results to note are:
• Training has a sizeable and significant effect on labour productivity across the countries studied between 1995 and 2010. A 10% increase in the total amount of training variable per employee would increase productivity by 2%.
• The UK’s inputs (capital, labour, training etc.) generally seem to make similar contributions to productivity and output growth as in the other countries studied,
8

though hours worked seem to contribute less to output growth than in other countries and non-ICT capital provides a greater contribution.
• Industries with greater skill intensity benefit disproportionately from growth in training capital. This implies that training has a greater return in industries with a greater proportion of highly qualified workers. However, training also seems to enhance the productivity benefits in those industries or countries with a larger proportion of upper-intermediate workers.
• High-level academic skills have a larger positive influence on productivity in those industries where innovative property investment represents a higher share of output and those with higher ICT intensity. In these industries, upper-intermediate skills also make a positive contribution to productivity, but this is of lower magnitude than in the case of the high-skills, in line with expectations.
• The presence of upper-intermediate skills has a stronger influence on productivity in those sectors with a higher intensity of non-ICT capital and training capital.
• Taken together, these results imply that high-level and upper-intermediate skills have complementary functions in enhancing productivity – the former more important for industries with high ICT intensity, the latter more important for industries with high non-ICT intensity and where interacted with additional training investment.
Overall, the econometric results suggest that having a highly skilled workforce (either with high-level or upper intermediate qualifications) is important when combined with investment in intangible assets such as training and innovative property. This is consistent with the idea that the use of information technology, which increasingly is associated with complementary investments in intangible assets, is relatively skill-intensive. Our results suggest that the skill bias of new technology carries over to the period directly following the crisis. However, the small sample sizes warn against drawing too firm conclusions and further work is required, especially including the ‘recovery’ period after the financial crisis.
9

1. Literature review 1. 1 Introduction
1.1.1 Aims and objectives There is a strong evidence base on the macroeconomic returns to investments in education and skills, with extensive reviews having previously been conducted by Sianesi and Van Reenen (2003), Garrett et al. (2010) and Holland et al. (2013) among others. However the research literature is growing continuously and there is a need for an up-to-date assessment of both the theory and evidence. This literature review therefore has the following objectives:
• to summarise the theoretical work on the links between skills and productivity
• to provide an up-to-date summary of the empirical work on the links between skills and productivity
• to summarise the existing evidence on the contribution made by skills to the UK’s recent productivity performance.
Our empirical analysis will then build on these foundations by undertaking new research into the link between skills and productivity growth in comparative perspective.
1.1.2 Approach The review takes a pragmatic or ‘realist’ approach (Pawson et al., 2004), seeking to distil the key points on each of the issues to be covered, and focusing on the most informative studies in each area, rather than attempting to review all of the available literature. It covers both theoretical and empirical studies published in the field of economics, and encompasses international studies, but relies on English language sources only.
1.1.3 Structure The review begins in Section 1.2 by reviewing the latest estimates of the UK’s productivity performance. It then goes on in Section 1.3 to review the main theoretical frameworks which posit linkages between skills and productivity. Section 1.4 then outlines the main methods used to estimate the contribution of skills to productivity, while Section 1.5 gives an overview of the latest estimates of the contributions of skills to productivity under these different approaches. Section 1.6 reviews the evidence on the supply and utilisation of different types of skill in the UK. Section 1.7 concludes.
10
1.2. The UK’s Productivity Performance
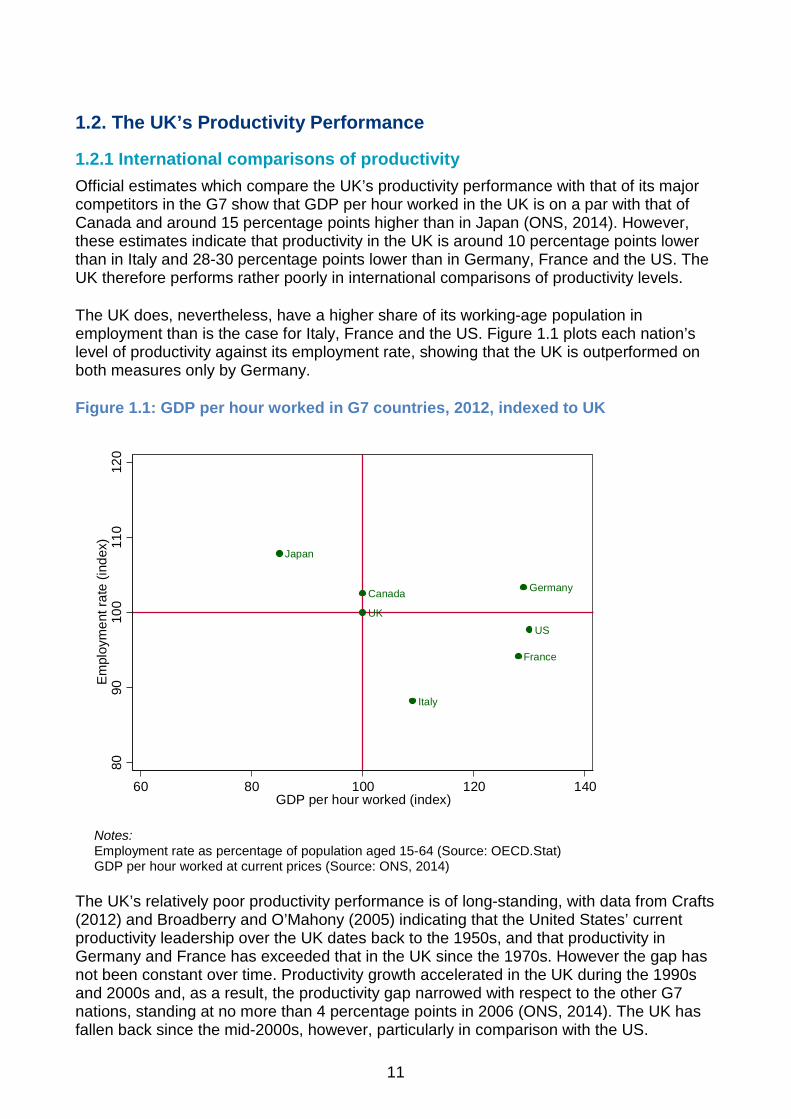
1.2.1 International comparisons of productivity Official estimates which compare the UK’s productivity performance with that of its major competitors in the G7 show that GDP per hour worked in the UK is on a par with that of Canada and around 15 percentage points higher than in Japan (ONS, 2014). However, these estimates indicate that productivity in the UK is around 10 percentage points lower than in Italy and 28-30 percentage points lower than in Germany, France and the US. The UK therefore performs rather poorly in international comparisons of productivity levels.
The UK does, nevertheless, have a higher share of its working-age population in employment than is the case for Italy, France and the US. Figure 1.1 plots each nation’s level of productivity against its employment rate, showing that the UK is outperformed on both measures only by Germany.
Figure 1.1: GDP per hour worked in G7 countries, 2012, indexed to UK
Canada
France
Germany
Italy
Japan
UKUS
8090
100
110
120
Em
ploy
men
t rat
e (in
dex)
60 80 100 120 140GDP per hour worked (index)
Notes: Employment rate as percentage of population aged 15-64 (Source: OECD.Stat) GDP per hour worked at current prices (Source: ONS, 2014)
The UK’s relatively poor productivity performance is of long-standing, with data from Crafts (2012) and Broadberry and O’Mahony (2005) indicating that the United States’ current productivity leadership over the UK dates back to the 1950s, and that productivity in Germany and France has exceeded that in the UK since the 1970s. However the gap has not been constant over time. Productivity growth accelerated in the UK during the 1990s and 2000s and, as a result, the productivity gap narrowed with respect to the other G7 nations, standing at no more than 4 percentage points in 2006 (ONS, 2014). The UK has fallen back since the mid-2000s, however, particularly in comparison with the US.
11

1.2.2 Productivity growth before and after the crisis Figure 1.2 shows annual growth in GDP per hour worked for the G7 countries over the period 1997-2013. The UK’s strong performance in the late 1990s and early 2000s is clearly apparent. GDP per hour grew at an average rate of 2.1% per annum in the UK from the mid-1990s to 2007, aided by a rapid rate of growth in TFP, ICT-capital deepening and increases in skill levels (see Van Reenen, 2013).
Figure 1.2: GDP per hour worked in G7 countries (2007=100)
Source: ONS (2014)
In contrast, during the period 2007-2009, productivity decreased at an average rate of -1.1% per annum, and during 2009-2013 growth averaged just 0.4% per annum. The combination of low productivity and high employment has been termed the ‘UK’s labour productivity puzzle’. However, as Figure 1.2 shows, the UK has not been the only country in Europe to experience slow productivity growth, with France and Germany also posting slower rates of growth in recent years than they had done in the period leading up to recession. The major contribution to the UK’s experience appears to have come from a decline in TFP growth (see Goodridge et al., 2014; Harris and Moffat, 2014; Riley et al., 2014). Capital shallowing appears to have made a minor contribution, but changes in labour composition have contributed positively to productivity growth since 2007 (see Table 1.1 below). The implication is that productivity growth would have been even weaker in the UK in recent years had it not been for the continued up-skilling of the workforce.
12

Table 1.1: Productivity growth before and after the crisis
2000-2007 2007-2011 Change in ln(GDP/hour) per annum 2.5% -0.5% Estimated contributions from growth accounting:
Labour composition 0.2% 0.6% Capital deepening 1.1% 1.0% TFP growth 1.2% -2.1%
Source: Goodridge et al. (2014: Table 1).
1.3. The Role of Human Capital in Productivity Growth It has long been recognised that education and skills are important drivers of economic growth and productivity. Higher levels of educational attainment and skill raise productivity directly by expanding an individual’s economic capabilities - enabling them to accomplish more difficult tasks and to address more complex problems. But education and skills are also argued to raise productivity through indirect mechanisms - facilitating technological diffusion and innovation which may enable a nation to move to a higher growth path1.
1.3.1 The role of human capital in the standard growth model The direct effects of human capital can be situated within the standard neo-classical growth model developed by Solow (1957). Within this framework, the output of the macro economy is viewed as a direct function of factor inputs - physical capital and labour - augmented by a residual termed 'total factor productivity' (TFP) or disembodied technical progress: the efficiency by which both labour and capital are used in the production process. Output (Y) can be improved by: increasing the amount or quality of labour inputs (L); increasing the amount or quality of physical capital available per worker (K); or by raising TFP (A).
𝑌𝑌 = 𝐴𝐴𝐾𝐾𝛼𝛼𝐿𝐿𝛽𝛽 (1)
Under the assumption of constant returns to scale we would have 𝛽𝛽 = 1 − 𝛼𝛼
From the point of view of measurement, the earliest work under this framework utilised simple measures of the size of the population or labour force to proxy labour inputs, but improvements in the measurement of labour inputs led to L being measured as an index comprising both a quantity component (e.g. hours worked) and a quality component (e.g. proxied by wages) (see Jorgenson, 1991, for a discussion). Expressing the variables in terms of 'per unit of labour input', and taking logs, equation 1 can then be expressed as:
ln �𝑌𝑌𝐿𝐿� = ln𝐴𝐴 + 𝛼𝛼 ln �𝐾𝐾
𝐿𝐿� + 𝛽𝛽 ln �𝐻𝐻
𝐿𝐿� (2)
where H is the measure of labour quality.
1 Investment in human capital may also have other, broader social impacts, e.g. by improving health or reducing crime. These may have indirect, positive effects on growth in the medium to long-term. However such broader returns are beyond the scope of this review.
13

Variations on this approach have involved disaggregating L into different types of labour (e.g. workers with different levels of educational attainment), or treating it as a three-factor production process in which human capital (e.g. measured by educational attainment) is entered separately from the quantity of labour inputs and the output-elasticity is allowed to differ across the two inputs (e.g. Mankiw et al., 1992).
Whatever the precise specification, this neo-classical or 'standard' growth model proposes that a country with higher quality labour (a greater stock of human capital) should have larger national output per unit of labour input than an otherwise identical country with lower quality labour. However, investments in physical or human capital do not raise the long-term growth rate; instead they create a short-term increase in the growth rate (e.g. as new graduates replace less-educated retirees) until a new steady state is reached. In other words, the rate of technological progress is assumed to be exogenous to the model. This assumption is challenged within new 'endogenous' theories of growth.
1.3.2. The role of human capital in endogenous theories of growth Whilst the standard model of growth focuses implicitly on the direct effects of increasing a nation's stock of human capital, it is also recognised that there may be additional, indirect effects from education, such that the long-term growth rate of TFP is itself a function of the level of education or human capital in the economy. Following the notation used in equations 1 and 2 above:
ln �𝑌𝑌𝐿𝐿� = ln𝐴𝐴(𝐻𝐻,𝑍𝑍) + 𝛼𝛼 ln �𝐾𝐾
𝐿𝐿� + 𝛽𝛽 ln �𝐻𝐻
𝐿𝐿� (3)
where Z is a vector of variables (such as R&D expenditure or the degree of openness of the economy) which, along with H, may affect the rate of technical progress. Under this approach, A is then no longer considered to be exogenous.
A number of different models have been developed to illustrate the possible mechanisms through which human capital may affect the long-run growth rate of the economy, as well as the level. In the model of economic growth and human capital developed by Lucas (1988), the accumulation of human capital generates spillovers as educated workers pass on their knowledge to other workers.2 In other models, human capital accumulation promotes investments in physical capital (Romer, 1986) or it promotes investments in research and development (R&D) (Romer, 1990)3. Other macro models (e.g. Nelson and Phelps, 1966; Benhabib and Spiegel, 1994, 2005) also argue that education and skills serve as facilitators for technological diffusion, with positive effects on growth. The presumption within many of these approaches is that an educated labour force is better at creating, implementing, and adopting new technologies, thereby generating growth. These
2 Such spillovers may explain why increased education levels in an area are correlated with higher earnings for locals with relatively little education (Winters, 2015).
3 Evidence for the complementarities between human capital and new technology is found inter alia in the literature on skill-biased technical change (e.g. Machin and Van Reenen, 1998). Green and Mason (2015) provide an overview of the literature on the complementarities between skills and innovation.
14

models therefore emphasise the indirect effects of education and skills in moving a country to a higher growth path.
As in the standard growth models, attention has also been paid to the returns that may be generated by different types of labour. In particular, Acemoglu et al. (2006) and Vandenbussche et al. (2006) argue that the creation of new technologies (innovation) and their subsequent adoption (diffusion) require different types of skill. Specifically, innovation is argued to make intensive use of highly-educated workers, while diffusion of technology primarily through imitation is argued to rely more on less-highly educated labour. Innovation is argued to become more important as countries move closer to the technology frontier, and so the implication for developed countries such as the UK is that greater emphasis needs to be placed on high-level skills in order to generate growth.
1.4. Methods for Estimating the Contribution of Skills to Productivity Growth
The various models set out in the previous section have each been applied in seeking to estimate the contribution of skills to economic growth, and each has received support from the data. In other words, there is evidence under either framework that education and skills make a positive contribution to growth. At the same time, however, it is difficult to compare the alternative models and to choose among them. First, each requires a different empirical specification for the analysis; and second, there is insufficient variation among countries offering good quality data to distinguish categorically between the competing models. As a consequence, there remains no categorical view as to the relative importance of the various direct and indirect channels - a number of different channels are thus seen to be important. The evidence is reviewed in the next section of the report; here we give a broad overview of the methods used in empirical studies. Empirical analysis of the contribution of skills to growth takes two broad forms: growth accounting; and econometric approaches. The OECD Productivity Measurement Manual (OECD, 2009) notes that the two approaches are complementary, advocating growth accounting as the recommended tool for periodic productivity statistics, but recommending econometric methods as the best approach for academically-oriented hypothesis testing.
Growth accounting-based estimates seek to capture the direct effects of growth in measured skills on economic performance. This non-parametric technique does so by allowing us to examine how much of the observed rate of change of an economy or industry's output over a specified period can be explained by the rate of change of the different inputs over the same period (see Jorgenson et al., 1987). Growth is then allocated to those parts explained by changes in labour inputs, capital inputs and TFP. It is then possible to identify the relative importance of changes in labour quality as a direct source of labour productivity growth.4 However the growth accounting methodology has the disadvantage that it is unable to account for any positive effects arising from the indirect effects of skills or from complementarities between skills and other production inputs. It also relies on restrictive assumptions, such as constant returns to scale.
4 As such, they are firmly rooted in the neo-classical model.
15

Econometric approaches seek to regress the rate of growth in an economy (or economies) on a variety of different determinants, including indicators of human capital. Such approaches allow for non-constant returns to scale, and allow for the specification of interaction effects between the inputs and other determinants. There are important choices to be made when specifying such regressions, such as how to address endogeneity (Sianesi and Van Reenen, 2003: 164-171)5. However, such methods are better placed than growth accounting to identify the indirect effects of skills, as they are better able to indicate the mechanisms through which skills may affect growth.
A critical issue which affects both methodologies is the measurement of skills. Within the growth-accounting approach, labour quality is typically measured through an index of quality-adjusted labour inputs. Here, the hours contributed by workers in a particular skill group are weighted by a factor proportional to the ratio of the average wage earned by workers in that skill group to the average wage earned by workers within the lowest skill group. The sum is then taken across all skill groups and divided by the total number of hours worked in the economy to obtain the country measure of quality-adjusted labour per unit of hours worked. Such an approach necessarily relies on the availability of skill category measures that are consistent over time and comparable across countries, which in turn requires the approach typically to utilise broad skill categorisations focused on educational qualification groups. The approach also assumes that workers are paid their marginal product (that wage differentials reflect true productivity differences between workers, rather than other institutional factors). This is in accordance with the assumption of competitive factor markets.
Econometric methods may also use such measures of 'quality-adjusted labour inputs', but they also employ a much wider range of indicators. Studies involving large numbers of countries have to rely on simple measures such as the average number of years of schooling, particularly when estimating cross-country models that include developing countries where other data is sparse. Other measures used include monetary investments, qualification attainments and standardised test scores. The variety of measures used in econometric analyses is helpful in bearing down on the components of human capital, but also in pointing to the potential role of policy interventions.
The fact that the growth accounting and econometric approaches differ means that the results of the two approaches are not directly comparable. The growth accounting approach focuses on the relative contribution of different inputs and TFP in accounting for growth in retrospect, whereas the econometric approaches attempt to identify the causal impact of particular factors on growth. However, as noted above, taking the different studies together, there is compelling evidence that increasing human capital raises productivity. This evidence is reviewed in the next section.
1.5. Evidence on the Contribution of Skills to Productivity Growth
This section first presents an overview of recent growth accounting estimates before moving on to discuss the results of recent econometric analyses. Issues relating to the
5 Endogeneity is a problem as output and inputs are usually subject to similar influences.
16

measurement of skills, and to the identification of the different channels through which skills may affect productivity, are highlighted in the course of the discussion.
1.5.1 Growth accounting estimates Growth accounting estimates have tended to find that changes in labour composition can account for around 15-20% of the growth in average labour productivity in the UK over recent decades. However, estimates vary according to the sample period and the measures of skill that are utilised in the analyses.
Van Reenen (2013) and Holland et al. (2013) have both used EUKLEMS data to undertake growth accounting analyses of the contribution made by changes in labour composition to productivity growth over the past three decades. Both split the time period in two, although using slightly different start, break and end points, and both employ the basic three-category skill grouping available in EUKLEMS6. Their estimates cover the years prior to the recent recession. The estimates differ considerably for the period leading up to the mid-1990s, but for the decade from the mid-1990s to the mid-2000s they both estimate that changes in labour quality accounted for around one sixth of the overall growth of productivity (Table 1.2).
The contribution from changes in labour composition can be attributed to increases in the shares of the workforce with secondary and tertiary education, and a corresponding decline in the share of those with only primary education. Holland et al. (2013) show that the contribution from tertiary education was similar to that of secondary education over the period 1982-1993, but that the contribution of tertiary education was around three times higher than that of secondary education in the later period 1994-2005.
Table 1.2: Growth accounting estimates of labour productivity growth in the UK.
Time period
Skill groups
ALP growth per annum
Shares due to:
Labour composition
Capital deepening TFP
Holland et al. (2013) 1982-1993 Three 2.7 ppts 22% 56% 22% 1994-2005 Three 2.5 ppts 16% 56% 24% Van Reenen (2013) 1979-1997 Three 2.7 ppts 11% 48% 41% 1997-2007 Three 2.8 ppts 18% 46% 36% Mason et al. (2014) 1981-1989 Five 2.4 ppts 17% 21% 58% 1990-1998 Five 2.4 ppts 17% 33% 46% 1999-2007 Five 2.2 ppts 18% 32% 50% 1981-2007 Five 2.3 ppts 17% 30% 53% O'Mahony (2012a) 2001-2007 Three
+ training
1.9 ppts 24% 51% 26%
Note: Shares may not sum to 100% due to rounding.
6 High-skilled (tertiary education), medium-skilled (secondary education) and low-skilled (primary education). See Timmer et al. (2007).
17

The estimates from Van Reenen (2013) and Holland et al. (2013) focus primarily on the contribution of educational qualifications. However Mason et al. (2014) develop a five-category skills measure which provides a more detailed view of the role of intermediate vocational skills. Their estimates cover the period 1981-2007 and suggest that changes in labour quality account for 18 per cent of the growth in labour productivity over the whole period: an estimate that is stable across sub-periods (Table 1.2). Intermediate vocational qualifications contribute positively in the 1980s, in particular, but as in the analysis by Holland et al., it is higher-level skills which contribute most in recent years.
O'Mahony (2012a) goes further by adding a measure of workforce training provided by employers to the index of labour quality, thereby expanding the indicator to include a measure of uncertified skills. The difficulties of expanding the measure in this way, however, mean that O'Mahony's estimates only cover the period 2001-2007. Her estimates indicate that around one quarter of productivity growth in the UK over this period can be attributed to improvements in labour quality (Table 1.3). Training investments account for around one sixth of this contribution in the UK, with the more 'traditional' measure of labour composition accounting for the remaining five-sixths. Each of the growth accounting approaches discussed above includes cross-country comparisons, and so it is also possible to identify the relative contribution of skills to productivity growth in the UK when compared with some of its close competitors. Mason et al.’s estimates for the period 1981-2007 indicate that improvements in labour quality were of relatively greater importance in the UK than in France or Germany, where greater shares of productivity growth can be attributed to capital deepening (Figure 1.3). Up-skilling was also of greater importance in the UK than in Sweden, where TFP growth was particularly strong. In Mason et al.’s comparisons, the contribution of skills in the UK was on a par with that seen in Denmark and the Netherlands. Figure 1.3: Average contributions of growth in physical capital per hour worked, TFP and skills to growth in output per person-hour, 1981-2007.
Source: Mason et al. (2014: Figure 5)
18
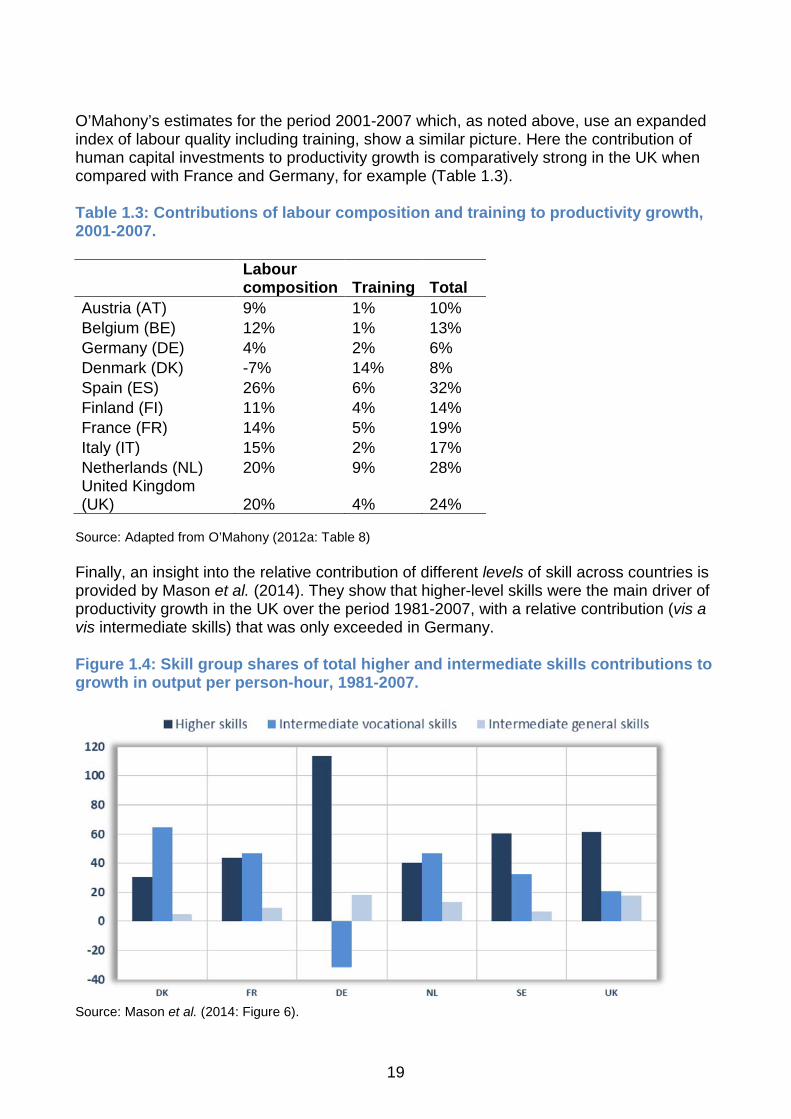
O’Mahony’s estimates for the period 2001-2007 which, as noted above, use an expanded index of labour quality including training, show a similar picture. Here the contribution of human capital investments to productivity growth is comparatively strong in the UK when compared with France and Germany, for example (Table 1.3). Table 1.3: Contributions of labour composition and training to productivity growth, 2001-2007.
Labour composition Training Total
Austria (AT) 9% 1% 10% Belgium (BE) 12% 1% 13% Germany (DE) 4% 2% 6% Denmark (DK) -7% 14% 8% Spain (ES) 26% 6% 32% Finland (FI) 11% 4% 14% France (FR) 14% 5% 19% Italy (IT) 15% 2% 17% Netherlands (NL) 20% 9% 28% United Kingdom (UK) 20% 4% 24%
Source: Adapted from O’Mahony (2012a: Table 8) Finally, an insight into the relative contribution of different levels of skill across countries is provided by Mason et al. (2014). They show that higher-level skills were the main driver of productivity growth in the UK over the period 1981-2007, with a relative contribution (vis a vis intermediate skills) that was only exceeded in Germany. Figure 1.4: Skill group shares of total higher and intermediate skills contributions to growth in output per person-hour, 1981-2007.
Source: Mason et al. (2014: Figure 6).
19

In summary, growth accounting estimates indicate that just under one fifth of recent productivity growth in the UK can be accounted for by improvements in skill levels, rising to around one quarter when the indicator of labour quality is augmented with a measure of workforce training. The contribution of human capital investments to productivity growth has been strong in the UK relative to many of its competitors. High-level skills appear to have played a particularly important role when compared with the experience of other large European countries.
1.5.2 Econometric estimates Section 1.4 noted that the empirical literature which utilises econometric methodologies is better placed than the growth accounting literature to quantify the broader returns to education beyond the direct effects on the productivity of individual employees. Sianesi and Van Reenen (2003) provided a comprehensive survey of early empirical studies, and Holland et al. (2013) provide a more recent review. In both surveys, the econometric evidence is supportive of the conclusion that human capital has a positive and significant effect on productivity. The particular value of the econometric studies, however, is in being able to utilise a wider variety of measures of human capital than is possible under the growth accounting approach, and thus to point towards some of the mechanisms through which human capital raises productivity. The econometric estimates typically come in three forms: cross-country regressions which seek to explain variations in nations’ performance; studies which seek to exploit time-series variation for a single country; and industry-level regressions which are able to control for country-specific fixed effects. We review some of the main results below, organising the discussion around the main measures of human capital that have been used in the literature.
1.5.2.1. Educational participation Measures of educational participation have been available for a large number of countries for at least two decades, and these have facilitated a large body of research on the relationship between years of schooling and productivity. Summarising the early evidence, Sianesi and Van Reenen (2003) noted that studies taking a neo-classical approach typically found that a one-year increase in the average number of years of schooling in a country was associated with a 3-6 per cent increase in the level of output per head. Studies situated in the endogenous growth literature typically found that a one-year increase in years of schooling was associated with a 1 per cent increase in the growth rate of productivity, although it is doubtful that such a result would pertain in developed countries (see Sianesi and Van Reenen, 2003: 188; also Krueger and Lindahl, 2001).
Whilst such measures of educational participation have the advantage of being available for the largest number of countries and time points, they have notable disadvantages. First, they assume that school attendance is a good proxy for the acquisition of knowledge. Second, they assume that each additional year of schooling delivers the same increase in
20

knowledge and skills regardless of the starting point.7 Third, they also assume that all national school systems are of equal quality.
Some recent studies have used improved measures of years of schooling that allow for differential returns from primary, secondary and tertiary education. Barro and Lee’s (2010) estimates for a sample of 127 countries suggest that the return to every additional year of schooling is 10 per cent at the secondary level and 18 per cent at the tertiary level.8 The limitation remains, however, that such estimates are based on measures of educational inputs rather than measures of attainment.
1.5.2.2 Monetary investments In a similar vein to the literature on years of schooling, Keller (2006) examines the impact of educational expenditure as a determinant of productivity. She measures expenditures on public education at primary, secondary and tertiary level and finds that developed countries that have spent a greater share of their GDP on secondary education have seen faster per-capita growth, although her results are sensitive to the precise specification of her model.
One potential difficulty with cross-country estimates of the influence of education spending, however, is its potential endogeneity with respect to measures of a nation’s productivity and growth. This issue is addressed directly by Aghion et al. (2009) who examine the link between education spending and per-capita growth within the US. They use a series of political instruments (e.g. the arrival of vacancies on legislative committees at federal and state level) to cause arbitrary variation in educational spending and find that exogenous shocks to investments in four-year college education generate per-capita growth in all US states. In contrast, they do not find any returns from investments in two-year college education. Investments in research-intensive universities9 are found to raise per-capita growth in states fairly close to the technological frontier, suggesting that innovation is an important means through which education spending can raise growth. We return to this subject in Section 1.2.5.6.
1.5.2.3 Educational attainments Moving from measures of educational inputs to measures of outputs, a number of studies have examined the links between educational attainments and productivity growth. Measures of attainment based on qualifications have the advantage of being better able to capture what has actually been learned, and so are preferable to measures of participation. However, they have the accompanying disadvantage of being hard to compare across countries with different education systems, and so studies based on comparable measures of qualifications attainments tend to use more limited samples of countries than the studies mentioned hitherto.
7 In other words, the associated returns are assumed to be linear throughout the various levels of the education system. 8 Barro and Lee do not give level-specific returns for different regions. But they find an average rate of return of around 8 per cent from each additional year of schooling in Europe and Central Asia, compared with an average rate of return of around 12 per cent in their full sample. 9 Spending on research-intensive universities covers expenditures of post-secondary institutions that fit into one of the following categories of the Carnegie Classification: “Research 1”, “Research 2”, “Doctoral 1”, “Doctoral 2” (see Carnegie Foundation for the Advancement of Teaching (2005)).
21

Mason et al. (2012) use direct measures of qualifications attainments in an industry-level study of productivity across five countries (UK, US, France, Germany and the Netherlands) for the period 1979-2000. In GMM estimations they find that a 1 per cent increase in the proportion of hours worked by persons with a degree-level qualification increases average labour productivity by 0.12 per cent (p.355).10 Degree-level qualifications are also found to be positively associated with rates of TFP growth, albeit only in graduate-intensive industries (p.358). In contrast, they find no effects from intermediate-level skills (technician and craft-level qualifications).
Holland et al. (2013) go on to examine the influence of degree-level qualifications in a 15-country study covering the period 1982-2005. Using a similar specification to that used by Mason et al. (2012), they find that a 1 per cent rise in the share of the workforce with a university education raises the level of productivity by 0.2-0.5 per cent in the long-run. Their estimates suggest that at least one-third of the UK’s productivity growth from 1994-2005 can be attributed to the substantial accumulation of graduate skills in the labour force over that period (p.61).
Neither of these studies is concerned with the timing of the attainment: that is, whether the qualification was attained during the traditional years of schooling or later in life. However this issue is investigated directly by Dorsett et al. (2010, 2011). Their studies, which use the British Household Panel Survey (BHPS), are limited to an individual-level examination of wage returns and employment probabilities. They find that, for men, a qualification attained after the age of 25 raises wages by around 9 per cent in cases where the new qualification is at a higher level than their previous attainment, and between 2-6 per cent where it does not (Dorsett et al., 2010). For women, the effects are roughly doubled (Dorsett et al. 2011).11 These results suggest that lifelong learning can raise an individual’s productivity, particularly where it involves a new, higher level of educational attainment to that obtained during traditional schooling.
1.5.2.4. Uncertified skills Some of the qualifications considered by Dorsett et al. (2010, 2011) may have been acquired in the course of a person’s employment, but a more complete assessment of workplace-based skill acquisition would also include the role of uncertified skills acquired through training. Mason et al. (2012) incorporate the role of uncertified skill by developing quality-adjusted skill measures similar to those used in growth accounting studies. They combine measures of formal qualifications with relative earnings data in order to capture differences in relative productivity between different groups, with the assumption that these wage differentials will reflect productivity differences arising from the possession of both uncertified and certified skills. They use this measure in the five-country study cited in Section 1.5.2.3 above and find that a 1 per cent increase in their measure raises average labour productivity by 0.3 per cent. Comparison with the results obtained from their measure of qualifications attainment, discussed earlier, suggests a stronger role for human capital when taking uncertified skills into account.
10 Generalised Methods of Moments is an instrumental variable econometric technique. 11 There are additional effects on the probability of employment, which are substantial for women, and for men who experience qualifications upgrading, but negligible for men who do not.
22

In a further investigation of the role of training, Mason et al. (2014) add to their growth accounting analyses, discussed in Section 1.5.1 by conducting an econometric analysis that seeks to explain the level of GDP per hour through reference to the shares of workers with certified skills at five different skill levels (higher, upper-intermediate vocational, lower-intermediate vocational and lower-intermediate general), along with measures of the average training capital per hour worked for high-skilled and intermediate-skilled workers.12 Their estimates show that there are significant interaction effects between training capital and the shares of workers at both high-skilled level and at upper-intermediate level. This suggests that the positive impact of higher-level certified skills is reinforced by uncertified skills developed through employer investments in job-related training. In a related study O’Mahony and Riley (2012), using data for the European Community Household Panel (ECHP) show that spillovers from higher education are significant and greater when combined with employer provided training.
1.5.2.5 Internationally standardised measures of cognitive skills As noted above, measures of qualifications and uncertified skills move us closer to a measure of the actual skill level (or human capital) that serves as an input to the production process, but the use of such indicators is inevitably limited by the difficulties of obtaining comparable indicators across countries with different education systems. A recent response to this problem has been the development of internationally-standardised data on cognitive skills.
Hanushek and Woessmann (2012) use data from a series of international tests of the maths and science skills of secondary school children from 50 countries over the period 1960-2000. Adopting an endogenous growth framework, they find that a one standard deviation improvement in test scores is associated with a 1.2-2.0 percentage points higher average annual growth rate in GDP per capita across their full sample. The effect is apparent in a restricted sample of developed countries, and the impact appears to have grown stronger in the second half of their estimation period. Notably, their analysis also shows a complementarity between the development of basic skills and the development of the higher-level skills which have tended to be the focus of much recent work based on measures of qualifications. Separate simulations by Hanushek and Woessmann suggest that raising the UK’s average score by around one-quarter of a standard deviation, such that it reached the attainment of Finland, would increase long-run growth by 0.49 percentage points (OECD, 2010: 25); a similar return would be obtained by eliminating the tail of low achievement in the UK, such that all students obtained a minimum of 400 points on PISA (ibid.: 26).
There are, to our knowledge, no similar papers (as yet) which seek to explain cross-country variation in growth or productivity using the results of the OECD’s more recent Programme for the International Assessment of Adult Competencies (PIAAC). However, there have been some initial assessments of wage returns using these data. Using a sample of PIAAC data from 22 countries, Hanushek et al. (2013) show that a one standard deviation increase in numeracy skills is associated with an 18 percentage point increase in wages at the individual level. In single-country specifications focusing solely on the UK, however, literacy and problem-solving skills appear to be at least as important in providing
12 The methodology for computing training capital follows that used by O’Mahony (2012a, 2012b).
23

wage returns for individuals (ibid.: Table A-3). Clearly this will be an area of further research in the future.
1.2.5.6 Indirect effects and spillovers The preceding sections discuss the literature which seeks to identify the links between skills and productivity levels or growth rates, taking some account of the possible indirect effects. However the discussion touches only fleetingly on the mechanisms by which these indirect effects may take place. As noted in Section 1.3, the main mechanisms that are judged to be relevant are the role of skills in facilitating technological diffusion and their role in promoting innovation. As a means of adding to the discussion, we finish this section of the review by providing a brief summary of some of the evidence in these regards.
In respect of technological diffusion, evidence from the US suggests that skills play a key role in the effective use of ICTs (Bresnahan et al., 2002), while studies in a number of European countries have also provided evidence of a complementary relationship between workforce education or skills and the adoption of new technologies (e.g. Bayo-Moriones and Lera-López, 2007; Hollenstein, 2004). These studies support the proposition that higher-skilled workers facilitate the selection, installation, operation and maintenance of ICTs and also their adaptation to firm-specific requirements. This positive relationship between education or skill levels and ICT adoption also holds in cross-country studies involving European and other industrial nations (e.g. Gust and Marquez, 2004).
Turning to the role of skills in facilitating innovation, Brandenburg et al. (2007) find, in a sample of European firms, that innovation performance at firm level is enhanced by a combination of skills and R&D investments, whilst Griffith et al.’s (2004) cross-country, sector-level analysis found that R&D spending and high-level skills helped to stimulate productivity growth via their combined effects on innovation. Other evidence suggests that one of the key mechanisms here involves knowledge transfer among skilled workers: either through supply-chain collaboration on R&D and technical problem-solving (Lundvall, 1992) or through the mobility of highly-qualified engineers and scientists between firms (Mason et al., 2004).
Sena and Añon Higon (2014) provide further evidence that the impact of skills on innovation may spread (or ‘spill over’) beyond specific firms or industries, showing that the local density of human capital facilitates the absorption of R&D spillovers. They develop a quality-adjusted labour index in industry-by-region cells within the UK and use this to identify locations where the educational attainment of workers in a given industry are either closer to, or further away from, the industry maximum across all regions. When linked with firm-level data on productivity and R&D, this shows that plants located in regions where the educational attainment of the workforce in an industry is closer to the frontier tend to have faster absorption of R&D spillovers from other industries and experience an increase in productivity.
1.6. The Related Role of Intangible Assets in Economic Growth
The previous sections of this review have focused on human capital which by their nature is an intangible asset. Thus, there is an obvious overlap with the growing literature on the role of broader categories of intangible assets in economic growth. There are a variety of ways in which the research literature has defined intangible assets, but they are typically defined to include: digitized information (software and databases); innovative property
24

(R&D); and economic competences or organisational assets (brand names, firm-specific human capital, and management capabilities) (see, for example, Corrado et al., 2005). Intangible capital is thus knowledge-based capital to a large extent, although the non-certified and non-visible nature of this knowledge makes it difficult to measure.
One approach to measurement has been to identify the shares of workers involved in the creation of each type of intangible capital (see Riley and Robinson, 2011). Another has been to focus on specific types of intangible capital, such as management capabilities (Bloom et al., 2014). However, more comprehensive attempts have recently been made to build up estimates of the stock of intangible capital (see Dal Borgo et al., 2013; Corrado et al., 2012; Niebel et al., 2013).
Dal Borgo et al. (2013) use their measure of intangible capital in growth accounting estimates of productivity growth in the UK over the period 1990-2008. They find that intangible assets account for just under one quarter (23 per cent) of UK productivity growth over the period 2000-2008, with the majority of this contribution formerly being assigned to TFP. There is an accompanying reduction in the contribution of labour composition but it is small: the share of productivity growth that is accounted for by changes in labour composition falls from 9 per cent to 7 per cent in the period 2000-2008 after the inclusion of intangible capital.
Corrado et al. (2012) develop a measure of intangible capital for the EU-27 plus Norway and the United States. In growth accounting estimates, they find that intangibles account for 24 per cent of UK productivity growth over the period 1995-2007, with changes in labour composition accounting for a further 14 per cent. Their cross-country data facilitate international comparisons, which show that the UK contributions from intangibles and labour composition are larger than seen in the EU as a whole, but on a par with estimates for the US.
Finally, Niebel et al. (2013) use similar data to that used by Corrado et al. and conduct both growth accounting and econometric analysis at the industry level covering 10 European countries over the period 1995-2007. Their growth accounting estimates suggest that intangible capital accounted for 16% of productivity growth in these countries over the period, but this fraction rises to 27% within their econometric analysis. This result suggests that further investigation is needed of the potential spillovers arising from investment in intangible assets.
1.7. Skills Supply and Utilisation in Comparative Perspective
In the final section of this review, we switch from a focus on the impact of skills on productivity to look at the UK’s comparative position in terms of the supply and utilisation of skills within the economy. The preceding discussion has indicated that the expansion of higher education in the UK has been an important positive influence on productivity growth, and, more broadly, that high-level cognitive skills are an important source of growth in developed countries such as the UK. We therefore examine how levels of skills supply and utilisation in the UK currently compare with those found in other developed countries. In doing so, we look at measures of educational participation and qualifications, at internationally-standardised test scores and also at broader measures of human capital which account for training investments and other forms of uncertified skill.
25

1.7.1 Educational participation and qualifications The OECD ranks countries according to the shares of the 25-64 year old population with low-level skills (below upper secondary education), intermediate level skills (upper secondary) and high-level skills (tertiary). In 2006, the UK was ranked 17th of 30 OECD countries for low skills, 18th for intermediate skills and 12th for high skills (UKCES, 2009). In 2012, of 34 OECD countries, the UK was ranked 19th for low skills, 24th for intermediate skills, and 11th for high skills (UKCES, 2014). Some 26 per cent of 25-64 year olds held low-level skills in 2012, whilst 37 per cent held intermediate-level skills and 38 per cent held high-level skills.
The UK thus performs relatively well in terms of high skills. Indeed, the sharp rise in the share of the UK population with graduate level qualifications since the early 1990s has been a notable feature of the UK economy in recent years. However, the OECD rankings show that the supply of high-level skills is rising just as fast in many comparator economies. Compared to other countries, the UK’s position on intermediate skills is of more concern, both because the share of workers with such qualifications is low by international standards, but also because the OECD rankings suggest that the UK has fallen further behind other countries on this measure in recent times.
1.7.2. Internationally-standardised measures of cognitive skills Further indications of the UK’s position are provided by internationally-standardised measures of cognitive skills.
In the 2012 PISA assessment of 15-year-olds, students in the United Kingdom scored only at the OECD average in mathematics and reading, and slightly above average in science (OECD, 2014). Mean performance on each of these three measures had not changed since 2006 and 2009.
In the 2012 PIAAC survey of adult skills, however, numerical proficiency in England and Northern Ireland was significantly below the OECD average, while proficiency in literacy and in ICT-related problem-solving were both close to the average (OECD, 2013: Figure 2.13). In all three areas, younger people in the UK (those aged 16-24) were found to be less proficient than older adults, such that levels of proficiency among younger people in the UK were among the lowest of all countries. When put together with the recent expansion of tertiary education, this suggests a clear polarisation in attainment among young people in the UK.
1.7.3 Evidence on skill demand and skill utilisation Skill attainments are, of course, important in creating the potential for greater productivity within the economy, but in order for this potential to be fulfilled, the skills possessed by individual workers must also be efficiently utilised. Despite the expansion of tertiary education in the UK, evidence from PIAAC indicates a relatively low demand for educational qualifications by UK employers (OECD, 2013). Estimates from PIAAC indicate that only a third of jobs in England and Northern Ireland require tertiary qualifications, placing England and Northern Ireland 16th out of 22 OECD countries on this particular measure (ibid., p.168).
26

The same survey indicates that around 30 per cent of workers in England and Northern Ireland possess a qualification which exceeds the level required for someone to be recruited to their job, with this being the second highest figure out of 22 OCED countries, exceeded only by Japan (ibid., p.171). This comparative finding reflects the trend towards increasing over-qualification in Britain as a whole between 1986 and 2006, which was only reversed slightly between 2006 and 2012 (Felstead et al., 2013).
As yet, there is not a clear understanding of the extent to which cross-country differences in skill utilisation can be explained by institutional features of the labour market. In her review of the evidence, Quintini (2011: 23-28) suggests that institutional factors - such as the amount spent on education and training, the strength of employment protection, the degree of co-ordination in wage bargaining, and the use of active labour market policies - can all affect the level of matching efficiency in the economy, but that broader factors affecting the supply of, and demand for, skills are the more important cause of high mismatch rates. This suggests that measures to increase employers’ demand for the increasing numbers of degree-qualified workers is a key priority for the UK going forward.
1.7.4 Future trends in education levels Forecasts of future education levels in the UK and other OECD countries suggest mixed fortunes for the UK in the medium-term (Bosworth, 2014). The proportion of the population qualified at intermediate level (upper secondary) is projected to decline slightly (from 37 per cent to 34 per cent) in the period to 2020 which, together with changes in other countries, is forecast to result in a decline in the UK’s ranking from 24th to 28th out of 33 OECD nations. Conversely, the proportion of the UK’s adult population qualified at the higher (tertiary) level is projected to increase from 37 per cent to 48 per cent, improving the UK’s international ranking from 11th to 7th (overtaking Finland, Norway, the United States and Australia). These forecast trends suggest that some emphasis must be placed in the coming years on raising investments in intermediate skills. They also further emphasise the importance of raising employers’ demand for (and utilisation of) high level skills.
1.7.5 Economy-wide measures of human capital The foregoing evidence suggests that the UK performs relatively well at some attainment levels, and less well at others, but gives no general overview of the quality of the labour force. Such a view is provided by those who have developed labour quality indices for the purposes of growth accounting or econometric analysis.
Mason et al. (2014) present data for the UK and five other European countries showing the absolute levels and growth rates of a quality-adjusted skill index for the period 1980-2007 (see Figure 5).13 Germany has the highest level of labour quality throughout this period. However, its lead narrowed greatly as a result of more rapid growth in certified qualifications in the other countries (especially in the UK) in this period. The UK performs
13 The index is derived from the quantity of labour inputs at each of five qualification levels, weighted by a factor proportional to the average wage premium of workers with a given qualification level over workers with no qualifications. The baseline is a notional country in which all workers are in the lowest of the five qualification groups (giving an index value of 1.0).
27

particularly strongly in Mason et al.’s analysis, rising from the fifth-best performer in 1980 to the second-best in 2007.
Figure 1.5: Growth in labour-quality indices, 1980-2007
Source: Mason et al. (2014: Figure 3).
Kang et al. (2012) extend this approach through to 2009 and show that growth in labour quality in the UK exceeded that seen in Germany, France, Denmark and Sweden over the period 2002-2009, and matched that seen in the Netherlands over the same period. They also develop an expanded measure of human capital growth, which takes account of growth in training capital, and show that the UK posted higher growth on this measure than almost any other EU country over the period 2002-2007 (though again on a par with the Netherlands).
Such approaches build on measures of qualifications attainments by also factoring in the relative productivity of employees in different qualification groups (as proxied by their wage). This arguably provides a more general picture of the human capital that resides among the workforce. Others have gone further, however, by considering the productive potential of everyone in the labour market. Fraumeni and Liu (2015) provide an overview of the methodology and some initial results. The method involves computing each person’s discounted lifetime income as a function of their age, likely educational attainment and likely earnings, and then computing the sum of the total potential future earnings of everyone in the labour market. The results place Britain second only to the US in the 18 countries included in Fraumeni and Liu’s analysis, and above France, Denmark and the Netherlands (Sweden and Germany are not included). The results therefore indicate that the British workforce have significant potential for productive activity if they can be suitably employed.
1.7.6 Summary To summarise, the overall picture suggests that other developed countries are outperforming the UK on a number of measures of skills, particularly at intermediate level.
28

However, growth in high-level skills has been strong, and monetised estimates of the total stock of human capital (e.g. Fraumeni and Liu (2015) put the UK in a relatively strong position with respect to its competitors). As regards the future, much would seem to depend on whether the UK can raise its investments in intermediate skills and, perhaps most importantly, whether it can address the relatively weak levels of demand among employers for its expanding stock of high-level skills.
1.8. Next steps
The foregoing review has shown that there is considerable evidence in support of the role of education and skills in raising productivity. A number of empirical studies have been cited which use growth accounting to show that up-skilling made a positive contribution to labour productivity growth in the UK in the years leading up to the crisis. Econometric studies, both for the UK and other countries, also give insights into the mechanisms by which education and skills can raise growth, either in the short or long term. In the next part of the study, we go on to expand the evidence in both of these respects. In the following sections we produce new descriptive analysis covering more recent developments, and new growth accounting estimates of the contribution of labour quality to productivity growth in the UK in the years since the crisis. This considers different sub-periods to investigate whether the role of skills has changed as a consequence of the recession and we compare the experience of the UK with that of other major global economies. In later sections, we also conduct econometric analyses at industry-level to further examine the role of skills in raising productivity. A particular focus of our econometric analyses is the interactions between labour force skills and intangible assets: something which has been little explored in the literature to date.
2. Descriptive Analysis 2.1. Analysis of Trends
The objective of this section is to provide an overview of aggregate productivity developments in the UK relative to countries covered in the analytical sections of this report, namely the United States, France, Germany, Netherlands, Finland and Sweden. We do so for different sub-periods ranging from 1995 to 2013. Wherever possible, the main results emerging from this part of the analysis will be related to existing evidence previously covered in section 1. The productivity analysis in this section draws mainly from the Conference Board Total Economy's Database, which contains recent productivity figures. We also provide evidence of recent changes in employment shares across different skill groups, using the most recent estimates from the UK Labour Force Survey, the European Labour Force Survey14 (EU countries) and the Current Population Survey (for the US). In addition we provide an overview of how earnings have evolved. All of the results
14 We are grateful to Eurostat for granting us access to the micro-data files of European Labour Force Survey and the Structure of Earnings Survey. All results and conclusions are the authors' and do not necessarily reflect the views of Eurostat.
29

presented in this section are based on the authors’ original calculations using available data sources.
2.1.1 Recent aggregate productivity trends Figure 2.1 illustrates the trends in labour productivity when measured as GDP per hour worked (see Appendix figure A.2.1 and Table A.2.1 for comparable trends in terms of GDP per person employed). Our analysis focuses on GDP per hour worked as this measure is considered a more accurate indicator of productivity developments over the cycle. It accounts for actual hours worked, which can be more easily adjusted than the number of persons employed. Table 2.1 contains details of the underlying growth rates of the different sub-periods considered. During the period 1995 to 2007 labour productivity in the UK increased steadily, with annual growth rates of 2.5%. The period spanning from the mid-1990s to the mid-2000s was characterised by a worldwide surge in adoption and diffusion of information and communication technologies (ICTs), and productivity grew in many countries. Compared to its competitors the UK achieved relatively high labour productivity growth during the period 1995-2002 (2.5% per annum in terms of GDP per hour worked); this was slightly higher than in the US (2.4%). During the period 2003-2007 labour productivity continued to experience similarly rapid growth (2.5%), outpacing that in the US (1.6%). Only Finland and Sweden grew at higher rates (2.6% and 2.8% respectively). In the aftermath of the financial crisis, labour productivity in the UK fell significantly, declining, on average, by -0.8% over the period 2008-2010. The majority of other EU countries also suffered a fall in labour productivity levels, but the decline in UK productivity was more marked. France and Germany experienced decreases in GDP per hour worked of -0.2% and -0.3%, respectively. In the Netherlands and Sweden, productivity growth rates were -0.1%. The idea that the existence of a 'productivity puzzle' is not a UK-specific phenomenon has been gaining support (Bank of England, 2014). The US performance is the most remarkable as labour productivity growth continued to be strong (1.7% on average). This is consistent with the majority of existing evidence which highlights the strength of US recovery after the initial productivity slump (Foster et al., 2013). Despite the productivity slowdown being felt across the majority of the developed world, the UK seems to have fared worse than most EU countries in terms of productivity growth. Figure 2.2 illustrates levels of labour productivity of EU countries relative to the US, highlighting the main convergence and divergence patterns15. It has been widely reported that the US productivity lead was amplified thanks to its greater ability to invest and reap the benefits of the new information technologies. While selected EU countries’ productivity showed signs of catching up to the US levels in the pre-crisis years, the position of EU countries has worsened since that time. However, the trends differ by country.
Figure 2.2 illustrates labour productivity levels relative to the US. Of the EU countries considered here, the Netherlands has the highest level of labour productivity; in fact, at the beginning of the sample period, the level of labour productivity in the Netherlands was above that in the US. Of the remaining EU countries, France had the highest labour productivity level at the beginning of the period that we are analysing, followed by Germany, the UK and Sweden. UK productivity growth in the years leading up to the crisis
15 The present analysis is based on The Conference Board Total Economy Database (TED), which includes very recent information on determinants of growth for a large number of economies.
30
was exceptional, and consequently the productivity gap relative to the United States, France, and Germany narrowed. Sweden and Finland also experienced strong growth during this period. At the onset of the financial and economic crisis the productivity gap between the UK and some major EU countries, in particular France and Germany, started to widen again. In common with the UK, labour productivity in Germany also remains below its level at the beginning of the crisis although it has started to catch up to its pre-crisis growth path. The weakness in German productivity can be accounted for by unusually strong employment performance. The United States and France are at or above their pre-crisis productivity levels. In this section we have described the main UK productivity trends for the UK relative to the other countries in our study. UK productivity performance was strong in the mid-1990s and early 2000s. The UK achieved higher growth rates than the rest of the countries analysed. This was attributed to the diffusion of ICTs and TFP gains outside the ICT production sector itself, mainly market service sectors. This exceptional productivity performance helped in narrowing the productivity gap relative to other leading economies. Since the start of the financial crisis, however, UK productivity fell significantly and has fared worse than many of these countries. As a consequence, the gap in terms of productivity levels with respect to countries such as United States, France and Germany is widening again. This is despite the fact that productivity growth in the European countries was also adversely affected by the economic downturn.
31

Figure 2.1 Labour productivity levels (GDP per hour), 1995-2013.
Source: The Conference Board Total Economy Database (Updated Jan 2014).
32

Table 2.1 GDP per hour, Average growth rates by sub-period, 1995-2013.
1995-2002
2002-2007
2007-2010
2010-2013
United Kingdom 2.5% 2.5% -0.8% -0.2% France 2.0% 1.2% -0.2% 0.6% Germany 1.8% 1.6% -0.3% 0.9% Netherlands 1.4% 2.0% -0.1% -0.5% Sweden 2.5% 2.6% -0.1% 1.2% Finland 2.4% 2.8% -1.1% 0.6% United States 2.4% 1.6% 1.7% 0.8%
Source: The Conference Board Total Economy Database (Updated Jan 2014); own calculations.
Figure 2.2. GDP per hour worked relative to US, 1995-2013.
Source: The Conference Board Total Economy Database (Updated Jan 2014); own calculations.
33

The weakness of UK labour productivity since the onset of the recession is closely linked to the strong performance of the labour market. In the aftermath of a recession, labour productivity usually declines, as the labour market does not adjust immediately after production is cut. During the 2008-2009 recession, however, UK firms cut employment even less than might have been expected, given the depth of the economic contraction and developments in other advanced countries (Hughes and Saleheen, 2012); moreover, firms began hiring again when the economy started to recover. Several years on, employment growth remains relatively strong and productivity persistently weak.
Many explanations have been put forward to explain the most favourable outcomes observed in the UK’s labour market during the first stages of the downturn (Dolphin and Hatfield, 2015), amongst them the high costs of shedding and hiring labour faced by firms, and the retention of workers employed in alternative activities such as the creation of intangibles (Goodridge et al., 2014)
Labour hoarding, along with the shift in the capital-labour ratio driven by a decline in real wages, is one of the main demand-side explanations for the fall in UK productivity during the recession. It has been argued that labour hoarding in the UK was also encouraged by several policy initiatives such as employment subsidies and the car scrappage scheme (Dolphin and Hatfield, 2015).
The case of Germany is another example of a mild response of the labour market to the economic crisis. Germany experienced almost no increase in unemployment during the 2008-2009 recession, and the labour market adjusted via reduction in working hours per employee and not via reduction in the number of employees. The large degree of internal flexibility, favoured for earlier structural reforms, undoubtedly played a significant role (Rinne and Zimmerman, 2011). One of the main instruments that allowed firms to retain their qualified workforce despite the severity of the recession was the introduction of government-subsidised short-time work contracts.
2.1.2 Skill groups The four skill groups considered in the report are based on the 1997 International Standard Classification of Education (ISCED97) and are defined as follows:
• Higher (bachelor degree and above: ISCED level 5A and 6).
• Upper-intermediate (ISCED levels 4, 5B).
• Lower-intermediate (both vocational and general: ISCED levels 3A and 3B).
• Low-skilled (ISCED levels 3C, 2 or lower).
See box below for details on the types of qualifications included in each of the groups. The division between the higher and upper-intermediate groups corresponds to the boundary
34

between long-cycle (theory-based programmes with a minimum duration of three years (full-time)) and short-cycle higher education (programmes of typically shorter duration focused on practical, technical and occupational skills16); see Mason et al. ( 2014). Information to support this particular grouping of qualifications was derived from CEDEFOP Country Reports showing how qualifications in each of the seven countries are allocated to different levels on the ISCED scale17. We also drew on summary files prepared by UNESCO for additional information on programme orientation (i.e., whether they are general or vocational in nature)18.
16 Tertiary-type A programmes (ISCED 5A) are largely theory-based and are designed to provide sufficient qualifications for entry to advanced research programmes and professions with high-skill requirements, such as medicine, dentistry or architecture. Tertiary-type A programmes have a minimum cumulative theoretical duration (at tertiary level) of three years’ full-time equivalent, although they typically last four or more years’ (OECD, 2002, p. 375). Tertiary-type B programmes (ISCED 5B) are typically shorter than those of tertiary-type A and focus on practical, technical or occupational skills for direct entry into the labour market, although some theoretical foundations may be covered in the respective programmes. They have a minimum duration of two years (full-time equivalent), at the tertiary level’ (OECD, 2002, p. 376). 17 CEDEFOP (2009): United Kingdom. VET in Europe – Country Report 2009, ReferNet United Kingdom; France. VET in Europe – Country Report 2009, ReferNet France; Germany. VET in Europe – Country Report 2009, ReferNet Germany; Spain. VET in Europe – Country Report 2009, ReferNet Spain; Netherlands. VET in Europe – Country Report 2009, Karel Visser (ECBO, Netherlands); Denmark. VET in Europe – Country Report 2009; ReferNet Denmark; Vocational education and training in Sweden: short description, Cedefop Panorama series 180. 18 The weblinks for these UNESCO files are:
http://circa.europa.eu/Public/irc/dsis/edtcs/library?l=/public/unesco_collection/programmes_isced97&vm=detailed&sb=Title; http://circa.europa.eu/Public/irc/dsis/edtcs/library?l=/public/unesco_collection/programmes_isced97/uoe2008_iscmap_databasex/_EN_1.0_&a=d
35

Notes on the 1997 ISCED classification19 of education: [Derived from OECD, Education at a Glance, 2002, Glossary]
ISCED 6: ‘Advanced research programmes: Programmes that lead directly to the award of an advanced research qualification, e.g. Ph.D. The theoretical duration of these programmes is three years, full-time, in most countries (for a cumulative total of at least seven years full-time equivalent at the tertiary level), although the actual enrolment time is typically longer. Programmes are devoted to advanced study and original research’.
ISCED 5A: ‘Tertiary-type A programmes [which] are largely theory-based and are designed to provide sufficient qualifications for entry to advanced research programmes and professions with high skill requirements, such as medicine, dentistry or architecture. They have a minimum cumulative theoretical duration (at tertiary level) of three years’ full-time equivalent, although they typically last four or more years’.
ISCED 5B: ‘Tertiary-type B programmes [which] are typically shorter than those of tertiary-type A and focus on practical, technical or occupational skills for direct entry into the labour market, although some theoretical foundations may be covered in the respective programmes. They have a minimum duration of two years full-time equivalent at the tertiary level’.
ISCED 4: ‘Post-secondary non-tertiary education straddles the boundary between upper secondary and post-secondary education from an international point of view, even though it might clearly be considered upper secondary or post-secondary programmes in a national context. Although their content may not be significantly more advanced than upper secondary programmes, they serve to broaden the knowledge of participants who have already gained an upper secondary qualification. The students tend to be older than those enrolled at the upper secondary level’.
ISCED 3: ‘Upper secondary education corresponds to the final stage of secondary education in most OECD countries. The entrance age to this level is typically 15 or 16 years. The typical duration of ISCED 3 programmes …. typically [ranges] from two to five years of schooling. ISCED 3 may either be “terminal” (i.e., preparing the students for entry directly into working life) and/or “preparatory” (i.e., preparing students for tertiary education)’. ISCED 3A and 3B programmes can enable direct access to tertiary education courses (ISCED 5) if students do not enter the labour market and typically signify a higher level of attainment than ISCED 3C programmes which do not enable access to tertiary education.
ISCED 2: ‘Lower secondary education Completes provision of basic education, usually in a more subject-oriented way with more specialist teachers. Entry follows six years of primary education; duration is three years. In some countries, the end of this level marks the end of compulsory education’.
ISCED 1: ‘Designed to provide a sound basic education in reading, writing and mathematics and a basic understanding of some other subjects’.
19 The ISCED 2011 classification is only available from 2014 onwards in the EU LFS. It is based on the following categories: 0 Early childhood, 1 Primary education 2 Lower secondary education 3 Upper secondary education 4 Post-secondary non-tertiary education 5 Short-cycle tertiary education 6 Bachelor or equivalent 7 Master or equivalent 8 Doctoral or equivalent.
36

ISCED 0: ‘The first stage of organised instruction designed to introduce very young children to the school atmosphere’.
UNESCO summary files for the US show a less detailed allocation to ISCED levels20 than we have had available for European countries. Thus, whilst it is possible to differentiate between lower intermediate general education and lower intermediate vocational education with EU data, this is no longer practical once the US is included; therefore the two lower intermediate groups are collapsed together into one 'Lower intermediate' group. For the UK only, we are able to present growth accounting estimates for both lower-intermediate general and lower-intermediate vocational groups. Making use of US Census Bureau estimates of enrolments at different levels in 2009 21 and estimates derived from the US Current Population Survey, we have allocated US qualifications in the manner shown in Table 2.2 below.
20 http://www.uis.unesco.org/Education/ISCEDMappings/Pages/default.aspx 21 Ryan S. and Siebens, J. (2012), Educational attainments in the United States: 2009, Current Population Reports, Washington, DC: US Census Bureau. Available at: http://www.census.gov/prod/2012pubs/p20-566.pdf
37

Table 2.2: Allocation of US qualifications to four qualification groups.
Education attainment UNESCO allocation to ISCED level
NIESR allocation to qualification group
Comments
Did not graduate from High School
2 Low-skilled
High School graduate 3 Lower intermediate
‘Some college, no degree’
[includes those shown by the US Census Bureau as holding vocational certificates below Associates degree level from college attendance after graduating from High School]
4 50% lower intermediate; 50% upper intermediate
US Census Bureau estimates for 2009 show approximately 70% of individuals aged over 25 in this category holding vocational certificates (below Associates degree level) from 1-2 years attendance at college. The remaining 30% are shown as holding vocational certificates from 12 months or less attendance at college.
An unknown proportion of individuals in the ‘Some college, no degree category’ may not have acquired formal qualifications of any kind.
Earnings estimates derived from the US Current Population Survey suggest that, on average, gross hourly earnings for individuals in the ‘Some college, no degree category’ are closer to those of High School graduates than the earnings of Associates degree holders.
Taking all this information into account, we choose as a rough approximation to allocate half of persons in the ‘Some college, no degree category’ to the lower intermediate group and half to the lower intermediate group.
Associate's Degrees 5 Upper intermediate
Associate degrees are clearly more comparable to short-cycle higher education qualifications in European higher education systems than they are to Bachelor degrees
Bachelor's Degrees and Higher Degrees
5 & 6 Higher Bachelor degrees clearly equate to ISCED 5A
Own elaboration based on Mason et al. (2014)
In European countries, the bulk of upper intermediate education is vocational or occupation-specific in nature. The same is not true at lower intermediate level, where there is a clear split between general and vocational education. Mason et al. (2014) then
38

distinguish between lower-intermediate vocational and lower intermediate-general qualifications but, as noted above, we aggregate these two qualifications into one group - "lower intermediate" - in order to ensure consistency when comparing with the US education levels. Table 2.3 (adapted from Mason et al. 2014) shows the different UK qualifications included in the four skill groups considered in the report. Table 2.3. Classification of qualifications as listed in labour force surveys (based on ISCED 97), United Kingdom.
Qualification group ISCED97 level UK qualifications
Higher 5A,6 e.g. Bachelor degree, PhD, NVQ5
Upper intermediate 4,5B e.g. NVQ4, diploma in higher education, other teaching qualifications below degree level.
Lower intermediate 3A,3B
General (3A): e.g. A-level or equivalent, AS level or equivalent, international baccalaureate, Welsh baccalaureate, access qualifications.
Vocational (3B): e.g. NQV3, trade apprenticeships, City & guilds advanced craft level 3 Diploma, Level 3 Certificate.
Low-skilled 3C, 2 or lower
e.g. NVQ1, NVQ2, City & guilds part 1 and 2,GCSE below C.
O-level, GCSE grade A*-C, or equivalent.
No qualifications.
Adapted from Mason et al. (2014)
39

2.1.3 Trends in aggregate employment by skill group In this section we describe changes in employment shares by skill group for the overall UK economy, compared to the other benchmark countries. We also compare these trends with those observed in the US. The UK employment shares are constructed using the information contained in the micro-files of the UK Labour Force Survey. The EU countries employment shares are based on the European Labour Force Survey micro-files, and the US employment shares are derived using information from the Current Population Survey. We divide the total workforce into four groups22, and calculate the shares accrued by each of the groups, separately by country and time period. Figures 2.3-2.8 illustrate the employment shares of the different skill groups in three different sub-periods for the UK and EU countries. For the UK we report annual employment shares, whilst for the remaining of countries we report estimates for three sub-periods: 2001-2007, 2008-2010, and 2011-2013 (the sub-periods are slightly different in the case of Finland, Sweden and Germany for which data availability is more limited). Appendix tables A.2.2 and A.2.3 show the shares for each year from 2002 to 2013. The analysis focuses on the period from 2001 onwards, as the detailed skill classification was not always available prior to 2001. During the early 2000s, using population-weighted figures, the share of employment with at least a bachelor degree was just above 20% in the UK (see Figure 2.3). This percentage was higher than that in France and Germany (both around 16%), and Finland (around 19%) and similar to that in Sweden; this percentage was however smaller than in the Netherlands (26%).
In the UK the proportion of highly-skilled workers continued to rise throughout the period analysed, and in 2013 stood at just below 35%. The high-skilled share of employment also rose in each of the other countries under consideration, but less rapidly than in the UK. During 2011 and 2013, the share of workers with a high-level academic qualification in France and Germany rose to 18% and 21% respectively. In Finland the proportion increased from 19% to 27% and in the Netherlands it rose from 26 to 31%.
The percentage of employment in the UK with an upper-intermediate vocational qualification (ISCED 4 or 5B) did not change dramatically during the period analysed, fluctuating just above 10% of the total workforce. In France the percentage was higher at 12% during the period 2001-2007 and has increased to 14% since 2007. In Germany this share was higher than that in the UK at 17% and increased to 20% during 2011-2013. The share for this group is smaller in the Netherlands, however, standing at 6% in 2001-2007 and decreasing thereafter to only 4% in the period 2011-13.
The proportion of the UK's workforce with a lower-intermediate qualification (ISCED 3A, 3B) is around 25% and this has not changed greatly over time. The share is considerably higher in Germany, where more than half of workers held this type of qualifications in the earlier period - although it has since fallen slightly to just below 50%.
22 We had to exclude from the survey those individuals that reported qualifications in the ISCED levels 5 (without distinction of a, b, or c) and aggregate skill level 4-5 together. The number of observations excluded was below 5% of total observations, in all countries.
40

The group is smaller in France than both in the UK and Germany, although it has slightly increased its size - from 15% to 17%. Finland is the country where the share of this group in the total workforce is most similar to that in Germany: the proportion of workers with lower-intermediate qualification is just below 50%.
The proportion of the UK's workforce that have low or no qualifications (ISCED 3C, 2 or lower) was around 43% during the early 2000s. The low-skilled labour share has decreased significantly (by over 10 percentage points) and in 2013 stood at around 30%. The proportion of France's workforce with no qualifications is higher than in the UK, but has also reduced over time. In Germany the employment share of persons with low or no qualifications is considerably lower, and has declined since the crisis, from 16% in 2001-2007 to 14% in 2011-2013. Sweden and the Netherlands have relatively high shares in this group but both show declining trends in low-skilled employment similar to other countries.
Figure 2.3. Employment shares by skill group, 2001-2013, UK Labour Force Survey Quarterly files (October to December quarter).
0
5
10
15
20
25
30
35
40
45
2001 2002 2003 2004 2005 2006 2007 2008 2009 2010 2011 2012 2013
%
High Upper-intermediate Lower-intermediate Low
Source: UK LFS
41

Figure 2.4. Employment shares by skill group, France, 2001-2013.
Source: EU LFS
Figure 2.5. Employment shares by skill group, Germany, 2001-2013.
Source: EU LFS
42

Figure 2.6. Employment shares by skill group, Finland, 2001-2013.
Source: EU LFS
Figure 2.7. Employment shares by skill group, Netherlands, 2001-2013.
Source: EU LFS
43

Figure 2.8. Employment shares by skill group, Sweden, 2006-2013.
Source: EU LFS
Table 2.4 below shows the percentage of the US workforce in different qualification groups23. The percentage of workers with a bachelor degree (or higher) in the US has increased since the mid 1990s. The proportion of the workforce with a “bachelor degree” went up from 18% in 1995-2002 to 22% in 2011-2014. Combined with those with “higher degrees”, the high-skilled share of the workforce is similar to that in the UK by the end of the period. Thus the UK appears to have caught up with the US in qualifications at level 5A and 6. The incidence of “associate degrees” has risen over time, although the incidence of those with “some college” studies (but without a degree) has fallen. The percentage of those with lower-level qualifications such as "high school graduate" or those that “did not graduate from high school” also decreased, consistent with the trends observed in Europe.
23 These groups have been collapsed into four for the growth accounting analysis, to ensure comparability with the European countries.
44

Table 2.4 Employment shares by qualification group in the US- Percentages (%), 1995-2014.
Qualification Skill group 1995-
2002 2003-2007
2008-2010
2011-2014
Higher degrees Higher 8.9 10.1 11.2 12.1
Bachelor degrees Higher 18.2 19.9 21.4 22.3
Associate degrees Upper int. 8.4 9.3 9.9 10.5
Some college but no degree Upper/Lower Int.
20.3 19.5 19.3 19.0
High school graduate Lower int. 31.5 29.7 28.4 27.2 Did not graduate from high school
Low skilled 12.7 11.6 9.9 8.9
TOTAL 100.0 100.0 100.0 100.0 Source: US Current Population Survey, own calculations.
2.1.4 Wages The skill groups identified above also vary in terms of the wages they are paid. This is an important element to consider when computing changes in labour composition as discussed below. Figure 2.9 illustrates the differences in average earnings between the different skill groups in the UK for the period 2001-2013, not controlling for other factors. Equivalent information for the Continental European countries between 2002-1024 and the US between 2002-13 is shown in Appendix figures A.2.2-A.2.7. The source of information on wages for the UK is the Quarterly Labour Force Survey, for the US it is the Current Population Survey, and for the Continental European countries, it is the Structure of Earnings Survey. For Germany, we also use information from the German Socio-Economic Panel, in combination with the Structure of Earnings Survey. Unsurprisingly, average earnings increase with the level of academic attainment in all the countries considered. For the UK, figure 2.9 reveals that average gross hourly earnings for high-skilled employment experienced positive growth up to 2009 in the UK. Since then wages have remained largely stagnant. A similar pattern is also observed across qualification groups. We look now at the differences in earnings amongst the different skill groups, which is relevant for the calculation of labour composition. At the beginning of the period considered, say in 2002, the graduate premium (high skill to low skill wage ratio) was just over 2 in the UK. This ratio was higher than in Finland, Netherlands and Sweden, although lower than in France (2.4), Germany (2.5), and the US (2.7). Over time, the ratio between the wages of the high-skilled and the wages of the low-skilled has decreased gradually in the UK. Based on detailed figures for annual average gross hourly earnings (presented in Appendix tables A.2.4 and A.2.5), the ratio was 2.09 in 2002
24 2002 is the first year for which we have available data for Continental European countries.
45

(£15.12/£7.24), 1.97 in 2009 (£17.96/£9.12) and 1.90 in 2013 (£18.06/£9.51). See Table 2.5. For the latter part of this period, these estimates are consistent with evidence from Blundell et al. (2014) that between 2009 and 2012 average real hourly wages fell more among individuals at the top of the income distribution than among individuals in the middle and at the bottom of the distribution, while in previous recessions wages continued to grow faster for individuals at the top of the distribution. Blundell et al. argue that one possible explanation may be the falling employment share of the financial industry and the general slowdown of wage growth in this sector. The fact that wages at the bottom of the distribution decreased less can also be linked to the introduction of the minimum wage in 1999. Their analysis is based on a range of individual-level data sources, such as the Labour Force Survey, the New Earnings Survey Panel Dataset, the English Longitudinal Survey of Aging, and the Family Expenditure Survey. Blundell et al. overall do not find strong evidence that the decline in productivity and real wages has been driven by labour composition effects, but rather by declines in wages of existing workers. These are now more willing to work at any given wage given the increased labour supply and greater competition for jobs, compared to past recessions.
Table 2.5 shows the evolution of the high-skilled to low-skilled wage ratios in all seven countries under consideration (underlying data are available in Appendix table A.2.5). The pay premium to the highest skilled in the US is around 2.7 and has not varied greatly over time; this is higher than in the majority of European countries, which is affected by the fact that some workers classified as low intermediate in the US might be regarded as low skilled in European countries. The exception is Germany, where the wage premium to the high skilled has increased over time, from 2.5 in 2002 to 2.75 in 2009. In the US, wages have remained fairly static for both the high and low groups while declining for the intermediate groups. Between 2002 and 2010 the high-skilled to low-skilled wage ratio remained relatively stable in the Netherlands, as in the US. By contrast this ratio declined gradually over this period by an estimated 7% in the UK and 11% in Finland and more steeply by 23% in France and 27% in Sweden. For the UK and US we have wage data up till 2013 which show that the high-skilled to low-skilled wage ratio in the UK continued to decline slightly relative to the equivalent US ratio between 2010 and 2013 (Table 2.5).
46

Figure 2.9. Average hourly earnings in the UK, by skill group, UK Labour Force Survey Quarterly files (October to December quarter).
Source: UK LFS
Table 2.5. Ratios of high-skilled to low-skilled average gross hourly earnings, 2002-10 (Continental European countries), 2002-2009 (Germany), 2002-13 (UK and US).
Finland France Germany Netherlands Sweden UK United States
2002 1.62 2.37 2.49 1.94 1.77 2.09 2.70 2003 1.61 2.21 2.49 1.94 1.66 2.12 2.66 2004 1.59 2.07 2.67 1.94 1.55 2.03 2.70 2005 1.58 1.94 2.55 1.94 1.44 1.96 2.72 2006 1.56 1.81 2.67 1.93 1.34 1.99 2.69 2007 1.53 1.81 2.63 1.95 1.34 1.94 2.68 2008 1.50 1.81 2.67 1.96 1.33 1.90 2.66 2009 1.48 1.81 2.75 1.98 1.33 1.97 2.62 2010 1.45 1.82 - 1.99 1.32 1.94 2.70 2011 - - - - - 1.91 2.64 2012 - - - - - 1.91 2.67
47

2013 - - - - - 1.90 2.68 % change 2002-1025
-11 -23 10 2 -25 -7 0
% change 2002-13
-9 -1
Sources: UK: Quarterly Labour Force Survey; US: Current Population Survey; Continental European countries: Structure of Earnings Survey (plus German Socio-Economic Panel); German data only available up to 2009.
2.2. Overview of Data Sources
Data sources for whole-economy analysis
The economy-level productivity analysis is based on four main data sources. The principal source is the Conference Board Total Economy Database (TED). In addition to providing us with information on recent productivity trends (e.g. GDP per hour, GDP per person), this database contains a detailed breakdown of the determinants of output growth. The TED database has been used to compile information on total GDP growth and a number of other growth accounting variables. It has the advantage of providing data for a large number of countries and for a large number of years up to 201326. To implement the growth accounting exercise (discussed in more detail in Section 3) we extracted information on variables such as growth in output, growth in employment, growth in hours, growth in ICT capital, and non-ICT capital, nominal output and labour's share in value-added. The second data main source we use for the growth accounting analysis is the European Labour Force Survey (EU LFS)27. The European Labour Force Survey provides harmonised information on labour market developments in European countries since the mid 1980s. We use EU LFS data on employment by skill category in order to compute our own labour composition term28. The skill categories are compiled using annual data from the EU LFS variable HATLEVEL ("highest level of qualification attained"). We also use the EU LFS to obtain information on training received by employees. The third data source is the Structure of Earnings Survey, also compiled by Eurostat29. The objective of the Structure of Earnings Survey is to provide accurate and harmonised data on earnings in EU Member States. The SES is a large, enterprise-level sample survey providing detailed and comparable information on the relationships between the level of remuneration and individual characteristics of employees (sex, age, occupation, length of service, highest educational level attained etc.) and the characteristics of their employer (economic activity, size and location of the enterprise). More information is available in the documentation provided by Eurostat30. One drawback of the SES data is that it does not cover small firms with fewer than 10 employees; it also excludes public administration (as defined by the NACE classification of economic activities).
25 Change 2002-2009 in the case of Germany. 26 Data for TED 2014 is publicly available since April 2015. 27 The EULFS anonymised microdata (scientific-use files) were sent to us via CD-ROM. 28 The EULFS is a richer database than currently used by the Conference Board. 29 The SES anonymised microdata (scientific-use files) were sent to us via CD-ROM. 30 http://ec.europa.eu/eurostat/web/microdata/structure_of_earnings_survey
48

The four-yearly SES micro-data sets are available for the reference years 2002, 2006 and 201031. Earnings is measured as the mean "gross hourly wage"32. The main drawback of using the SES for the purpose of this research is the lack of time series variation. In order to overcome this problem we interpolated and extrapolated the series to derive information that would cover the whole period 2002-2013. For those years in between 2002 and 2006, and 2006 and 2010, we applied a linear interpolation calculation. Finally, for the US, we compile estimates of hours worked by skill group from the Current Population Survey (CPS), made available by the Bureau of Labor Statistics. The CPS is also used to derive earnings by skill group for the US. Data issues
One further limitation of the SES is that it provides limited information on earnings for Germany. DESTATIS (Germany) only gave their acceptance to include their SES data in the CD-ROM from reference year 2006 onwards and, even then, no information is available for some key qualification groups in 2006 and 2010. Accordingly, we compile information on wages for Germany from a different data source: the German Socio-Economic Panel (GSOEP)33. In respect of skill groups, there were specific difficulties for Sweden and Finland. For Sweden, the EU LFS did not provide any information on "highest level of qualification attained" before 2006. For Finland it only provided information from 2002 onwards. For these two countries, we therefore have a more limited time period. Data sources for the industry-level analysis
The industry-level econometric analysis draws mainly from the EUKLEMS database34, which provides industry-level data on value-added, and the use of different inputs, including capital investments and labour input. Section 4 provides further details on the construction of the variables.
The EU LFS and SES were also used to obtain employment and wage estimates for each skill group at industry level. We use information on industry sector at NACE 1-digit level. Up to 2008 the surveys followed the NACE Rev.1 classification, and after 2008 the NACE Rev.2. We follow Eurostat guidelines in establishing an accurate correspondence between the two classifications, so as to ensure consistency in the definition of industries over time. In addition, our industry-level econometric analysis uses information from the INTAN-INVEST platform35, which provides information on investment in different types of intangible investment at broad industry level up to 2010. This database covers assets related to economic competencies, computerised information and innovative property (Corrado et al., 2012).
31 The 2014 SES will not be released within the timeframe of the project. SES2014 is the next vintage of the earnings survey. The CD-ROM will only be available in spring of 2017. 32 Mean hourly gross earnings are defined as gross earnings in the reference month divided by the number of hours paid during the same period. 33 We use information from the German Socio Economic Panel for 2002, 2006, and 2009 for three skill groups (high, intermediate, and low-skilled) along with information from Structure of Earnings Survey for 2006, for four skill groups (high, upper-intermediate, lower-intermediate, low). 34 www.euklems.net 35 http://www.intan-invest.net
49

3. Growth Accounting Analysis
3.1. Methodology
The Growth Accounting (GA) technique allows us to decompose the growth rate of an economy's total output into changes in the amount of factors used (capital and labour), and a part that cannot be accounted for by observable changes in factor utilisation. The unexplained part of growth in GDP, known as total factor productivity, represents increases in output with the same amounts of inputs or the same output with less inputs. While often interpreted as a measure of broadly defined technological progress, the TFP component typically also captures the influence of other unmeasured influences on labour productivity, such as adjustment costs, scale and cyclical effects, omitted inputs, production inefficiencies, spillovers, and measurement error.
More formally, the growth in output can be expressed as the cost-share weighted growth of inputs plus TFP (note that all variables are expressed in log terms). ∆𝑦𝑦𝑐𝑐𝑐𝑐 = 𝛽𝛽𝑙𝑙𝑙𝑙𝑙𝑙,𝑐𝑐𝑐𝑐∆𝑙𝑙𝑐𝑐𝑐𝑐 + 𝛽𝛽𝑖𝑖𝑐𝑐𝑐𝑐,𝑐𝑐𝑐𝑐∆𝑖𝑖𝑖𝑖𝑖𝑖𝑖𝑖𝑐𝑐𝑐𝑐 + 𝛽𝛽𝑛𝑛𝑖𝑖𝑐𝑐𝑐𝑐,𝑐𝑐𝑐𝑐∆𝑛𝑛𝑖𝑖𝑖𝑖𝑖𝑖𝑖𝑖𝑐𝑐,𝑐𝑐 + ∆𝑇𝑇𝐹𝐹𝐹𝐹𝑐𝑐,𝑐𝑐 (3.1)
where ∆𝑦𝑦𝑐𝑐𝑐𝑐 is the growth rate of GDP in country c between year t and year t-1, ∆𝑖𝑖𝑖𝑖𝑖𝑖𝑖𝑖 denotes growth in ICT capital input over two consecutive periods t and t-1, ∆𝑛𝑛𝑖𝑖𝑖𝑖𝑖𝑖𝑖𝑖 denotes growth in non-ICT capital inputs, and ∆𝑙𝑙 denotes growth in labour input. Subscript c denotes country and subscript t denotes time36.
Turning to the betas, 𝛽𝛽𝐿𝐿𝐿𝐿𝐿𝐿𝑐𝑐𝑐𝑐 denotes the share of labour compensation in total value added; 𝛽𝛽𝑖𝑖𝑐𝑐𝑐𝑐 represents the share of ICT capital compensation in total value added; 𝛽𝛽𝑛𝑛𝑖𝑖𝑐𝑐𝑐𝑐 represents the share of non-ICT capital compensation in total value added.
The method relies on standard assumptions such as competitive output and factor markets which allow the calculation of shares in value added as this equals total cost. Typically constant returns to scale are also assumed, implying that the sum of the factor shares equals one; this has the advantage that capital’s share can be calculated as one minus labour’s share37.
The labour input term from expression (3.1) can then be decomposed into two additional terms: total hours worked and changes in labour composition (also known as labour quality), as in:
∆𝑙𝑙 = ∆ℎ + ∆𝐿𝐿𝐿𝐿
36 When implementing the growth accounting at industry level a subscript j can be added to this expression. 37 A standard neoclassical framework does not explicitly account for adjustment costs, variable factor utilisation, deviations from perfect competition and non-constant returns to scale.
50

The following section (Section 3.1.1) provides a more detailed description of the labour input term.
Equation (3.1) can also be expressed in terms of labour productivity. The total GDP growth in a country can be decomposed into the growth in hours and growth of labour productivity (measured as output per hour worked)38. Using this framework we are able to quantify the impact of: • Capital deepening; that is the amount of capital services available per unit of
labour employed. Importantly, we allow a distinction between ICT capital assets (∆ictk), which comprises computers, software and communication equipment; and non-ICT capital assets (∆nictk), which comprises assets such as machinery, transport equipment, residential buildings and infrastructure.
• changes in labour composition (∆LC); it captures the effect of changes in skill levels of workers (but more generally could be extended also to include changes in the age and gender structure of the workforce).
• total factor productivity growth; which is the part of labour productivity growth that is not attributable to measured input accumulation.
It is the second element (labour composition) which we are most interested in within the scope of this project.
3.1.1. Calculating the contribution of skills to growth The approach we follow to analyse the impact of human capital on productivity is to estimate flows of labour services from workers with different skill levels. The idea of adjusting for changes in the composition of the workforce is based on the notion that the hours worked by different groups of workers are likely to have different degrees of effectiveness. In this research the focus is on education level of workers as the key productivity-enhancing characteristic39.
38 Equation (3.1)* is derived by subtracting Δh from both sides of (3.1). Omitting the subscripts c,t for convenience, this gives:
TFPknictkictLChhhy nictictlablab ∆+∆+∆+∆+∆+∆−=∆−∆ bbbb This can be rewritten as :
TFPhhknicthhkictLChhhy nictnictictictlablab ∆+∆+∆−∆+∆+∆−∆+∆+∆+∆−=∆−∆ bbbbbb )()(
TFPhknicthkictLChh nictictlabnictictlab ∆+∆−∆+∆−∆+∆+∆+++∆−= )()()( bbbbbb
Using the condition that: 1=++ nictictlab bbb leads to the cancellation of the Δh terms and so yields:
ctct
ctnictct
ctictctctlabct
TFPh
knicth
kictLChy
∆+
∆+
∆+∆=
∆ ,,, bbb
39 Other research focuses on other productivity-relevant characteristics such as age, gender or
51

We propose a methodology where the contribution of labour input is split into hours worked and changes in composition of hours worked. This methodology is considered theoretically superior to the use of crude measures of labour, such as the total number of hours worked or number of employees, which assume homogeneous contributions to economic growth of different types of workers. This method was applied to the US by Jorgenson et al. (1987) and to EU countries within the EUKLEMS project (O’Mahony and Timmer, 2009). We thus construct a skill-adjusted labour input measure that distinguishes the contribution of four (five for the UK) different skill groups, defined by the levels of educational attainment (see definition in Section 2.1.2). Building on Kang et al. (2012) we investigate the extent of cross-country variations in the up-skilling of the labour force in the years after the financial crisis, and compare it with pre-recession developments. More formally, our measure of labour input, with both the hours and the labour composition components, can be derived using a Törnqvist quantity index of a number (𝑆𝑆) of individual labour types40: ∆𝑙𝑙𝑠𝑠,𝑐𝑐 = ∑ 𝑤𝑤�𝑠𝑠,𝑐𝑐∆𝑙𝑙𝑛𝑛𝐻𝐻𝑠𝑠,𝑐𝑐𝑠𝑠 = ∑ 𝑤𝑤�𝑠𝑠,𝑐𝑐∆𝑙𝑙𝑛𝑛
𝐻𝐻𝑆𝑆,𝑡𝑡
𝐻𝐻𝑡𝑡𝑠𝑠���������∆𝐿𝐿𝐿𝐿
+ ∑ ∆𝐻𝐻𝑆𝑆,𝑐𝑐𝑆𝑆
(3.2)
where ∆𝑙𝑙𝑛𝑛𝐻𝐻𝑠𝑠,𝑐𝑐 denotes the growth in hours worked by each skill group 𝑆𝑆 over two consecutive time periods t and t-1; 𝑤𝑤�𝑠𝑠,𝑐𝑐 represents the weights, given by the two- period average shares of each type of labour in total compensation; 𝑖𝑖 represents the time period considered. We consider different sub-periods in order to examine the impact of the recession (e.g. 2002-2007 vs. 2008-2013). In order to compute the contribution of labour to overall growth we multiply the labour input indices (both hours and labour composition indices) by the corresponding labour share (𝛽𝛽𝑙𝑙𝑙𝑙𝑙𝑙,𝑐𝑐𝑐𝑐 as in expression (3.1)*).
Equation 3.2 clearly shows that labour input can increase either because a) the number of hours worked increases, or b) the services per hour of labour increase; i.e. the labour force becomes more skilled and more productive. This distinction is particularly important if there are significant changes over time in the labour input.
From the labour composition term in equation 3.2 it can clearly be seen that if the proportions of each labour type in the workforce change, this will have an impact on the growth of inputs, beyond any change in the number of hours worked. A shift of hours worked by less qualified workers to more qualified workers will be reflected in a positive contribution of labour services to growth. Changes in the hours worked by various types of workers are weighted by their compensation rates, and as we assume that workers are
experience. 40 For simplicity we omit here the country subscript.
52

paid their marginal productivities, skills with a higher remuneration will have a larger influence on the labour index41.
The intuition behind equation 3.2 is that if the total number of hours worked stayed the same, but they were increasingly worked by more intelligent and able workers, which are presumed more efficient, this would result in increased output.
3.1.2. Calculating the contribution of on-the-job training to growth The basic growth accounting framework set out in Section 3.1 is now modified to account for the influence of a particular type of intangible investment: on-the-job training. We thus broaden the scope of the growth accounting framework to get a more thorough picture of productivity developments (see Oliner et al. (2008) for the US). A traditional growth accounting approach excludes intangible capital, but this type of capital has received much attention recently as a source of productivity gains.
We now augment expression (3.1) to assess the influence of training, as follows42:
∆𝑦𝑦 = 𝛽𝛽𝑙𝑙𝑙𝑙𝑙𝑙𝑙𝑙𝑎𝑎𝑎𝑎∆ℎ + 𝛽𝛽𝑙𝑙𝑙𝑙𝑙𝑙
𝑙𝑙𝑎𝑎𝑎𝑎∆𝐿𝐿𝐿𝐿+𝛽𝛽𝑖𝑖𝑐𝑐𝑐𝑐𝑙𝑙𝑎𝑎𝑎𝑎∆𝑖𝑖𝑖𝑖𝑖𝑖𝑖𝑖 + 𝛽𝛽𝑛𝑛𝑖𝑖𝑐𝑐𝑐𝑐
𝑙𝑙𝑎𝑎𝑎𝑎∆𝑛𝑛𝑖𝑖𝑖𝑖𝑖𝑖𝑖𝑖 + 𝛽𝛽𝑇𝑇𝑇𝑇 ∆𝑇𝑇𝑇𝑇𝐴𝐴𝑇𝑇𝑇𝑇𝐾𝐾 + ∆𝑇𝑇𝐹𝐹𝐹𝐹 (3.3) where the meaning of the input variables follow the definitions outlined in respect of expression (3.1). Now the 𝛽𝛽𝑇𝑇𝑇𝑇 indicates the share of training investment over total output.
TRAINK represents the stock of training capital. Our approach to the construction of this indicator is based on the calculations in O'Mahony (2012a, 2012b), which has also been applied recently by Mason et al. (2014) within a framework to investigate the impact of vocational and educational training on productivity growth.
In this revised GA framework the labour and capital shares are adjusted to account for the investment in training. In a standard GA setting, the labour share represents the share of labour compensation in nominal output. As we now incorporate a new type of investment, not included in national accounting as it was mostly included in intermediate expenditures, the aggregate output needs to be modified to allow for the new type of investment. We first adjust the total output figure to include the amount invested in training, and then we obtain the new labour share by dividing the total labour compensation by the adjusted output figure.
𝛽𝛽𝐿𝐿𝐿𝐿𝐿𝐿𝑙𝑙𝑎𝑎𝑎𝑎 = 𝐿𝐿𝐴𝐴𝐿𝐿/𝑌𝑌𝑙𝑙𝑎𝑎𝑎𝑎
Finally, the assumption of constant returns to scale allows us to derive the new capital shares, given the new labour share and share of training investment:
41 This is often considered a limitation, as the assumption that workers are paid their marginal productivities is valid mainly under competitive labour markets, which can be considered unrealistic in many instances.
42 For simplicity we omit here the country and time subscripts.
53

𝛽𝛽𝐿𝐿𝐿𝐿𝐿𝐿𝑙𝑙𝑎𝑎𝑎𝑎 + 𝛽𝛽𝑇𝑇𝑇𝑇 + 𝛽𝛽𝑖𝑖𝑐𝑐𝑐𝑐
𝑙𝑙𝑎𝑎𝑎𝑎 + 𝛽𝛽𝑛𝑛𝑖𝑖𝑐𝑐𝑐𝑐𝑙𝑙𝑎𝑎𝑎𝑎 = 1
The growth of TFP is then derived residually43. In order to compute training stocks we first estimated the value of investments in continuing training made by employers, which required a monetary valuation of the number of hours of training received by workers. Accordingly, we first estimated the amount of hours that workers spend on training activities. This information has been drawn from the EU labour force survey (using the variable COURATT44: "Attendance of courses, seminars, conferences, private lessons or instructions outside the regular education system within the last 4 weeks"). Training is treated here as an activity largely undertaken by firms who pay the direct costs of training programmes and who also incur indirect costs in terms of production output foregone (Corrado et al., 2009). Investments in continuous training in industry j, country c and time period t are calculated as follows:
𝑇𝑇𝑇𝑇𝑐𝑐𝑐𝑐 = 𝐻𝐻𝑇𝑇𝑇𝑇𝑐𝑐,𝑐𝑐 ∗ 𝐿𝐿𝑐𝑐,𝑐𝑐
where TI refers to nominal expenditures on investments in training, HTR to total hours spent training per worker and C is the cost of an hour’s training. Since average training durations are reported for the previous four weeks, this is converted to an annual figure, allowing for time lost due to holidays and other forms of absence. Hourly costs C have two elements: the direct costs of training (costs of running courses) and the opportunity costs of production or leisure time foregone due to time spent on training activities. Following Jorgenson and Fraumeni (1992), time away from production and leisure is valued at the market wage.
To estimate the impact of these training investments on productivity, it is necessary to convert investment values to volumes and construct measures of intangible training capital stocks. As the indirect components of the hourly costs vary with wages through time, we used an earnings index to deflate nominal investments to a constant price series.
The perpetual inventory method that cumulates investments and subtracts depreciation is then employed to convert real investments to capital stocks. The most common assumption employed on the form of the depreciation function is the rate of geometric depreciation. If we let RTI denote investment in constant terms, K denote capital and 𝛿𝛿𝑇𝑇𝑇𝑇𝐿𝐿𝑇𝑇𝑇𝑇 the depreciation rate, this allows the stock of training capital at any point in time t to be estimated as follows:
𝑇𝑇𝑇𝑇𝐴𝐴𝑇𝑇𝑇𝑇𝐾𝐾𝑐𝑐,𝑐𝑐 = 𝑇𝑇𝑇𝑇𝐴𝐴𝑇𝑇𝑇𝑇𝐾𝐾𝑐𝑐,𝑐𝑐−1(1 − 𝛿𝛿𝑇𝑇𝑇𝑇𝐿𝐿𝑇𝑇𝑇𝑇) + 𝑇𝑇𝑇𝑇𝑇𝑇𝑐𝑐𝑐𝑐
43 We do not use the Conference Board estimates for total factor productivity as we now account for training. 44Training is measured by the participation.
54

Applying a geometric depreciation rate implies that proportionally more of an asset is depreciated early in the life of the asset. It is common in the intangibles literature to employ relatively high depreciation rates to take account of the idea that many of these investments are associated with new technologies that change relatively rapidly. We employ here a 25% depreciation rate per year. For a discussion of the sensitivity of the intangible training capital stock estimates to the underlying assumptions, see O’Mahony (2012a, 2012b).
Finally, we estimate measures of intangible investments in training by skill type for all European countries covered in the report. For all countries studied we distinguish between workers with higher qualifications (ISCED 5A-6), upper-intermediate-level qualifications (ISCED 5B-4), lower intermediate qualifications (3A, 3B), and low-level qualifications (ISCED 1-2). For the UK we consider five skill groups, as we are able to break down the lower intermediate group (3) into lower-intermediate general education (3A) and lower-intermediate vocational education (3B).
For each skill group we estimate the equations using data on the proportion of workers trained, the hours spent on training, opportunity costs and incorporate other elements such as the direct costs and the proportion of training undertaken during working hours.
Figure 3.1 illustrates the stocks of training, constructed by the methodology explained above for the EU countries considered in the report. We derived appropriate indices with a base of 100 in 2000. For the UK and the majority of other countries, the stock of training capital has been declining, or stagnating, since the financial crisis. This is explained primarily by in a fall in rates of participation in training rather than its duration or average costs. However, not all countries see a decline; in Germany the level of training remained quite stable and in countries such as Finland it has increased.
Green et al. (2013) provide a comprehensive analysis of trends in job-related training in the UK. Using a variety of individual and employer-based surveys, they conclude that the volume of workplace training in the UK has indeed been falling over the last decade; this is in contrast with the developments during the 1990s when job-related training was on the rise. They stress that the cuts in training volumes are of concern as training emerges as an important factor for future prosperity. Their study also calls for an urgent improvement in the collection and presentation of statistics surrounding training and for a better understanding of both changes in training volumes and training quality.
55

Figure 3.1.Training capital in EU countries (1995 prices, indexed 2000=100).
Source: EU LFS, TED, EUKLEMS, and own calculations based on O'Mahony (2012a,2012b).
56

3.2. Results of the growth accounting decomposition
Main findings
We present here the results of the growth accounting decomposition, and evaluate the changing role of different types of inputs to production, focusing on the changing role of skills. Within this framework, we also explore the roles of training and total factor productivity (TFP), in explaining total GDP growth.
Table 3.1 presents the main summary of the contributions of a detailed number of factors of production to GDP growth during two distinct sub-periods: 2002-2007 and 2008-2013. We distinguish the extent to which these contributions have changed in response to the financial crisis, and analyse the UK case in relation to other major economies. The first two rows of table 3.1 present the average growth rates of GDP, by country, and sub-period. The following rows contain the percentage point contributions of the different factors of production. Table A.2.6 in the Appendix complements Table 3.1 by showing a more detailed account of developments following the financial crisis; we distinguish the years in the aftermath of the crisis (2008-2010) from the years of economic recovery (2011-2013).
57

Table 3.1. Decomposition of GDP growth 2002-2013; two sub-periods.
Finland France Germany Netherlands Sweden UK United States GDP 2002-2007 4.11 1.81 1.39 1.97 3.25 3.09 2.66
(% change) 2008-2013 -0.53 0.11 0.68 -0.21 0.99 -0.31 0.97 on which Percentage point contribution to average annual GDP growth Hours 2002-2007 0.79 0.20 -0.15 0.13 0.27 0.39 0.57
2008-2013 -0.17 -0.07 0.24 0.06 0.28 0.14 -0.16 Output per person hour 2002-2007 3.32 1.60 1.53 1.84 2.98 2.70 2.09
2008-2013 -0.36 0.18 0.44 -0.26 0.71 -0.45 1.13 of which Capital deepening 2002-2007 0.77 0.96 0.49 0.58 1.06 1.18 1.04
2008-2013 0.66 0.77 0.59 0.47 1.12 0.76 0.64 ICT capital 2002-2007 0.55 0.19 0.29 0.30 0.37 0.47 0.43
2008-2013 0.40 0.14 0.42 0.21 0.57 0.23 0.37 Non-ICT capital 2002-2007 0.23 0.77 0.21 0.28 0.69 0.71 0.62
2008-2013 0.26 0.62 0.17 0.26 0.55 0.53 0.27 TFP 2002-2007 2.18 0.25 0.85 0.60 1.67 0.98 0.78
2008-2013 -1.36 -0.93 -0.45 -0.84 -0.58 -1.71 0.16 Training 2002-2007 0.08 0.08 0.04 0.15 0.06 0.07 0.00
2008-2013 0.05 -0.02 0.00 0.05 -0.02 -0.04 0.00 Labour composition(Skills) 2002-2007 0.29 0.32 0.15 0.51 0.19 0.47 0.27
2008-2013 0.29 0.36 0.29 0.05 0.19 0.54 0.33 of which Higher 2002-2007 0.89 0.49 0.24 1.17 0.58 0.90 0.48
2008-2013 0.99 0.63 0.34 0.38 0.68 1.16 0.54 Upper-intermediate 2002-2007 -0.26 0.10 0.07 -0.43 0.11 0.05 0.05
2008-2013 -0.22 0.27 0.31 -0.23 0.15 -0.02 0.12 Lower-intermediate 2002-2007 0.16 0.30 -0.11 0.52 0.33 -0.02 -0.18
2008-2013 -0.05 0.08 -0.20 -0.12 0.17 -0.05 -0.21 Low 2002-2007 -0.50 -0.57 -0.06 -0.75 -0.83 -0.46 -0.08
2008-2013 -0.44 -0.62 -0.15 0.03 -0.81 -0.55 -0.13
Notes: US does not include training; Sweden contains data only from 2006, Finland from 2003.
58

To help illustrate the changes in the magnitudes of these contributions over time we also present the information in a stacked bar chart (see Figure 3.2 below for the UK; similar graphs are shown for the other countries analysed - see Figures A.2.8-A.2.13 in the Appendix). In these various charts, the average GDP growth rate achieved in each sub-period is labelled with the corresponding numerical figure and represented by a black diamond sign. In each period, the average GDP growth rate is the sum of all the production factors’ contributions plus the contribution of total factor productivity growth; that is the sum of all the coloured bars. The estimated contribution of labour composition, the main factor of interest in this study, is also labelled appropriately in the graphs. Figure 3.2. Growth contributions of labour, capital and productivity in United Kingdom (%), 2002-2013.
Sources: Conference Board Total Economy Database (TED), UK LFS, own calculations.
Here we describe the main findings. During the period 2002-2007, the UK economy grew at an average rate of just over 3% per year; which was largely explained by labour productivity gains (output per hour) (see Table 3.1). This rate was slightly higher than that in the US (2.7%) and considerably above the one France (1.8%) and Germany (1.4%). Only Finland (4.1%) and Sweden (3.3%) experienced higher output growth rates. The most important contributor to the UK's labour productivity growth in the years before the crisis was total factor productivity (representing over 30% of labour productivity growth), followed by the accumulation of capital assets. During this period, changes in workforce composition were also significant; the results indicate that the up-skilling of the UK's workforce accounted for around 20% of total labour productivity growth (labour composition represented 0.5 percentage points of total
59

labour productivity growth). Reassuringly, these findings are in line with previous evidence (Timmer et al., 2010). The analysis for the period 2008-2013 captures the developments in the years following the financial and economic crisis of 2007-2008. The table shows that GDP remained largely flat in the UK, and the average growth rate was slightly negative at -0.3%. The analysis of the other countries also reveals weak output growth in France (0.1% per annum) and slightly better growth in Germany (0.7%). During this time, the economic outlook was more favourable for the United States and Sweden, with output growth rates of just below 1% per annum. In the aftermath of the crisis, the UK fared better in terms of employment than other major European countries (e.g. France), although it fared worse in terms of productivity. After 2007, GDP contracted and total factor productivity growth turned negative. TFP thus appears to behave largely pro-cyclically, perhaps reflecting the changes in the speed of adjustment in the use of capital and labour inputs in response to the downturn (OECD, 2012). This is consistent with the fact that TFP dropped sharply in the most severe years of the crisis The contribution of capital dropped after 2007. In the most recent years, while the growth of traditional capital has slowed down, reflecting the tightening of credit conditions and the reduced investment efforts of firms, the growth of ICT capital has picked up again. The contribution of the raw labour input, in terms of amount of total hours worked, dropped to negative levels at the onset of the crisis (reflecting the effect of job losses) but recovered substantially afterwards. The contribution of labour composition has remained positive through the whole period analysed, indicating an on-going increase in the average skill level of the UK's employed population. The calculations also reveal that the observed increase in the average level of skills of the workforce was more pronounced in the first years of the crisis (2008-2010) - see Table A.2.4 in the Appendix- than in the more recent period (2011-2013). Growth would have been significantly lower in the aftermath of the crisis, had it not been for improvements in labour composition. It is however important to exert caution when drawing conclusions derived from the analysis of a hypothetical scenario. During the period 2002-2007, the incidence of on-the-job training improved in the UK, and this is reflected in the positive contribution to productivity. However, since 2007, the contribution of training to labour productivity growth has been negative. The growth contribution from this type of intangible capital deepening seems to follow the general pattern for ICT capital, which was higher during 1995-2000 but declined later on. This is also observed for the US (Oliner et al., 2008), reflecting an explicit link between intangible capital and ICT capital. Table 3.1 and Figures A.2.8-13 contain details of the sources of GDP growth for the United States and the remaining EU countries. In addition, Figure 3.3 below shows the main contributions to growth in average labour productivity in each sub-period for each of the seven countries. The average GDP growth in the US between 2002-2007 was slightly lower than that in the UK (at 2.7%). The US had experienced the highest level of growth in an earlier period from the mid-1990s to early 2000s with the advent of the new ICTs.
60

In the case of the United States45, the largest contributor to output growth during the first period of the sample was also total factor productivity growth. Similarly to the UK, this factor accounted for more than 30% of total labour productivity growth. Capital accumulation represented around half of overall productivity growth (this was slightly larger than that in the UK) and larger employment gains contributed to faster output growth. During this period of expansion, however, the contribution of labour composition was smaller in the US than in the UK. The labour composition term, proxying for skill improvements, accounted for about 10% of average labour productivity growth. The financial crisis brought about slightly negative output growth during the period 2008-2010, which was mainly explained by the fall in employment. Overall, GDP grew at just below 1% annually during 2008-2013. During this period the contribution of total factor productivity dropped substantially, but did not turn negative. By 2011-2013, the contributions of both employment and total factor productivity had recovered significantly. The contribution of skills has remained relatively stable throughout this period and even increased in the immediate aftermath of the crisis. Table 3.1 and Figures A.2.9-A.2.10 in the Appendix present the growth accounting decomposition for France and Germany. During the period 2002-2007, the average GDP growth rates in France (1.8%) and in Germany (1.4%) were lower than in the UK. Total factor productivity growth was just above zero in France, well below the growth rates achieved by the UK and US. The largest contribution to GDP growth in France came from non-ICT capital accumulation (over 40% of labour productivity growth). ICT capital accumulation, in contrast, had a lesser role compared to the US and the UK. The contribution of labour composition was substantial in France. In Germany TFP growth was high and accounted for most of output growth. The contributions of both types of capital and labour composition were lower than in France, the UK and the US. During the period 2008-2013, total productivity growth declined at a rate of just below 1% per year on average in France; it declined at a faster rate at the initial stage of the crisis, and recovered in the following years. Capital accumulation has declined since 2007, although less intensively than in the UK. In Germany the TFP contribution also turned negative but by much less than in either the UK or France. ICT capital’s contribution increased, in contrast to most other countries.
In France, the contribution of labour composition has remained quite stable (increasing slightly) throughout the crisis. The role played by training in France also deteriorated during the period 2008-2013 in comparison to the previous period; in fact it turned negative, suggesting a decrease in the incidence of on-the-job training during the years following the economic downturn. In Germany the contribution of labour composition improved. The contribution of training decreased, but remained slightly positive.
Similarly, Table 3.1 and Figures A.2.11-A.2.13 show detailed growth accounting decompositions for other countries of interest: Finland, Netherlands and Sweden. During the period 2002-2007, GDP growth was robust in the Netherlands, Finland and Sweden (with rates ranging between 2% and 4% per year). During this period, the most important factor explaining growth in Finland was total factor productivity, representing around 50% of total output growth. In Netherlands the most important contribution came also from total
45 Training is not considered in the growth accounting exercise for the United States.
61

factor productivity gains, and also from changes in labour composition. In Sweden the employment gains were a strong growth driver.
The contribution of skills to growth was quite small in Finland during 2002-2007; labour composition gains accounted for just below 8% of total output growth. It was significantly higher in the Netherlands. Total factor productivity growth turned negative during the period 2008-2010 in all these three countries; this was in sharp contrast to the significant productivity gains experienced in earlier years. Total factor productivity recovered somewhat during 2011-2013 but the growth rates remained close to zero.
In all these three countries the contribution of capital decreased in response to the crisis, although to a smaller degree than in the UK. The contribution of labour composition has not changed significantly in Finland. The contribution of labour composition decreased in Netherlands and remained unchanged in Sweden during the latter period 2008-2013. Regarding training, its contribution to labour productivity growth decreased in response to the crisis in all three countries, with, however, only a very small decline in Finland.
The growth accounting decomposition has shown that output and productivity growth remain weak in the UK; this is in contrast to the more favourable performance of the labour market. Output growth has remained weak in the other developed countries; the US experienced the fasted output and productivity recovery. As highlighted above, improvements in labour composition have mitigated this effect.
The contribution of capital has decreased in all these countries since the recession, reflecting lower investment. Training has followed a decreasing or flat trend in all countries.
To summarise, the main factor behind the labour productivity slowdown in the UK is negative total factor productivity growth. This is in contrast with the rapid growth in total factor productivity experienced during the late 1990s and early 2000s. Figure 3.3B highlights the different countries’ experience in the 2008-13 period. It shows clearly how the UK has under-performed the rest of these countries in terms of total factor productivity growth since the onset of recession.
By contrast, the percentage point contribution of labour composition to growth in labour productivity during this period is highest of all the seven countries. We now go on to compare the different contributions of measured skills to labour productivity growth in each country in detail.
62

Figure 3.3: Growth per annum in average labour productivity (output per person hour) and in the percentage point contributions to labour productivity growth of capital deepening, TFP, training and labour composition (skills) A: 2002-07
63

Figure 3.3 (continued): Growth per annum in average labour productivity (output per person hour) and in the percentage point contributions to labour productivity growth of capital deepening, TFP, training and labour composition (skills) B: 2008-13
Source: Derived from Table 3.1
Note: Percentage point contributions may not sum exactly to total growth in output per person-hour due to rounding
64

Detailed results: the contribution of skills to growth
In this section we investigate in more detail the underlying components of the "labour composition" term described in the previous section. Firstly, we break down the total labour composition effect into the effects attributed to four different types of educational-based categories. The four skill groups considered are: "Higher skilled", "Upper-intermediate skilled", "Lower-intermediate skilled" and "Lower skilled". This is shown in the lower panel of table 3.1. and in Figure 3.4 below.
The sum of the contributions pertaining to all skills groups should equal the total labour composition term of the main growth accounting exercise. For example, in the case of the UK, the total labour composition term during 2008-2013 was 0.54 percentage points. This can be broken down into the contribution of the "High-skills" (1.16), "Upper-intermediate skills" (-0.02), "Lower-intermediate skills" (-0.05), and "Low skills" (-0.55) (see Figure 3.4B). The signs of the labour composition terms are a reflection of the changes in employment shares accrued by each of the groups in the period of analysis.
Changes in labour composition largely reflect the reallocation of market shares across skills groups. Although wages differentials are important, as they signal differences in productivity amongst type of workers, if the ratio of hours worked between high-skilled to low-skilled did not change over time, this would not translate to productivity improvements. By definition it is not possible for all skills to have a positive or all negative contribution). This is because the rise in the employment shares of some groups takes place at the expense of the shares in other groups.
During the period 2002-2007, the increase in the level of skills contributed to just under 20% of the overall labour productivity growth in the UK (just below half a percentage point, 0.47). This contribution is above the contribution made by skills in the US and the contribution of skills in other European countries. In France the up-skilling of the workforce also contributed around 20% of France's total labour productivity growth. The contribution of skills to labour productivity growth was high in the Netherlands and lower, on average, in other countries such as Finland (9%) and Sweden (Figure 3.4A).
The higher-skilled group accounted for the largest contribution to labour productivity growth during the period 2002-2007. This is consistent with the robust increase in the share of graduates in the UK's workforce since the early 2000s. The contribution of the higher-skilled group to labour productivity growth was also positive in the US, but of lower magnitude than that in the UK. The importance of higher-skills in countries like Finland and France was also relatively strong.
65

Figure 3.4: Growth per annum in the percentage point contributions to labour productivity growth of labour composition (skills) and in the four categories of skill A: 2002-07
(Continued on next page)
66

Figure 3.4 (continued): Growth per annum in the percentage point contributions to labour productivity growth of labour composition (skills) and in the four categories of skill
B: 2008-13
Source: Derived from Table 3.1
Note: Percentage point contributions may not sum exactly to total growth in labour composition due to rounding
67

During the period 2008-2013, the contribution of higher-skills to labour productivity growth has continued to increase in the UK. The contribution increased in the immediate years of the recession and then declined slightly; it is now at similar pre-crisis levels. This is in stark contrast to overall productivity performance, which has followed a downward trend. In the US, France and Germany, the contribution of higher academic type skills also increased in absolute terms. This was also the case in countries like Sweden and Finland.
The second group we consider is the upper-intermediate skill group, which accounts for just above 10% of the total UK's workforce (as we have seen in section 2). The contribution of this group was positive to 2007 but has seen a decrease in the total employment share since. The contribution of this skill group was also negative in Netherlands and Finland in the two sub-periods, which indicates a decrease in the incidence of this type of skills in these two economies. However it has been positive in US, Germany and France.
The third group analysed is the "lower-intermediate" skill group. The contribution was positive in the UK during 2002-2007, but turned negative in 2008-2013, indicating a lower share of workers with this type of qualifications in the total workforce. This is expected considering the decrease in the number of workers with low-level qualifications. Consistent with the UK, in the majority of countries the contribution of this skill group deteriorated in the second time period. In the US the contribution was negative throughout the whole period analysed, as a smaller proportion of the US' workforce has lower intermediate skills.
The contribution of the "lower-skill" group is negative in the UK, as expected, and this has not changed greatly throughout the whole period. The contribution of this group is negative in all major countries reflecting the decreases in the proportion of the workforce with no or very low qualifications, the one exception being a slight positive contribution in the Netherlands in the 2008-13 period. It is however less negative in the US compared to the UK and also France.
Table 3.2 below shows the labour composition terms for five skill groups for the UK only. Using more detailed employment shares from the UK Labour Force Survey, we are able to distinguish the labour productivity contributions of lower-intermediate vocational skills (for example NVQ3, trade apprenticeships) from the contribution made by lower-intermediate general skills (for example, A-level or equivalent).
We can see that the contribution of lower-intermediate vocational skills has been negative throughout the whole period of analysis. In contrast, the contribution of the lower-intermediate general skill groups, which was positive during 2002-2007 turned negative in the later period. We can observe that in the period 2008-2013 the contribution of labour composition in all groups but one (the high-skilled), has been negative. This reflects the rapid increases in the proportion of the workers with high-level qualifications.
68

Table 3.2. Detailed labour composition contributions in the UK; five skill groups.
Contributions of labour composition by skills
2002-2007 2008-2013
High- skills 0.90 1.16 Upper-intermediate skills 0.05 -0.02 Lower-intermediate vocational skills
-0.08 -0.04
Lower-intermediate general skills 0.07 -0.01 Low-skills -0.46 -0.54
Source: UK Labour Force Survey. The growth accounting exercise has also shown that in a context of weak productivity growth, the improvement of skills has continued to make a positive contribution to output. The contribution of labour composition rose markedly in the aftermath of the financial crisis, as job losses were concentrated amongst the less skilled. This has mainly been driven by the fact that those with a higher education qualification now represent an increasing share of the workforce. A higher proportion of the UK's workforce has a university degree, and a lower proportion has upper-intermediate, lower-intermediate or low or no qualifications. This occurs despite some reduction in the wage premium paid to the high skilled, possibly reflecting the fact that, as UK graduates have moved in larger numbers into occupations which did not traditionally require university degrees as entry qualifications, some evidence is pointing to a widening dispersion of returns to degree-level study, with much lower earnings for graduates who regard themselves as ‘overqualified’ for the jobs they hold (Green and Zhu, 2010).
69

4. Econometric Analysis 4.1. Methodology
The econometric approach is developed from an equivalent production function framework to the growth accounting exercise. As shown in previous sections, total factor productivity growth, the residual of the growth accounting setup, accounts for a large part of labour productivity growth differences across countries. A key aim of an econometric approach is to further our understanding of the sources of the ‘unexplained' part of total labour productivity growth.
The main advantage of the econometric approach over the growth accounting approach is that it allows us to investigate the role of additional factors that may have an impact on growth, such as intangibles and skills formation, independently, or in combination with traditional inputs to production.
An econometric approach, both at an aggregate and at industry level, has been extensively used in the literature to explain productivity developments over the last twenty years. From the mid-1990s onwards, a broad consensus emerged about the key role played by information and communications technology in the productivity resurgence of the UK, the US and other developed economies. More importantly, econometric studies contributed to uncovering the determinants of total factor productivity gains, which were observed both within and outside the ICT production sector. ICT’s role as a General Purpose Technology and the increase in ICT-related innovations helped explain the TFP surge in the wider economy, mainly in market services sectors. Examples of industry-level studies included Stiroh (2002), Nordhaus (2002), Bosworth and Triplett (2007), O'Mahony and Vecchi (2005) and Basu et al. (2003). For more detailed references to the industry-level literature in Europe, see Timmer et al. (2010) and van Ark and Inklaar (2005).
From the mid-2000s, the contributions to growth from both the production and the use of IT declined but total factor productivity growth continued to be a major productivity driver in the US although not in post-recession Europe (see Figure 3.3B above). Since then a growing body of studies has stressed the importance of intangible assets to explaining growth developments and their potential to generate spillovers (See Corrado et al., 2014; Corrado et al. 2013; Corrado et al., 2012). Research has found that intangible capital accounts for one fifth to one third of labour productivity growth in the market sector of the US and EU economies (Corrado et al., 2013).
Corrado et al. (2014) are pioneers in introducing explicit measures of intangible capital in industry-based cross-country econometric analysis to investigate the channels by which intangibles affect productivity. Prior studies had been more limited by the lack of comprehensive data on intangible investments, and the links with economic growth were investigated mainly through R&D, or inferred from assumed correlations with ICT investment. In the usual growth accounting framework, Corrado et al. (2014) find that the marginal impact of ICT capital is higher when complemented with intangible capital.
In the present econometric analysis we rely on industry-level data for the group of countries of interest, available for the period 1995-2010. Our main variables of interest are
70

related to human capital accumulation, both in relation to certified skills (through the education system) and uncertified skills (developed through on-the-job training).
We are able to exploit differences in the growth rate of the different inputs across industries, countries and time, including the period of the financial crisis, to identify the contribution of the different factors to output growth.
Our econometric model is based on a basic production function specification such as (all variables in logs):
∆𝑦𝑦𝑎𝑎𝑐𝑐𝑐𝑐 = 𝛼𝛼𝑐𝑐𝑐𝑐 + 𝛼𝛼𝑎𝑎𝑐𝑐 + 𝛽𝛽𝑙𝑙𝑙𝑙𝑙𝑙∆𝑙𝑙𝑎𝑎𝑐𝑐𝑐𝑐 + 𝛽𝛽𝑖𝑖𝑐𝑐𝑐𝑐𝑖𝑖∆𝑖𝑖𝑖𝑖𝑖𝑖𝑖𝑖𝑎𝑎𝑐𝑐𝑐𝑐 + 𝛽𝛽𝑛𝑛𝑖𝑖𝑐𝑐𝑐𝑐𝑖𝑖∆𝑛𝑛𝑖𝑖𝑖𝑖𝑖𝑖𝑖𝑖𝑎𝑎𝑐𝑐𝑐𝑐 + 𝜖𝜖𝑎𝑎𝑐𝑐𝑐𝑐 (4.1)
where ∆yjct is the growth rate of real value added in industry j of country c between year t and year t-1, ∆ictkjct, ∆nictkjct and ∆ljct are the growth rate of ICT capital, non-ICT capital and labour input respectively.
We first estimate this model in differences where we take the log difference (∆) of each variable in equation (4.1) between two consecutive years. This type of transformation is useful because, firstly, it allows the interpretation of the estimated parameters as output elasticities to the factors of production. Secondly, the regressions in differences minimize the risk that unobserved factors, correlated with both inputs and output choices, yield inconsistent estimates of the models’ parameters.
This specification is very similar to that of equation (3.1) from the growth accounting exercise. In the growth accounting analysis, however, we impose the value of the factor shares and derive TFP growth as a residual. Here, instead, we estimate the factor shares econometrically.
Estimates of the βs and the γs parameters are obtained by regressing model (4.1) on the pooled sample of industries observed over the period 1995-2010 across different countries. The estimated β parameters in this model should be interpreted as the average growth contribution of these factors across industries and countries over the observation period 1995-2010. This is dictated by data availability in the EUKLEMS framework with cross-country information on output and input measures at industry level currently available only up to 2010 and on a pre ESA2010 basis.
In addition we include fixed effects, which enable us to control for additional sources of unobserved heterogeneity in productivity performance. In particular, the terms αct and αjt now represent the country-year specific and industry-year specific fixed effects, and they are included in the model to control for unobserved time-varying factors common to all industries within a country, or common to the same industry across different countries (such as technology shocks). The error term ϵjct captures country-industry specific shocks, such as demand shocks, and changes in multifactor productivity.
The right-hand side of equation (4.1) is then augmented with a number of additional inputs: e.g. the training stock (TRAINKjct) and the R&D stock (RDKjct) accumulated over time by the companies populating each industry-country cell. Other measures of intangible assets are subsequently included in the model.
71

These baseline estimates are likely to hide substantial heterogeneity across industries, countries and time. It is indeed conceivable that the growth of ICT capital may contribute in a different way to the growth of output and labour productivity across industries with different technological characteristics and different skill compositions of the workforce. To explore these types of heterogeneous effects, the set of explanatory variables in equation (4.1) is augmented with the inclusion of interactions between the original terms and selected variables identifying specific industry or country characteristics yielding an equation of the form of (4.2) below.
Differences in skill intensity and intangible-assets intensity across industries and countries are considered by including in both specifications the interactions between the input terms and several indicators of intangible capital (intanin). For example, the sign and the magnitude of the parameters βictk
skill and βnictkskill, indicate whether these factors of
production provide a greater or smaller contribution to UK industries’ output growth than to the output growth of the same industries in the other countries included in the sample.
∆𝑦𝑦𝑎𝑎𝑐𝑐𝑐𝑐𝛼𝛼𝑐𝑐𝑐𝑐 + 𝛼𝛼𝑎𝑎𝑐𝑐 + 𝛽𝛽𝑙𝑙𝑙𝑙𝑙𝑙∆ℎ𝑎𝑎𝑐𝑐𝑐𝑐 + 𝛽𝛽𝑖𝑖𝑐𝑐𝑐𝑐𝑖𝑖∆𝑖𝑖𝑖𝑖𝑖𝑖𝑖𝑖𝑎𝑎𝑐𝑐𝑐𝑐 + 𝛽𝛽𝑛𝑛𝑖𝑖𝑐𝑐𝑐𝑐𝑖𝑖∆𝑛𝑛𝑖𝑖𝑖𝑖𝑖𝑖𝑖𝑖𝑎𝑎𝑐𝑐𝑐𝑐 + 𝛽𝛽𝑖𝑖𝑐𝑐𝑐𝑐𝑖𝑖
𝑠𝑠𝑖𝑖𝑖𝑖𝑙𝑙𝑙𝑙�∆𝑖𝑖𝑖𝑖𝑖𝑖𝑖𝑖𝑎𝑎𝑐𝑐𝑐𝑐 ×𝑠𝑠𝑖𝑖𝑖𝑖𝑙𝑙𝑙𝑙�+ 𝛽𝛽𝑛𝑛𝑖𝑖𝑐𝑐𝑐𝑐𝑖𝑖
𝑠𝑠𝑖𝑖𝑖𝑖𝑙𝑙𝑙𝑙�∆𝑛𝑛𝑖𝑖𝑖𝑖𝑖𝑖𝑖𝑖𝑎𝑎𝑐𝑐𝑐𝑐 × 𝑠𝑠𝑖𝑖𝑖𝑖𝑙𝑙𝑙𝑙�+ 𝜖𝜖𝑎𝑎𝑐𝑐𝑐𝑐
(4.2)
=
A second version of the model can be estimated in terms of labour productivity, where all terms are now growth rates of inputs and output per hour worked. This specification enables us to investigate more specifically the relationship between ICT capital deepening, non-ICT capital deepening and productivity:
∆ � 𝑦𝑦𝑗𝑗𝑗𝑗𝑡𝑡ℎ𝑗𝑗𝑗𝑗𝑡𝑡
� = 𝛼𝛼𝑐𝑐𝑐𝑐 + 𝛼𝛼𝑎𝑎𝑐𝑐 + 𝛾𝛾𝑙𝑙𝑙𝑙𝑙𝑙 ∆ℎ𝑎𝑎𝑐𝑐𝑐𝑐 + 𝛾𝛾𝑖𝑖𝑐𝑐𝑐𝑐𝑖𝑖 ∆ � 𝑖𝑖𝑐𝑐𝑐𝑐𝑖𝑖𝑗𝑗𝑗𝑗𝑡𝑡ℎ𝑗𝑗𝑗𝑗𝑡𝑡
� + 𝛾𝛾𝑛𝑛𝑖𝑖𝑐𝑐𝑐𝑐𝑖𝑖∆ � 𝑛𝑛𝑖𝑖𝑐𝑐𝑐𝑐𝑖𝑖𝑗𝑗𝑗𝑗𝑡𝑡ℎ𝑗𝑗𝑗𝑗𝑡𝑡
� + 𝜖𝜖𝑎𝑎𝑐𝑐𝑐𝑐 (4.3)
In addition to estimating a specification in differences we use a specification in levels where we include, along with other measures of intangible investments, employment skill shares as right-hand side regressors, as in:
� 𝑦𝑦𝑗𝑗𝑗𝑗𝑡𝑡ℎ𝑗𝑗𝑗𝑗𝑡𝑡
� = 𝛼𝛼𝑐𝑐𝑐𝑐 + 𝛼𝛼𝑎𝑎𝑐𝑐 + 𝛾𝛾𝑖𝑖𝑐𝑐𝑐𝑐𝑖𝑖 � 𝑖𝑖𝑐𝑐𝑐𝑐𝑖𝑖𝑗𝑗𝑗𝑗𝑡𝑡ℎ𝑗𝑗𝑗𝑗𝑡𝑡
� + 𝛾𝛾𝑛𝑛𝑖𝑖𝑐𝑐𝑐𝑐𝑖𝑖 � 𝑛𝑛𝑖𝑖𝑐𝑐𝑐𝑐𝑖𝑖𝑗𝑗𝑗𝑗𝑡𝑡ℎ𝑗𝑗𝑗𝑗𝑡𝑡
� + %ℎ𝑖𝑖𝑖𝑖ℎ𝑎𝑎𝑐𝑐𝑐𝑐 + %𝑢𝑢𝑢𝑢𝑢𝑢𝑢𝑢𝑢𝑢𝑖𝑖𝑎𝑎𝑐𝑐𝑐𝑐 +
%𝑙𝑙𝑙𝑙𝑤𝑤𝑢𝑢𝑢𝑢𝑖𝑖𝑎𝑎𝑐𝑐𝑐𝑐 + %𝑖𝑖𝑛𝑛𝑖𝑖𝑖𝑖𝑛𝑛𝑖𝑖𝑛𝑛𝑎𝑎𝑐𝑐𝑐𝑐 + 𝜖𝜖𝑎𝑎𝑐𝑐𝑐𝑐
(4.4)
where 𝑖𝑖𝑐𝑐𝑐𝑐𝑖𝑖𝑗𝑗𝑗𝑗𝑡𝑡ℎ𝑗𝑗𝑗𝑗𝑡𝑡
is our measures of ICT-capital deepening; 𝑛𝑛𝑖𝑖𝑐𝑐𝑐𝑐𝑖𝑖𝑗𝑗𝑗𝑗𝑡𝑡ℎ𝑗𝑗𝑗𝑗𝑡𝑡
is our measure of non-
ICT capital deepening; %ℎ𝑖𝑖𝑖𝑖ℎ refers to the percentage of workers with at least a bachelor degree, %𝑢𝑢𝑢𝑢𝑢𝑢𝑢𝑢𝑢𝑢𝑖𝑖 refers to the percentage of the workers with at least an upper-
72

intermediate qualification, and %𝑙𝑙𝑙𝑙𝑤𝑤𝑢𝑢𝑢𝑢𝑖𝑖 is the percentage of workers with lower-intermediate qualifications; %intanin denotes the indicators of intangible investments, which are measured as a share of total output.
Data construction issues
The basic set of variables included in the production function econometric estimations are extracted from the latest data release of the EUKLEMS database. For the specification in differences, we use the input and output quantity indices46 available according to the classification of economic activities NACE Rev. 2. In compiling the database we faced significant data constraints. Capital services47 indices were not separately available for ICT capital and non-ICT capital assets for a number of countries (e.g. US, Sweden), and therefore we were not able to test the relative contribution of these two kinds of capital using these data. Given the important role of ICT assets in driving productivity, we opted for constructing our measure of ICT and non-ICT capital stocks, using the underlying investment and deflator information available on a country-by country basis in EUKLEMS. Starting from the EUKLEMS series on investment in different categories of assets, we use the Perpetual Inventory Method (PIM) to estimate capital stocks at each point in time. By cumulating gross fixed capital formation (GFCF) year by year and deducting retirements, we follow the methodology of Hall and Mairesse (1995) and Griliches (1980) to obtain the initial capital stock at the industry level from the first observation available for investment:
Kjc(t=0)d =
Ijc(t=0)d
g�jcd + δjcd
where Ijc(t=0)d is the initial investment in asset type d in industry-country pairs jc. g�jcd and δjcd
are respectively the country-industry specific average growth rates of investment in asset d over the whole period of observation, and the asset-specific depreciation rate. Once we obtain the initial capital stock we reconstruct series according to the following PIM formula:
Kjc(t+1)d = Ijc(t+1)
d + �Kjc(t)d × (1 − δjcd )�.
EUKLEMS reports investment for eight categories of capital assets. We sum the PIM capital stocks of computing equipment, communications equipment and software to obtain ICTKjct. The stock of Non-ICT capital assets NICTKjct is obtained by summing the total PIM stocks of transport equipment, other machinery and equipment, total non-residential investment, residential structures and other assets. We follow the same approach (PIM) to estimate the stock of R&D capital, but in the absence of country-asset specific depreciation rates we assume a common depreciation
46 See O’Mahony and Timmer (2009) for details on the construction of the output and input indices. We take the log difference of each index between two consecutive periods to approximate the rate of growth of the factor of production between periods. 47 Capital services indices measure the flow of productive services from capital assets to production and can be obtained as a proportion of the capital stocks.
73

rate of 15% per year. Data on R&D investment are obtained from the INTAN-Invest Dataset (Corrado et al., 2012).
The level of real value added (yjct) is computed starting from the nominal value-added series and using country-industry specific output price indices downloaded from the EUKLEMS Basic Files. The total labour input Ljct is now the total number of hours (in millions) worked by persons engaged in a particular industry. Another important issue that constrained us is related to the fact that, in the latest data released from EUKLEMS, some data are reported inconsistently across countries. We lose an important number of observations when we compute our own capital stocks, as some countries do not provide detailed information on investment by asset type; two out of six countries in the sample do not provide this detailed information. The number of observations is thus lower than originally anticipated, and this may limit the number of right hand side regressors that we can include at the same time. Overall, however, we feel that there are sufficient observations to provide a reliable picture of the main determinants of productivity growth.
4.2. Some descriptive statistics
Table 4.1 below contains summary statistics for the different variables included in our model. Our dataset is organized along three dimensions: countries, industries and time. Means and standard deviations are shown in the table for countries as a whole and table 4.2 contains the summary statistics for 1-digit industries (NACE Rev.2).
Table 4.1 shows overall output growth for all industries in the countries considered. During the period 1995-2010 output growth was highest in Finland (2.7% per annum on average), followed by the UK (2.1%) and Netherlands (2.0%). Growth in the stock of ICT capital was also higher in Finland (9% per annum) followed by the UK (7%); the growth in the stock of R&D capital was the lowest in the UK.
Table 4.2 reports similar statistics, summarising the outcomes across the different industries. Taking all countries together, we observe that those industries that experienced a higher growth were in the service sector (professional, scientific and administrative support activities (3.1% per annum on average), wholesale and retail (2.9%), and information and communication activities (6.6%).
74

Table 4.1: Summary statistics of the variables by country, 1995-2010.
∆𝑦𝑦𝑎𝑎𝑐𝑐𝑐𝑐 ∆𝐿𝐿 𝐿𝐿𝐴𝐴 𝑎𝑎𝑐𝑐𝑐𝑐 ∆𝑇𝑇𝑇𝑇 𝑇𝑇𝑇𝑇𝐴𝐴 𝑎𝑎𝑐𝑐𝑐𝑐 ∆ 𝑅𝑅𝑇𝑇 𝐿𝐿𝐴𝐴𝐹𝐹𝑎𝑎𝑐𝑐𝑐𝑐 ∆𝑇𝑇𝐿𝐿𝑇𝑇𝐾𝐾𝑎𝑎𝑐𝑐𝑐𝑐 ∆𝑇𝑇𝑇𝑇𝐿𝐿𝑇𝑇𝐾𝐾𝑎𝑎𝑐𝑐𝑐𝑐
Finland
0.027 0.015 0.004 0.099 0.097 0.047
(0.067) (0.036) (0.074) (0.064) (0.082) (0.115) Germany 0.005 -0.004 0.007 0.082 0.050 -0.020
(0.062 (0.033) (0.035) (0.103) (0.052) (0.024) Netherlands 0.020 0.007 0.027 0.078 0.072 0.010
(0.047) (0.035) (0.045) (0.070) (0.065) (0.037) UK 0.021 0.005 0.054 0.038 0.088 0.020
(0.047) (0.038) (0.045) (0.080) (0.077) (0.042) Total 0.019 0.006 0.023 0.075 0.077 0.016 (0.057) (0.036) (0.056) (0.083) (0.072) (0.071)
Notes. The table reports the mean and the standard deviation (in parentheses) of the variables in columns for each of the four countries in the estimation sample (regressions with PIM capital) and for the total sample across countries.
75

Table 4.2: Summary statistics of the variables by industry48, 1995-2010.
∆𝑦𝑦𝑎𝑎𝑐𝑐𝑐𝑐 ∆𝐿𝐿𝐴𝐴𝐿𝐿𝑎𝑎𝑐𝑐𝑐𝑐 ∆𝑇𝑇𝑇𝑇𝐴𝐴𝑇𝑇𝑇𝑇𝑎𝑎𝑐𝑐𝑐𝑐 ∆𝑇𝑇𝑅𝑅𝐿𝐿𝐴𝐴𝐹𝐹𝑎𝑎𝑐𝑐𝑐𝑐 ∆𝑇𝑇𝐿𝐿𝑇𝑇𝐾𝐾𝑎𝑎𝑐𝑐𝑐𝑐 ∆𝑇𝑇𝑇𝑇𝐿𝐿𝑇𝑇𝐾𝐾𝑎𝑎𝑐𝑐𝑐𝑐 Mining -0.013 -0.022 -0.008 -0.016 0.055 0.011
(0.118) (0.065) (0.095) (0.083) (0.127) (0.068)
Manufacturing 0.014 -0.017 0.012 0.045 0.053 0.037
(0.072 (0.030) (0.031) (0.036) (0.042) (0.118)
Electricity, gas, steam, and air conditioning
0.017 -0.004 -0.006 -0.005 0.070 0.035
(0.037) (0.035) (0.058) (0.096) (0.045) (0.012)
Construction 0.001 0.003 0.017 0.050 0.077 0.046
(0.051) (0.037) (0.065) (0.124) (0.083) (0.071)
Wholesale and retail trade, repair of motor vehicles
0.029 0.002 0.022 0.096 0.082 0.018
(0.038) (0.018) (0.035) (0.092) (0.055) (0.028)
Transport and storage 0.017 0.003 0.034 0.105 0.051 0.020
0.040) (0.017) (0.051) (0.054) (0.045) (0.034)
Accommodation and food service activities
0.013 0.011 0.034 0.105 0.083 0.020
(0.046) (0.027) (0.051) (0.054) (0.062) (0.032)
Information and communication
0.066 0.025 0.034 0.105 0.053 0.057
(0.062) (0.045) (0.051) (0.054) (0.072) (0.026)
Finance and insurance 0.023 0.000 0.025 - 0.058 -0.052
(0.056) (0.028) (0.045) - (0.060) (0.174)
Real estate 0.022 0.020 0.034 0.105 0.126 0.020
(0.018) (0.030) (0.051) (0.054) (0.088) (0.024)
Professional, scientific, administrative and support
0.031 0.029 0.034 0.105 0.107 0.028
(0.049 (0.028) (0.051) (0.054) (0.068) (0.036)
Arts, entertainment and recreation
0.017 0.021 0.034 0.105 0.101 -0.001
(0.030 (0.027) (0.051) (0.054) (0.058) (0.025)
Other service activities 0.014 0.013 0.034 0.105 0.091 0.004
(0.025 (0.024) (0.051) (0.054) (0.054) (0.040)
Total 0.019 0.007 0.023 0.075 0.078 0.016
(0.057) (0.037) (0.056) (0.083) (0.073) (0.072)
Notes: The table reports the means and the standard deviations (in parentheses) of the variables in columns for each sector in the estimation sample. Estimates in the total row may differ from those shown in Table 4.1 due to rounding.
Next we present an analysis of variance applied to the skills variables; this allow us to understand, from the outset, the extent to which differences in skill shares of the labour
48 Based on Nace Rev.2 classification of economic activities.
76
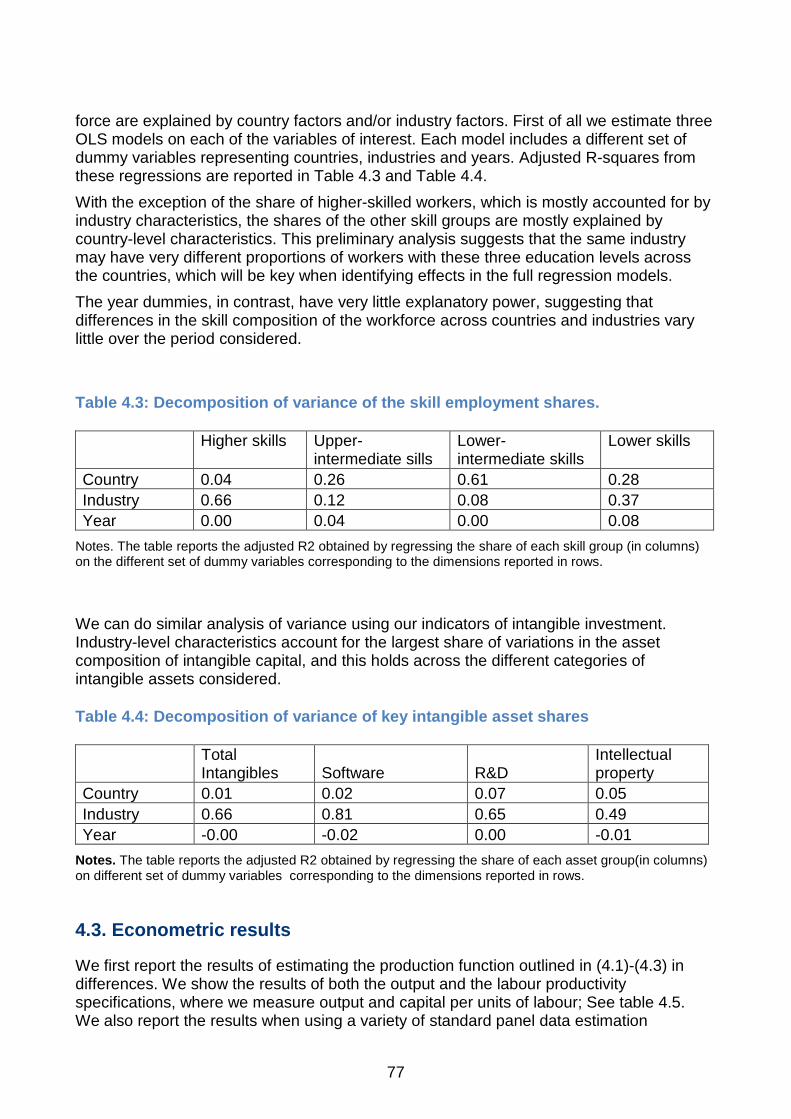
force are explained by country factors and/or industry factors. First of all we estimate three OLS models on each of the variables of interest. Each model includes a different set of dummy variables representing countries, industries and years. Adjusted R-squares from these regressions are reported in Table 4.3 and Table 4.4. With the exception of the share of higher-skilled workers, which is mostly accounted for by industry characteristics, the shares of the other skill groups are mostly explained by country-level characteristics. This preliminary analysis suggests that the same industry may have very different proportions of workers with these three education levels across the countries, which will be key when identifying effects in the full regression models. The year dummies, in contrast, have very little explanatory power, suggesting that differences in the skill composition of the workforce across countries and industries vary little over the period considered.
Table 4.3: Decomposition of variance of the skill employment shares.
Higher skills Upper-intermediate sills
Lower-intermediate skills
Lower skills
Country 0.04 0.26 0.61 0.28 Industry 0.66 0.12 0.08 0.37 Year 0.00 0.04 0.00 0.08
Notes. The table reports the adjusted R2 obtained by regressing the share of each skill group (in columns) on the different set of dummy variables corresponding to the dimensions reported in rows.
We can do similar analysis of variance using our indicators of intangible investment. Industry-level characteristics account for the largest share of variations in the asset composition of intangible capital, and this holds across the different categories of intangible assets considered.
Table 4.4: Decomposition of variance of key intangible asset shares
Total Intangibles Software R&D
Intellectual property
Country 0.01 0.02 0.07 0.05 Industry 0.66 0.81 0.65 0.49 Year -0.00 -0.02 0.00 -0.01
Notes. The table reports the adjusted R2 obtained by regressing the share of each asset group(in columns) on different set of dummy variables corresponding to the dimensions reported in rows.
4.3. Econometric results
We first report the results of estimating the production function outlined in (4.1)-(4.3) in differences. We show the results of both the output and the labour productivity specifications, where we measure output and capital per units of labour; See table 4.5. We also report the results when using a variety of standard panel data estimation
77

methods, such as Ordinary Least Squares (OLS), Random effects (RE) and Fixed effects (FE) estimation techniques.
The coefficients for capital, range between just below 0.1 and just below 0.3 depending on the estimation technique used. The coefficients can be interpreted as the output elasticities of factor inputs. An elasticity of 0.1 implies that a 1% increase in the amount of ICT capital input will translate to a 0.1% increase in output. In line with results found in the production function literature the coefficients on the non-ICT capital factor are largest in magnitude.
When using random effects and OLS models, the estimated coefficients for ICT-capital show a positive and significant coefficient of 0.10 (as a maximum); the coefficients are a little smaller and not statistically significant when estimating the models using fixed effects. The coefficient on the labour variable, when we look at the output specification, is in line with predictions (around 0.4).This indicates that a 1% increase in the total labour input will yield a 0.4% increase in output.
The crucial identification of the Random Effect (RE) estimator is that the regressors are not systematically correlated with the error term. After log-differencing the variables and introducing industry-year and country-year specific dummies to control for αct and αjt this assumption may be tenable. The FE estimator, however, removes from the error term the component explained by time-invariant country-industry factors (i.e. by subtracting from each observation the mean computed at the industry-country level). This transformation of the variables reduces the risk of endogeneity arising from omitted variable bias. This comes at the expense of the efficiency of the estimates, and it explains the higher standard error of FE estimates when compared to RE estimates.
Under valid assumptions, the Random Effects estimator is more efficient than the Fixed-Effects or OLS, thus delivering more precise estimates. However, if the assumptions are not valid, the Random Effects will be inconsistent and therefore the Fixed Effects estimator would be preferred. We perform a Hausman statistical test, which is often used to discriminate between Fixed Effects and Random Effects models; in particular, we use the test to evaluate the consistency of a RE estimator compared to the FE estimator, which is less efficient but is known to be consistent.
In general, when we estimate equations 4.1-4.3, the Ordinary Least Squares (OLS) and Random Effect (RE) models generate very similar parameters on the non-ICT capital and the labour variable. When we compare Random Effects with Fixed Effects we see that the coefficient for the non-ICT capital is larger in the FE model (although not statistically significant in the output specification). In contrast, the FE parameter on ICT-capital is considerably smaller than the RE effect. The lower precision of the FE estimates compared to RE estimates may explain why the FE coefficient on the ICT capital variable tends to be statistically insignificant (in both output and labour productivity specifications). A possible explanation for this finding is that variations in ICT-capital are positively correlated with unobserved time-invariant industry-country level factors that foster value added growth. This may suggest the existence of unobserved factors positively correlated with faster growth in ICT assets (e.g. innovation).
The results for the ICT variable are consistent with industry-based studies looking at the returns associated with the ICT technology and in line with prior expectations on the impact of ICT capital on output growth. Earlier econometric studies often failed to obtain
78

significant results for the ICT capital variable, and sometimes even a negative coefficient. This was attributed for example, to a delay in the implementation of complementary investments deemed necessary to reap the benefits of the ICT technology (O'Mahony and Vecchi, 2005).
The results of the Hausman test49 (performed on a simple output and labour productivity specification) show that both FE and RE estimators are consistent but the RE estimator should be preferred due to its higher efficiency. From this table on, we will focus on the RE estimates.
Table 4.5. Baseline models, estimation in differences (capital with PIM), 1995-2010.
(1) (2) (3) (4) (5) (6)
Dependent: 𝑂𝑂𝑢𝑢𝑖𝑖𝑢𝑢𝑢𝑢𝑖𝑖 𝐿𝐿𝑖𝑖𝐿𝐿𝑙𝑙𝑢𝑢𝑢𝑢 𝑢𝑢𝑢𝑢𝑙𝑙𝑝𝑝𝑢𝑢𝑖𝑖𝑖𝑖𝑖𝑖𝑝𝑝𝑖𝑖𝑖𝑖𝑦𝑦
Estimator: OLS RE FE OLS RE FE
ICT capital 0.078 0.078*** 0.039 ICT per labour 0.101** 0.101*** 0.074
(0.051) (0.024) (0.035) (0.050) (0.031) (0.044)
Non-ICT capital 0.104** 0.104** 0.113 Non- ICT capital per labour
0.192*** 0.192*** 0.283***
(0.052) (0.048) (0.078) (0.065) (0.069) (0.101)
Labour 0.422*** 0.422*** 0.406*** - - -
(0.142) (0.124) (0.127) - - -
Country-year FE Yes Yes Yes Yes Yes Yes
Industry-year FE Yes Yes Yes Yes Yes Yes
R2 within 0.622 0.623 0.540 0.543
R2 between 0.900 0.072 0.760 0.016
R2 overall 0.659 0.087 0.560 0.096
Groups 40 40 40 40
Obs. 579 579 579 579 579 579
Notes. Cluster robust standard errors reported in parentheses (clustering unit: country). Significance levels: ***.01, **.05, *.1. Estimation sample: countries (UK, Finland, Germany, Netherland), years (1996-2010).
Note: OLS= Ordinary Least Squares; RE=Random Effects, FE=Fixed effects.
From a qualitative perspective, we obtain very similar results when we estimate the more complete equation (4.2). We find that both ICT and non-ICT capital contribute to productivity growth in line with prior expectations; the contribution of ICT capital, however, is not significant once we account for industry-country fixed effects and time dummies.
49 We perform a Hausman test between two estimators, a RE estimator and FE estimator, in a simple specification without country*year and industry*year dummies. By using such specification we are incurring in a higher risk of inconsistency of the RE estimates but we are re-assured that it will hold when using a specification with the full set of dummies. The Hausman test result of the main output specification yields a insignificant P-value, larger than 0.05 ( Prob >Chi2=0.5818). This result indicates that the null hypothesis (“the differences between RE and FE are not systematic; both estimators are consistent) cannot be rejected).
79
In Table 4.6, we also explore the additional contribution of intangible investments, namely R&D capital (∆RDKjct) and training capital (∆TRAINKjct) to value added and productivity growth (col 1 and col. 5). As the results of the Hausman test were satisfactory, we report here the main results from the Random Effects models.
Next we look at the different contributions of the factors in sectors that use higher-skilled workers more intensively, and in sectors with higher intensity of intangible assets (col. 3, col. 4 col. 7, and col. 8) In addition, we explore the heterogeneous contribution of each factor of production in the UK (col. 2 and col. 6) vis-à-vis the three other countries in the estimation sample.
The regression results indicate that neither training nor R&D stock contribute to value-added growth (i.e., insignificant estimates in col.1); however the results emerging from the labour productivity specification do support the notion that training has a sizeable and significant effect on labour productivity. The estimated coefficient in col. 5 suggests that a 10% increase in training capital per worker is associated with a 2% increase in labour productivity.
Moving to the heterogeneity arising from industry characteristics, we find that industries with greater skill intensity benefit disproportionally from the growth in training capital (i.e., positive coefficient on ∆Training capitaljct × SKILLjct in col. 3 and col. 7). This result suggests that training has a greater return in industries with a greater proportion of highly qualified workers. We also find some weaker evidence (i.e., significant only at the 10% level) that training makes a greater contribution to value added growth in industries that use intangible assets more intensively.
Interactions with the UK dummy variable are generally insignificant, suggesting a similar contribution of the inputs in the UK and in other countries (col. 2 and col. 6). However, there are two noticeable exceptions to this pattern. First, we find that the growth of hours worked ∆Employment contributed less to value added growth in the UK than in the other countries (i.e., negative coefficient on ∆Employmentjct × UK in col. 2). Second, we find that over the period 1996-2010 non-ICT capital growth provided a greater contribution to productivity growth in the UK than in the comparison countries (i.e., positive coefficient on (Non − ICT capital per employee) × UK in col. 6).
80

Table 4.6: Random-Effect Panel models with interaction terms and additional inputs; Estimation in differences, 1995-2010.
(1) (2) (3) (4)
(5) (6) (7) (8)
Dependent: Growth in output Growth in output per employee Interaction term: - 𝑉𝑉 = 𝑈𝑈𝐾𝐾𝑐𝑐 𝑉𝑉 = 𝑆𝑆𝐾𝐾𝑇𝑇𝐿𝐿𝐿𝐿𝑎𝑎𝑐𝑐𝑐𝑐 𝑉𝑉 = 𝑇𝑇𝑇𝑇𝑇𝑇𝐴𝐴𝑇𝑇𝑎𝑎𝑐𝑐𝑐𝑐
- 𝑉𝑉 = 𝑈𝑈𝐾𝐾𝑐𝑐 𝑉𝑉 = 𝑆𝑆𝐾𝐾𝑇𝑇𝐿𝐿𝐿𝐿𝑎𝑎𝑐𝑐𝑐𝑐 𝑉𝑉 = 𝑇𝑇𝑇𝑇𝑇𝑇𝐴𝐴𝑇𝑇𝑎𝑎𝑐𝑐𝑐𝑐
ICT capital 0.078*** 0.058 0.231* -0.034 ICT capital per employee 0.092*** 0.069* 0.180 -0.049
(0.023) (0.045) (0.136) (0.054)
(0.025) (0.040) (0.122) (0.101)
Non-ICT capital 0.102** 0.103** 0.205 -0.026 Non-ICT capital per employee 0.154*** 0.131*** 0.279** 0.269
(0.040) (0.048) (0.145) (0.180)
(0.045) (0.039) (0.117) (0.258)
Employment 0.374*** 0.465*** 0.253*** 0.358***
- - - -
(0.131) (0.121) (0.081) (0.119)
- - - -
R&D capital 0.003 -0.001 -0.061 0.126 R&D capital per employee 0.033 0.034 -0.010 0.088*
(0.013) (0.038) (0.073) (0.079)
(0.042) (0.058) (0.112) (0.050)
Training capital 0.119 0.130* -0.144 0.038 Training per employee 0.219*** 0.187* -0.021 0.248*
(0.101) (0.070) (0.171) (0.112)
(0.070) (0.103) (0.237) (0.136)
ICT Capital *V - 0.094 -0.529 0.970* ICT Capital per employee *V - 0.055 -0.339 1.228
- (0.101) (0.400) (0.566)
- (0.100) (0.384) (0.971)
Non-ICT Capital *V - 0.003 -0.005 1.110 Non-ICT Capital per employee *V - 0.113** 0.188 -0.918
- (0.050) (0.618) (1.491)
- (0.046) (0.640) (1.953)
Employment *V - -0.267** - -
- - - -
- (0.111) - -
- - - -
R&D capital *V - -0.006 -0.005 -1.540 R&D capital per employee *V - -0.003 -0.006 -0.709
- (0.026) (0.299) (1.082)
- (0.041) (0.196) (0.912)
Training*V - -0.105 1.004** 0.904* Training per employee*V - 0.025 1.039*** 0.011
- (0.263) (0.441) (0.536)
- (0.222) (0.363) (0.879)
𝑉𝑉𝑐𝑐−1
0.108** -0.002 𝑉𝑉𝑐𝑐−1
0.087** -0.022
(0.054) (0.086)
(0.039) (0.106)
Country-year FE Yes Yes Yes Yes
Yes Yes Yes Yes
81

(1) (2) (3) (4)
(5) (6) (7) (8)
Industry-year FE Yes Yes Yes Yes
Yes Yes Yes Yes R2 within 0.624 0.631 0.698 0.631
0.555 0.561 0.644 0.559
R2 between 0.903 0.888 0.883 0.920
0.788 0.764 0.729 0.796 R2 overall 0.661 0.666 0.720 0.670
0.576 0.578 0.653 0.580
Groups 40 40 40 40
40 40 40 40 Obs. 579 579 418 579
579 579 418 579
Notes. Cluster robust standard errors reported in parentheses (clustering unit: country). Significance levels: ***.01, **.05, *.1. Estimation sample: countries (UK, Finland, Germany, Netherland), years (1996-2010), Industries Nace rev. 2 ( B, C, D-E, F, G, H, I, J, L, M-N, R),
82

Next, we estimate a specification in levels (variables always in logs) where we can investigate the role of different types of skills in a production function framework; shares of employment by skill group are now added as additional right hand side variables.
Given that we have distinguished four categories of skills, we include three skill categories in the regressions; this is because the sum of the shares equals 100 and including them all at once would cause them to be perfectly collinear.
The first set of results is presented in table 4.7a. In the most basic model of labour productivity (columns 1 (OLS), column 2 (RE), and column 3 (FE)) we estimate the impact of capital per employee, along with the impact of the overall training capital per employee and the skills variables. The estimated elasticities of the capital variables in levels are of similar magnitude to those of the estimation in differences (around 0.2). The coefficients of ICT capital, however, are a little higher. The coefficients for the training capital deepening variable (that is overall training per employees) are positive and significant.
These results show that having a higher proportion of high-skills is associated with higher productivity outcomes. The effect of the high-skill variable is positive and significant across different specifications. The only estimation where high-level skills are not significant is the FE estimation, as all the country-by-industry fixed effects are likely to absorb a large part of the variation in the observed skills shares. As we saw earlier in section 4.2, the skill shares vary more along the country and industry dimensions and less over time The estimated effect for the high-skilled variable emerging from the RE estimation is 0.2. This suggests, that ceteris paribus, a 10% increase in the share of the workforce with at least a bachelor degree should increase productivity by 2%.
The estimated effect of the upper-intermediate skill variable is less clear cut and while the coefficients are positive, they are not always significant. Using OLS, we do observe that the coefficient is positive and significant, but of lower magnitude than that of the high-skill variable, as we would expect. Unsurprisingly, we also find that having a higher percentage of lower-intermediate skill workers is associated with less productivity.
Training per employee is also positively associated with productivity outcomes. The coefficient of the training variable of the FE estimation suggests that a 10% increase in the total amount of training variable per employee will increase productivity by 2%. Using an RE model the training effect would increase by 3.4% (see column 5 in table 4.7a below).
Finally, when we interact training with the skill variables, we see a positive coefficient attached to the interaction between training and upper-intermediate skill groups (see column 6 in table 4.7a). This suggests that training may enhance the productivity benefits in those industries or countries with a larger proportion of upper-intermediate workers. For example, in an industry x where the average percentage of workers with upper-intermediate qualifications is 12%, a 10% increase in training would result in a productivity increase of 3.6%50.
50 See coefficients of training variables in column (6) of table 4.7a The computation of the marginal effect is 0.338+(0.181*0.12)=0.36
83

A caveat of this measure of training is that it ignores the fact that training is not usually distributed uniformly across all types of workers, and evidence suggest that the most highly skilled workers are the ones usually receiving this type of employer-provided training. In a related paper Mason et al. (2014) also investigate the effect of combining certified skills with training capital stocks by means of interaction terms in the regressions, although the measure of training capital stock is slightly different. They obtain estimates of intangible training capital not only for the whole workforce, but also for each separate skill group, which clearly show that the higher-educated tend to receive more job-related training than the lower-educated in most countries.
Mason et al. (2014) show that there are differences in the way various types of skills affect productivity. They find considerable evidence of a positive relationship between upper-intermediate vocational skills and relative labour productivity performance; they also find this relationship is stronger when vocational skills are broadly defined to include uncertified skills acquired through employer-provided training. This positive relationship, however, is found primarily in those countries where Vocational and Educational Training (VET) is apprenticeship-based. The sample of countries included in the Mason et al.'s study is quite close to ours; the main difference is that we have Finland in our sample and they have Denmark.
Mason et al. (2014) also found positive effects of combining ICT use with high-level academic skills, and also with lower-intermediate general skills (in the present cross-country analysis, however, we cannot distinguish lower-intermediate general from lower-intermediate vocational skills).
84

Table 4.7a. Panel models with interaction terms and additional inputs; Estimation in levels, 1995-2010.
(1) (OLS)
(2) (RE)
(3) (FE)
(4) (RE)
(5) (RE)
(6) (RE)
ICT capital per employee 0.018 0.147** 0.144** 0.120** 0.142*** 0.149*** (0.043) (0.058) (0.054) (0.058) (0.055) (0.052) Non-ICT capital per employee 0.148*** 0.196*** 0.176 0.194*** 0.197*** 0.198*** (0.019) (0.070) (0.109) (0.071) (0.070) (0.070) Training per employee 0.644*** 0.323*** 0.203** 0.305*** 0.347** 0.338** (0.069) (0.124) (0.095) (0.117) (0.154) (0.148) % High skills 3.433*** 0.231* 0.123 0.284** 0.227* 0.231* (0.548) (0.129) (0.122) (0.125) (0.125) (0.133) % Upper intermediate skills 2.148*** 0.358 0.181 0.330 0.369 0.372 (0.638) (0.299) (0.270) (0.286) (0.315) (0.319) % Low skills -0.437 -0.233* -0.130 -0.216* -0.228* -0.200* (0.272) (0.120) (0.120) (0.125) (0.117) (0.118) ICT capital per employee *High skills 0.013 (0.078) ICT capital per employee *Upper-intermediate skills 0.198 (0.134) Training capital* ICT capital per employee -0.011 -0.005 (0.028) (0.026) Training capital* High skills -0.070 (0.093) Training capital* Upper-intermediate skills 0.181* (0.093) Country-year FE Yes Yes Yes Yes Yes Industry-year FE Yes Yes Yes Yes Yes R2 within 0.734 0.740 0.745 0.734 0.741 R2 between 0.919 0.477 0.918 0.921 0.923 R2 overall 0.918 0.481 0.917 0.919 0.922 Groups 40 40 40 40 40 40 Obs. 419 419 419 419 419 419
Note: OLS= Ordinary Least Squares; RE=Random Effects, FE=Fixed effects.
85

Table 4.7b below reports the results of a regression specification that contains more detailed interactions amongst the explanatory variables. First of all, ICT capital and non-ICT capital are interacted with the skills and training measures; we thus aim to uncover complementarities between different types of capital and our measures of usage of skills and training stock. In addition we include other measures of intangible capital that may be important in explaining productivity outcomes.
The estimated coefficients for ICT capital and non-ICT capital deepening are again in line with prior evidence. The coefficient on training capital per employee is estimated to be around 0.2. When we interact the skill variables with a larger number of variables, the coefficients of different skills categories are no longer significant. However, some interesting results emerge. We find a positive and significant coefficient for the high-skill variable when we interact it with the ICT capital. This effect is also found in Mason et al. (2014)'s study.
This result suggests that high-level academic skills have a larger influence on productivity outcomes in industries with higher ICT intensity. Alternatively, we can interpret this result by saying that for firms to increase the returns to ICT investment it is necessary to invest in additional assets e.g. having a highly qualified workforce. This result, which points to larger complementarities between ICT capital and high-level academic skills, is consistent with recent evidence looking more broadly at the complementarities between ICT capital and several forms of intangible capital.
The results also show that the prevalence of upper-intermediate skills has a stronger influence on productivity in those sectors with a higher intensity of non-ICT capital. Here we also find that training capital has a larger effect on productivity in those industries with a larger endowment of workers with upper-intermediate skills (e.g. high level technicians). Finally, we add interactions between skills variables and other alternative measures of intangible investments. Corrado et et al. (2014) find that investments in non-R&D intangibles play a significant role in economic growth. Our intangible indicators are based on the Intan-Invest database. Here we measure intangible investment as a share of output, as building capital stocks for these assets is beyond the scope of this research. Three broad categories are considered here: software, innovative property and economic competencies. The most interesting finding refers to the innovative property investment category (which comprises mineral exploration, scientific R&D, entertainment and artistic originals, new product/systems in financial systems; designs and other product/systems). High-level academic skills have a larger positive influence on productivity in those industries where innovative property investment represents a higher share of output. In these industries, the upper-intermediate skills also have a positive contribution to productivity, but this is of lower magnitude than in the case of high-skills, in line with expectations. Results on software are not statistically significant, but this is of less importance, as software is one of the assets included in the ICT category.
86

Table 4.7b. Panel models with interaction terms and additional inputs; Estimation in levels, Random-Effects models, 1995-2010.
Dependent: Output per unit of labour (1)
(2)
(3)
(4)
ICT capital per employee 0.052 0.137*** 0.138*** 0.163** (0.079) (0.048) (0.046) (0.065) Non-ICT capital per employee 0.206** 0.187** 0.192*** 0.221*** (0.097) (0.077) (0.072) (0.077) Training per employee 0.217** 0.239** (0.09) (0.097) %High skills 0.169 0.135 0.286 (0.431) (0.181) (0.34) %Upper-intermediate skills -0.628** 0.209 -0.309 (0.273) (0.283) (0.556) ICT capital per employee*% High skill 0.166* (0.098) ICT capital per employee*Upper-int.skill 0.141 (0.096) Non-ICT capital per employee*High skill -0.064 (0.069) Non-ICT capital/employee*Upper-int.skill 0.134***
(0.049) Training per employee* High skill -0.007 (0.096) Training per employee* Upper-int.skill 0.182** (0.09) R&D share output 5.521 (4.839) Soft share output -5.206 (4.851) IP51share output -4.367* (2.589) R&D share output*%High skills -8.041 (12.418) R&D share output*%Upper-int. skills 2.74 (13.004) IP share output*%High skills 11.429** (5.086) IP share output*% Upper-int. skills 5.387* (3.03)
51 Innovative Property(IP) assets: R&D, design; product development in financial services; mineral exploration and spending on the production of artistic originals.
87

Country-year FE Yes Yes Yes Yes Industry-year FE Yes Yes Yes Yes Obs. 459 459 459 459
5. Key Findings • Between the mid-1990s and 2007, the increasing endowments of ICT capital, up-
skilling of the workforce, and rapid total factor productivity growth spurred labour productivity growth in the UK; as a result of these factors, UK labour productivity narrowed the gap with respect to leading economies.
• Since the financial crisis productivity growth has slowed down in the UK to a larger extent than in other major economies, such as US, Germany and France, and the productivity gap appears to be widening again.
• Total factor productivity growth, which has now been negative for a few years, accounts for a substantial part of the labour productivity deterioration in the UK, compared to other advanced economies.
• We do not find evidence that changes in the aggregate level of skills have had a negative impact on UK productivity. On the contrary, as the UK’s workforce becomes better qualified, the improvement in workforce skills emerges as one of the main factors currently boosting productivity in the UK. Throughout both the period of economic weakness, and subsequent recovery, skills have continued to play an important role for productivity. This is one of the key findings of this study.
• Our results thus do not support the supply-side theory that the productivity puzzle is associated with a structural shift in the workforce towards less productive workers. Recent research shows that even when accounting for a greater presence of potentially less-productive workers, such as self-employed and part-time workers, can explain only a small fraction of the productivity puzzle (Dolphin and Hatfield, 2015).
• Understanding the influence of different types of skills on output and productivity is one of the main issues addressed by this study and an issue that has been little explored to date, particularly from a comparative point of view.
• We find that the measured contribution of high-level academic skills to aggregate growth is on the rise; this can be explained by the rapid increase in the proportion of workers holding university degrees, and a drop in those with low-level or no academic qualifications. This is observed at a more rapid pace in the UK than in other competitor economies.
• Against this, those type of qualifications with a more technical and vocational focus, appear to be losing ground in the UK; this is the case for both upper-intermediate
88

and lower-intermediate vocational qualifications which traditionally have been less intensively used in the UK than in Continental European countries.
• The incidence of other types of uncertified skills, represented here by employer-provided training, has worsened in the UK. This trend, however, cannot fully be linked to spending cuts during the recession, as training has been declining in the UK at least for a decade. This is not much different to what has been observed in other European countries (e.g. France).
• Our econometric exercise has found evidence that the higher the share of workers in a particular country or industry with tertiary studies, the higher its productivity performance on average. We employ a classic production function framework and data for different industries, countries and periods of time, which includes the post-recession years.
• The econometric framework also allows us to explore the existence of indirect productivity effects, for example the existence of complementarities amongst different production inputs; we find that the returns associated with ICT investments are likely to be larger in those countries and/or industries with a higher endowment of university graduates.
• Our results point to the existence of additional productivity gains associated with having a trained workforce. In addition to the more established relationship between high-skills and the ICT capital, we find evidence of positive productivity complementarities between high-level vocational qualifications and other types of intangible assets.
• In particular, we find evidence that on-the-job training yields additional returns in those countries and/or industries with larger pool of workers with upper-intermediate qualifications. This finding highlights the importance of training workers for achieving sustained productivity in the knowledge economy.
6. Conclusions Over the past decades most countries have experienced a remarkable expansion of their education and skill base. In the UK, the improvement in workforce skills contributed to one-fifth of UK's annual labour productivity growth in the late 1990s and early 2000s. During this expansionary period, the number of UK workers with high-level academic degrees increased at a faster rate in the UK than in other major countries. The widespread diffusion of ICTs along with the surge in complementary investments are believed to have played a major part in the realisation of large productivity gains. While this phenomenon was observed a little later in the UK than in the US and other countries at frontier of the ICT revolution, the productivity growth rates achieved in the UK exceeded those in many other economies before the onset of recession. As a result, during this period the long-standing productivity gap of the UK relative to major European countries was narrowed significantly.
89

Since the global financial crisis, however, this pattern of convergence has come to a halt. European countries have suffered a major productivity slowdown, in contrast with the more stable productivity record of the US. The declining productivity in the UK seems of particular concern and has highlighted the existence of structural productivity problems, as well as potential measurement issues. Despite the aggregate disappointing productivity performance, the on-going improvement in the level of education of the UK's workforce is a significant finding. Skills have continue to foster productivity growth throughout the different phases of the economic cycle. The contribution rose sharply during the first years of the recession and stands currently at levels similar to the pre-crisis period. The contributions made by different types of qualifications are also evolving. High-skilled workers make the largest contribution to labour productivity growth and this trend is on the rise. These developments resemble those observed in the other major developed economies, such as the US and France. Possibly related to the increase in the supply of highly qualified workers, we have also seen small decreases in the relative graduate wage premiums. This is consistent with the fact that slightly more graduates may be taking on roles with lesser qualification requirements. Over the past few years, there has been significantly more research devoted to the study of the relationship between graduate qualifications and economies' aggregate growth outcomes. However, the role of less academic type of skills in raising productivity has traditionally been overlooked. In this study, we go a step beyond this and distinguish the contribution of vocational qualifications from other qualifications. In particular we show here that the aggregate contribution of upper-intermediate vocational skills continues to deteriorate in the UK, compared with other countries where the demand for this type of qualifications has traditionally been higher than in the UK. Using a range of econometric analysis techniques we also find, in line with prior expectations, evidence of a positive link between high skills and productivity outcomes. In addition to this link, we find evidence of lesser known complementarities between a wider range of skills and intangible assets. Recent studies show that much of the empirical evidence on the complementarities between skills, ICTs and innovation emphasizes the role of high-level skills (e,g of university graduates) rather than intermediate vocational skills (technicians, craft workers and other employees with qualifications below university graduate level). However, intermediate vocational skills can also contribute to the effective use of these technologies by helping to enhance the absorptive capacity which firms require to make effective use of knowledge, ideas and technologies generated outside their own organizations (Mason et al., 2014). Overall the econometric results suggest that having a highly skilled workforce (either with degree level or upper intermediate qualifications) is important when combined with investment in intangible assets such as training and innovative property. This is consistent with the idea that the use of information technology, which increasingly is associated with complementary investments in intangible assets, is relatively skill intensive. Our results suggest that the skill bias of new technology carries over to the period directly following the crisis. However the small sample sizes warn against drawing too firm conclusions and further work is required, especially including the recovery period.
90

7. References Acemoglu, D., Aghion, P. and F. Zilibotti (2006), "Distance to frontier, selection, and
economic growth", Journal of the European Economic Association, 4, 1: 37-74.
Aghion, P., Boustan, L., Hoxby, C. and J. Vandenbussche (2009), “The causal impact of education on economic growth: evidence from the US”, Brookings Papers on Economic Activity (conference draft).
Bank of England (2014), "The UK productivity puzzle: an international perspective", Speech by M. Weale, External Member of the Monetary Policy Committee December 2014.
Barro, R. and J. Lee (2010), “A new dataset of educational attainment in the world, 1950-2010”, NBER Working Paper 15902.
Basu, S., Fernald, J.G., Oulton, N. and S. Srinivasan (2003), “The case of the missing productivity growth: Or, does information technology explain why productivity accelerated in the US but not the UK?”, NBER Working Paper 10010, National Bureau of Economic Research, Inc.
Bayo-Moriones, A. and F. Lera-López, (2007) “A firm-level analysis of determinants of ICT adoption in Spain”, Technovation, 27, 6-7: 352-366.
Benhabib J. and M. Spiegel (1994), “The role of human capital in economic development: evidence from aggregate cross-country data” Journal of Monetary Economics, 34: 143-173.
Benhabib, J. and M. Spiegel (2005), “Human capital and technology diffusion”, 935-966 in P. Aghion and S. Durlauf (eds) Handbook of Economic Growth, Elsevier.
Bloom N., Lemos, S., Sadun, R., Scur, D. and J. Van Reenen (2014), “The new empirical economics of management”, CEP Occasional Paper No. 41, London: London School of Economics.
Blundell, R., Crawford, C. and W.Jin (2014), “What can wages and employment tell us about the UK’s productivity puzzle”, The Economic Journal, 124 (May), 377-407.
Bosworth, B.P. and J.E. Triplett (2007), “The Early 21st Century productivity expansion is still in services.” International Productivity Monitor, no. 14 (Spring): 3-19.
Bosworth, D.L. (2014), “UK skill levels and international competitiveness 2013”, Evidence Report No. 85, UK Comission for Employment and Skills, August.
Brandenburg, B., Gunther, J. and L. Schneider (2007), “Does qualification drive innovation? A micro-econometric analysis using linked employer-employer data”, IWH discussion papers No 10, Halle: Halle Institute for Economic Research.
91

Bresnahan,T., Brynjolfsson, E. and L. Hitt (2002), “Information technology, workplace organisation, and the demand for skilled labour: firm-level evidence”, Quarterly Journal of Economics, 117, 1: 339-376.
Broadberry, S. and M. O’Mahony (2005), “Britain’s twentieth century productivity performance in international perspective”, in Crafts N et al. (eds) Work and Pay in 20th Century Britain.
Carnegie Foundation for the Advancement of Teaching (2005), Carnegie Classification of Institutions of Higher Education. http://www.carnegiefoundation.org/classifications.
Corrado, C., Hulten, and D. Sichel (2005), “Measuring capital and technology: an expanded framework”, In C. Corrado, J. Haltiwanger and D. Sichel (eds), Measuring Capital in the New Economy, The University of Chicago Press, 11-46.
Corrado, C., Haskel, J., Jona-Lasinio, C. and M. Iommi (2012), "Intangible capital and growth in advanced economies: measurement methods and comparative results", INTAN-Invest Working Paper, June.
Corrado, C., J. Haskel, C. Jona-Lasinio, and M. Iommi (2013), “Innovation and intangible investment in Europe, Japan, and the United States”, Oxford Review of Economic Policy 29 (2), 261-286.
Corrado, C., Haskel, J. and C. Jona-Lasinio (2014), “Knowledge Spillovers, ICT and productivity growth”, Discussion Paper 2014/5, Imperical College London Business School.
Crafts, N. (2012), “British relative economic decline revisited: the role of competition”, Explorations in Economic History, 49(1), 17–29.
Dal Borgo, M., Goodridge, P., Haskel, J. and A. Pesole (2013), “Productivity and growth in UK industries: an intangible investment approach”, Oxford Bulletin of Economics and Statistics, 75, 6: 806-834.
Dolphin, T., and I. Hatfield (2015), "The missing pieces: Solving Britain's productivity
puzzle", Institute of Public Policy Research Report.
Dorsett, R., Lui, S. and M. Weale (2010), “Economic benefits of lifelong learning”, LLAKES Research Paper No. 13.
Dorsett R., Lui, S. and M. Weale (2011), “Estimating the effect of lifelong learning on women’s earnings using a switching model”, LLAKES Research Paper No. 30.
Felstead, A., Gallie, D., Green, F. and H.Inanc (2013), Skills at Work in Britain: First Findings from the 2012 Skills and Employment Survey.
Foster, N., Poschl, J., Rincon-Aznar, A., Stehrer, R., Vecchi, M. and F. Venturini (2013), “Reducing productivity and efficiency gaps: The role of knowledge assets, absorptive
92

capacity and institutions”, Research Report No. 396, the Vienna Institute for International Economic Studies (WIIW).
Fraumeni, B. and G. Liu (2015), “Human capital: country estimates using alternative approaches”, Chapter 4 in UNEP and UNU-IHDP (eds) Inclusive Wealth Report 2014, Cambridge: Cambridge University Press.
Garrett R., Campbell, M. and G. Mason (2010), The Value of Skills, UKCES Evidence Report No. 22.
Goodridge, P., Haskel, J. and G. Wallis (2014), “The UK productivity puzzle is a TFP puzzle: current data and future predications”, Discussion Paper 2014/9, Imperial College Business School.
Green, F. and Y. Zhu (2010),“Overqualification, job dissatisfaction and increasing dispersion in the returns to graduate education”, Oxford Economic Papers, 62(4), 715-739.
Green, F., Felstead, A., Gallie, D., Inanc, H. and N. Jewson (2013), “What Has Been Happening to the Training of British Workers?”, published by the Centre for Learning and Life Chances in Knowledge Economies and Societies at: http://www.llakes.org
Green, F. and G. Mason (2015), “Skills and training for a more innovation-intensive economy”, in D. Bailey, K. Cowling and P. Tomlinson (eds), New Perspectives on Industrial Policy for a Modern Britain, Oxford: Oxford University Press.
Griffith R., Redding, S. and J. Van Reenen (2004), “Mapping the two faces of R&D: productivity growth in a panel of OECD industries”, Review of Economics and Statistics, 86, 4: 883-895.
Griliches, Z. (1980), "R&D and the productivity slowdown", NBER Working paper No. 434.
Gust, C. and J. Marquez (2004), “International comparisons of productivity growth: the role of information technology and regulatory practices”, Labour Economics, 11, 1: 33-58.
Hall, B. and J. Mairesse (1995), "Exploring the relationship between R&D and productivity in French manufacturing firms", Journal of Econometrics, 65 (1995), 263-293.
Hanushek, E. and L. Woessman (2012), "Do better schools lead to more growth: Cognitive skills economic outcomes and education", Journal of Economic Growth, 17: 267-321.
Hanushek, E., Schwerdt, G., Wiederhold, S., and L. Woessman (2013), “Returns to skills around the world: evidence from PIAAC”, NBER Working Paper No. 19762.
Harris, R. and J. Moffat (2014), “The UK Productivity Puzzle 2008-2012: Evidence Using Plant-level Estimates of Total Factor Productivity”, Durham University Business School mimeo.
93

Holland D., Liadze, I., Rienzo, C. and D.Wilkinson (2013), “The relationship between graduates and economic growth across countries”, BIS Research Paper No. 110.
Hollenstein, H. (2004), “Determinants of the adoption of information and communication technologies (ICT): an empirical analysis based on firm-level data for the Swiss business sector”, Structural Change and Economic Dynamics, 15, 3: 315-342.
Hughes, A. and J. Saleheen (2012), “UK labour productivity since the onset of the crisis - an international and historical perspective”, Bank of England Quarterly Bulletin, 2012 Q2, 138-146.
Jorgenson, D.W., Gollop, F.M. and B. Fraumeni (1987), Productivity and U.S. Economic Growth, Harvard Economic Studies, Cambridge, MA.
Jorgenson, D. (1991), "Productivity and economic growth", Chapter 3 in E Berndt and J Triplett (eds) Fifity Years of Economic Measurement: The Jubilee of the Conference on Research in Income and Wealth, University of Chicago Press.
Kang, L., O’Mahony, M. and F. Peng (2012), “New measures of workforce skills in the EU”, National Institute Economic Review, 220, R17-R28.
Keller, K. (2006), “Investment in primary, secondary and higher education and the effects on economic growth”, Contemporary Economic Policy, 24, 1: 18-34.
Krueger, A. and M. Lindahl (2001), “Education for growth: why and for whom?”, Journal of Economic Literature, 39, 4: 1101-1136.
Lucas, R. E., Jr. (1988), “On the Mechanics of Economic Development”, Journal of Monetary Economics (22 July), 3-42.
Lundvall, B-Å. (1992), National Systems of Innovation: Towards a Theory of Innovation and Interactive Learning, London: Pinter Publishers.
Machin, S. and J. Van Reenen (1998), "Technology and changes in skill structure: evidence from seven OECD Countries", Quarterly Journal of Economics, 113, 4: 1215-1244.
Mankiw, N.G., Romer, D. and D.N. Weil (1992), “A contribution to the empirics of economic growth”, The Quarterly Journal of Economics, Vol. 107, No. 2. (May, 1992), 407-437.
Mason, G., Beltramo J. and J. Paul (2004), “External knowledge sourcing in different national settings: a comparison of electronics establishments in Britain and France”, Research Policy, 33, 1: 53-72.
Mason, G., Vecchi, M. and B. O’Leary (2012), “Certified and uncertified skills and productivity growth performance”, Labour Economics, 19: 351-360.
94

Mason, G., Holland, D., Liadze, I., O’Mahony, M., Riley, R., and A. Rincon-Aznar (2014), “Macroeconomic benefits of vocational education and training”, Cedefop Research Paper No. 40.
Nelson, R. and E. Phelps (1966), “Investment in humans, technological diffusion, and economic growth” American Economic Review, 56: 69-75.
Niebel, T., O’Mahony, M. and M. Saam (2013), "The contributions of intangible assets to sectoral productivity growth – comparing growth accounting and econometric estimation", SERVICEGAP Discussion Paper 39.
Nordhaus, W. D. (2002), “Productivity growth and the New Economy”, Brookings Papers on Economic Activity, Economic Studies Program, The Brookings Institution, vol. 33(2), 211-265.
OECD (2002), Education at a Glance 2002: OECD Indicators, Paris: OECD.
OECD (2009), "Measuring productivity: OECD Manual Measurement of aggregate and industry level productivity growth", OECD publishing.
OECD (2010), “The high cost of low educational performance: the long-run economic impact of improving PISA Outcomes”, Paris: OECD.
OECD (2012), OECD Compendiumof Productivity Indicators 2012, Paris.
OECD (2013), OECD Skills Outlook 2013: First Results from the Survey of Adult Skills, Paris: OECD.
OECD (2014), Education at a Glance 2014: OECD Indicators, Paris: OECD.
Oliner, S. D., Sichel, D.l. E. and K. Stiroh (2008), "Explaining a productive decade", Journal of Policy Modeling, Elsevier, vol. 30(4), 633-673.
O’Mahony, M. (2012a), “Human capital formation and continuous training: evidence for EU countries”, INDICSER Discussion Paper No. 1.
O’Mahony, M. (2012b), “Human capital formation and continuous training: evidence for EU countries”, Review of Income and Wealth, volume 58, issue 3, 531-549, September.
O’Mahony, M. and R. Riley (2012), “Human capital spillovers: the importance of training”, INDICSER Discussion Paper No. 23.
O’Mahony and M. P. Timmer (2009), “Output, input and productivity measures at the industry Level: The EU KLEMS Database”, Economic Journal, Royal Economic Society, vol. 119 (538), pages 374-403, 06.
O'Mahony, M. and M. Vecchi (2005), “Quantifying the impact of ICT capital on output growth: A heterogeneous dynamic panel approach”, Economica, London School of Economics and Political Science, vol. 72(288) ,615-633, November.
95

ONS (2014), International Comparisons of Productivity – First Estimates 2013, London: Office for National Statistics.
Pawson, R., Greenhalgh, T., Harvey, G. and K. Walshe (2004), “Realist synthesis: an introduction”, ESRC Research Methods Programme - Methods Paper 2/2004.
Quintini, G. (2011), “Over-qualified or under-skilled: A review of the existing literature”, OECD Social, Employment and Migration Working Paper No. 121, OECD Publilshing, Paris.
Riley, R. and C. Robinson (2011), “Skills and economic performance: the impact of intangible assets on UK productivity”, UKCES Evidence Report 39, London: UKCES.
Riley, R., Rosazza-Bondibene, C. and G. Young (2014), "Productivity dynamics in the Great stagnation: Evidence from british businesses", CFM Discussion Paper No. 2014-07.
Rinne, U. and K.F. Zimmerman (2011), “Another economic miracle? The German labour market and the Great Recession”, IZA Disussion Paper No. 6250.
Romer, P. (1986), "Increasing returns and long run economic growth", Journal of Political Economy, 94, 5: 1002–37.
Romer, P. (1990), "Endogenous technological change", Journal of Political Economy, 98, 5: S71-S102.
Sena, V., and D. Añon Higon (2014), “Productivity, R&D spillovers and educational attainment”, Oxford Bulletin of Economics and Statistics, 76, 1: 1-23.
Sianesi, B. and J. Van Reenen (2003), “The returns to education – macroeconomics”, Journal of Economic Surveys, 17, 2.
Solow, R. (1957), “Technical change and the aggregate production function”, Review of Economics and Statistics, 39, 3: 312-320.
Timmer, M.P., Inklaar, R., O'Mahony, M. and B. van Ark (2010), Economic Growth in Europe, Cambridge Books, Cambridge University Press, November.
Timmer, M., Moergastel, T, Stuivenwold, E., Ypma, G., O'Mahony M., and M. Kangasniemi (2007) EUKLEMS Growth and Productivity Accounts, Version 1.0. Part I: Methodology.
UKCES (2009), Ambition 2020: World Class Skills and Jobs for the UK. Wath-upon-Dearne: UK Commission for Employment and Skills.
UKCES (2014), The Labour Market Story: The State of UK Skills, Wath-upon-Dearne: UK Commission for Employment and Skills.
Van Ark, B. and R.C. Inklaar (2005), “Catching Up or Getting Stuck? Europe's Troubles to Exploit ICT's Productivity Potential”, Research Memorandum GD-79, Groningen Growth and Development Centre, September.
96

Van Reenen, J. (2013), “Productivity under the 1997-2010 Labour government”, Oxford Review of Economic Policy, 29, 1: 113-141.
Vandenbussche, J., Aghion, P. and C. Meghir (2006), "Growth, distance to frontier and composition of human capital", Journal of Economic Growth, 11, 2: 97–127.
Winters, J. (2015), “Do higher levels of education and skills in an area benefit wider society?”, IZA World of Labor, March.
97

Figure A.2.1. Labour productivity levels (GDP per person), 1995-2013.
Source: The Conference Board Total Economy Database (Updated Jan 2014). Note that the 2015 Annual Release of the Total Economy Database was only released in April 2015).
98

Table A.2.1. GDP per person, Average growth rates by sub-period, 1995-2013.
1995-2002
2003-2007
2008-2010
2011-2013
United Kingdom 2.1% 2.3% -1.2% 0.1% France 0.9% 1.3% -0.3% 0.5% Germany 1.0% 1.4% -0.7% 0.6% Netherlands 1.0% 1.7% -0.3% -0.1% Sweden 2.1% 2.8% 0.4% 0.7% Finland 2.0% 2.5% -1.7% 0.3% United States 2.3% 1.5% 1.4% 1.0%
Source: The Conference Board Total Economy Database (Updated Jan 2014); own calculations.
99
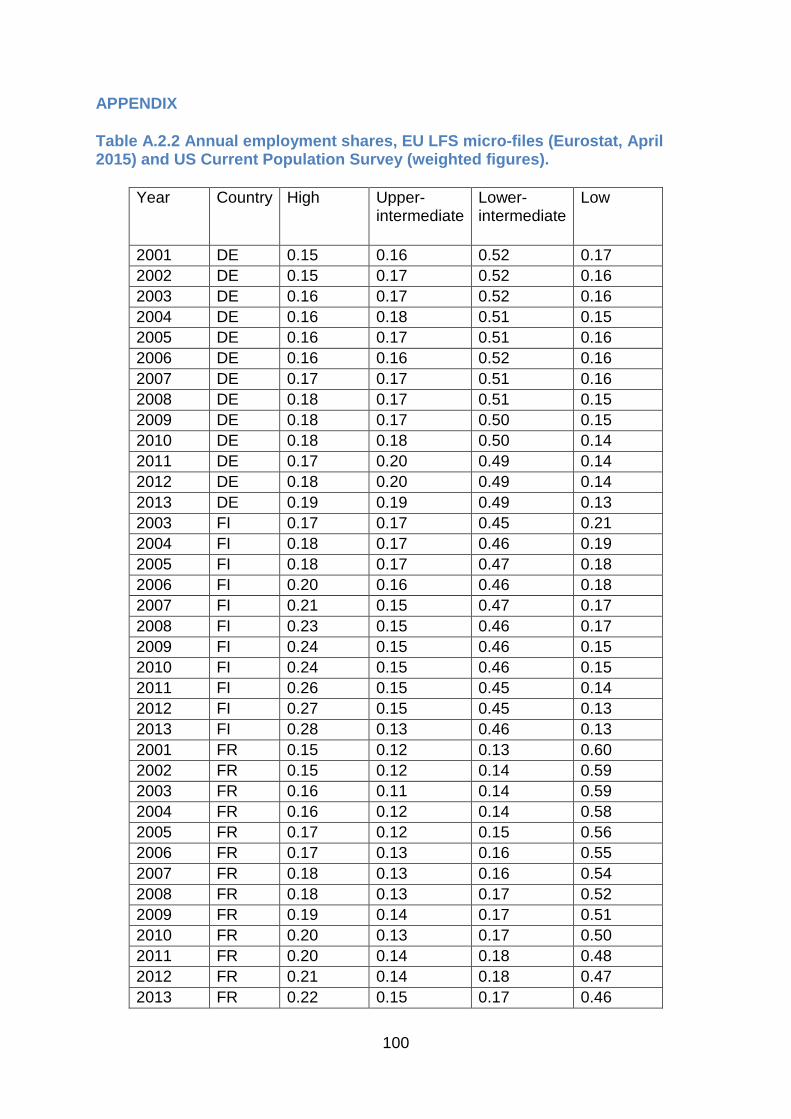
APPENDIX
Table A.2.2 Annual employment shares, EU LFS micro-files (Eurostat, April 2015) and US Current Population Survey (weighted figures).
Year Country High Upper-intermediate
Lower-intermediate
Low
2001 DE 0.15 0.16 0.52 0.17 2002 DE 0.15 0.17 0.52 0.16 2003 DE 0.16 0.17 0.52 0.16 2004 DE 0.16 0.18 0.51 0.15 2005 DE 0.16 0.17 0.51 0.16 2006 DE 0.16 0.16 0.52 0.16 2007 DE 0.17 0.17 0.51 0.16 2008 DE 0.18 0.17 0.51 0.15 2009 DE 0.18 0.17 0.50 0.15 2010 DE 0.18 0.18 0.50 0.14 2011 DE 0.17 0.20 0.49 0.14 2012 DE 0.18 0.20 0.49 0.14 2013 DE 0.19 0.19 0.49 0.13 2003 FI 0.17 0.17 0.45 0.21 2004 FI 0.18 0.17 0.46 0.19 2005 FI 0.18 0.17 0.47 0.18 2006 FI 0.20 0.16 0.46 0.18 2007 FI 0.21 0.15 0.47 0.17 2008 FI 0.23 0.15 0.46 0.17 2009 FI 0.24 0.15 0.46 0.15 2010 FI 0.24 0.15 0.46 0.15 2011 FI 0.26 0.15 0.45 0.14 2012 FI 0.27 0.15 0.45 0.13 2013 FI 0.28 0.13 0.46 0.13 2001 FR 0.15 0.12 0.13 0.60 2002 FR 0.15 0.12 0.14 0.59 2003 FR 0.16 0.11 0.14 0.59 2004 FR 0.16 0.12 0.14 0.58 2005 FR 0.17 0.12 0.15 0.56 2006 FR 0.17 0.13 0.16 0.55 2007 FR 0.18 0.13 0.16 0.54 2008 FR 0.18 0.13 0.17 0.52 2009 FR 0.19 0.14 0.17 0.51 2010 FR 0.20 0.13 0.17 0.50 2011 FR 0.20 0.14 0.18 0.48 2012 FR 0.21 0.14 0.18 0.47 2013 FR 0.22 0.15 0.17 0.46
100

Year Country High Upper-intermediate
Lower-intermediate
Low
2001 NL 0.22 0.08 0.21 0.50 2002 NL 0.22 0.08 0.21 0.49 2003 NL 0.25 0.07 0.23 0.46 2004 NL 0.27 0.06 0.25 0.42 2005 NL 0.29 0.05 0.26 0.40 2006 NL 0.28 0.05 0.25 0.42 2007 NL 0.29 0.05 0.26 0.41 2008 NL 0.29 0.06 0.25 0.41 2009 NL 0.30 0.05 0.25 0.40 2010 NL 0.30 0.05 0.26 0.38 2011 NL 0.30 0.05 0.26 0.38 2012 NL 0.31 0.05 0.26 0.38 2013 NL 0.32 0.03 0.24 0.41 2006 SE 0.22 0.15 0.23 0.41 2007 SE 0.22 0.15 0.23 0.39 2008 SE 0.23 0.15 0.24 0.38 2009 SE 0.24 0.15 0.24 0.36 2010 SE 0.25 0.15 0.24 0.35 2011 SE 0.26 0.16 0.25 0.34 2012 SE 0.26 0.16 0.24 0.33 2013 SE 0.28 0.17 0.25 0.31 2001 UK 0.20 0.09 0.18 0.52 2002 UK 0.21 0.09 0.19 0.50 2003 UK 0.22 0.10 0.20 0.49 2004 UK 0.23 0.10 0.19 0.49 2005 UK 0.23 0.10 0.20 0.47 2006 UK 0.25 0.10 0.20 0.46 2007 UK 0.26 0.10 0.20 0.44 2008 UK 0.26 0.09 0.19 0.46 2009 UK 0.28 0.10 0.19 0.43 2010 UK 0.29 0.10 0.19 0.42 2011 UK 0.25 0.16 0.19 0.40 2012 UK 0.26 0.16 0.20 0.38 2013 UK 0.27 0.16 0.19 0.38 1999 US 0.27 0.18 0.42 0.13 2000 US 0.28 0.19 0.41 0.13 2001 US 0.28 0.19 0.41 0.12 2002 US 0.29 0.19 0.40 0.12 2003 US 0.29 0.19 0.40 0.12 2004 US 0.30 0.19 0.40 0.12 2005 US 0.30 0.19 0.39 0.12 2006 US 0.30 0.19 0.39 0.12
101

Year Country High Upper-intermediate
Lower-intermediate
Low
2007 US 0.31 0.19 0.39 0.11 2008 US 0.32 0.19 0.38 0.10 2009 US 0.33 0.20 0.38 0.10 2010 US 0.33 0.20 0.38 0.09 2011 US 0.34 0.20 0.37 0.09 2012 US 0.34 0.20 0.37 0.09 2013 US 0.35 0.20 0.36 0.09
Note: DE=Germany, FI=Finland, FR=France, NL=Netherlands, SE=Sweden, UK=United Kingdom, US=United States.
102

Table A.2.3. Annual employment shares, Five groups, UK Labour Force Survey (population-weighted figures), 2001-2013.
Year Graduates Upper-intermediate
Lower- intermediate vocational
Lower- intermediate general
Low-skilled
2001 0.21 0.11 0.16 0.09 0.43 2002 0.21 0.11 0.17 0.10 0.42 2003 0.22 0.12 0.16 0.09 0.41 2004 0.23 0.11 0.15 0.10 0.40 2005 0.25 0.11 0.16 0.10 0.39 2006 0.26 0.11 0.15 0.09 0.39 2007 0.26 0.12 0.16 0.10 0.37 2008 0.27 0.11 0.15 0.10 0.37 2009 0.29 0.12 0.16 0.09 0.35 2010 0.30 0.12 0.16 0.09 0.33 2011 0.30 0.11 0.16 0.10 0.33 2012 0.33 0.11 0.15 0.09 0.31 2013 0.34 0.11 0.15 0.10 0.30
103

Table A.2.4. UK Average gross hourly earnings (£), UK Labour Force Survey (weighted figures), 2001-2013.
Graduates Upper intermediate
Lower intermediate vocational
Lower intermediate general
Low-skilled
2001 14.68 11.26 8.52 9.03 6.98 2002 15.12 11.25 8.70 9.12 7.24 2003 15.66 11.50 8.94 9.34 7.39 2004 15.55 11.86 9.41 9.62 7.66 2005 15.99 12.22 9.64 9.94 8.15 2006 16.69 12.39 9.93 10.21 8.37 2007 16.88 12.89 10.29 10.43 8.70 2008 17.53 13.70 10.72 10.66 9.22 2009 17.96 13.58 10.74 11.07 9.12 2010 17.99 13.74 10.74 10.93 9.25 2011 17.85 13.76 10.82 11.32 9.33 2012 18.05 13.86 11.01 11.70 9.45 2013 18.06 13.81 10.58 11.59 9.51
104

Figure A.2.2. Average hourly earnings in France, by skill group, Structure of Earnings Survey.
Source: Structure of Earnings Survey, Eurostat.
Figure A.2.3. Average hourly earnings in Germany, by skill group, Structure of Earnings Survey.
Source: German Socio-Economic Panel, Structure of Earnings Survey (2006), own calculations.
105
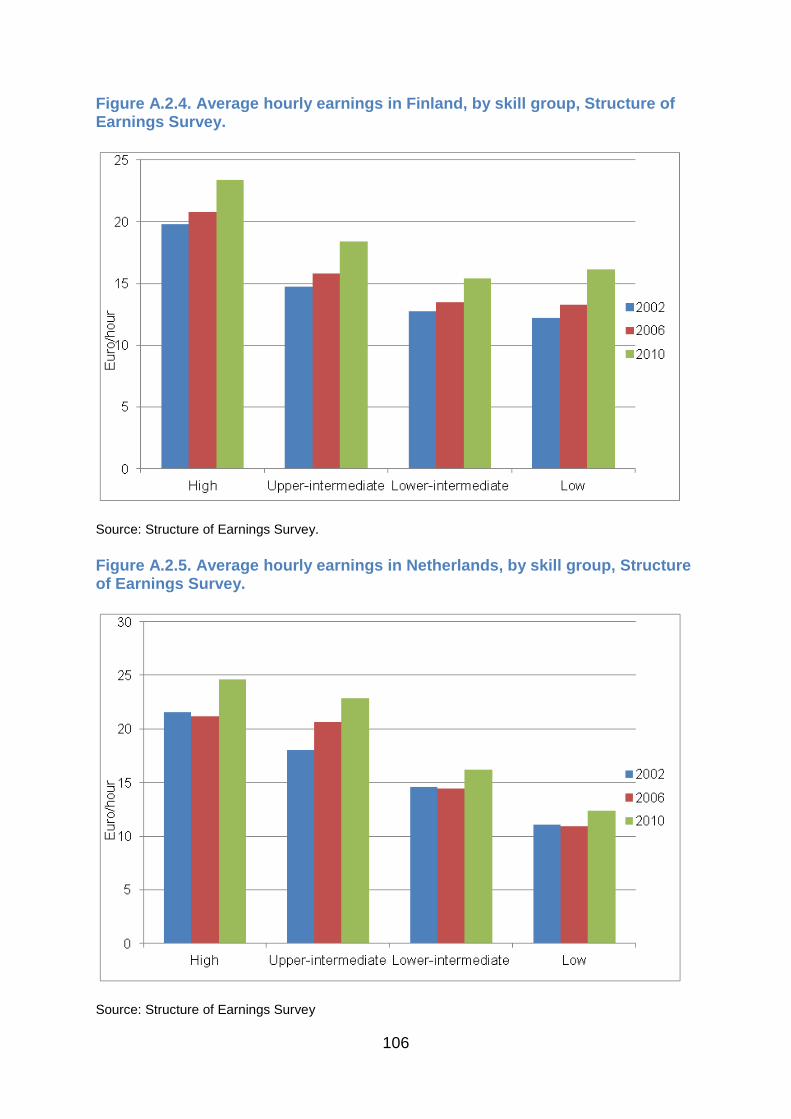
Figure A.2.4. Average hourly earnings in Finland, by skill group, Structure of Earnings Survey.
Source: Structure of Earnings Survey.
Figure A.2.5. Average hourly earnings in Netherlands, by skill group, Structure of Earnings Survey.
Source: Structure of Earnings Survey
106
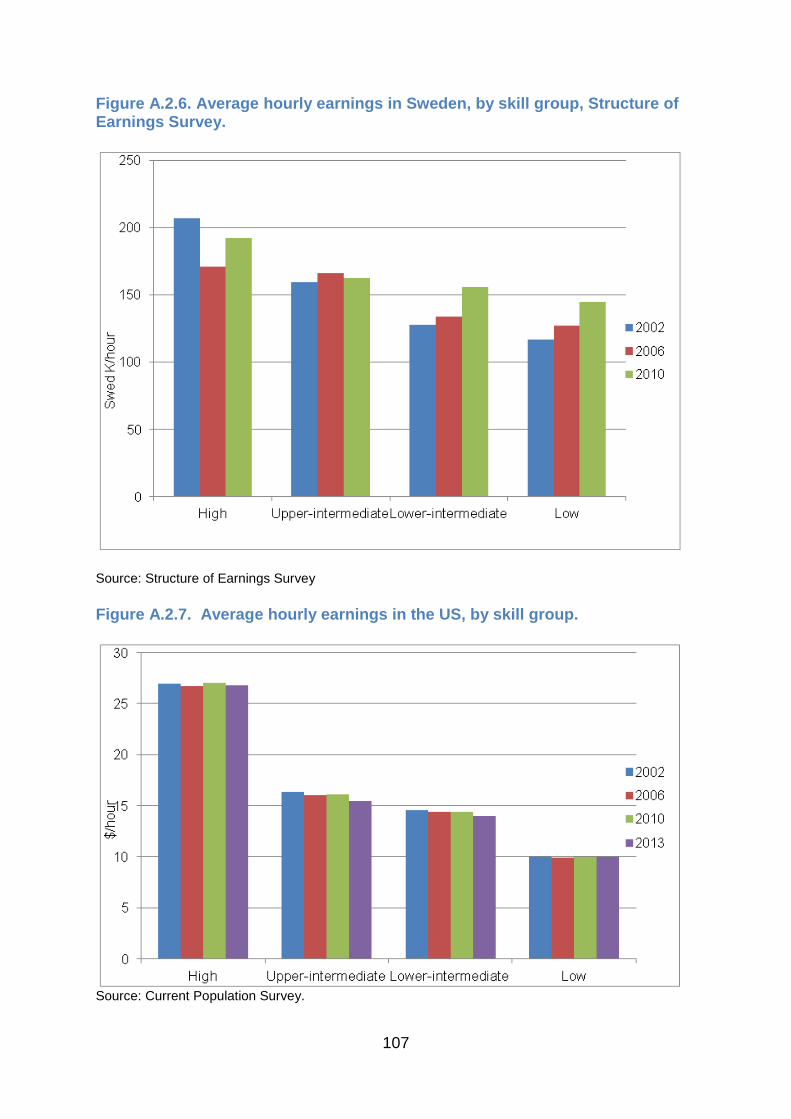
Figure A.2.6. Average hourly earnings in Sweden, by skill group, Structure of Earnings Survey.
Source: Structure of Earnings Survey
Figure A.2.7. Average hourly earnings in the US, by skill group.
Source: Current Population Survey.
107

Table A.2.5 Average hourly earnings, Structure of Earnings Survey, UK Labour Force Survey and US Current Population Survey (weighted figures)52.
Year country High-skilled Upper-intermediate
Lower-intermediate
Low-skilled
2002 DE 24.48 18.90 15.00 9.83 2003 DE 26.23 19.83 15.73 10.52 2004 DE 26.45 20.34 16.14 9.92 2005 DE 26.37 20.24 16.06 10.35 2006 DE 27.02 19.90 15.79 10.13 2007 DE 26.92 19.49 15.47 10.24 2008 DE 27.00 19.73 15.66 10.12 2009 DE 27.01 19.89 15.78 9.82 2002 FI 19.79 14.71 12.75 12.19 2003 FI 20.03 14.99 12.93 12.46 2004 FI 20.28 15.26 13.12 12.73 2005 FI 20.52 15.54 13.30 13.00 2006 FI 20.76 15.81 13.49 13.27 2007 FI 21.42 16.46 13.97 13.98 2008 FI 22.07 17.10 14.44 14.69 2009 FI 22.73 17.74 14.92 15.40 2010 FI 23.39 18.39 15.40 16.11 2002 FR 29.69 18.65 14.46 12.55 2003 FR 28.69 18.67 14.94 12.96 2004 FR 27.70 18.70 15.41 13.38 2005 FR 26.71 18.72 15.89 13.80 2006 FR 25.71 18.75 16.36 14.22 2007 FR 25.47 18.56 16.10 14.07 2008 FR 25.23 18.37 15.83 13.92 2009 FR 24.99 18.18 15.56 13.77 2010 FR 24.75 17.99 15.29 13.63 2002 NL 21.56 18.02 14.57 11.09 2003 NL 21.46 18.67 14.55 11.05 2004 NL 21.36 19.31 14.52 11.02 2005 NL 21.27 19.96 14.50 10.99 2006 NL 21.17 20.61 14.47 10.96 2007 NL 22.03 21.16 14.91 11.31 2008 NL 22.88 21.72 15.35 11.66 2009 NL 23.74 22.27 15.78 12.01 2010 NL 24.59 22.82 16.22 12.37 2001 SE 206.88 159.36 127.84 116.90
52 The Structure of Earnings Survey covers the years 2002, 2006 and 2010. For the years in between, linear interpolation has been assumed.
108

Year country High-skilled Upper-intermediate
Lower-intermediate
Low-skilled
2002 SE 206.88 159.36 127.84 116.90 2003 SE 197.87 160.97 129.29 119.46 2004 SE 188.86 162.57 130.73 122.01 2005 SE 179.85 164.17 132.17 124.57 2006 SE 170.84 165.78 133.61 127.13 2007 SE 176.13 164.87 139.15 131.59 2008 SE 181.42 163.96 144.69 136.05 2009 SE 186.72 163.06 150.23 140.52 2010 SE 192.01 162.15 155.77 144.98 2001 UK 14.68 11.26 8.70 6.98 2002 UK 15.12 11.25 8.85 7.24 2003 UK 15.66 11.50 9.09 7.39 2004 UK 15.55 11.86 9.49 7.66 2005 UK 15.99 12.22 9.75 8.15 2006 UK 16.69 12.39 10.04 8.37 2007 UK 16.88 12.89 10.35 8.70 2008 UK 17.53 13.70 10.70 9.22 2009 UK 17.96 13.58 10.87 9.12 2010 UK 17.99 13.74 10.81 9.25 2011 UK 17.85 13.76 11.01 9.33 2012 UK 18.05 13.86 11.28 9.45 2013 UK 18.06 13.81 10.97 9.51 2001 US 26.59 17.23 14.38 9.81 2002 US 26.93 17.56 14.60 9.99 2003 US 26.81 17.63 14.62 10.09 2004 US 26.88 17.53 14.49 9.96 2005 US 26.88 17.26 14.41 9.90 2006 US 26.71 17.19 14.36 9.93 2007 US 27.12 17.49 14.42 10.11 2008 US 26.90 17.40 14.38 10.12 2009 US 27.10 17.68 14.59 10.34 2010 US 27.06 17.38 14.43 10.02 2011 US 26.75 17.07 14.22 10.14 2012 US 26.79 16.92 14.00 10.04 2013 US 26.76 16.68 13.96 10.00
Note: Average hourly earnings given in national currency. Euro/Hour for France (FR), Finland (FI), and Netherlands (NL); Pound/hour for United Kingdom(UK); Swedish Krona/Hour for Sweden (SE); Dollar/Hour for the United States (US); Wages for Germany only available up to 2009.
109

Table A.2.6. Growth accounting decomposition, 2002-2013 (three sub-periods).
United Kingdom France Germany Netherlands Sweden Finland United States GDP growth 2002-2007 3.09 1.81 1.39 1.97 3.26 4.11 2.66 2008-2010 -1.48 -0.52 -0.09 -0.14 0.19 -1.77 -0.22 2011-2013 0.86 0.74 1.45 -0.27 1.78 0.72 2.16 Contribution L quantity (%) 2002-2007 0.39 0.20 -0.15 0.13 1.96 0.79 0.57 2008-2010 -0.45 -0.23 0.12 -0.05 0.18 -0.43 -1.14 2011-2013 0.73 0.09 0.36 0.16 0.37 0.09 0.83 Contribution L Composition (%) 2002-2007 0.47 0.32 0.15 0.51 0.19 0.29 0.27 2008-2010 0.62 0.36 0.36 0.30 0.20 0.28 0.40 2011-2013 0.47 0.36 0.22 -0.20 0.19 0.30 0.25 Contribution ICT Capital (%) 2002-2007 0.47 0.19 0.29 0.30 0.62 0.55 0.43 2008-2010 0.14 0.09 0.33 0.19 0.49 0.44 0.36 2011-2013 0.31 0.19 0.52 0.23 0.66 0.36 0.37 Contribution Non-ICT Capital (%) 2002-2007 0.71 0.77 0.21 0.28 0.93 0.23 0.62 2008-2010 0.70 0.71 0.21 0.35 0.63 0.37 0.31 2011-2013 0.36 0.54 0.12 0.18 0.46 0.15 0.24 Training(%) 2002-2007 0.07 0.08 0.04 0.15 -0.08 0.08 . 2008-2010 0.02 -0.02 0.00 0.06 -0.05 0.04 . 2011-2013 -0.10 -0.02 0.00 0.05 0.01 0.06 . TFP (%) 2002-2007 0.98 0.25 0.85 0.60 -0.35 2.18 0.78 2008-2010 -2.51 -1.44 -1.12 -1.00 -1.25 -2.47 -0.14 2011-2013 -0.91 -0.41 0.22 -0.68 0.10 -0.25 0.46 Source: Conference Board's TED, UKLFS, EU LFS, own calculations.
110

Figure A.2.8. Growth contributions of labour, capital and productivity in United States (%), 1995-2013.
Source, TED, Current Population Survey, own calculations. Figure A.2.9. Growth contributions of labour, capital and productivity in France (%), 1995-2013.
Source, TED, EU LFS, SES, own calculations.
111

Figure A.2.10. Growth contributions of labour, capital and productivity in Germany (%), 1995-2013.
Source, TED,EU LFS, SES, own calculations.
Figure A.2.11. Growth contributions of labour, capital and productivity in Finland (%), 1995-2013.
Source, TED,EU LFS, SES, own calculations.
112
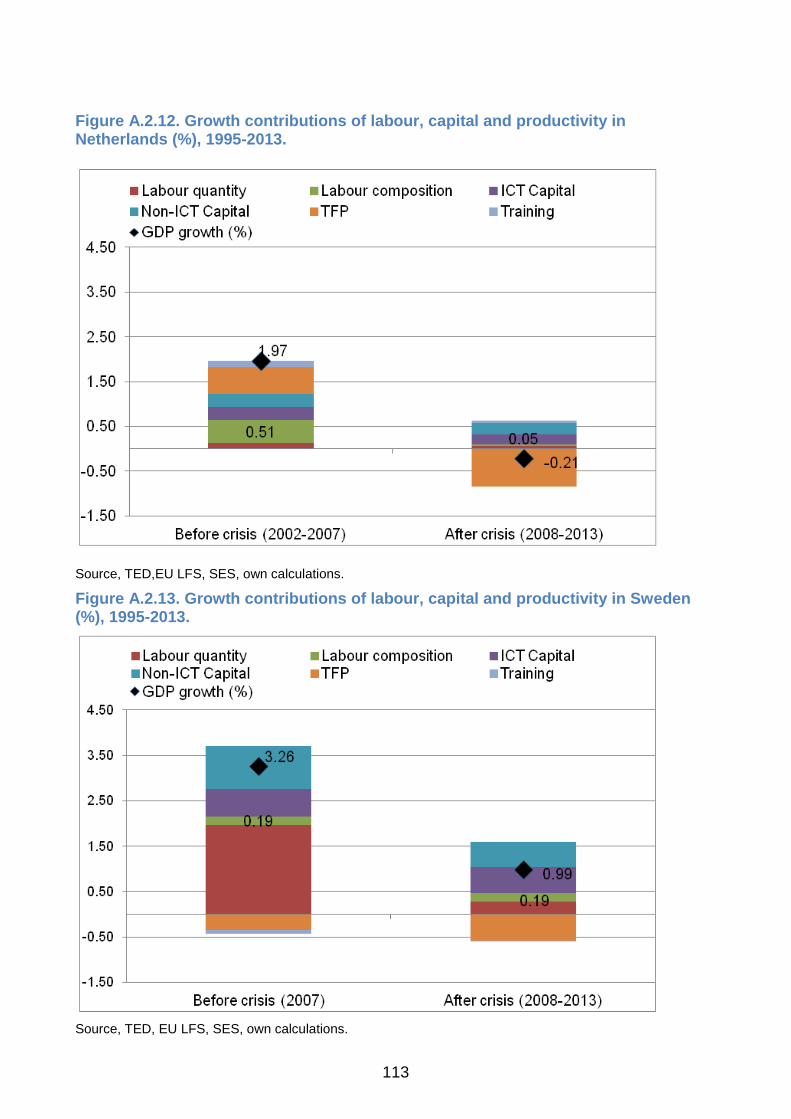
Figure A.2.12. Growth contributions of labour, capital and productivity in Netherlands (%), 1995-2013.
Source, TED,EU LFS, SES, own calculations.
Figure A.2.13. Growth contributions of labour, capital and productivity in Sweden (%), 1995-2013.
Source, TED, EU LFS, SES, own calculations.
113

Industries definition (NACE Rev. 2)
A Agriculture, forestry and fishing
B Mining and quarrying
C Manufacturing
D Electricity, gas, steam and air conditioning supply
E Water supply, sewerage, waste management and remediation activities
F Construction
G Wholesale and retail trade; repair of motor vehicles and motorcycles.
I Accommodation and food service activities
H Transportation and storage
J Information and communication
K Finance and insurance activities
L Real estate activities
M Professional, scientific and technical activities
N Administrative and support service activities
O Public administration and defence, compulsory social security
P Education
Q Human health and social work activities
R Arts, entertainment and recreation
S Other service activities
T Activities of households as employers, undifferentiated goods and services- producing activities of households for own use.
U Activities of extra-territorial organisations and bodies.
114

© Crown copyright 2015
You may re-use this information (not including logos) free of charge in any format or medium, under the terms of the Open Government Licence. Visit www.nationalarchives.gov.uk/doc/open-government-licence, write to the Information Policy Team, The National Archives, Kew, London TW9 4DU, or email: [email protected].
This publication available from www.gov.uk/bis
Any enquiries regarding this publication should be sent to:
Department for Business, Innovation and Skills 1 Victoria Street London SW1H 0ET Tel: 020 7215 5000 If you require this publication in an alternative format, email [email protected], or call 020 7215 5000. BIS/15/704
115