uk tax policy - institute for fiscal studies - ifs tax policy stuart adam ... 89 1990-91 1992-93...
TRANSCRIPT

UK tax policy Stuart Adam
© Institute for Fiscal Studies

Aims
• Describe the current UK tax system
• Historical and international context
• Recent policy developments and debates
• Strengths and weaknesses
© Institute for Fiscal Studies

Outline
• Revenues
• Tax policy
– Direct personal taxes
– Corporate income taxes
– Indirect taxes
– Property and local taxes
– Cross-cutting issues
• The tax policy-making process
Not going to talk (much) about welfare benefits
© Institute for Fiscal Studies

Useful links
• This presentation
– http://www.ifs.org.uk/publications/7378
• HM Revenue and Customs (HMRC) Statistics
– https://www.gov.uk/government/organisations/hm-revenue-customs/about/statistics
• HM Treasury
– https://www.gov.uk/government/organisations/hm-treasury
• Office for Budget Responsibility: official public finances monitor
– http://budgetresponsibility.org.uk/
• User-friendly facts and figures, Budget analysis, etc
– http://www.ifs.org.uk/tools_and_resources
• The Mirrlees Review of tax policy
– http://www.ifs.org.uk/publications/mirrleesreview
© Institute for Fiscal Studies

Some background
• Tax year runs from 6 April to 5 April
• Budgets usually in March (and Autumn Statements in Nov/Dec)
• Coalition government in office from May 2010 to May 2015
• Big government budget deficit following the 2008 crisis
– But mostly being closed by spending cuts, not tax increases
• Scotland’s independence referendum
© Institute for Fiscal Studies

UK government revenue
30%
32%
34%
36%
38%
40%
42%
44%
46% 1
97
8-7
9
19
80
-81
19
82
-83
19
84
-85
19
86
-87
19
88
-89
19
90
-91
19
92
-93
19
94
-95
19
96
-97
19
98
-99
20
00
-01
20
02
-03
20
04
-05
20
06
-07
20
08
-09
20
10
-11
20
12
-13
20
14
-15
20
16
-17
20
18
-19
% o
f G
DP
Total receipts
Net taxes and social security contributions
© Institute for Fiscal Studies Source: Office for Budget Responsibility

Tax revenue as a share of GDP
© Institute for Fiscal Studies Source: OECD.stat
0%
10%
20%
30%
40%
50%
60%
UK OECD USA Fra Ger Ita Jap Can Swe Ire Aus
1978 2011

© Institute for Fiscal Studies
Income tax 26%
National Insurance
17%
VAT 17%
Other indirect taxes 11%
Corporation tax 7%
Capital taxes 4%
Local (council) tax
4%
Other receipts
14%
Composition of revenue, 2014-15 forecast
Source: Office for Budget Responsibility
© Institute for Fiscal Studies
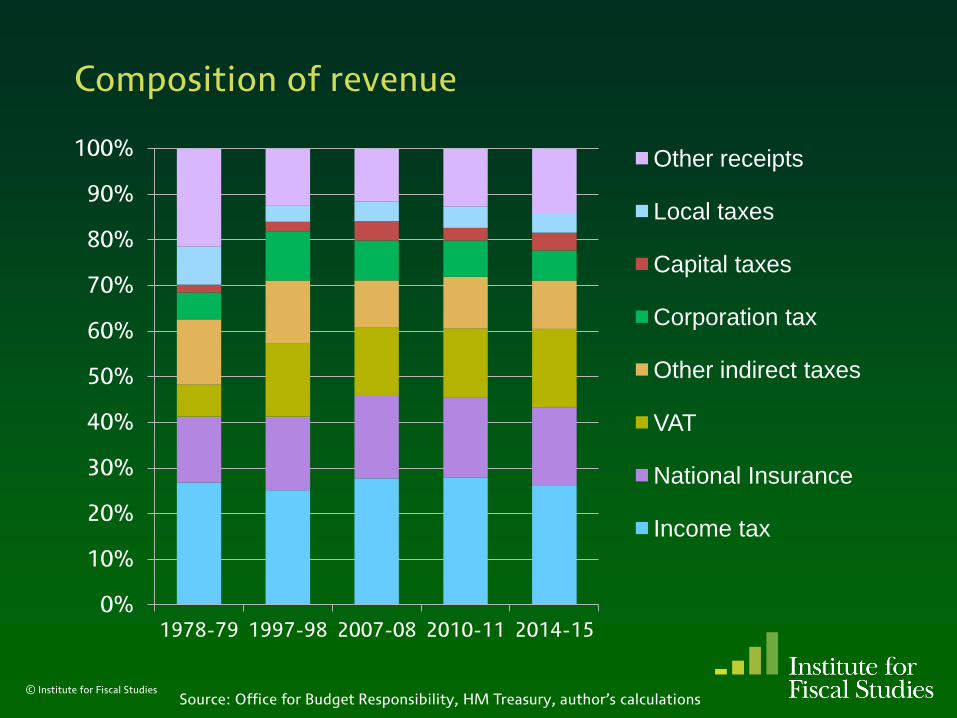
1978-79 1997-98 2007-08 2010-11 2014-15
0%
10%
20%
30%
40%
50%
60%
70%
80%
90%
100% Other receipts
Local taxes
Capital taxes
Corporation tax
Other indirect taxes
VAT
National Insurance
Income tax
Composition of revenue
Source: Office for Budget Responsibility, HM Treasury, author’s calculations

© Institute for Fiscal Studies
UK OECD USA Fra Ger Ita Jap Can Swe Ire Aus 0%
10%
20%
30%
40%
50%
60%
70%
80%
90%
100% Other taxes
Other capital taxes
Recurrent buildings taxes Corporation tax
Other indirect taxes
VAT/GST
SSCs + payroll tax
Income tax + CGT
Composition of tax revenue, 2011
Source: OECD.stat

© Institute for Fiscal Studies
Income tax schedule For earned income, April 2014 prices
0%
10%
20%
30%
40%
50%
60%
70%
80%
90%
£0 £25,000 £50,000 £75,000 £100,000 £125,000 £150,000 £175,000
Ma
rgin
al in
com
e t
ax r
ate
Income
1978-79
2009-10
2014-15

© Institute for Fiscal Studies
Income tax schedule For earned income, April 2014 prices
0%
10%
20%
30%
40%
50%
60%
70%
80%
90%
£0 £25,000 £50,000 £75,000 £100,000 £125,000 £150,000 £175,000
Ma
rgin
al in
com
e t
ax r
ate
Income
2009-10
2014-15
Recent reforms to the income tax schedule
• Personal allowance to reach £10,500 in 2015-16
– £2,855 higher than plans govt inherited – costs over £12 billion per year
– Basic-rate taxpayers gain £571 a year; 2.4 million taken out of income tax
© Institute for Fiscal Studies

Increasing the personal allowance Distributional impact of an increase from £10,000 to £12,500
© Institute for Fiscal Studies
0.0%
0.5%
1.0%
1.5%
2.0%
2.5%
Poorest 2 3 4 5 6 7 8 9 Richest All
Ch
an
ge
in
ne
t in
com
e
Income Decile Group
Assumes higher-rate threshold held constant.
Source: Figure 7.4 of The IFS Green Budget: February 2014

© Institute for Fiscal Studies
Income tax schedule For earned income, April 2014 prices
0%
10%
20%
30%
40%
50%
60%
70%
80%
90%
£0 £25,000 £50,000 £75,000 £100,000 £125,000 £150,000 £175,000
Ma
rgin
al in
com
e t
ax r
ate
Income
2009-10
2014-15

Recent reforms to the income tax schedule
• Personal allowance to reach £10,500 in 2015-16
– £2,855 higher than plans govt inherited – costs over £12 billion per year
– Basic-rate taxpayers gain £571 a year; 2.4 million taken out of income tax
• Higher-rate threshold will be £5,560 lower than plans inherited
– 1.4m more higher-rate taxpayers
© Institute for Fiscal Studies

Number of higher-rate taxpayers
0
1
2
3
4
5
6 1
97
8-7
9
19
80
-81
19
82
-83
19
84
-85
19
86
-87
19
88
-89
19
90
-91
19
92
-93
19
94
-95
19
96
-97
19
98
-99
20
00
-01
20
02
-03
20
04
-05
20
06
-07
20
08
-09
20
10
-11
20
12
-13
20
14
-15
Mil
lio
ns
© Institute for Fiscal Studies
Note: includes additional rate taxpayers.
Source: HMRC Statistics and IFS projections

© Institute for Fiscal Studies
Income tax schedule For earned income, April 2014 prices
0%
10%
20%
30%
40%
50%
60%
70%
80%
90%
£0 £25,000 £50,000 £75,000 £100,000 £125,000 £150,000 £175,000
Ma
rgin
al in
com
e t
ax r
ate
Income
2009-10
2014-15

Recent reforms to the income tax schedule
• Personal allowance to reach £10,500 in 2015-16
– £2,855 higher than plans govt inherited – costs over £12 billion per year
– Basic-rate taxpayers gain £571 a year; 2.4 million taken out of income tax
• Higher-rate threshold will be £5,560 lower than plans inherited
– 1.4m more higher-rate taxpayers
• 50% rate introduced above £150,000, then reduced to 45%
– The 1% of taxpayers affected provide 30% of income tax revenue
– Best guess is little revenue effect, but no-one really knows
© Institute for Fiscal Studies

Top tax rate and revenue: the government’s view
© Institute for Fiscal Studies
Source: HMRC (2012), The Exchequer effect of the 50 per cent additional rate of income tax

© Institute for Fiscal Studies
Income tax schedule For earned income, April 2014 prices
0%
10%
20%
30%
40%
50%
60%
70%
80%
90%
£0 £25,000 £50,000 £75,000 £100,000 £125,000 £150,000 £175,000
Ma
rgin
al in
com
e t
ax r
ate
Income
2009-10
2014-15

Recent reforms to the income tax schedule
• Personal allowance to reach £10,500 in 2015-16
– £2,855 higher than plans govt inherited – costs over £12 billion per year
– Basic-rate taxpayers gain £571 a year; 2.4 million taken out of income tax
• Higher-rate threshold will be £5,560 lower than plans inherited
– 1.4m more higher-rate taxpayers
• 50% rate introduced above £150,000, then reduced to 45%
– The 1% of taxpayers affected provide 30% of income tax revenue
– Best guess is little revenue effect, but no-one really knows
• Personal allowance gradually withdrawn once income exceeds £100k
– Equivalent to a 60% tax band – why not call it that?
– Bizarre shape for the rate schedule!
© Institute for Fiscal Studies

Income tax treatment of the family
• Shift from (largely) joint to individual taxation in 1990
– Part of an international trend
• Abolition of additional allowances for marriage and children
• Shift towards providing support for low-income families via tax credits
– 2003 tax credit reforms created big practical problems
• Tax credits now starting to be merged with several means-tested working-age benefits into a single ‘universal credit’
– But implementation problems running far behind schedule
• Income tax now starting to depend on family circumstances again
– Used to withdraw child benefit from those with high incomes
– 10% of tax allowance transferable to basic-rate spouse from April 2015
© Institute for Fiscal Studies

Collecting income tax
• 90% collected via Pay-As-You-Earn (PAYE)
– Exact cumulative deduction of tax by employers
– So two-thirds of taxpayers don’t fill in a tax return
– Unusual internationally
– Works well for most, but goes badly wrong for a sizeable minority
– Similar system withholds basic-rate tax from bank interest
• Self-assessment (tax returns) for those with more complex affairs
• Real-Time Information (RTI) reporting introduced in April 2013
– Employers must report salaries when paid, not at end of year
– Partly so government can use information to adjust benefit awards
– ‘Temporary’ easing of requirements for many small firms
© Institute for Fiscal Studies

National Insurance contributions (NICs)
• Simple rate schedule, applied to earnings only:
– Employers: 13.8% of earnings above £153 per week
– Employees: 12% between £153 and £805 per week; 2% above that
– Self-employed pay much less
• Since April 2014, each employer gets £2,000 deduction
• Just another income tax – not really social insurance
– Link between ‘contributions’ and benefits small and shrinking
– Could be transformed into a true social insurance scheme. Otherwise...
• Should be merged with income tax: a major simplification
• Not perceived as just another income tax – leads to bad policymaking
– Why increase income tax allowance but not NICs threshold?
– 2001 election: promised not to increase income tax, then increased NICs
© Institute for Fiscal Studies

Income tax and NICs treatment of saving
• By default, savings income subject to normal income tax, but not NICs
– Lower income tax on dividends, reflecting corporation tax already paid
• However...
• Individual Savings Accounts (ISAs) are tax-free
– Can put up to £15,000 per year into these, in cash or shares
• No tax on imputed income from owner-occupied housing
• Pensions:
– Income tax relief on contributions, up to a limit which has been reduced in recent years (NICs relief on employer contributions only)
– No tax on income within the fund
– Income tax (but not NICs) on money withdrawn except a 25% lump sum
• So in practice most savings are tax-free
– And pensions are subsidised in ill-designed ways
© Institute for Fiscal Studies

Capital gains tax
• Levied on gains above £11,000 realised in a particular year
• 18% for basic-rate taxpayers, 28% for higher-rate taxpayers
– Only 10% for first £10m of lifetime gains on owner-managed businesses
• Policy has gone round in circles
– Tension between encouraging investment and preventing avoidance
• Exemptions:
– Main homes, pensions, ISAs
– Any gains unrealised at death
© Institute for Fiscal Studies

Inheritance tax
• Levied at 40% on estates above £325,000
– Since 2007, any unused allowance passed to surviving spouse£650,000
• Threshold frozen from 2009-10 to 2017-18: 22% real-terms reduction
– Despite Prime Minister’s stated desire to increase the threshold
© Institute for Fiscal Studies

Inheritance tax
0
2
4
6
8
10
12
0.00
0.05
0.10
0.15
0.20
0.25
0.30 1
97
8-7
9
19
80
-81
19
82
-83
19
84
-85
19
86
-87
19
88
-89
19
90
-91
19
92
-93
19
94
-95
19
96
-97
19
98
-99
20
00
-01
20
02
-03
20
04
-05
20
06
-07
20
08
-09
20
10
-11
20
12
-13
20
14
-15
20
16
-17
20
18
-19
% o
f d
ea
ths
% o
f G
DP
Receipts as a share of national income (left axis)
Taxpayers as a share of deaths (right axis)
© Institute for Fiscal Studies Note: estates subject to inheritance tax, or capital transfer tax before 1986-87
Source: authors’ calculations based on data from HMRC, OBR and ONS

Inheritance tax
• Levied at 40% on estates above £325,000
– Since 2007, any unused allowance passed to surviving spouse£650,000
• Threshold frozen from 2009-10 to 2017-18: 22% real-terms reduction
– Despite Prime Minister’s stated desire to increase the threshold
• Gifts made in the seven years before death taxed on a sliding scale
– Gifts made earlier than that escape tax altogether
• Exemptions: spouse, charities; agricultural land, some business assets
• Easier to avoid for the very wealthy than the moderately wealthy
• Unpopular
• Should either abolish or transform into tax on lifetime receipts
– At the very least, remove some of most obvious avoidance opportunities
© Institute for Fiscal Studies

Corporation tax
• Revenue heavily reliant on a few big companies
– 390 companies (<0.1% of taxpayers) accounted for 45% of revenue in 2012-13
• Unusually, current government published a ‘corporate tax roadmap’ soon after taking office and has largely stuck to it
• Recently moved to exempting foreign-source income from tax
– Except some ‘passive’ income from low-taxed subsidiaries
• Concern over debt-equity bias, but little done about it
© Institute for Fiscal Studies

Corporation tax rates
© Institute for Fiscal Studies
0%
10%
20%
30%
40%
50%
60%
19
78
19
80
19
82
19
84
19
86
19
88
19
90
19
92
19
94
19
96
19
98
20
00
20
02
20
04
20
06
20
08
20
10
20
12
20
14
20
16
Main rate
Small profits rate
£8bn
per year
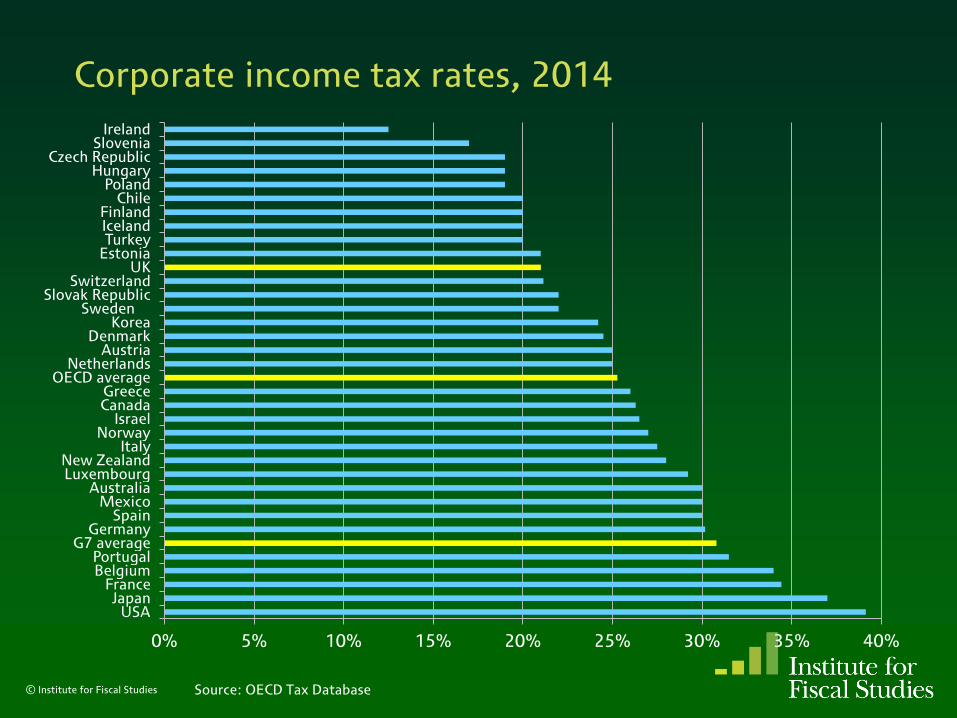
Corporate income tax rates, 2014
© Institute for Fiscal Studies
0% 5% 10% 15% 20% 25% 30% 35% 40%
Ireland Slovenia
Czech Republic Hungary
Poland Chile
Finland Iceland Turkey
Estonia UK
Switzerland Slovak Republic
Sweden Korea
Denmark Austria
Netherlands OECD average
Greece Canada
Israel Norway
Italy New Zealand Luxembourg
Australia Mexico
Spain Germany
G7 average Portugal Belgium
France Japan
USA
Source: OECD Tax Database

Corporation tax revenue, % of GDP
0.0%
0.5%
1.0%
1.5%
2.0%
2.5%
3.0%
3.5%
4.0% 1
97
8-7
9
19
80
-81
19
82
-83
19
84
-85
19
86
-87
19
88
-89
19
90
-91
19
92
-93
19
94
-95
19
96
-97
19
98
-99
20
00
-01
20
02
-03
20
04
-05
20
06
-07
20
08
-09
20
10
-11
20
12
-13
20
14
-15
20
16
-17
20
18
-19
© Institute for Fiscal Studies Sources: HM Treasury; Office for Budget Responsibility

Capital allowances for depreciation
• Allowances vary between asset classes
– Set down in law, not based on accounting depreciation
• Gradually made less generous
– In line with international trend towards broadening corporate tax base
– But UK’s allowances look stringent by international standards
© Institute for Fiscal Studies

Present value of capital allowances, 2012
© Institute for Fiscal Studies
0% 10% 20% 30% 40% 50% 60% 70% 80%
Greece Slovak Republic
Belgium Switzerland South Korea
Czech Republic Spain
France Portugal
Israel Luxembourg
Sweden Iceland Finland
Denmark Turkey
Italy OECD average
Mexico Australia Slovenia
Ireland Canada Austria
USA G7 average
Germany Hungary Norway Poland
Netherlands Japan
New Zealand UK
Chile
Note: weighted average of selected investments. See Bilicka and Devereux (2012),
CBT corporate tax ranking 2012 for details and other assumptions.

Effective average tax rates, 2012
© Institute for Fiscal Studies
0% 5% 10% 15% 20% 25% 30% 35% 40%
Ireland Slovenia
Slovak Republic Czech Republic
Greece Poland Turkey
Switzerland Iceland
South Korea Hungary
Netherlands Chile Israel
Austria Finland
Denmark OECD average
Italy Sweden
Luxembourg Canada
UK Portugal
New Zealand Norway Mexico
Australia Germany Belgium
G7 average France Spain
USA Japan
Note: weighted average of selected investments. See Bilicka and Devereux (2012),
CBT corporate tax ranking 2012 for details and other assumptions.

Effective marginal tax rates, 2012
© Institute for Fiscal Studies
-10% -5% 0% 5% 10% 15% 20% 25% 30%
Italy Greece
Switzerland South Korea
Ireland Slovak Republic
Netherlands Czech Republic
Turkey Slovenia
Poland Luxembourg
Iceland Israel
Hungary Austria
Belgium OECD average
Portugal Canada Sweden Finland
Denmark G7 average
Mexico France
Germany Spain
Australia Chile
New Zealand Norway
UK USA
Japan
Note: weighted average of selected investments. See Bilicka and Devereux (2012),
CBT corporate tax ranking 2012 for details and other assumptions.
Capital allowances for depreciation
• Allowances vary between asset classes
– Set down in law, not based on accounting depreciation
• Gradually made less generous
– In line with international trend towards broadening corporate tax base
– But UK’s allowances look stringent by international standards
• Since 2008, Annual Investment Allowance writes off some plant and machinery investment immediately
– Generally covers all plant and machinery investment for small firms
– Size of allowance has been very unstable
© Institute for Fiscal Studies

Annual investment allowance
© Institute for Fiscal Studies
£0
£50,000
£100,000
£150,000
£200,000
£250,000
£300,000
£350,000
£400,000
£450,000
£500,000
2007 2008 2009 2010 2011 2012 2013 2014 2015 2016 2017

Tax treatment of intellectual property
• R&D relief
– Introduced in April 2000 and expanded since
– Additional relief over and above deducting 100% of R&D expenditure
– More generous for small and medium-sized enterprises
• Patent Box
– 10% tax rate on income from (products incorporating) patents
– Being phased in from April 2013
– One of 14 European countries to introduce such a ‘box’ for IP
– May be well targeted at attracting mobile profits
– Not well targeted at stimulating innovation
– Big cost of apply to lots of income not generated by patent itself
– Scope to avoid tax by including patented items in products
© Institute for Fiscal Studies

North Sea tax revenue, % of GDP
0.0%
0.5%
1.0%
1.5%
2.0%
2.5%
3.0%
3.5%
4.0% 1
97
8-7
9
19
80
-81
19
82
-83
19
84
-85
19
86
-87
19
88
-89
19
90
-91
19
92
-93
19
94
-95
19
96
-97
19
98
-99
20
00
-01
20
02
-03
20
04
-05
20
06
-07
20
08
-09
20
10
-11
20
12
-13
20
14
-15
20
16
-17
20
18
-19
© Institute for Fiscal Studies Sources: HM Treasury; Office for Budget Responsibility
Tax treatment of North Sea oil & gas production
• Much higher rate of corporation tax, 62%
– Plus petroleum revenue tax 81% on profits from fields predating 1993
– More generous capital allowances, generally 100%
• Both high rate and 100% allowances make sense
– 100% allowances minimise discouragement to investment
– Oil and gas are in fixed location no need for rate to be competitive
• Policy in this area has been subject to frequent change
– Instability here especially undesirable given long planning horizons
• Review of policy currently under way
© Institute for Fiscal Studies

Base erosion and profit shifting (BEPS)
• A big political issue
– Public anger that some firms sell a lot in the UK but pay little CT
• No-one knows how much revenue is being lost
• UK is enthusiastic participant in OECD project to counter BEPS
– Tension with measures designed to attract profits to UK
• Likely to make some progress but not solve fundamental problem
– How much of a multinational’s profit derives from UK production?
– ‘Arm’s-length’ prices often not measurable
© Institute for Fiscal Studies

VAT
• The EU is a major player in VAT policy
– All member states must have a VAT
– Minimum 15% main rate
– Use of reduced rates restricted
– Scope of zero rates cannot be extended
– Various exemptions mandatory
– Standardised definitions, rules and procedures
• Still lots of scope for national variation within these boundaries
© Institute for Fiscal Studies

The main rate of VAT
© Institute for Fiscal Studies
0%
2%
4%
6%
8%
10%
12%
14%
16%
18%
20%
19
78
19
80
19
82
19
84
19
86
19
88
19
90
19
92
19
94
19
96
19
98
20
00
20
02
20
04
20
06
20
08
20
10
20
12
20
14
£13bn
per year
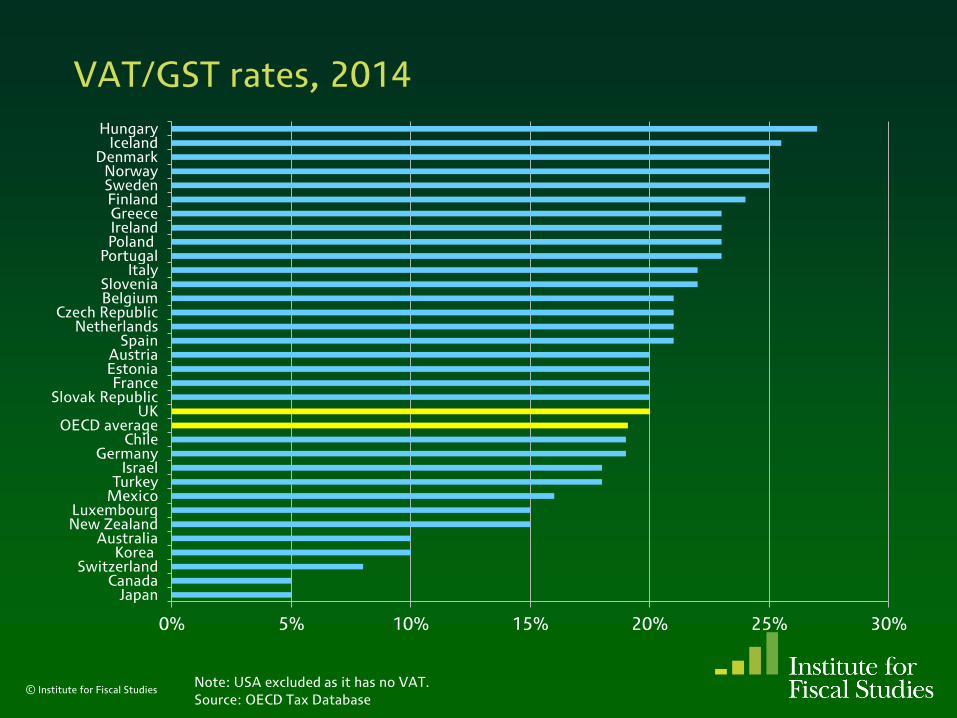
VAT/GST rates, 2014
© Institute for Fiscal Studies
0% 5% 10% 15% 20% 25% 30%
Hungary Iceland
Denmark Norway Sweden Finland Greece Ireland Poland
Portugal Italy
Slovenia Belgium
Czech Republic Netherlands
Spain Austria Estonia France
Slovak Republic UK
OECD average Chile
Germany Israel
Turkey Mexico
Luxembourg New Zealand
Australia Korea
Switzerland Canada
Japan
Note: USA excluded as it has no VAT.
Source: OECD Tax Database

The VAT base
• UK applies a zero rate to more items than almost any other country
– Most food, water, books, children’s clothes, transport, new housing…
– Cost £40bn in 2013-14 (vs. total VAT revenue of £107bn)
– A complex and distortionary way to achieve redistribution – can do better!
• Reduced rate of 5% applies principally to domestic fuel
– Looks particularly bad given environmental concerns
• Exemptions are the most damaging aspect of VAT
– VAT paid on inputs cannot be recovered distorts production patterns
– Principally financial services, public services and the public sector
– Mostly mandated by EU for practical reasons, but there are alternatives
– Effective exemption via high registration threshold (£81,000) more defensible
© Institute for Fiscal Studies

Estimated VAT ‘gaps’ across the EU, 2011 % of theoretical liabilities
© Institute for Fiscal Studies
0% 5% 10% 15% 20% 25% 30% 35% 40% 45% 50%
Romania
Latvia
Greece
Slovakia
Lithuania
Hungary
Czech Republic
Italy
Spain
EU average
France
Estonia
Luxembourg
Belgium
Portugal
Bulgaria
Poland
Finland
Austria
UK
Germany
Denmark
Ireland
Slovenia
Netherlands
Malta
Sweden
Source: CASE & CPB (2013), Study to quantify and analyse the VAT Gap in the EU-27 Member States

VAT revenue ratios, 2009 VAT revenue as % of (main rate x total consumption expenditure)
© Institute for Fiscal Studies
0%
10%
20%
30%
40%
50%
60%
70%
80%
90%
100%
Mex Spa Ita Fra Ire UK Aus OECD Ger Swe EU* Jap Lux NZ Cyp*
Sources: OECD Consumption Tax Trends 2012; Adam et al. (2011)
* 2008 figures

Other indirect taxes
• Alcohol and tobacco - £20.3bn
– Among the highest rates in the EU
© Institute for Fiscal Studies

Real-terms alcohol and tobacco duties (1978=100)
© Institute for Fiscal Studies
0
50
100
150
200
250
300
19
78
19
80
19
82
19
84
19
86
19
88
19
90
19
92
19
94
19
96
19
98
20
00
20
02
20
04
20
06
20
08
20
10
20
12
20
14
Cigarettes
Beer
Wine
Spirits

Other indirect taxes
• Alcohol and tobacco - £20.3bn
– Among the highest rates in the EU
• Betting - £2.3bn
• Road fuel - £26.8bn
© Institute for Fiscal Studies
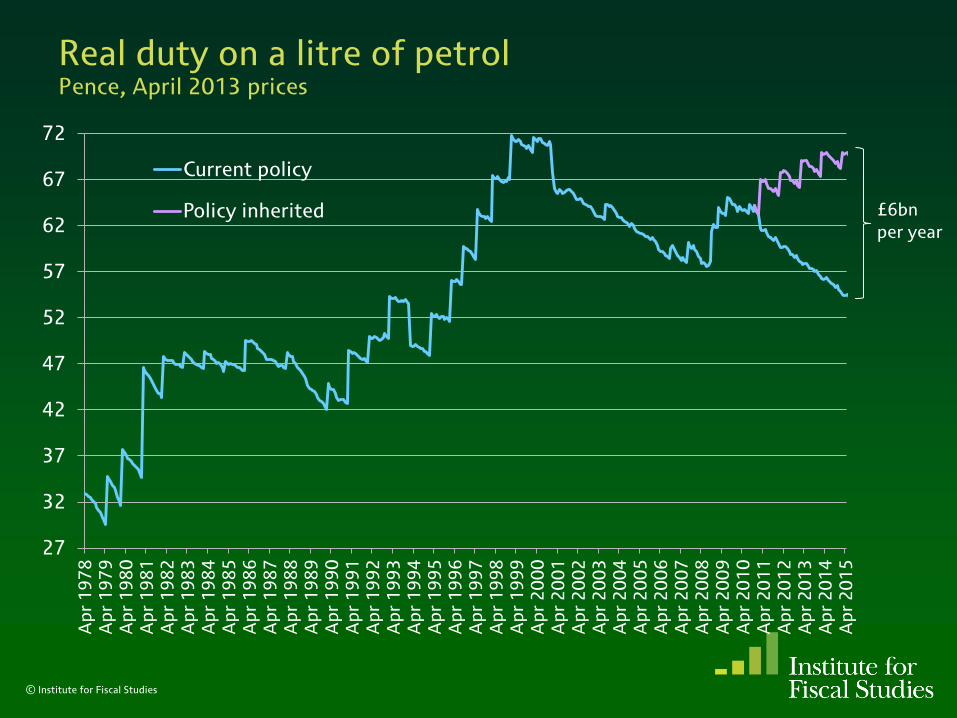
Real duty on a litre of petrol Pence, April 2013 prices
© Institute for Fiscal Studies
£6bn
per year
27
32
37
42
47
52
57
62
67
72
Ap
r 1
97
8
Ap
r 1
97
9
Ap
r 1
98
0
Ap
r 1
98
1
Ap
r 1
98
2
Ap
r 1
98
3
Ap
r 1
98
4
Ap
r 1
98
5
Ap
r 1
98
6
Ap
r 1
98
7
Ap
r 1
98
8
Ap
r 1
98
9
Ap
r 1
99
0
Ap
r 1
99
1
Ap
r 1
99
2
Ap
r 1
99
3
Ap
r 1
99
4
Ap
r 1
99
5
Ap
r 1
99
6
Ap
r 1
99
7
Ap
r 1
99
8
Ap
r 1
99
9
Ap
r 2
00
0
Ap
r 2
00
1
Ap
r 2
00
2
Ap
r 2
00
3
Ap
r 2
00
4
Ap
r 2
00
5
Ap
r 2
00
6
Ap
r 2
00
7
Ap
r 2
00
8
Ap
r 2
00
9
Ap
r 2
01
0
Ap
r 2
01
1
Ap
r 2
01
2
Ap
r 2
01
3
Ap
r 2
01
4
Ap
r 2
01
5
Current policy
Policy inherited

Fuel duty: to uprate or not to uprate?
© Institute for Fiscal Studies
Dates uprating
due before
Budget 2011
Budget
2011
Autumn
Statement
2011
June 2012
Autumn
Statement
2012
Budget
2013
Autumn
Statement
2013
Apr 2011
Apr 2012
Apr 2013
Apr 2014
Apr 2015
Apr 2016

Fuel duty: to uprate or not to uprate?
© Institute for Fiscal Studies
Dates uprating
due before
Budget 2011
Budget
2011
Autumn
Statement
2011
June 2012
Autumn
Statement
2012
Budget
2013
Autumn
Statement
2013
Apr 2011 Jan 2012
Apr 2012 Aug 2012
Apr 2013 Apr 2013
Apr 2014 Apr 2014
Apr 2015 Apr 2015
Apr 2016 Apr 2016

Fuel duty: to uprate or not to uprate?
© Institute for Fiscal Studies
Dates uprating
due before
Budget 2011
Budget
2011
Autumn
Statement
2011
June 2012
Autumn
Statement
2012
Budget
2013
Autumn
Statement
2013
Apr 2011 Jan 2012 Aug 2012
Apr 2012 Aug 2012 Cancelled
Apr 2013 Apr 2013 Apr 2013
Apr 2014 Apr 2014 Apr 2014
Apr 2015 Apr 2015 Apr 2015
Apr 2016 Apr 2016 Apr 2016

Fuel duty: to uprate or not to uprate?
© Institute for Fiscal Studies
Dates uprating
due before
Budget 2011
Budget
2011
Autumn
Statement
2011
June 2012
Autumn
Statement
2012
Budget
2013
Autumn
Statement
2013
Apr 2011 Jan 2012 Aug 2012 Jan 2013
Apr 2012 Aug 2012 Cancelled Cancelled
Apr 2013 Apr 2013 Apr 2013 Apr 2013
Apr 2014 Apr 2014 Apr 2014 Apr 2014
Apr 2015 Apr 2015 Apr 2015 Apr 2015
Apr 2016 Apr 2016 Apr 2016 Apr 2016

Fuel duty: to uprate or not to uprate?
© Institute for Fiscal Studies
Dates uprating
due before
Budget 2011
Budget
2011
Autumn
Statement
2011
June 2012
Autumn
Statement
2012
Budget
2013
Autumn
Statement
2013
Apr 2011 Jan 2012 Aug 2012 Jan 2013 Cancelled
Apr 2012 Aug 2012 Cancelled Cancelled Cancelled
Apr 2013 Apr 2013 Apr 2013 Apr 2013 Sep 2013
Apr 2014 Apr 2014 Apr 2014 Apr 2014 Sep 2014
Apr 2015 Apr 2015 Apr 2015 Apr 2015 Sep 2015
Apr 2016 Apr 2016 Apr 2016 Apr 2016 Apr 2016

Fuel duty: to uprate or not to uprate?
© Institute for Fiscal Studies
Dates uprating
due before
Budget 2011
Budget
2011
Autumn
Statement
2011
June 2012
Autumn
Statement
2012
Budget
2013
Autumn
Statement
2013
Apr 2011 Jan 2012 Aug 2012 Jan 2013 Cancelled Cancelled
Apr 2012 Aug 2012 Cancelled Cancelled Cancelled Cancelled
Apr 2013 Apr 2013 Apr 2013 Apr 2013 Sep 2013 Cancelled
Apr 2014 Apr 2014 Apr 2014 Apr 2014 Sep 2014 Sep 2014
Apr 2015 Apr 2015 Apr 2015 Apr 2015 Sep 2015 Sep 2015
Apr 2016 Apr 2016 Apr 2016 Apr 2016 Apr 2016 Apr 2016

Fuel duty: to uprate or not to uprate?
© Institute for Fiscal Studies
Dates uprating
due before
Budget 2011
Budget
2011
Autumn
Statement
2011
June 2012
Autumn
Statement
2012
Budget
2013
Autumn
Statement
2013
Apr 2011 Jan 2012 Aug 2012 Jan 2013 Cancelled Cancelled Cancelled
Apr 2012 Aug 2012 Cancelled Cancelled Cancelled Cancelled Cancelled
Apr 2013 Apr 2013 Apr 2013 Apr 2013 Sep 2013 Cancelled Cancelled
Apr 2014 Apr 2014 Apr 2014 Apr 2014 Sep 2014 Sep 2014 Cancelled
Apr 2015 Apr 2015 Apr 2015 Apr 2015 Sep 2015 Sep 2015 Sep 2015
Apr 2016 Apr 2016 Apr 2016 Apr 2016 Apr 2016 Apr 2016 Apr 2016

Other indirect taxes
• Alcohol and tobacco - £20.3bn
– Among the highest rates in the EU
• Betting - £2.3bn
• Road fuel - £26.8bn
– Big swings of direction; no clear policy
– Too high to reflect emissions; not well targeted at congestion
• Vehicle ownership - £5.9bn
• Small environmental taxes introduced more recently:
– Air passenger duty (1994) - £3.2bn
– Landfill tax (1996) - £1.3bn
– Climate change levy (2001) - £2.0bn
– Aggregates levy (2002) - £0.3bn
– London congestion charge (2003) - £0.2bn
© Institute for Fiscal Studies

Implicit carbon tax, 2013 £ per tonne CO2
© Institute for Fiscal Studies Source: Advani et al. (2013), Energy use policies and carbon pricing in the UK
-£20
-£10
£0
£10
£20
£30
£40
£50
£60
£70
£80
Household Small business Medium business Large energy-intensive business
Electricity Gas
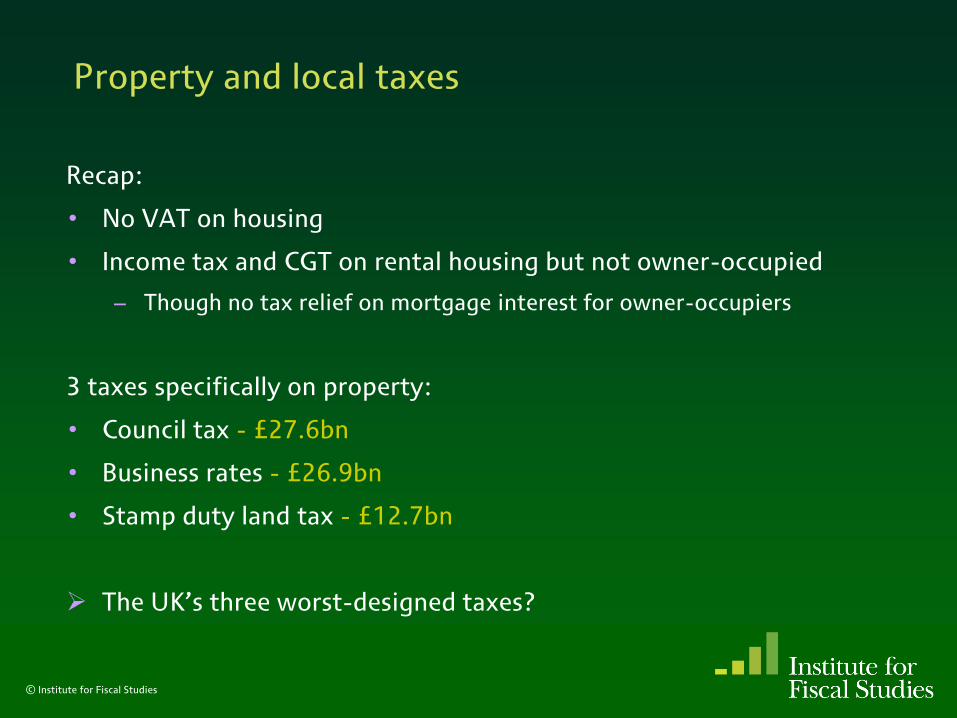
Property and local taxes
Recap:
• No VAT on housing
• Income tax and CGT on rental housing but not owner-occupied
– Though no tax relief on mortgage interest for owner-occupiers
3 taxes specifically on property:
• Council tax - £27.6bn
• Business rates - £26.9bn
• Stamp duty land tax - £12.7bn
The UK’s three worst-designed taxes?
© Institute for Fiscal Studies

Council tax
• Replaced the short-lived and massively unpopular ‘poll tax’ in 1993
• Central government sets structure; local authorities choose rate
– Though rises deemed ‘excessive’ by central govt now require referendum
© Institute for Fiscal Studies

© Institute for Fiscal Studies
Council tax, 2014-15 In English local authority setting England & Wales average Band D rate
£0
£500
£1,000
£1,500
£2,000
£2,500
£3,000
£0 £50,000 £100,000 £150,000 £200,000 £250,000 £300,000 £350,000 £400,000
Ta
x p
ay
ab
le
1991 property value

Council tax
• Replaced the short-lived and massively unpopular ‘poll tax’ in 1993
• Central government sets structure; local authorities choose rate
– Though rises deemed ‘excessive’ by central govt now require referendum
• Design has obvious weaknesses
– Still based on 1991 property values in England and Scotland
– Wide bands
– Regressive
– 25% discount for single occupancy
2 of 3 main parties now propose a ‘mansion tax’ – but better to fix CT
• Discounts for low-income families
– Working-age discounts localised in April 2013
• Unpopular
– Central govts incentivised cash freezes since 2010 (2007 in Scotland)
• Northern Ireland has different (more sensible) tax © Institute for Fiscal Studies

Receipts from recurrent taxes on non-domestic immovable property, 2011
© Institute for Fiscal Studies
* Data for 2010
Source: Figure 11.3, The IFS Green Budget 2014.
0 0.5 1 1.5 2
South Korea
Norway
Czech Republic
Austria
Mexico*
Germany
Slovakia
Finland
Slovenia
Belgium
Sweden
OECD average*
France
Netherlands*
Poland*
Australia*
United Kingdom
Israel
% of GDP

Business rates
• A percentage of estimated market rental value of properties
– 48.2% for high-rent properties in most of England & Scotland in 2014-15
– Reduced for low-rent properties
– Rise in average bills linked to RPI inflation – bills didn’t fall in recession
• Removed from local government control in 1990
– Though recent reform lets local govt keep some revenue from base growth
• Had been admirably stable until recently...
– 5-yearly revaluation delayed for the first time
– Rate failed to keep pace with inflation for the first time
– ‘Temporary’ doubling of small business rate relief, extended 4 times
– Temporary relief for retail properties introduced
• Discourages development and use of business property
– Taxing value of land (excluding buildings) would not do this
© Institute for Fiscal Studies

© Institute for Fiscal Studies
Stamp duty land tax
£0
£20,000
£40,000
£60,000
£80,000
£100,000
£120,000
£140,000
£160,000
£180,000
£0 £500,000 £1,000,000 £1,500,000 £2,000,000 £2,500,000
Ta
x p
ay
ab
le
Sale price
May 1997
May 2014
£40,000
Note: residential property. Exemption threshold higher for non-residential property

Stamp duty land tax
• ‘Slab’ structure absurd
– £1 higher price can mean £40,000 higher tax bill
• More fundamentally, transactions should not be taxed at all
– Why impose heavier tax on properties that change hands more often?
– Assets should be held by the people who value them most
– Reduced labour mobility one symptom of this more fundamental problem
• Stamp duties should not be part of the tax system
– But don’t want to give up revenue / give windfall gains to current owners
– So look to replace with better taxes rather than simply abolish
© Institute for Fiscal Studies

Some issues that cut across taxes
• Avoidance and evasion
– ‘Tax gap’ is a concern
© Institute for Fiscal Studies

© Institute for Fiscal Studies
Income tax, NICs, CGT
44%
VAT 33%
Corporation tax
13%
Tobacco duties 4%
Alcohol duties 2%
Fuel duties 1% Other
3%
% of total (£35bn)
Estimated ‘tax gaps’, 2011-12
Source: HMRC, Measuring Tax Gaps 2013
0% 4% 8% 12%
Fuel duties
Other
Income tax, NICs, CGT
Alcohol duties
Overall
Corporation tax
VAT
Tobacco duties
Tax gap (%)

© Institute for Fiscal Studies
Criminal attacks
13%
Evasion 15%
Hidden economy
15%
Avoidance 12%
Legal interpretation
12%
Non-payment 13%
Failure to take
reasonable care 12%
Error 8%
Composition of tax gap by behaviour, 2011-12
Source: HMRC, Measuring Tax Gaps 2013

Some issues that cut across taxes
• Avoidance and evasion
– ‘Tax gap’ is a concern
– A raft of measures in every Budget and Autumn Statement
– And a new General Anti-Abuse Rule (GAAR) since July 2013
• Distributional effects of the system as a whole
© Institute for Fiscal Studies

Distributional effect of the tax and benefit system 2012-13, excluding most ‘business taxes’
© Institute for Fiscal Studies
-80%
-60%
-40%
-20%
0%
20%
40%
60%
Poorest 2 3 4 5 6 7 8 9 Richest All
% o
f d
isp
osa
ble
in
com
e
Income Decile Group
Source: Author’s calculations from ONS (2014), The effects of taxes and
benefits on household income, 2012/2013

Impact of tax and benefit reforms Implemented June 2010 - April 2015 inclusive
© Institute for Fiscal Studies
-£4,000
-£3,500
-£3,000
-£2,500
-£2,000
-£1,500
-£1,000
-£500
£0
£500
Poorest 2 3 4 5 6 7 8 9 Richest All
Ch
an
ge
in
ne
t in
com
e
Income Decile Group
For details see Adam and Browne (2013), Do the UK government’s
welfare reforms make work pay?

Cumulative shares of tax liability, 2013-14
© Institute for Fiscal Studies
0%
20%
40%
60%
80%
100%
120%
Top 10% 20% 30% 40% 50% 60% 70% 80% 90% 100% (all)
Cu
mu
lati
ve
pe
rce
nta
ge
paid
Percentage of households
% of tax-minus-benefits paid by highest-income households
% of tax paid by highest-income households
Note: excludes corporation tax, business rates, stamp duties, CGT and IHT.
Source: Figure 9.4 of The IFS Green Budget: February 2013

Some issues that cut across taxes
• Avoidance and evasion
– ‘Tax gap’ is a concern
– A raft of measures in every Budget and Autumn Statement
– And a new General Anti-Abuse Rule (GAAR) since July 2013
• Distributional effects of the system as a whole
• Work incentive effects of the system as a whole
© Institute for Fiscal Studies
© Institute for Fiscal Studies
Two kinds of financial work incentives
• Incentive to be in paid work at all
– Replacement rate (RR): out-of-work income / in-work income
– Participation tax rate (PTR): proportion of total earnings taken in tax and withdrawn benefits
• Incentive for those in work to increase their earnings
– Effective marginal tax rate (EMTR): proportion of an extra £1 of earnings taken in tax and withdrawn benefits
In all cases, higher numbers = weaker incentives
© Institute for Fiscal Studies
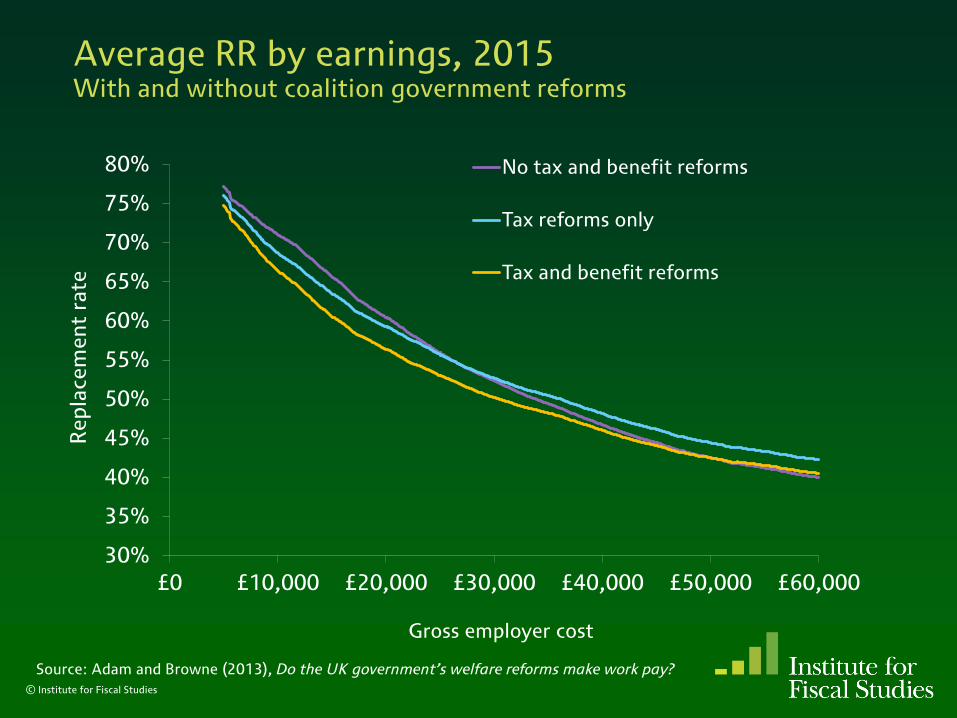
Average RR by earnings, 2015 With and without coalition government reforms
30%
35%
40%
45%
50%
55%
60%
65%
70%
75%
80%
£0 £10,000 £20,000 £30,000 £40,000 £50,000 £60,000
Re
pla
cem
en
t ra
te
Gross employer cost
No tax and benefit reforms
Tax reforms only
Tax and benefit reforms
Source: Adam and Browne (2013), Do the UK government’s welfare reforms make work pay?

© Institute for Fiscal Studies
Average PTR by earnings, 2015 With and without coalition government reforms
30%
35%
40%
45%
50%
55%
60%
£0 £10,000 £20,000 £30,000 £40,000 £50,000 £60,000
Pa
rtic
ipa
tio
n t
ax r
ate
Gross employer cost
No tax and benefit reforms
Tax reforms only
Tax and benefit reforms
Source: Adam and Browne (2013), Do the UK government’s welfare reforms make work pay?

© Institute for Fiscal Studies
Average EMTR of workers by earnings, 2015 With and without coalition government reforms
30%
35%
40%
45%
50%
55%
60%
65%
70%
£0 £10,000 £20,000 £30,000 £40,000 £50,000 £60,000
Eff
ect
ive
ma
rgin
al
tax r
ate
Gross employer cost
No tax and benefit reforms
Tax reforms only
Tax and benefit reforms
Source: Adam and Browne (2013), Do the UK government’s welfare reforms make work pay?

Some issues that cut across taxes
• Avoidance and evasion
– ‘Tax gap’ is a concern
– A raft of measures in every Budget and Autumn Statement
– And a new General Anti-Abuse Rule (GAAR) since July 2013
• Distributional effects of the system as a whole
• Work incentive effects of the system as a whole
• Choice of legal form
– Employment is penalised relative to self-employment and incorporation
© Institute for Fiscal Studies
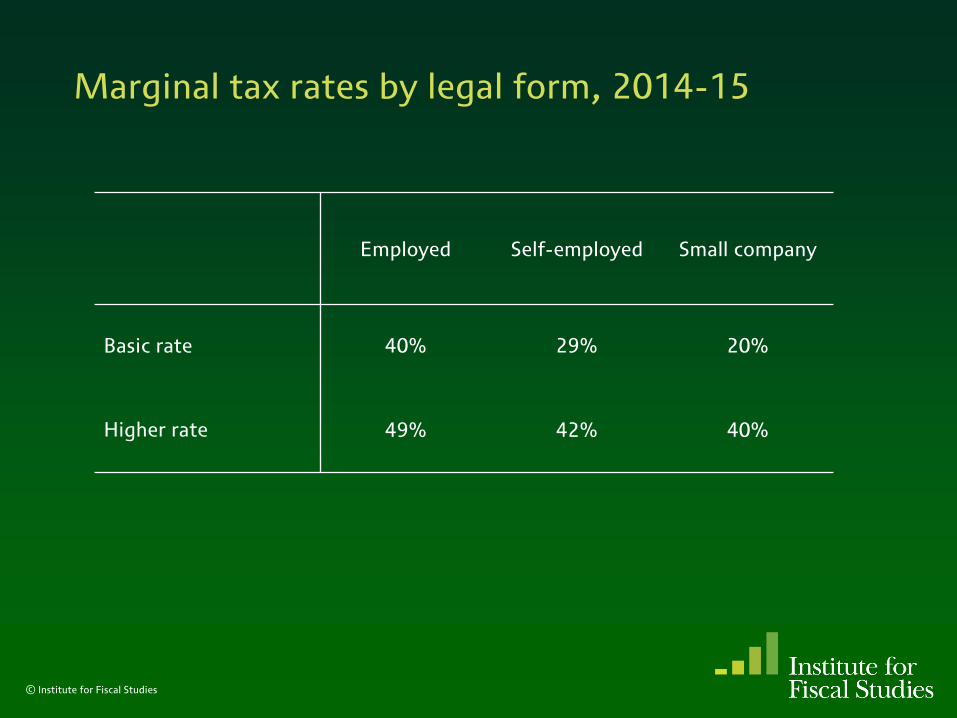
Marginal tax rates by legal form, 2014-15
© Institute for Fiscal Studies
Employed Self-employed Small company
Basic rate 40% 29% 20%
Higher rate 49% 42% 40%
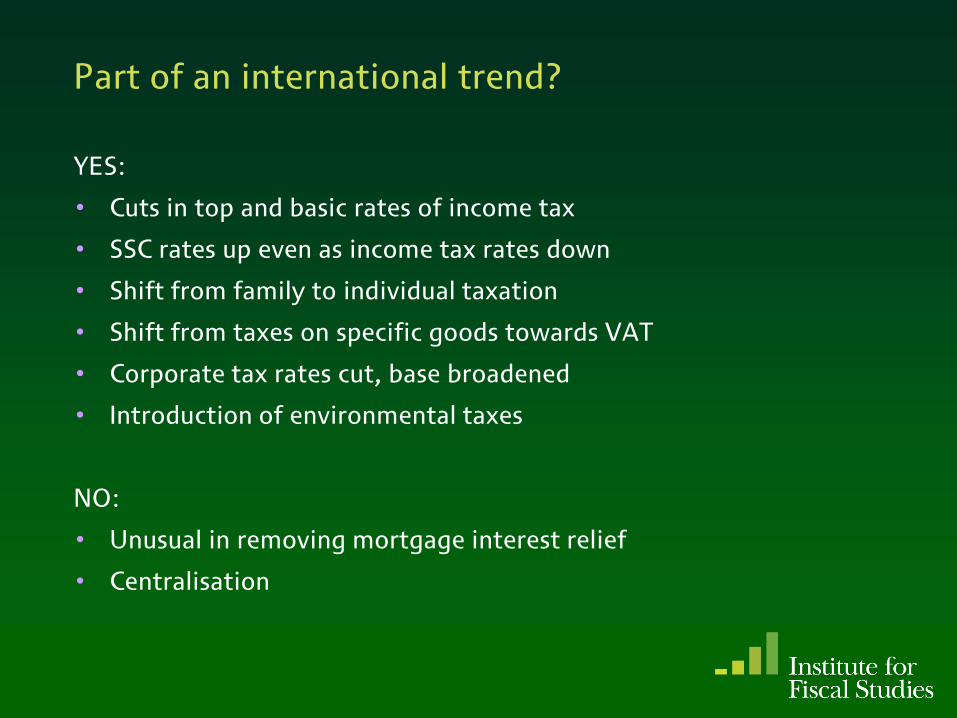
Part of an international trend?
YES:
• Cuts in top and basic rates of income tax
• SSC rates up even as income tax rates down
• Shift from family to individual taxation
• Shift from taxes on specific goods towards VAT
• Corporate tax rates cut, base broadened
• Introduction of environmental taxes
NO:
• Unusual in removing mortgage interest relief
• Centralisation

The coalition government’s priorities for tax
• Current government has increased tax overall
– Biggest contributors: VAT increase and anti-avoidance measures
• Yet still found money for tax cuts in its three priority areas
– £12bn - personal allowance
– £8bn - headline rate of corporation tax
– £6bn - fuel duty
• Two of these three were ambitions clearly stated in advance
– Fuel duty more piecemeal
• Little sign of a coherent strategy for the tax system as a whole
© Institute for Fiscal Studies

Room for improvement Ideas from the Mirrlees Review
• Merge income tax and National Insurance
• Broaden the VAT base (with appropriate compensation package)
• Major overhaul of property taxation
• More consistent carbon price; target motoring taxes on congestion
• Reform the taxation of savings and profits
– Full allowance for amounts saved/invested
– Apply same overall statutory rate to income from all sources
© Institute for Fiscal Studies

Tax policy-making
• Hyperactive
– Perceived need to pull rabbits out of the hat in Budgets, Autumn Statements and party conferences (as well as elections)
– Exacerbated by rise of 24-hour news coverage
• Taxes tend to rise in post-election Budgets
• Some recent improvements in institutional arrangements
– Independent Office for Budget Responsibility
– More transparency re policy costings
– Somewhat better consultation
• Very centralised
– Tax policy-making very concentrated in the Treasury
– Council tax is the only (mostly) local tax: only 4% of revenues
– Some devolution of powers to Wales and Northern Ireland
– As for Scotland...
© Institute for Fiscal Studies

Scotland has just voted against independence
• But radical change still likely
– Main political parties all promising much more devolution, quickly
• Scotland has had some tax-setting powers for years
– Full control over council tax and business rates but done little
– Vary basic rate of income tax by up to 3 percentage points not done
• Already due to get more
– Stamp duty land tax replacing with (slightly) more sensible tax
– Landfill tax little change planned
– Vary all rates of income tax (together, on unchanged tax base) given haven’t used existing powers, how valuable is this?
• What else will be devolved?
– Each party’s proposals so far slightly different
– Recent rhetoric has sounded radical, but not specific
– More devolution to the rest of the UK too? © Institute for Fiscal Studies

UK tax policy Stuart Adam
© Institute for Fiscal Studies