ukraine pilot report - unece pilot report among commonwealththe of independent states. (cis) and...
TRANSCRIPT
1
Ukraine Pilot Report
Among the Commonwealth of Independent States. (CIS) and other transition economies, Ukraine is one of the few which has an exceptionally rich range of statistical tools measuring various dimensions of socio‐economic processes affecting its population in general as well as monitoring and evaluating the national social policy programmes, in particular.
Thus, in addition to the conventional data collection instruments (e.g. population census, labour force survey, labour cost survey, administrative records, etc.) the State Statistics Committee of Ukraine (SSCU) has at its disposal the following special tools generating a wide range of data on flexicurity1 and an array of indicators measuring the qualitative aspects of employment.
1. Enterprise Labour Flexibility and Security Survey (ELFS).
2. People’s Security Survey (UPSS).
3. Labour Force Survey (LFS) based Modular Decent Work Survey (UMDWS).
Ukraine is one of the first countries in Central and Eastern Europe where the Enterprise Labour Flexibility and Security Surveys were launched, and ten such surveys have been conducted since 1994.
Essentially, ELFS examines the process of employment creation, labour utilization, job structure, working conditions, gender segregation and labour relations at the enterprise or establishment level.2 More specifically, the survey investigates:
• Problems of labour utilisation and the more efficient utilisation of workers;
• Main mechanisms of, and obstacles to, skill formation and the effective utilisation of skills;
• Labour recruitment practices employed by the enterprises, and the considerations, which motivate these practices;
• “Labour segmentation” within and across enterprises. In other words, examining the
1 Flexicurity refers, in general terms, to a balanced combination of labour flexibility and socio‐economic security. 2 See ILO. Enterprise Labour Flexibility and Security Surveys (ELFS): A technical guide. Geneva, 2004.
opportunities and restrictions on labour mobility within firms;
• Patterns of labour turnover and their implications for productivity, and the factors that determine the rate of labour turnover;
• Labour flexibility in its various dimensions and the extent of these practices in different types of firms and sectors;
• The role of labour legislations in determining recruitment practices, skill development, and the level and structure of employment;
• Gender preferences in recruitment, work conditions and opportunities for advancement;
• Labour relations mechanisms (trade unions, collective bargaining, etc.) in operation, and their impact on dynamism of establishments.
Also, Ukraine is one of the first countries where the International Labour Organization (ILO) sponsored UPSS was launched within the ambitious and comprehensive ILO Programme on socio‐economic security in the world of work. Since 2000, four UPSS rounds have been conducted. This survey is a unique statistical tool designed to measure the following labour‐related forms of security:3
• Basic needs security;
• Income security;
• Labour market security;
• Employment security;
• Job security;
• Work security;
• Skills reproduction security;
• Representation security.
Of these, the last two stand out as being at the crux of security that should encourage legitimate risk‐taking and innovations while promoting society and social solidarity.4
3 See ILO. People’s Security Surveys (PSS): A Manual for training and implementation. Geneva, 2004. 4 See ILO. Economic security for a better world. Geneva, 2004.
2
Further, like in the earlier cases, Ukraine was a pioneering country to test and apply the ILO methodology on measuring various dimensions of decent work.
The above exercise had the following two phases:
1. Participation in the ILO’s early developmental work and testing of the decent work statistical indicators (2001‐2004), when the UMDWS was conducted and results were discussed at the national tripartite seminar.
2. Current work with the ILO is to test a comprehensive approach to the measurement of decent work during 2009 by preparing decent work profile of Ukraine. This work is based on the Decent Work Framework endorsed by the 18th International Conference of Labour Statisticians (ICLS).5 The zero draft profile for Ukraine was used a preliminary basis for discussion at a tripartite National Consultation Workshop for Ukraine, held on 15 and 16 September 2009 in Kiev.
Finally, Ukraine has been actively participating in the joint UNECE/ILO/EUROSTAT Seminars on the Measurement of Quality of Work held in 2007 and 2009; and joined the UNECE Task Force on the Measurement of Quality of Employment established in 2008.
The objectives of this report are to:
1. Describe the quality of employment on the Ukrainian labour market, applying the framework developed by the UNECE Task Force. The indicators chosen for the paper are based on the list of indicators as proposed in the framework prepared by the Task Force on the measurement of quality of employment;6
2. Identify areas, which are relevant for quality of employment in the Ukrainian context and
5 See ILO. “Resolution on further work on the measurement of decent work”. Report of the 18th International Conference of Labour Statisticians. Geneva, December 2008. 6 See UNECE Task Force on the Measurement of Quality of Employment. Introduction of the Conceptual Framework for Measuring the Quality of Employment. Statistical Measurement of Quality of Employment: Conceptual framework and indicators. Note by the Task Force on the Measurement of Quality of Employment, ECE/CES/GE.12/2009/1, 2 September 2009. http://www.unece.org/stats/documents/ece/ces/ge.12/2009/zip.4.e.pdf
identify indicators, which are of limited relevance for Ukraine;
3. Provide feedback to the Task Force on the Measurement of Quality of Employment.
When writing this paper, the authors have largely drawn on the experience gained during the years of collaboration with the ILO and the UNECE in measuring decent work and qualitative aspects of employment.
The authors are grateful to Ms. Nadya Hryhorovych, Director, and Ms. Alla Solop, Head of Labour Force Survey Division, Department of Labour Statistics of the State Statistics Committee of Ukraine, as well as to Iryna Kalachova, Director, Social Statistics Department of the State Statistics Committee of Ukraine, for providing background statistical information and constructive comments on draft chapters.
A. Developments in the labour market of Ukraine
Labour market is an integral part of the economic and social system of which the functioning and development are influenced by market economy laws and relevant administrative and legislative decisions. Therefore, under a growing globalisation of the world economic space, the increase in the quality of labour force in general and employment in particular has become a crucial pre‐condition to secure sound competitiveness of the national economy.
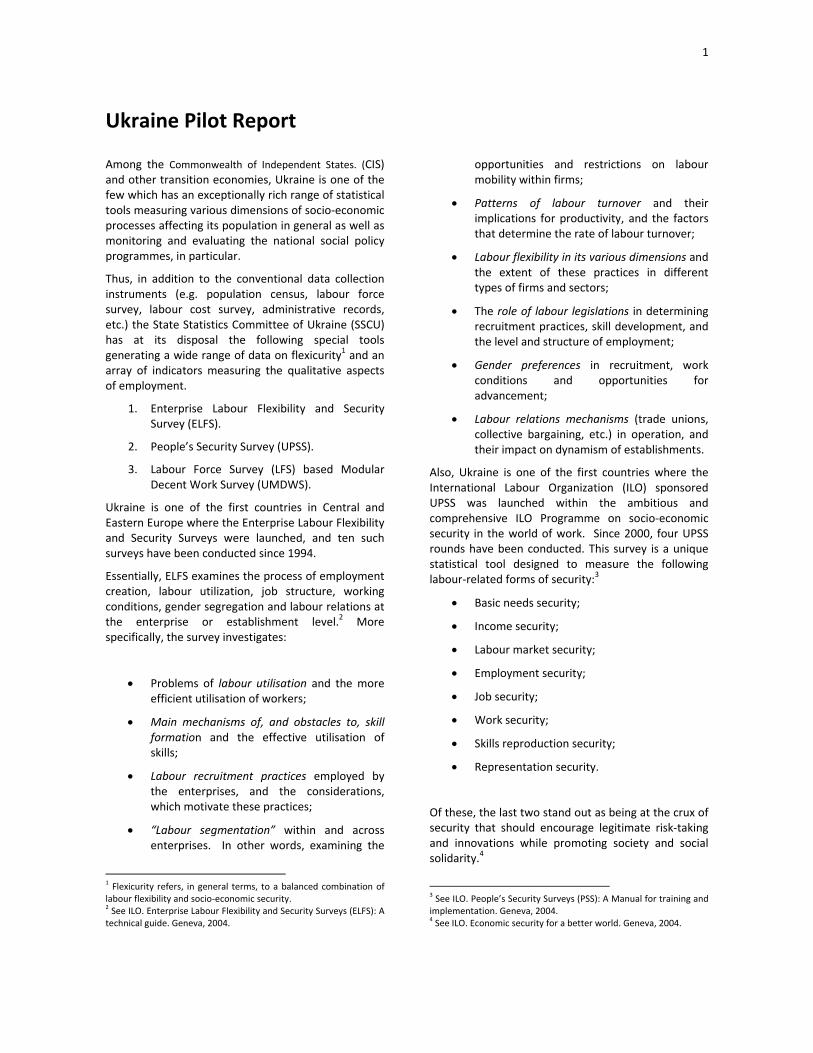
During the last two decades, employment in Ukraine has changed. Thus, after a notable decrease between 1989 and 1999, it stabilized thereafter and a small but steady increase was observed between 2002 and 20087 (Figures 1a and 1b).
7 The data refers to employed persons aged 15‐70 years, who were employed as employees or self‐employed and worked for at least an hour during a reference week as well as persons temporarily absent from work due to specific reasons.
3
Figure 1a. Employment by sex
5000
7000
900011000
13000
15000
17000
19000
21000
23000
250001995
1996
1997
1998
1999
2000
2001
2002
2003
2004
2005
2006
2007
2008
Employed
, tho
usands
All Male Female
Source: State Statistics Committee of Ukraine Figure 1b. Employment by urban and rural areas
5000
7000
9000
11000
13000
15000
17000
1995
1996
1997
1998
1999
2000
2001
2002
2003
2004
2005
2006
2007
2008
Employed, tho
usands
Urban Rural
Source: State Statistics Committee of Ukraine.
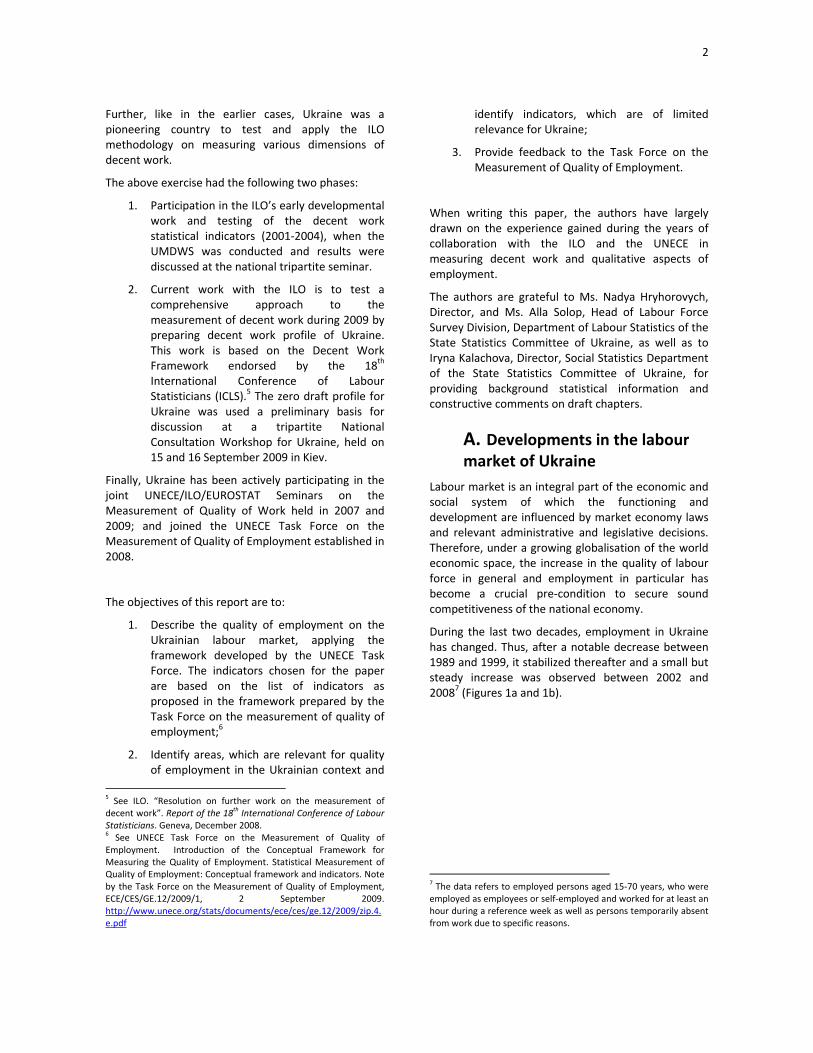
While the female employment rates were somehow lower than those of males, the gender‐specific employment rates were practically equal in the age groups of 40‐49 and 60‐70 years (Figure 2).
According to the results of the Household Sample Survey of the Economic Activity of Population of Ukraine conducted in 2008, the number of employed aged 15‐70 years was 21 million or 50.3 per cent of the total population in this age group.
Figure 2. Employment rates by sex and age group
0102030405060708090
100
15‐24 25‐29 30‐39 40‐49 50‐59 60‐70Age group
Employment rate, %
Male Female
Source: State Statistics Committee of Ukraine. The enterprise statistics collected from large‐ and middle‐sized establishments showed that the number of workers employed there fell by 237,000 and stood at 11.4 million persons. Besides, 327,300 workers had secondary employment outside their main workplace, and 268,200 worked with temporary contracts which provided them with less guarantee of employment and much reduced or no social security schemes. The above and other facts indicate that the Ukrainian labour force is losing its relative quality advantages which it used to have vis‐à‐vis other countries in the region.
Employment growth in the service sector was due to important changes in the traditional structure of Ukrainian labour force where as a result, since 2002, the number of employees has been continuously decreasing. Thus, the average number of wage earners at the agricultural enterprises engaged in hunting and related services fell by 10.2 per cent and of those engaged in manufacturing by three per cent. At the same, the number of persons employed in commerce and trade has increased by 8.4 per cent, in hotels and restaurants by seven per cent and in real estate operations by 2.6 per cent. Between 2000 and 2008, the number of ILO‐unemployed fell from 2.7 million to 1.4 million and the ILO unemployment rates shrunk form 11.6 per cent to 6.4 per cent during the same period.
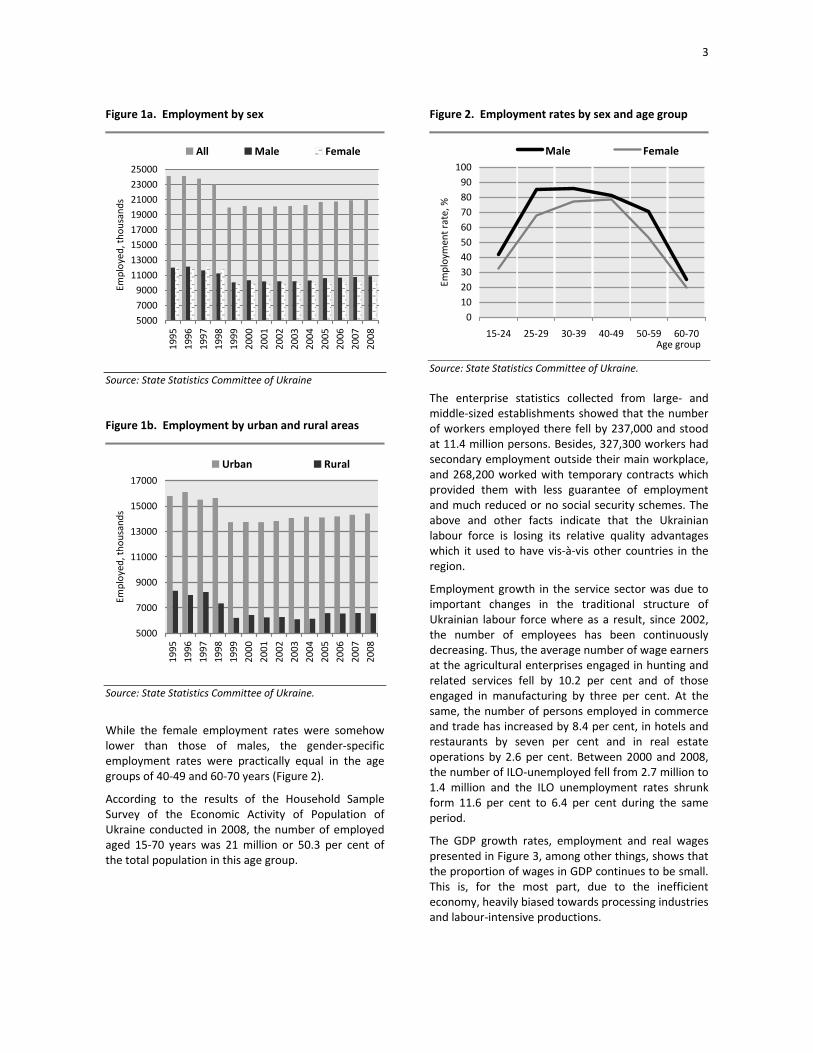
The GDP growth rates, employment and real wages presented in Figure 3, among other things, shows that the proportion of wages in GDP continues to be small. This is, for the most part, due to the inefficient economy, heavily biased towards processing industries and labour‐intensive productions.
4
Figure 3. Macroeconomic dynamics, growth rates
0
50
100
150
200
250
300
35019
9519
96
1997
1998
1999
2000
2001
2002
2003
2004
2005
2006
2007
2008
Growth rate, %
GDP Employment Real Wage
Source: State Statistics Committee of Ukraine.
B. Quality of Employment: Ukrainian perspective
As rightfully stated in the Task Force paper, “quality of employment is an issue of importance to many. Nobody wants bad working conditions for themselves, and all but a few would want to eradicate the worst forms of work and labour for others”.8
What is quality of employment? What indicators ought to be used to assess such a concept?
The European Foundation has identified three perspectives on the quality of work and employment: societal, corporate and individual.9 From a societal perspective, it may be desirable to have a high quality of employment, since it is assumed to have social spin‐offs. However, not all aspects of the societal point of view would imply that quality of employment is positive. For example, although public employment generally represents high quality employment, large
8 See UNECE Task Force on the Measurement of Quality of Employment. Introduction of the Conceptual Framework for Measuring the Quality of Employment. Statistical Measurement of Quality of Employment: Conceptual framework and indicators. Note by the Task Force on the Measurement of Quality of Employment, ECE/CES/GE.12/2009/1, 2 September 2009. http://www.unece.org/stats/documents/ece/ces/ge.12/2009/zip.4.e.pdf 9 European Foundation for the Improvement of Living and Working Conditions. Quality in work and employment in the European Working Conditions Survey. UNECE/ILO/Eurostat Seminar on the Quality of Work, Geneva, May 11 to 13, 2005, p. 2.
growth in this sector may be undesirable because it can burden government budgets.
From ILO’s perspective, the quality of employment is about security of tenure and prospects for career development; it is about working conditions, hours of work, safety and health, fair wages and returns to labour, opportunities to develop skills, balancing work and life, gender equality, job satisfaction and recognition and social protection. It is also about freedom of association and having a voice in the workplace and the society. Finally, it is about securing human dignity and eliminating discrimination, forced labour, human trafficking and forms of child labour, especially in its worst forms.
These qualitative aspects of work and labour are largely covered by the concept of decent work defined by ILO and endorsed by the international community, as “opportunities for women and men to obtain decent and productive work in conditions of freedom, equity, security and human dignity”.10
The framework proposed by the Task Force and its indicators are primarily designed to measure quality of employment from the perspective of the individual or worker. More specifically, the following seven dimensions are suggested:
1) Safety and ethics of employment
(a) Safety at work
(b) Child labour and forced labour
(c) Fair treatment in employment
2) Income and benefits from employment
(a) Income
(b) Non‐wage pecuniary benefits
3) Working hours and balancing work and non‐working life
(a) Working hours
(b) Working time arrangements
(c) Balancing work and non‐working life
4) Security of employment and social protection
(a) Security of employment
(b) Social protection
10 ILO. Decent work: Report of the Director‐General. International Labour Conference, 87th Session. Geneva, 1999.
5
5) Social dialogue
6) Skills development and life‐long learning
7) Workplace relationships and intrinsic nature of work
(a) Workplace relationships
(b) Intrinsic nature of work
From the Ukrainian perspective and based on our experience gained through the collaboration with ILO, the quality of employment framework should be used for an in‐depth analysis of the qualitative aspects of the relevant dimensions of decent work.
The Task Force’s quality of employment framework, its dimensions and indicators are discussed in a greater detail below.
1. Safety and ethics of employment
The dimension on safety and ethics of employment can be defined as a group of indicators that provides general information on workplace injuries and deaths, and unacceptable forms of labour, such as forced labour or child labour, as well as unfair treatment like discriminatory or harassing work situations.
This quality of employment framework suggests the following sub‐dimensions and sets of indicators underpinning them.
Safety at work
Hazardous conditions It should be noted that the number of persons whose working conditions do not satisfy the required sanitary‐hygienic norms is steadily decreasing. However, this happens not due to higher investments of employers to the improvement of working conditions of their workers but because recent years have witnessed the shut‐down of a large number of coal mines. This has resulted in the notable reduction of number of coal miners from 322,400 in 1999 to 220,300 in 2008.
At the beginning of 2008, the largest number of workplaces with hazardous conditions of work was concentrated in metal processing industries (695,900) and in particular in metallurgy and metal workplaces (241,500). However, the highest proportion of hazardous workplaces was in the coal mining and peat production (76.3 per cent), and 55.5 per cent of such workplaces were in metallurgy.
Females are much less prone to work in hazardous working conditions. In 2008, the share of women working in hazardous conditions was 16.8 per cent while that of men was 34.2 per cent. The following hazardous factors have revealed to be similar for women and men: noise, infrasound and ultrasound, hazardous chemical substances and adverse microclimate of the work place.
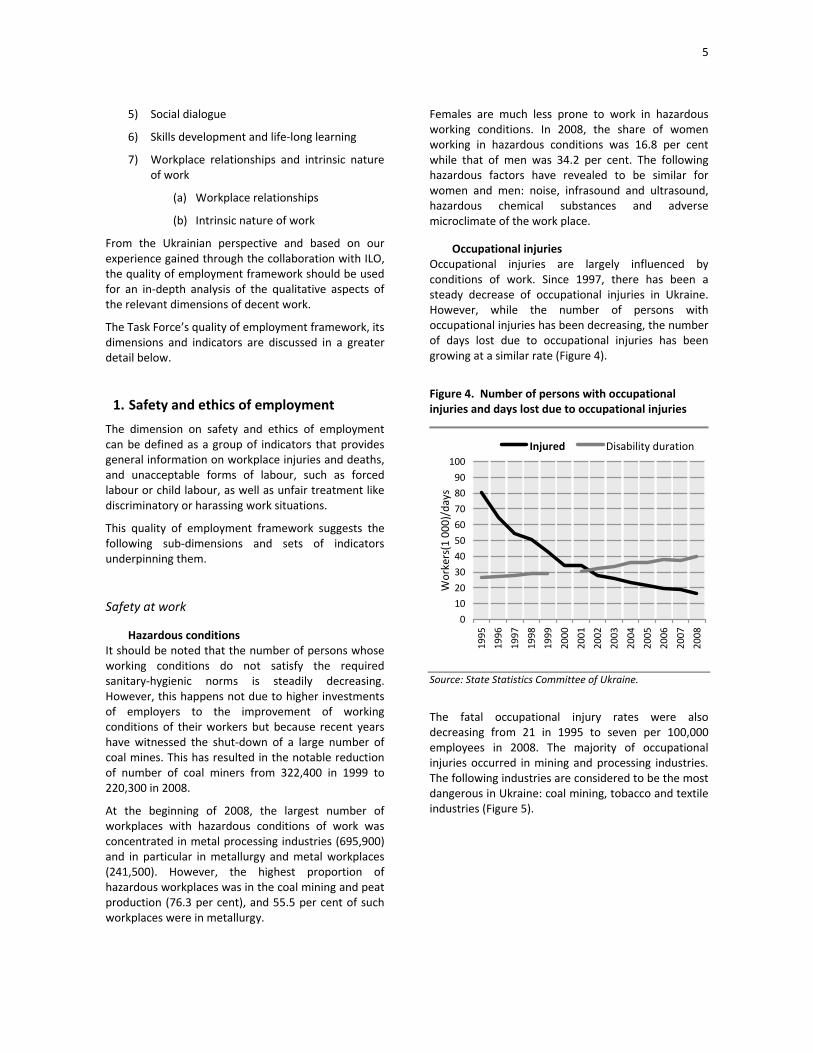
Occupational injuries Occupational injuries are largely influenced by conditions of work. Since 1997, there has been a steady decrease of occupational injuries in Ukraine. However, while the number of persons with occupational injuries has been decreasing, the number of days lost due to occupational injuries has been growing at a similar rate (Figure 4).
Figure 4. Number of persons with occupational injuries and days lost due to occupational injuries
0
10
20
30
40
50
60
70
80
90
100
1995
1996
1997
1998
1999
2000
2001
2002
2003
2004
2005
2006
2007
2008
Workers(1 000)/days
Injured Disability duration
Source: State Statistics Committee of Ukraine.
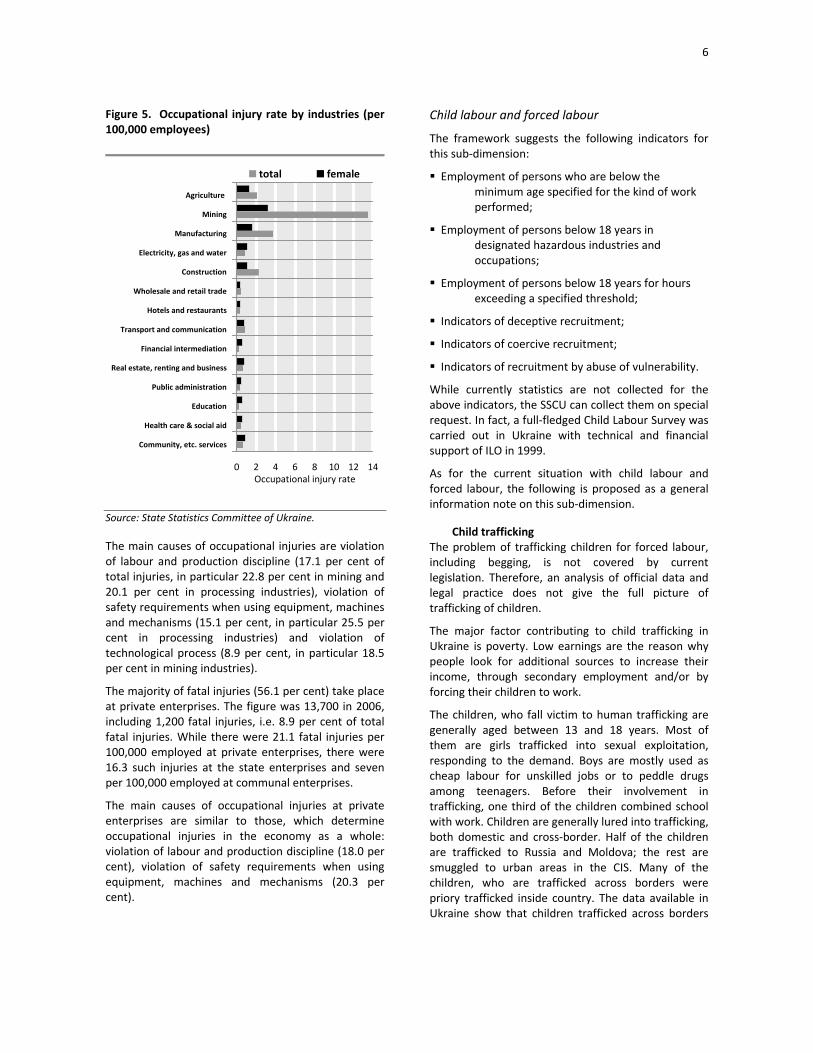
The fatal occupational injury rates were also decreasing from 21 in 1995 to seven per 100,000 employees in 2008. The majority of occupational injuries occurred in mining and processing industries. The following industries are considered to be the most dangerous in Ukraine: coal mining, tobacco and textile industries (Figure 5).
6
Figure 5. Occupational injury rate by industries (per 100,000 employees)
0 2 4 6 8 10 12 14
Community, etc. services
Health care & social aid
Education
Public administration
Real estate, renting and business
Financial intermediation
Transport and communication
Hotels and restaurants
Wholesale and retail trade
Construction
Electricity, gas and water
Manufacturing
Mining
Agriculture
Occupational injury rate
total female
Source: State Statistics Committee of Ukraine. The main causes of occupational injuries are violation of labour and production discipline (17.1 per cent of total injuries, in particular 22.8 per cent in mining and 20.1 per cent in processing industries), violation of safety requirements when using equipment, machines and mechanisms (15.1 per cent, in particular 25.5 per cent in processing industries) and violation of technological process (8.9 per cent, in particular 18.5 per cent in mining industries).
The majority of fatal injuries (56.1 per cent) take place at private enterprises. The figure was 13,700 in 2006, including 1,200 fatal injuries, i.e. 8.9 per cent of total fatal injuries. While there were 21.1 fatal injuries per 100,000 employed at private enterprises, there were 16.3 such injuries at the state enterprises and seven per 100,000 employed at communal enterprises.
The main causes of occupational injuries at private enterprises are similar to those, which determine occupational injuries in the economy as a whole: violation of labour and production discipline (18.0 per cent), violation of safety requirements when using equipment, machines and mechanisms (20.3 per cent).
Child labour and forced labour
The framework suggests the following indicators for this sub‐dimension:
Employment of persons who are below the minimum age specified for the kind of work performed;
Employment of persons below 18 years in designated hazardous industries and occupations;
Employment of persons below 18 years for hours exceeding a specified threshold;
Indicators of deceptive recruitment;
Indicators of coercive recruitment;
Indicators of recruitment by abuse of vulnerability.
While currently statistics are not collected for the above indicators, the SSCU can collect them on special request. In fact, a full‐fledged Child Labour Survey was carried out in Ukraine with technical and financial support of ILO in 1999.
As for the current situation with child labour and forced labour, the following is proposed as a general information note on this sub‐dimension.
Child trafficking The problem of trafficking children for forced labour, including begging, is not covered by current legislation. Therefore, an analysis of official data and legal practice does not give the full picture of trafficking of children.
The major factor contributing to child trafficking in Ukraine is poverty. Low earnings are the reason why people look for additional sources to increase their income, through secondary employment and/or by forcing their children to work.
The children, who fall victim to human trafficking are generally aged between 13 and 18 years. Most of them are girls trafficked into sexual exploitation, responding to the demand. Boys are mostly used as cheap labour for unskilled jobs or to peddle drugs among teenagers. Before their involvement in trafficking, one third of the children combined school with work. Children are generally lured into trafficking, both domestic and cross‐border. Half of the children are trafficked to Russia and Moldova; the rest are smuggled to urban areas in the CIS. Many of the children, who are trafficked across borders were priory trafficked inside country. The data available in Ukraine show that children trafficked across borders
7
were exploited in street‐vending, domestic labour, agriculture, dancing, as waiters/waitresses, or to provide sexual services.
Trafficking of migrant workers The volume of trafficked labour migrants is not known. The available estimates are fragmentary. The destination countries for both trafficked and non–trafficked migrants are the same: Russia, Turkey, Italy, Greece and Hungary.
Women are more at risk of being trafficked than men, particularly for the purpose of sexual exploitation. Of trafficked migrants, 64.2 per cent are women. Male trafficked victims of forced labour are on average 35 years old. Inhabitants of rural areas and small town citizens are trafficked more often than others due to a more difficult labour market situation.
According to the special research data, none of the trafficked victims of forced labour considered their pre‐migration situation satisfactory. There is an important lack of official information about migration. Therefore, potential migrants are at the risk of receiving false information which increases their vulnerability to abuse, exploitation and forced labour.
Fair treatment in employment
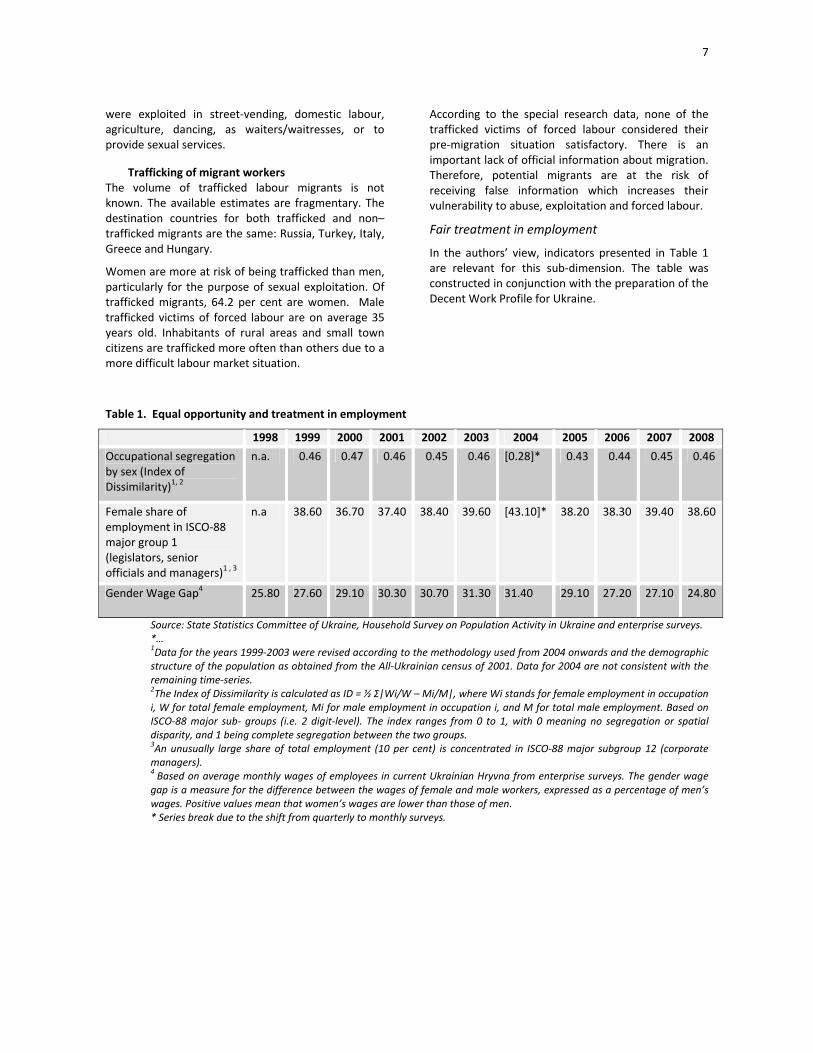
In the authors’ view, indicators presented in Table 1 are relevant for this sub‐dimension. The table was constructed in conjunction with the preparation of the Decent Work Profile for Ukraine.
Table 1. Equal opportunity and treatment in employment
1998 1999 2000 2001 2002 2003 2004 2005 2006 2007 2008
Occupational segregation by sex (Index of Dissimilarity)1, 2
n.a. 0.46 0.47 0.46 0.45 0.46 [0.28]* 0.43 0.44 0.45 0.46
Female share of employment in ISCO‐88 major group 1 (legislators, senior officials and managers)1 , 3
n.a 38.60 36.70 37.40 38.40 39.60 [43.10]* 38.20 38.30 39.40 38.60
Gender Wage Gap4 25.80 27.60 29.10 30.30 30.70 31.30 31.40 29.10 27.20 27.10 24.80
Source: State Statistics Committee of Ukraine, Household Survey on Population Activity in Ukraine and enterprise surveys. *… 1Data for the years 1999‐2003 were revised according to the methodology used from 2004 onwards and the demographic structure of the population as obtained from the All‐Ukrainian census of 2001. Data for 2004 are not consistent with the remaining time‐series. 2The Index of Dissimilarity is calculated as ID = ½ Σ|Wi/W – Mi/M|, where Wi stands for female employment in occupation i, W for total female employment, Mi for male employment in occupation i, and M for total male employment. Based on ISCO‐88 major sub‐ groups (i.e. 2 digit‐level). The index ranges from 0 to 1, with 0 meaning no segregation or spatial disparity, and 1 being complete segregation between the two groups. 3An unusually large share of total employment (10 per cent) is concentrated in ISCO‐88 major subgroup 12 (corporate managers). 4 Based on average monthly wages of employees in current Ukrainian Hryvna from enterprise surveys. The gender wage gap is a measure for the difference between the wages of female and male workers, expressed as a percentage of men’s wages. Positive values mean that women’s wages are lower than those of men. * Series break due to the shift from quarterly to monthly surveys.
8
Table 2. Low pay in Ukraine, 2000‐2008
2000 2001 2002 2003 2004 2005 2006 2007 2008
Low pay (Share of employed with below 2/3 of median hourly earnings) (per cent)
26.2 26.7 28.2 26.6 28.5 28.4 26.5 29.5 29.2
Source: State Statistics Committee of Ukraine.
2. Income and benefits from employment
An obvious component of quality of employment is the income that people receive. Income must be taken broadly. The assumption of this dimension is that the higher the pay and other pecuniary benefits of the job, the higher the quality of employment. In addition to income and earning, the benefits that an employer might provide (and pay for) are an important aspect of quality of work that should not be ignored.
A number of additional indicators currently used the State Statistics Committee to measure different qualitative aspects of the income form employment are illustrated below.
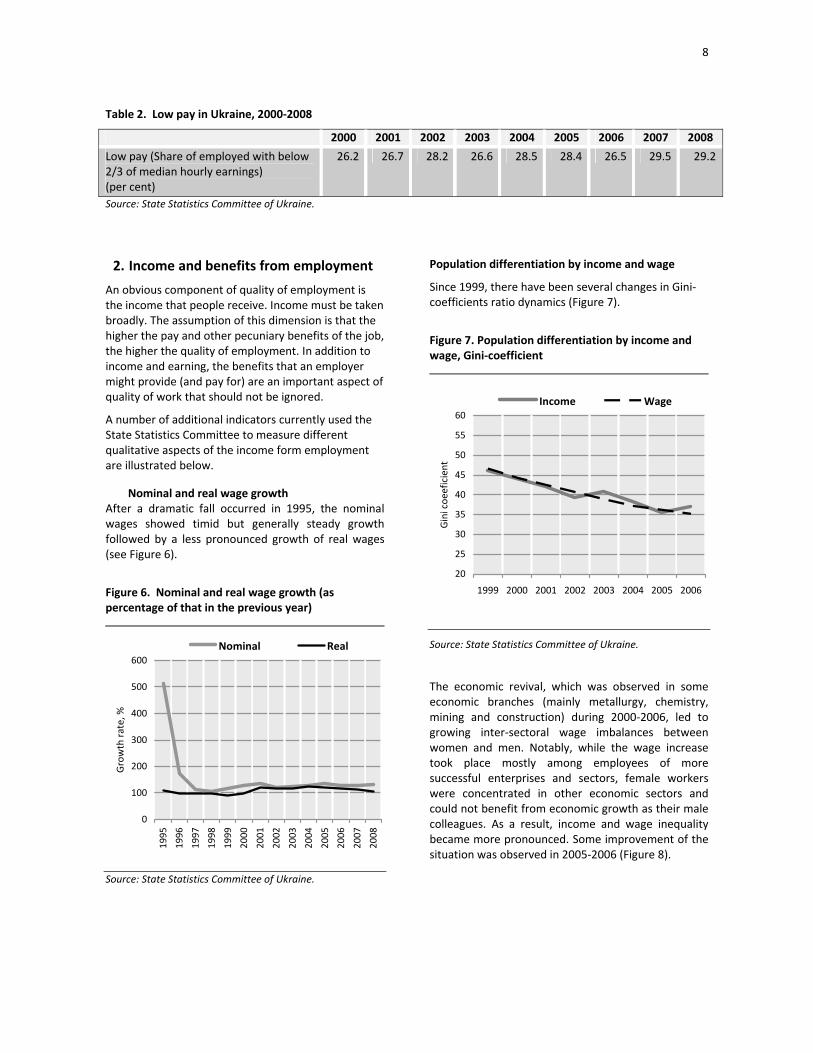
Nominal and real wage growth After a dramatic fall occurred in 1995, the nominal wages showed timid but generally steady growth followed by a less pronounced growth of real wages (see Figure 6).
Figure 6. Nominal and real wage growth (as percentage of that in the previous year)
0
100
200
300
400
500
600
1995
1996
1997
1998
1999
2000
2001
2002
2003
2004
2005
2006
2007
2008
Growth rate, %
Nominal Real
Source: State Statistics Committee of Ukraine.
Population differentiation by income and wage
Since 1999, there have been several changes in Gini‐coefficients ratio dynamics (Figure 7).
Figure 7. Population differentiation by income and wage, Gini‐coefficient
20
25
30
35
40
45
50
55
60
1999 2000 2001 2002 2003 2004 2005 2006
Gini coe
eficient
Income Wage
Source: State Statistics Committee of Ukraine. The economic revival, which was observed in some economic branches (mainly metallurgy, chemistry, mining and construction) during 2000‐2006, led to growing inter‐sectoral wage imbalances between women and men. Notably, while the wage increase took place mostly among employees of more successful enterprises and sectors, female workers were concentrated in other economic sectors and could not benefit from economic growth as their male colleagues. As a result, income and wage inequality became more pronounced. Some improvement of the situation was observed in 2005‐2006 (Figure 8).
9
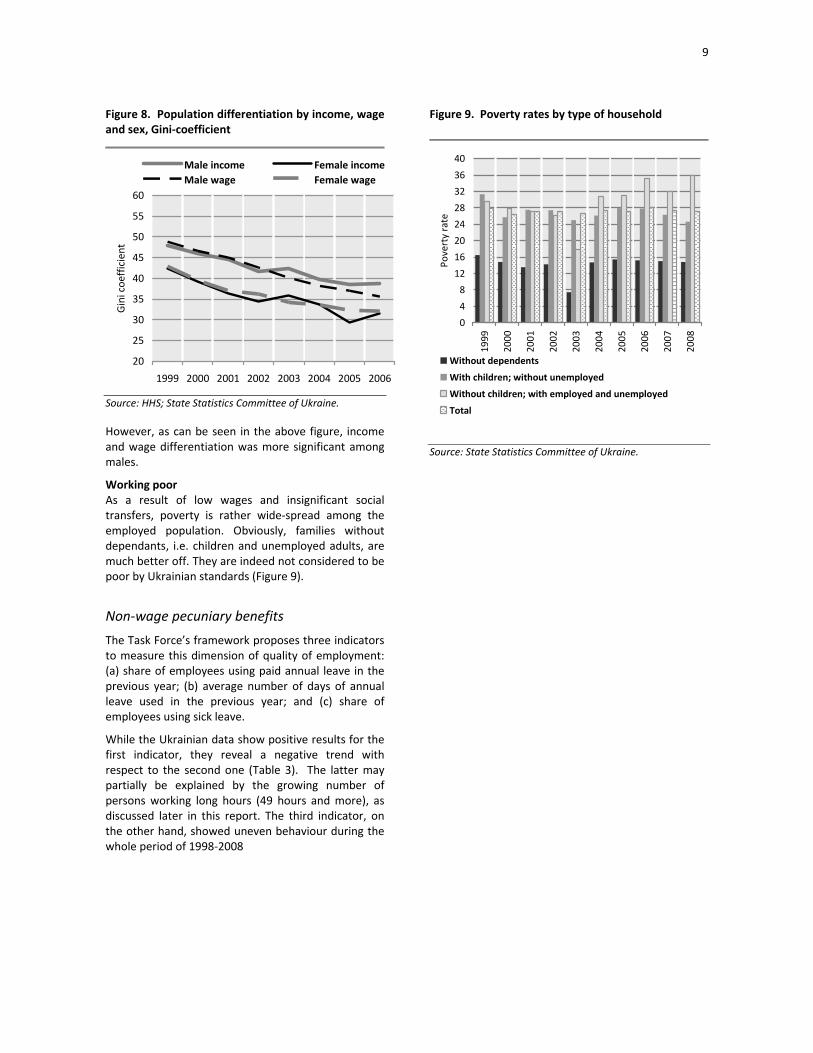
Figure 8. Population differentiation by income, wage and sex, Gini‐coefficient
20
25
30
35
40
45
50
55
60
1999 2000 2001 2002 2003 2004 2005 2006
Gini coe
fficient
Male income Female incomeMale wage Female wage
Source: HHS; State Statistics Committee of Ukraine. However, as can be seen in the above figure, income and wage differentiation was more significant among males.
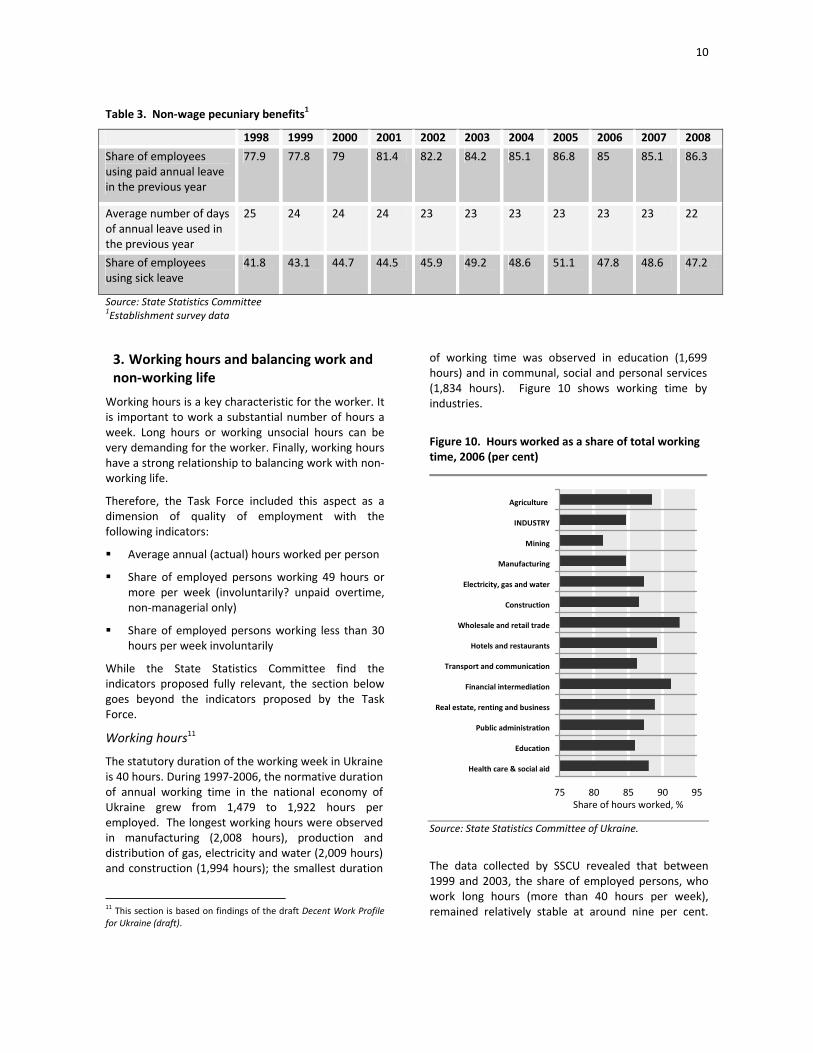
Working poor As a result of low wages and insignificant social transfers, poverty is rather wide‐spread among the employed population. Obviously, families without dependants, i.e. children and unemployed adults, are much better off. They are indeed not considered to be poor by Ukrainian standards (Figure 9).
Non‐wage pecuniary benefits
The Task Force’s framework proposes three indicators to measure this dimension of quality of employment: (a) share of employees using paid annual leave in the previous year; (b) average number of days of annual leave used in the previous year; and (c) share of employees using sick leave.
While the Ukrainian data show positive results for the first indicator, they reveal a negative trend with respect to the second one (Table 3). The latter may partially be explained by the growing number of persons working long hours (49 hours and more), as discussed later in this report. The third indicator, on the other hand, showed uneven behaviour during the whole period of 1998‐2008
Figure 9. Poverty rates by type of household
0
4
8
12
16
20
24
28
32
36
40
1999
2000
2001
2002
2003
2004
2005
2006
2007
2008
Poverty rate
Without dependents
With children; without unemployed
Without children; with employed and unemployed
Total
Source: State Statistics Committee of Ukraine.
10
Table 3. Non‐wage pecuniary benefits1
1998 1999 2000 2001 2002 2003 2004 2005 2006 2007 2008
Share of employees using paid annual leave in the previous year
77.9 77.8 79 81.4 82.2 84.2 85.1 86.8 85 85.1 86.3
Average number of days of annual leave used in the previous year
25 24 24 24 23 23 23 23 23 23 22
Share of employees using sick leave
41.8 43.1 44.7 44.5 45.9 49.2 48.6 51.1 47.8 48.6 47.2
Source: State Statistics Committee 1Establishment survey data
3. Working hours and balancing work and non‐working life
Working hours is a key characteristic for the worker. It is important to work a substantial number of hours a week. Long hours or working unsocial hours can be very demanding for the worker. Finally, working hours have a strong relationship to balancing work with non‐working life.
Therefore, the Task Force included this aspect as a dimension of quality of employment with the following indicators:
Average annual (actual) hours worked per person
Share of employed persons working 49 hours or more per week (involuntarily? unpaid overtime, non‐managerial only)
Share of employed persons working less than 30 hours per week involuntarily
While the State Statistics Committee find the indicators proposed fully relevant, the section below goes beyond the indicators proposed by the Task Force.
Working hours11
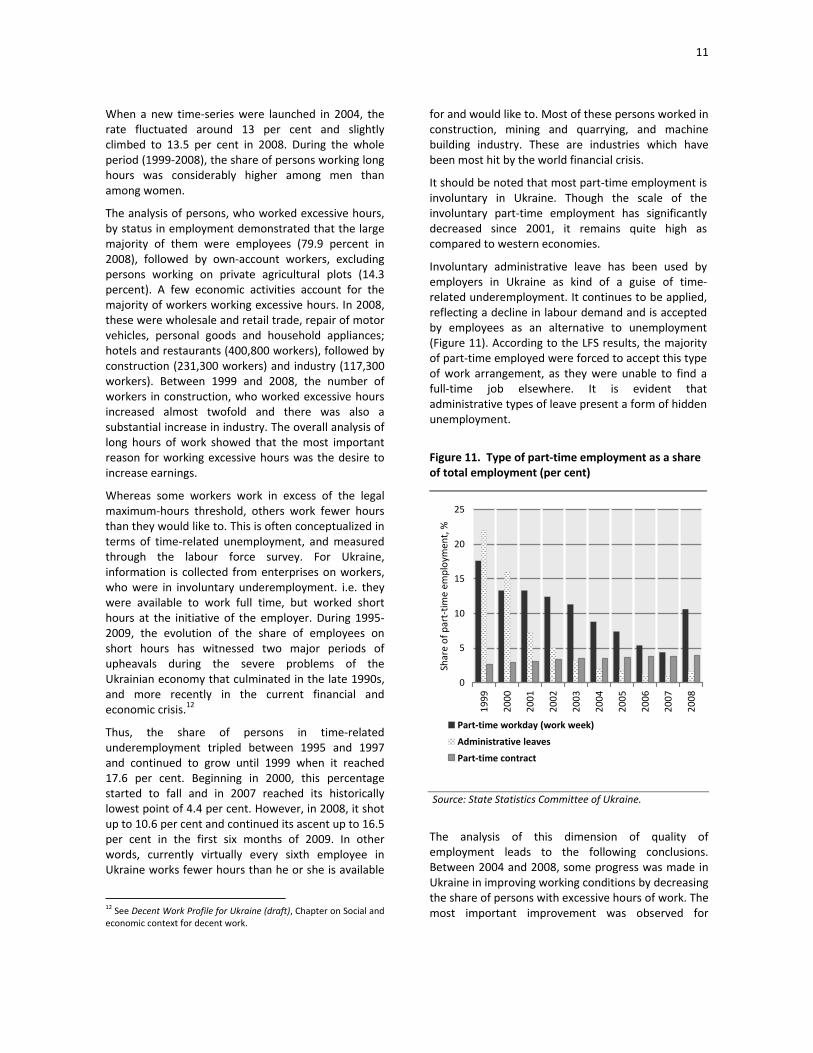
The statutory duration of the working week in Ukraine is 40 hours. During 1997‐2006, the normative duration of annual working time in the national economy of Ukraine grew from 1,479 to 1,922 hours per employed. The longest working hours were observed in manufacturing (2,008 hours), production and distribution of gas, electricity and water (2,009 hours) and construction (1,994 hours); the smallest duration
11 This section is based on findings of the draft Decent Work Profile for Ukraine (draft).
of working time was observed in education (1,699 hours) and in communal, social and personal services (1,834 hours). Figure 10 shows working time by industries.
Figure 10. Hours worked as a share of total working time, 2006 (per cent)
75 80 85 90 95
Health care & social aid
Education
Public administration
Real estate, renting and business
Financial intermediation
Transport and communication
Hotels and restaurants
Wholesale and retail trade
Construction
Electricity, gas and water
Manufacturing
Mining
INDUSTRY
Agriculture
Share of hours worked, %
Source: State Statistics Committee of Ukraine.
The data collected by SSCU revealed that between 1999 and 2003, the share of employed persons, who work long hours (more than 40 hours per week), remained relatively stable at around nine per cent.
11
When a new time‐series were launched in 2004, the rate fluctuated around 13 per cent and slightly climbed to 13.5 per cent in 2008. During the whole period (1999‐2008), the share of persons working long hours was considerably higher among men than among women.
The analysis of persons, who worked excessive hours, by status in employment demonstrated that the large majority of them were employees (79.9 percent in 2008), followed by own‐account workers, excluding persons working on private agricultural plots (14.3 percent). A few economic activities account for the majority of workers working excessive hours. In 2008, these were wholesale and retail trade, repair of motor vehicles, personal goods and household appliances; hotels and restaurants (400,800 workers), followed by construction (231,300 workers) and industry (117,300 workers). Between 1999 and 2008, the number of workers in construction, who worked excessive hours increased almost twofold and there was also a substantial increase in industry. The overall analysis of long hours of work showed that the most important reason for working excessive hours was the desire to increase earnings.
Whereas some workers work in excess of the legal maximum‐hours threshold, others work fewer hours than they would like to. This is often conceptualized in terms of time‐related unemployment, and measured through the labour force survey. For Ukraine, information is collected from enterprises on workers, who were in involuntary underemployment. i.e. they were available to work full time, but worked short hours at the initiative of the employer. During 1995‐2009, the evolution of the share of employees on short hours has witnessed two major periods of upheavals during the severe problems of the Ukrainian economy that culminated in the late 1990s, and more recently in the current financial and economic crisis.12
Thus, the share of persons in time‐related underemployment tripled between 1995 and 1997 and continued to grow until 1999 when it reached 17.6 per cent. Beginning in 2000, this percentage started to fall and in 2007 reached its historically lowest point of 4.4 per cent. However, in 2008, it shot up to 10.6 per cent and continued its ascent up to 16.5 per cent in the first six months of 2009. In other words, currently virtually every sixth employee in Ukraine works fewer hours than he or she is available
12 See Decent Work Profile for Ukraine (draft), Chapter on Social and economic context for decent work.
for and would like to. Most of these persons worked in construction, mining and quarrying, and machine building industry. These are industries which have been most hit by the world financial crisis.
It should be noted that most part‐time employment is involuntary in Ukraine. Though the scale of the involuntary part‐time employment has significantly decreased since 2001, it remains quite high as compared to western economies.
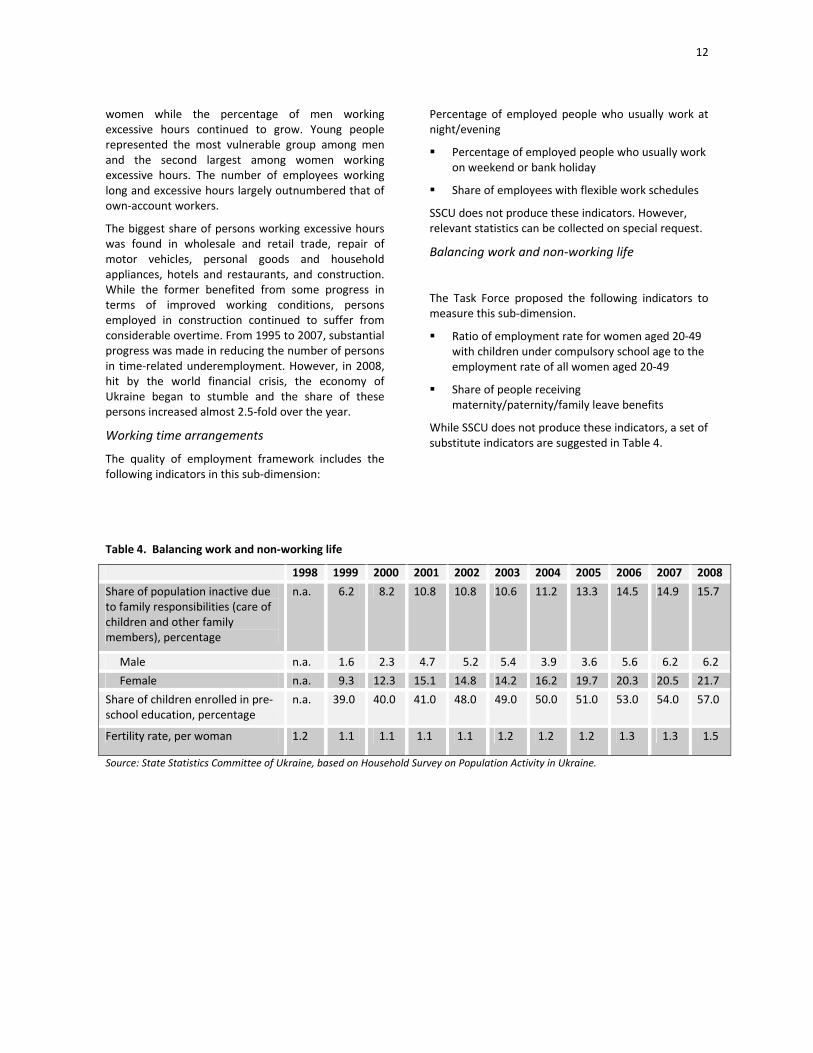
Involuntary administrative leave has been used by employers in Ukraine as kind of a guise of time‐related underemployment. It continues to be applied, reflecting a decline in labour demand and is accepted by employees as an alternative to unemployment (Figure 11). According to the LFS results, the majority of part‐time employed were forced to accept this type of work arrangement, as they were unable to find a full‐time job elsewhere. It is evident that administrative types of leave present a form of hidden unemployment.
Figure 11. Type of part‐time employment as a share of total employment (per cent)
0
5
10
15
20
25
1999
2000
2001
2002
2003
2004
2005
2006
2007
2008
Share of part‐tim
e em
ploymen
t, %
Part‐time workday (work week)
Administrative leaves
Part‐time contract
Source: State Statistics Committee of Ukraine.
The analysis of this dimension of quality of employment leads to the following conclusions. Between 2004 and 2008, some progress was made in Ukraine in improving working conditions by decreasing the share of persons with excessive hours of work. The most important improvement was observed for
12
women while the percentage of men working excessive hours continued to grow. Young people represented the most vulnerable group among men and the second largest among women working excessive hours. The number of employees working long and excessive hours largely outnumbered that of own‐account workers.
The biggest share of persons working excessive hours was found in wholesale and retail trade, repair of motor vehicles, personal goods and household appliances, hotels and restaurants, and construction. While the former benefited from some progress in terms of improved working conditions, persons employed in construction continued to suffer from considerable overtime. From 1995 to 2007, substantial progress was made in reducing the number of persons in time‐related underemployment. However, in 2008, hit by the world financial crisis, the economy of Ukraine began to stumble and the share of these persons increased almost 2.5‐fold over the year.
Working time arrangements
The quality of employment framework includes the following indicators in this sub‐dimension:
Percentage of employed people who usually work at night/evening
Percentage of employed people who usually work on weekend or bank holiday
Share of employees with flexible work schedules
SSCU does not produce these indicators. However, relevant statistics can be collected on special request.
Balancing work and non‐working life
The Task Force proposed the following indicators to measure this sub‐dimension.
Ratio of employment rate for women aged 20‐49 with children under compulsory school age to the employment rate of all women aged 20‐49
Share of people receiving maternity/paternity/family leave benefits
While SSCU does not produce these indicators, a set of substitute indicators are suggested in Table 4.
Table 4. Balancing work and non‐working life
1998 1999 2000 2001 2002 2003 2004 2005 2006 2007 2008
Share of population inactive due to family responsibilities (care of children and other family members), percentage
n.a. 6.2 8.2 10.8 10.8 10.6 11.2 13.3 14.5 14.9 15.7
Male n.a. 1.6 2.3 4.7 5.2 5.4 3.9 3.6 5.6 6.2 6.2
Female n.a. 9.3 12.3 15.1 14.8 14.2 16.2 19.7 20.3 20.5 21.7
Share of children enrolled in pre‐school education, percentage
n.a. 39.0 40.0 41.0 48.0 49.0 50.0 51.0 53.0 54.0 57.0
Fertility rate, per woman 1.2 1.1 1.1 1.1 1.1 1.2 1.2 1.2 1.3 1.3 1.5
Source: State Statistics Committee of Ukraine, based on Household Survey on Population Activity in Ukraine.
13
4. Security of employment and social protection
Most workers would like to know that they can count on stable, regular employment, with little or no period of lay‐off. Should the job either by its nature or type of contract be insecure, it would be important to know that there is some social protection for the worker.
Therefore, social protection offered to workers is also an important aspect of quality of employment. Unemployment insurance coverage, pension coverage, and paid leave for maternity or parental leaves are examples of such social protection.
The quality of employment framework includes the following core indicators to measure this dimension:
Percentage of employees 25 years of age and older with temporary jobs
Percentage of employees 25 years of age and older with job tenure (< 1 yr, 1‐3 yrs, 3‐5 yrs, ≥ 5yrs)
Share of employees covered by unemployment insurance
Public social security expenditure as share of GDP
Share of economically active population contributing to a pension fund
Based on the above premise, and using additional country‐specific indicators, the authors have come up with the following analysis of this dimension in Ukraine.
Security of employment
A labour agreement or a contact without limit of time is the main form of employment organization in Ukraine. Usually, only pensioners are employed with temporary labour agreements (with a possible extension of up to 1‐2 years).
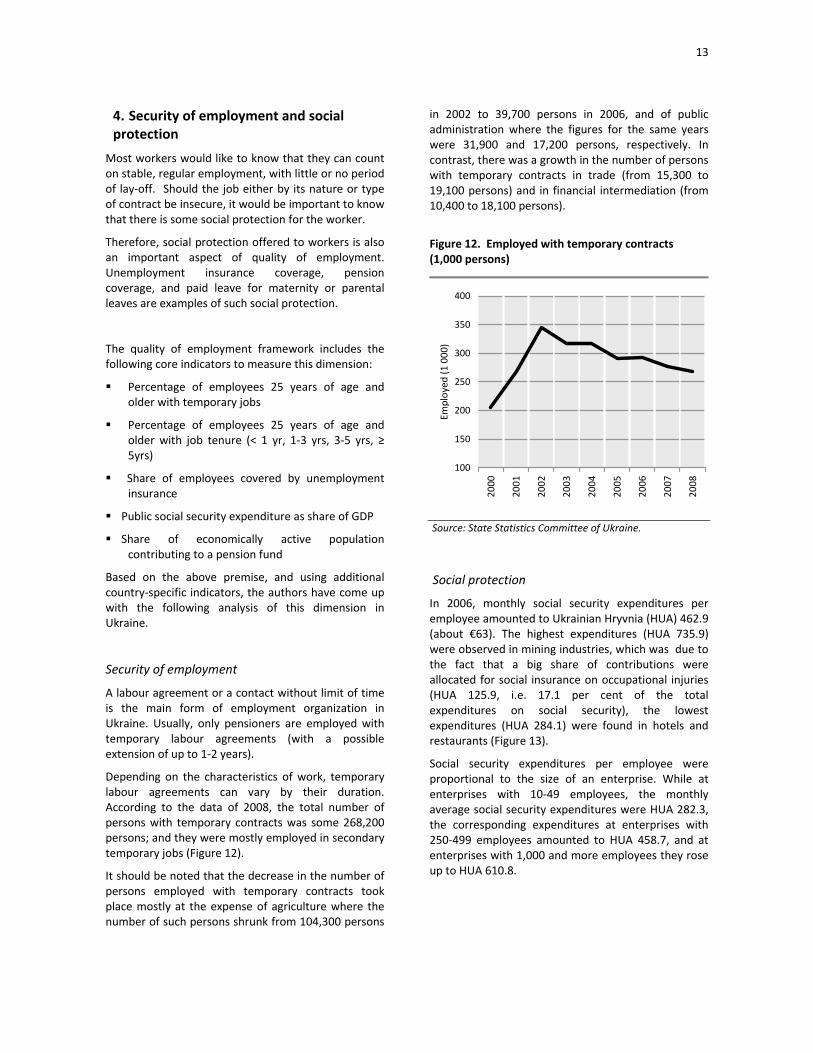
Depending on the characteristics of work, temporary labour agreements can vary by their duration. According to the data of 2008, the total number of persons with temporary contracts was some 268,200 persons; and they were mostly employed in secondary temporary jobs (Figure 12).
It should be noted that the decrease in the number of persons employed with temporary contracts took place mostly at the expense of agriculture where the number of such persons shrunk from 104,300 persons
in 2002 to 39,700 persons in 2006, and of public administration where the figures for the same years were 31,900 and 17,200 persons, respectively. In contrast, there was a growth in the number of persons with temporary contracts in trade (from 15,300 to 19,100 persons) and in financial intermediation (from 10,400 to 18,100 persons).
Figure 12. Employed with temporary contracts (1,000 persons)
100
150
200
250
300
350
400
2000
2001
2002
2003
2004
2005
2006
2007
2008
Employed
(1 000)
Source: State Statistics Committee of Ukraine.
Social protection
In 2006, monthly social security expenditures per employee amounted to Ukrainian Hryvnia (HUA) 462.9 (about €63). The highest expenditures (HUA 735.9) were observed in mining industries, which was due to the fact that a big share of contributions were allocated for social insurance on occupational injuries (HUA 125.9, i.e. 17.1 per cent of the total expenditures on social security), the lowest expenditures (HUA 284.1) were found in hotels and restaurants (Figure 13).
Social security expenditures per employee were proportional to the size of an enterprise. While at enterprises with 10‐49 employees, the monthly average social security expenditures were HUA 282.3, the corresponding expenditures at enterprises with 250‐499 employees amounted to HUA 458.7, and at enterprises with 1,000 and more employees they rose up to HUA 610.8.

14
Figure 13. Monthly social security expenditures by industry and per person, 2006 (HUA)
0 200 400 600 800
Community, etc. services
Health care & social aid
Education
Public administration
Real estate, renting and business
Financial intermediation
Transport and communication
Hotels and restaurants
Wholesale and retail trade
Construction
Electricity, gas and water
Manufacturing
Mining
HUA per person
Source: State Statistics Committee of Ukraine.
According to the national legislation, there are the following four 4 types of social insurance of employees: (i) unemployment, (ii) temporary disability, (iii) pension, and (iv) occupational injuries/accidents (Figure 14).
Figure 14. Distribution of social security expenditures
3.4
5.2
7.4
2.4
3.3
78.3
0 10 20 30 40 50 60 70 80
Pension insurance
Unemployment insurance
Accident insurance
Temporary disability insurance
Assistance during first 5 days of
disability
Other
Per cent
Source: State Statistics Committee of Ukraine.
It should be noted that the largest share of contributions to the Social Security Fund is paid by employers. In addition, employers pay benefits on temporary disability during the first five days of sick leave. Conversely, employees pay a small share of the contributions: between five per cent and 8.5 per cent, depending on their salaries and wages. During 2000‐2006, the average unemployment benefits increased in both nominal and real terms.
However, their ratio to average wage dropped during the same period from 23.3 per cent to 21.3 per cent (Figure 15).
In 2001‐2006, , there was an increase of subsidies to employers for creating new jobs, which triggered the increase of their share from 1.1 per cent in 2001 to 8.8 in total expenditures of the Fund in 2006. As a consequence to the decrease of unemployment rates, the share of expenditures directly related to pecuniary support of the unemployed fell from 63.4 per cent in 2001 to 54.5 per cent in 2006 (Figure 15).
Table 5. Expenditures of Unemployment Insurance Fund
2001 2006
Standard unemployment allowance 5 600 4 970
Single‐paid unemployment allowances to start own business activity
260 290
Allowances during professional training or re‐training
260 190
Welfare 210 10
Banking services 30 10
Professional training and re‐training 340 350
Public works 90 220
Subsidies to employers for creating additional jobs
110 880
Information services and consultancies related to job placement
90 180
Development of information network for unemployed
490 190
Compensations to the Pension Fund related to the early retirement of unemployed
90 180
Creation of new jobs for employees dismissed due to closing of mines
490 190
Administrative expenses 1 780 1 920 Source: State Statistics Committee of Ukraine; Social Security Department, ILO
15
Table 6. Social security
Source: State Statistics Committee of Ukraine; Social Security Department, ILO
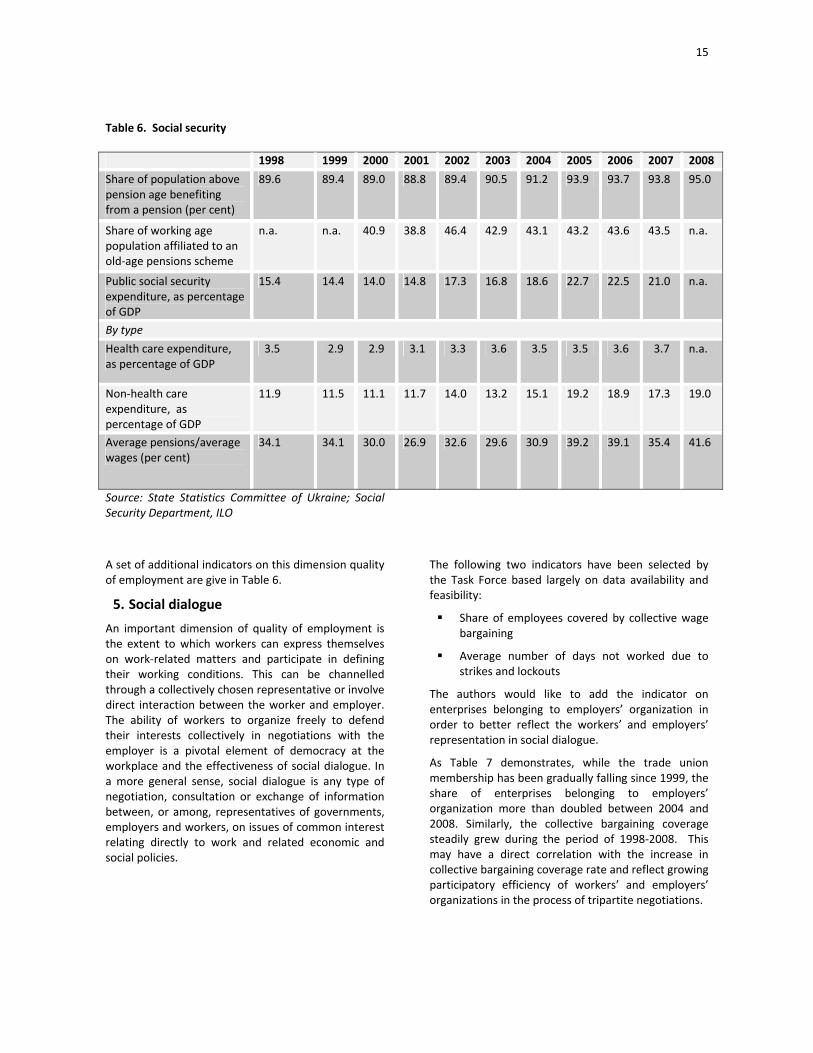
A set of additional indicators on this dimension quality of employment are give in Table 6.
5. Social dialogue An important dimension of quality of employment is the extent to which workers can express themselves on work‐related matters and participate in defining their working conditions. This can be channelled through a collectively chosen representative or involve direct interaction between the worker and employer. The ability of workers to organize freely to defend their interests collectively in negotiations with the employer is a pivotal element of democracy at the workplace and the effectiveness of social dialogue. In a more general sense, social dialogue is any type of negotiation, consultation or exchange of information between, or among, representatives of governments, employers and workers, on issues of common interest relating directly to work and related economic and social policies.
The following two indicators have been selected by the Task Force based largely on data availability and feasibility:
Share of employees covered by collective wage bargaining
Average number of days not worked due to strikes and lockouts
The authors would like to add the indicator on enterprises belonging to employers’ organization in order to better reflect the workers’ and employers’ representation in social dialogue.
As Table 7 demonstrates, while the trade union membership has been gradually falling since 1999, the share of enterprises belonging to employers’ organization more than doubled between 2004 and 2008. Similarly, the collective bargaining coverage steadily grew during the period of 1998‐2008. This may have a direct correlation with the increase in collective bargaining coverage rate and reflect growing participatory efficiency of workers’ and employers’ organizations in the process of tripartite negotiations.
1998 1999 2000 2001 2002 2003 2004 2005 2006 2007 2008
Share of population above pension age benefiting from a pension (per cent)
89.6 89.4 89.0 88.8 89.4 90.5 91.2 93.9 93.7 93.8 95.0
Share of working age population affiliated to an old‐age pensions scheme
n.a. n.a. 40.9 38.8 46.4 42.9 43.1 43.2 43.6 43.5 n.a.
Public social security expenditure, as percentage of GDP
15.4 14.4 14.0 14.8 17.3 16.8 18.6 22.7 22.5 21.0 n.a.
By type
Health care expenditure, as percentage of GDP
3.5 2.9 2.9 3.1 3.3 3.6 3.5 3.5 3.6 3.7 n.a.
Non‐health care expenditure, as percentage of GDP
11.9 11.5 11.1 11.7 14.0 13.2 15.1 19.2 18.9 17.3 19.0
Average pensions/average wages (per cent)
34.1 34.1 30.0 26.9 32.6 29.6 30.9 39.2 39.1 35.4 41.6

16
Table 7: Social dialogue, workers’ and employers’ representation
1998 1999 2000 2001 2002 2003 2004 2005 2006 2007 2008
Gross union density rate,percentage1
75.0 73.2 66.9 63.5 59.2 54.6 53.3 50.6 48.5 45.8 42.1
Enterprises belonging to employers’ organization, per cent (weighted by employment)
n.a. n.a. n.a. n.a. n.a. n.a. 10.3 9.9 10.0 14.3 27.3
Collective bargaining coverage rate, per cent (formal sector)2
68.9 71.9 75.6 78.2 80.3 82.0 84.2 82.1 82.7 82.4 83.4
Average number of days not worked due to strikes
13.0 11.0 14.0 5.0 2.0 10.0 8.0 5.0 2.0 5.0 58.0
Source: State Statistics Committee of Ukraine, based on Annual Reports of Ukrainian Trade Unions and Federation of Employers of Ukraine. 1. The gross union density rate is calculated as the number of trade union members (including. students) over the number of wage and salaried workers, expressed as percentage. 2. The indicator is calculated on the basis of state statistical surveys, which cover business entities, public organizations, financial institutions and institutions funded through the state budget. The survey does not cover small businesses and the self‐employed. The collective bargaining coverage rate is calculated as the number of employees in establishments covered by collective agreements over the total number of employees in establishments covered by the survey, expressed as percentage.
6. Skills development and life‐long learning
The dimension on skills development and life‐long learning proposed by the Task Force contains indicators that show the degree to which workers are trained, and whether employed people are under‐ or over‐qualified for their work. Many workers engage in a job with expectations and aspirations to have an opportunity to further develop their skills and abilities. The job may offer training, which could be appealing to the worker, or it may offer experience and opportunities that the worker sees as important to his or her professional or personal development.
The following indicators are suggested for this element of the quality of employment framework:
Share of employed persons in high skilled occupations
Share of employees who received job training within the last 12 months
Share of employed who have more education than is normally required in their occupation
Share of employed who have less education than is normally required in their occupation
Out of the suggested four indicators, only indicator on the share of employees who received job training
within the last 12 months is produced in Ukraine (Table 8).
Table 8. Skills development in Ukraine, 1998‐2008
Year Share of employees who received job training within
the last 12 months
1998 5.7
1999 5.9
2000 6.5
2001 6.9
2002 8.0
2003 7.7
2004 8.3
2005 8.5
2006 8.6
2007 9.2
2008 9.0 Source: State Statistics Committee of Ukraine
Following from Table 8, it is possible to conclude that in spite of the fact that this indicator has demonstrated a steady growth over the past decade,
17
it still remains low as compared to similar indicators in countries with much higher investments in human capital.
7. Workplace relationships and intrinsic nature of employment
The final element of the quality of employment framework suggested by the Task Forces is the intrinsic nature of work. This dimension provides information on characteristics of employment which inherently satisfy the employed person. People may choose to work with low pay, long hours, under unsafe working conditions etc., if the work has social significance or meaning to them.
Stemming from the above, the following sub‐dimensions and indicators measuring them are suggested:
Workplace relationships
Share of employees who feel they have a strong or very strong relationship with their co‐workers
Share of employees who feel they have a strong or very strong relationship with their supervisor
Share of employees who feel they have been a victim of discrimination at work
Share of employees who feel they have been harassed at work
Intrinsic nature of work
Share of employees who feel they do "useful" work
Share of employees who receive regular feedback from their supervisor
Share of employees who feel they are able to apply their own ideas in work
Share of employees who feel satisfied with their work
None of the indicators belonging to this dimension of the quality of employment is produced in Ukraine. However, the most relevant statistics could technically be collected on a special request.
C. Informal economy and self‐employment
1. Informal economy
While the quality of employment framework proposed by the Task Force is quite comprehensive and suggests a wide range of indicators to measure multiple dimensions of quality of employment, the authors feel that such important aspects as employment in the informal sector and informal employment and self‐employment have not been adequately covered. It should be noted that the above phenomena are widely spread in Ukraine and they generate both a feasible share of GDP and numerous jobs.
The earlier hopes that economic reforms and positive macroeconomic trends would automatically result in shrinking of the informal economy have proved to be overly optimistic. Nevertheless, some positive shifts could be observed.
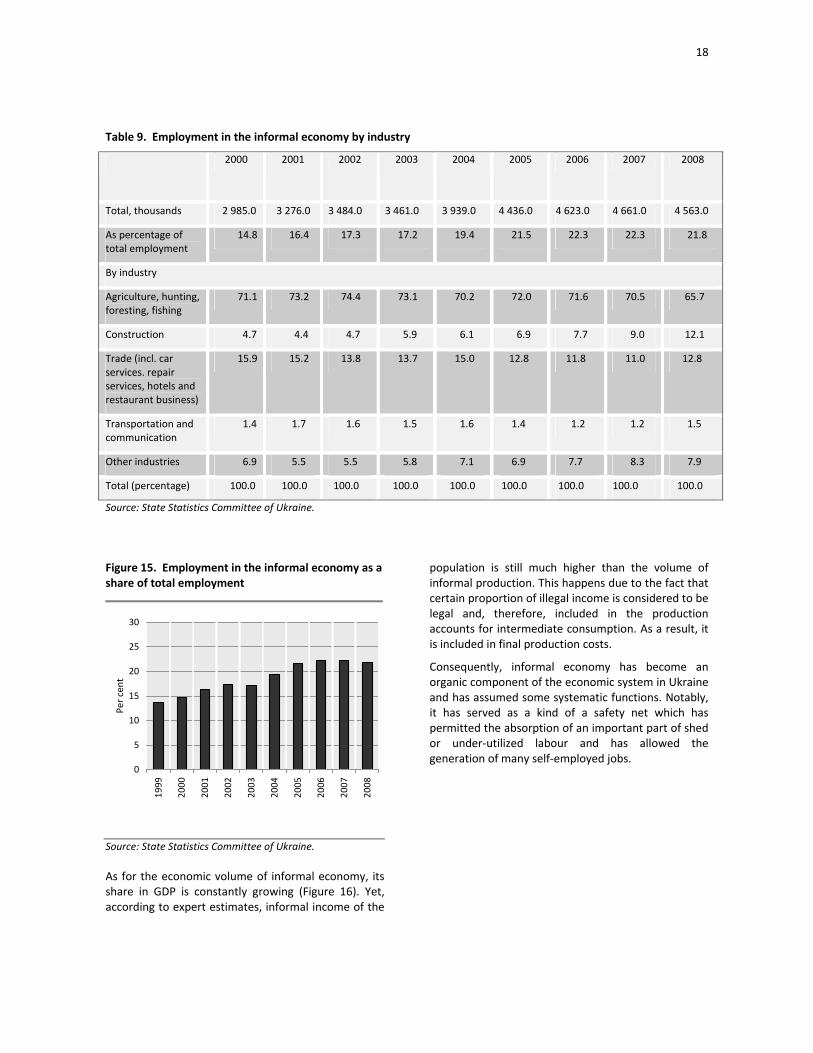
Consequently, the informal economy is still large in Ukraine. It accounts for over 21 per cent of total employment (Table 9 and Figure 15) and it provides a secondary job for almost every second person employed in rural areas; 71.5 per cent of persons employed in the informal sector worked in rural areas. According to 2006 data, 48.6 per cent of persons employed in the informal economy were women.
The majority of employed in the informal economy are persons of working age. According to the 2006 data, they accounted for 79.7 per cent in informal employment, of whom 17.4 per cent were persons aged 15‐24 years and 20.3 per cent were aged 40‐49 years. Informal employment is more widespread among employers and the self‐employed; around 96.7 per cent of those employed and classified accordingly.
It should be noted that presently many employers avoid legal hiring under a different guise. For instance, they do not sign labour contracts with their employees as stipulated by legislation; they hide their real profits and wages of employees from tax inspectors and auditors (so‐called envelop wages paid under a table), or they do not contribute to social insurance schemes through double‐entry book‐keeping, etc. High taxes are considered to be the main reason for the prevailing size of informal economy.
18
Table 9. Employment in the informal economy by industry
2000 2001 2002 2003 2004 2005 2006 2007 2008
Total, thousands 2 985.0 3 276.0 3 484.0 3 461.0 3 939.0 4 436.0 4 623.0 4 661.0 4 563.0
As percentage of total employment
14.8 16.4 17.3 17.2 19.4 21.5 22.3 22.3 21.8
By industry
Agriculture, hunting, foresting, fishing
71.1 73.2 74.4 73.1 70.2 72.0 71.6 70.5 65.7
Construction 4.7 4.4 4.7 5.9 6.1 6.9 7.7 9.0 12.1
Trade (incl. car services. repair services, hotels and restaurant business)
15.9 15.2 13.8 13.7 15.0 12.8 11.8 11.0 12.8
Transportation and communication
1.4 1.7 1.6 1.5 1.6 1.4 1.2 1.2 1.5
Other industries 6.9 5.5 5.5 5.8 7.1 6.9 7.7 8.3 7.9
Total (percentage) 100.0 100.0 100.0 100.0 100.0 100.0 100.0 100.0 100.0
Source: State Statistics Committee of Ukraine.
Figure 15. Employment in the informal economy as a share of total employment
0
5
10
15
20
25
30
1999
2000
2001
2002
2003
2004
2005
2006
2007
2008
Per cent
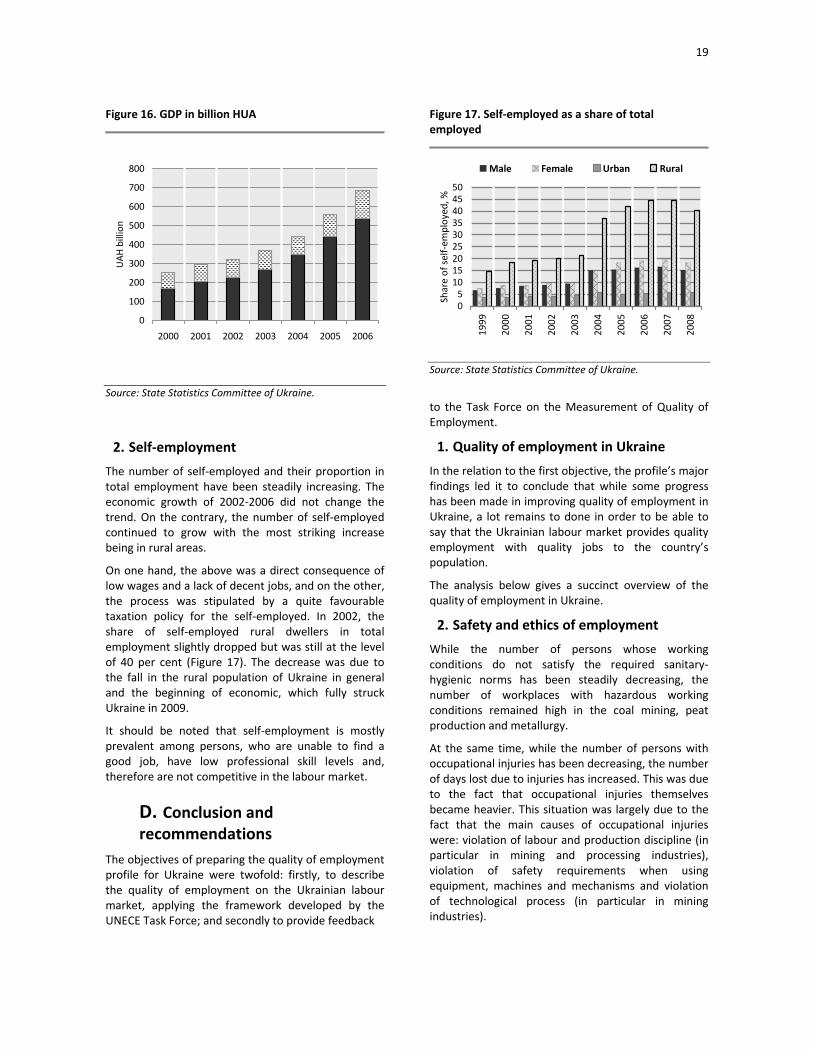
Source: State Statistics Committee of Ukraine. As for the economic volume of informal economy, its share in GDP is constantly growing (Figure 16). Yet, according to expert estimates, informal income of the
population is still much higher than the volume of informal production. This happens due to the fact that certain proportion of illegal income is considered to be legal and, therefore, included in the production accounts for intermediate consumption. As a result, it is included in final production costs.
Consequently, informal economy has become an organic component of the economic system in Ukraine and has assumed some systematic functions. Notably, it has served as a kind of a safety net which has permitted the absorption of an important part of shed or under‐utilized labour and has allowed the generation of many self‐employed jobs.
19
Figure 16. GDP in billion HUA
0
100
200
300
400
500
600
700
800
2000 2001 2002 2003 2004 2005 2006
UAH
billion
Source: State Statistics Committee of Ukraine.
2. Self‐employment
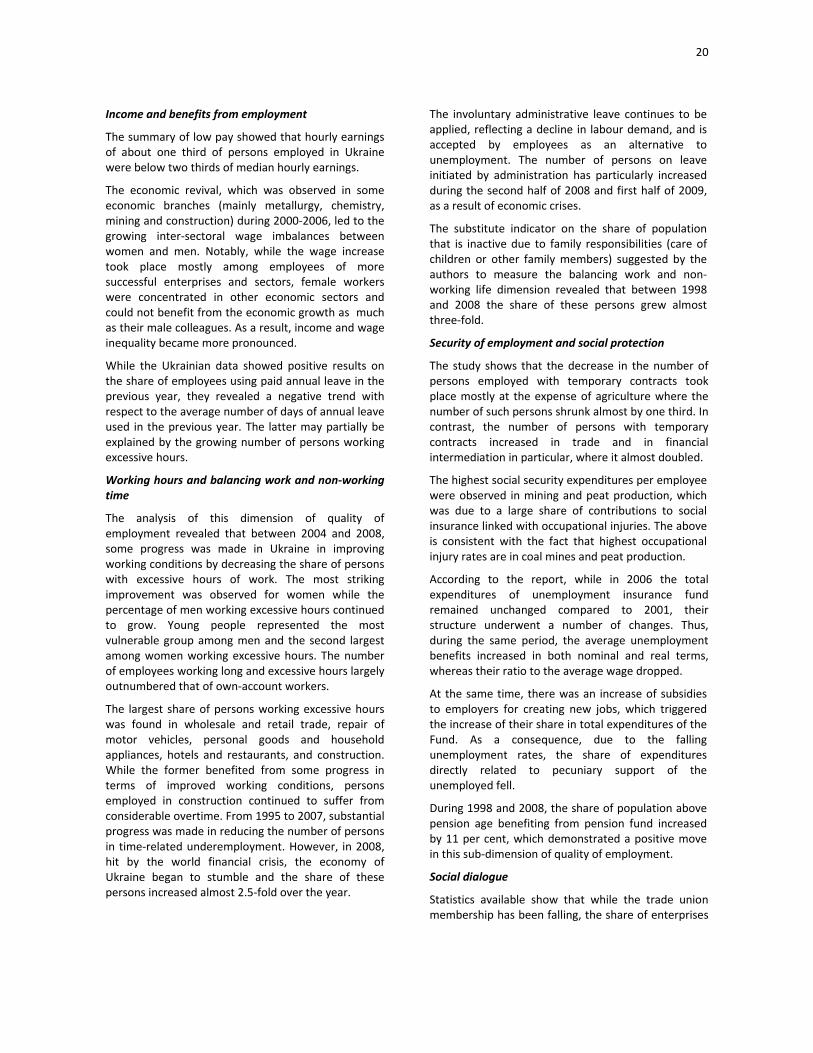
The number of self‐employed and their proportion in total employment have been steadily increasing. The economic growth of 2002‐2006 did not change the trend. On the contrary, the number of self‐employed continued to grow with the most striking increase being in rural areas.
On one hand, the above was a direct consequence of low wages and a lack of decent jobs, and on the other, the process was stipulated by a quite favourable taxation policy for the self‐employed. In 2002, the share of self‐employed rural dwellers in total employment slightly dropped but was still at the level of 40 per cent (Figure 17). The decrease was due to the fall in the rural population of Ukraine in general and the beginning of economic, which fully struck Ukraine in 2009.
It should be noted that self‐employment is mostly prevalent among persons, who are unable to find a good job, have low professional skill levels and, therefore are not competitive in the labour market.
D. Conclusion and recommendations
The objectives of preparing the quality of employment profile for Ukraine were twofold: firstly, to describe the quality of employment on the Ukrainian labour market, applying the framework developed by the UNECE Task Force; and secondly to provide feedback
Figure 17. Self‐employed as a share of total employed
05101520253035404550
1999
2000
2001
2002
2003
2004
2005
2006
2007
2008
Share of self‐em
ployed
, %
Male Female Urban Rural
Source: State Statistics Committee of Ukraine.
to the Task Force on the Measurement of Quality of Employment.
1. Quality of employment in Ukraine
In the relation to the first objective, the profile’s major findings led it to conclude that while some progress has been made in improving quality of employment in Ukraine, a lot remains to done in order to be able to say that the Ukrainian labour market provides quality employment with quality jobs to the country’s population.
The analysis below gives a succinct overview of the quality of employment in Ukraine.
2. Safety and ethics of employment
While the number of persons whose working conditions do not satisfy the required sanitary‐hygienic norms has been steadily decreasing, the number of workplaces with hazardous working conditions remained high in the coal mining, peat production and metallurgy.
At the same time, while the number of persons with occupational injuries has been decreasing, the number of days lost due to injuries has increased. This was due to the fact that occupational injuries themselves became heavier. This situation was largely due to the fact that the main causes of occupational injuries were: violation of labour and production discipline (in particular in mining and processing industries), violation of safety requirements when using equipment, machines and mechanisms and violation of technological process (in particular in mining industries).
20
Income and benefits from employment
The summary of low pay showed that hourly earnings of about one third of persons employed in Ukraine were below two thirds of median hourly earnings.
The economic revival, which was observed in some economic branches (mainly metallurgy, chemistry, mining and construction) during 2000‐2006, led to the growing inter‐sectoral wage imbalances between women and men. Notably, while the wage increase took place mostly among employees of more successful enterprises and sectors, female workers were concentrated in other economic sectors and could not benefit from the economic growth as much as their male colleagues. As a result, income and wage inequality became more pronounced.
While the Ukrainian data showed positive results on the share of employees using paid annual leave in the previous year, they revealed a negative trend with respect to the average number of days of annual leave used in the previous year. The latter may partially be explained by the growing number of persons working excessive hours.
Working hours and balancing work and non‐working time
The analysis of this dimension of quality of employment revealed that between 2004 and 2008, some progress was made in Ukraine in improving working conditions by decreasing the share of persons with excessive hours of work. The most striking improvement was observed for women while the percentage of men working excessive hours continued to grow. Young people represented the most vulnerable group among men and the second largest among women working excessive hours. The number of employees working long and excessive hours largely outnumbered that of own‐account workers.
The largest share of persons working excessive hours was found in wholesale and retail trade, repair of motor vehicles, personal goods and household appliances, hotels and restaurants, and construction. While the former benefited from some progress in terms of improved working conditions, persons employed in construction continued to suffer from considerable overtime. From 1995 to 2007, substantial progress was made in reducing the number of persons in time‐related underemployment. However, in 2008, hit by the world financial crisis, the economy of Ukraine began to stumble and the share of these persons increased almost 2.5‐fold over the year.
The involuntary administrative leave continues to be applied, reflecting a decline in labour demand, and is accepted by employees as an alternative to unemployment. The number of persons on leave initiated by administration has particularly increased during the second half of 2008 and first half of 2009, as a result of economic crises.
The substitute indicator on the share of population that is inactive due to family responsibilities (care of children or other family members) suggested by the authors to measure the balancing work and non‐working life dimension revealed that between 1998 and 2008 the share of these persons grew almost three‐fold.
Security of employment and social protection
The study shows that the decrease in the number of persons employed with temporary contracts took place mostly at the expense of agriculture where the number of such persons shrunk almost by one third. In contrast, the number of persons with temporary contracts increased in trade and in financial intermediation in particular, where it almost doubled.
The highest social security expenditures per employee were observed in mining and peat production, which was due to a large share of contributions to social insurance linked with occupational injuries. The above is consistent with the fact that highest occupational injury rates are in coal mines and peat production.
According to the report, while in 2006 the total expenditures of unemployment insurance fund remained unchanged compared to 2001, their structure underwent a number of changes. Thus, during the same period, the average unemployment benefits increased in both nominal and real terms, whereas their ratio to the average wage dropped.
At the same time, there was an increase of subsidies to employers for creating new jobs, which triggered the increase of their share in total expenditures of the Fund. As a consequence, due to the falling unemployment rates, the share of expenditures directly related to pecuniary support of the unemployed fell.
During 1998 and 2008, the share of population above pension age benefiting from pension fund increased by 11 per cent, which demonstrated a positive move in this sub‐dimension of quality of employment.
Social dialogue
Statistics available show that while the trade union membership has been falling, the share of enterprises
21
belonging to employers’ organizations has been rapidly growing and almost doubled during the past four years. This may have direct correlation with the increase in collective bargaining coverage rate and reflect growing participatory efficiency of workers’ and employers’ organizations in the process of tripartite negotiations.
Skills development and life‐long leaning
Out of the four indicators suggested by the Task Force, Ukraine produces only the share of employees who received training within the last 12 months. The analysis of this sub‐dimension showed that in spite of the fact that there was a steady growth of such employees over the past decade, their share still remains low as compared to similar indicators in countries with much higher investments in human capital.

22
Bibliography Chernyshev, Igor. Socio‐economic security and decent work in Ukraine: A comparative view and statistical findings. ILO
Working paper No. 76. Geneva, October 2005. State Statistics Committee of Ukraine. Statiystychny Shchiorichnyk Ukrainy za 2000 (Statistical Yearbook of Ukraine,
2000). Technika. Kiev, 2001
State Statistical Committee of Ukraine. Statystychni Shchiorichnik Ukraïny za 2008 (Statistical Yearbook, 2008).
Technika. K, 2009.