ukraine: poverty updatesiteresources.worldbank.org/intukraine/resources/poverty_update... · report...
TRANSCRIPT

Report No. 39887 - UA
UKRAINE: Poverty Update June 20, 2007 Human Development Sector Unit Ukraine, Belarus and Moldova Country Unit Europe and Central Asia Region
Document of the World Bank _________________________

ii
CURRENCY EQUIVALENTS (Exchange Rate Effective June 15, 2007)
Currency Unit = Ukrainian Hryvnia
UAH 5.0390 = US$1 UAH 7.5865 = SDR 1
FISCAL YEAR
January 1 – December 31
ABBREVIATIONS AND ACRONYMS
ECA Europe & Central Asia Region EU European Union GCal Gigacalories GE Generalized Entropy GDP Gross Domestic Product HBS Household Budget Expenditure Survey ILO International Labor Organization IMF International Monetary Fund NERC National Electricity Regulatory Commission of Ukraine kWh Kilowatt Hour OECD Organization for Economic Cooperation and Development PPI Producer Price Index PPP Purchasing Power Parity SDR Special Drawing Right SSC State Statistics Committee UAH Ukraine Hryvnia US$ United States Dollar VAT Value-Added Tax .
Vice President: Shigeo Katsu Country Director:
Sector Director:Paul Bermingham Tamar Manuelyan Atinc
Sector Manager: Arup Banerji Task Team Leader: Menahem Prywes

UKRAINE: POVERTY UPDATE
TABLE OF CONTENTS ACKNOWLEDGEMENTS .............................................................................................................. iii EXECUTIVE SUMMARY ............................................................................................................... iv Section 1. Links between poverty and economic trends ............................................................1 Section 2. Poverty measurement and poverty profile ................................................................6 Section 3. Impact of the increase in energy prices on poverty rates.......................................15 Section 4. Conclusions.................................................................................................................19
LIST OF TABLES Table 1. Macro-economic indicators and corresponding poverty rates................................................1 Table 2. Growth of real pension payments ...........................................................................................4 Table 3. Distribution of social transfers across quintiles of net consumption expenditure in 2005 .....5 Table 4: Composition of the monthly per capita 2,508-calorie minimum food basket in 2002 ............6 Table 5. National poverty rates: 2003-2005 .........................................................................................6 Table 6. Sensitivity of poverty rate to the choice of poverty line.........................................................7 Table 7. National poverty rates over 2003-05 using the subsistence minimum ...................................8 Table 8. Characteristics of poverty: 2003-2005....................................................................................9 Table 9. Indicators of inequality: 2003-2005........................................................................................9 Table 10. Poverty rate by type of settlement: 2003-2005...................................................................11 Table 11. Poverty rate by geographic region: 2003-2005...................................................................11 Table 12. Distribution on population across quintiles of consumption expenditure with and
without social transfers in 2005........................................................................................13 Table 13. Poverty rates by household head’s gender: 2004-2005 .....................................................14 Table 14. Shares of expenditures on energy in total household expenditures by category in 2005 ...16 Table 15. Shares of expenditures on energy in total household expenditures of selected East
European and Central Asian Countries in 2005 ...............................................................17 Table 16. Shares of expenditures on energy in total household expenditure by quintile of
expenditure, and by category, in 2005..............................................................................17 Table 17. Estimated increases in the poverty rate resulting from energy price increases, under
alternative assumptions.....................................................................................................18 Table 18. Estimated increases in transfers needed to raise expenditures of the poor to pre-energy
price increase levels..........................................................................................................18
LIST OF ANNEX
Annex 1. STATISTICAL TABLES ...................................................................................................21 Annex 2. Methodology for Simulating the Impact of the Energy Price Increase on Poverty Rates .34

LIST OF TABLES OF ANNEX 1 Annex 1 Table 1. Real wages by economic activity...........................................................................21 Annex 1 Table 2. Major Pension-Wage Ratios ..................................................................................22 Annex 1 Table 3. Pensions..................................................................................................................22 Annex 1 Table 4. Indicators of Poverty by Type of Settlement .........................................................23 Annex 1 Table 5. Poverty by Geographic Regions.............................................................................24 Annex 1 Table 6. Mean per-capita expenditure in real terms.............................................................25 Annex 1 Table 7. Decomposition of inequality by regions ................................................................26 Annex 1 Table 8. Decomposition of inequality by urban and rural areas ..........................................27 Annex 1 Table 9. Inequality in per-capita expenditure distribution by urban and rural areas ...........27 Annex 1 Table 10. Growth and redistribution decomposition of poverty changes ............................28 Annex 1 Table 11. Regional Poverty Decomposition ........................................................................28 Annex 1 Table 12. Poverty rates by Labor Market Status of Head of Household .............................29 Annex 1 Table 13. Poverty rates by Age Group.................................................................................30 Annex 1 Table 14. Poverty by Education Level .................................................................................31 Annex 1 Table 15. Poverty by Household Head's Gender .................................................................32 Annex 1 Table 16. Poverty by Demographic Composition................................................................33
LIST OF FIGURES
Figure 1. Poverty rate in Ukraine: 2000 - 2005 ...................................................................................1 Figure 2 Growth in real GDP and real wages .......................................................................................2 Figure 3. Real wages by region: 2003 - 2006 ......................................................................................3 Figure 4. Real wages by economic activity: 2003 - 2006....................................................................3 Figure 5. Density functions of real consumption per capita from 2004 to 2005 ..................................8 Figure 6. Growth Incidence Curve 2004-2005 Ukraine .....................................................................10 Figure 7. Poverty rate by household size ............................................................................................12 Figure 8. Poverty rate by age group in 2005.......................................................................................12 Figure 9. Households’ poverty rates by number of children aged 0-6................................................13 Figure 10. Poverty rate by household head’s education: 2005 ..........................................................14 Figure 11. Poverty rates by status of head of household ....................................................................15 Figure 12. Natural gas prices by type of user .....................................................................................16 Figure 13. Retail prices of electricity by type of user.........................................................................16
ii

ACKNOWLEDGEMENTS
This Update is a product of the Human Development Department of the East Europe and Central Asia Region at the World Bank. It was written by a team consisting of Abdu Muwonge (Young Professional and lead author), Yulia Smolyar (Consultant), Rodica Cnobloch (Consultant) and Menahem Prywes (Senior Economist and Task Team Leader). The team thanks Ms. Ella Libanovna, Director of the Ukraine Institute for Demography and Social Studies for the Institute’s analytical work on poverty and for its cooperation with the World Bank. In particular, the team is grateful to Ms. Lyudmila Cherenko of the Institute for her contributions to this Update and for her advice. The team thanks the management and staff of the State Statistical Committee for their cooperation and for their work in collecting the Household Budget Survey. The team is grateful to the many World Bank staff and consultants who made substantive contributions to the Update. The team thanks Martin Raiser (Adviser), Cem Mete (Senior Economist), Lire Ersado (Economist), Oleksiy Ivaschenko (Economist) and Edmundo Murrugarra (Senior Economist) for guiding the analysis and for generous contributions of technical advice. Dmytro Glazkov (Consultant) contributed substantively to the work on energy and Shweta Jain (Junior Professional Associate) contributed to the statistical work at an early stage. Ruslan Pionkivsky (Economist) contributed to the macro-economic overview. The team thanks Michael Lokshin (Senior Economist) and Zurab Shajaia (Consultant) for developing a program for automating poverty assessments and thanks Mr. Shajaia for running the program on the Ukraine household budget survey. The team thanks Anna Goodman (Program Assistant) for her work in preparing the document.
Importantly, we thank Arup Banerji (Sector Manager), for guidance through all stages of writing. And we thank Paul Bermingham (Country Director for Ukraine) for guidance and leadership and we thank Mamta Murthi (Sector Manager) for support for our work.
iii
iv
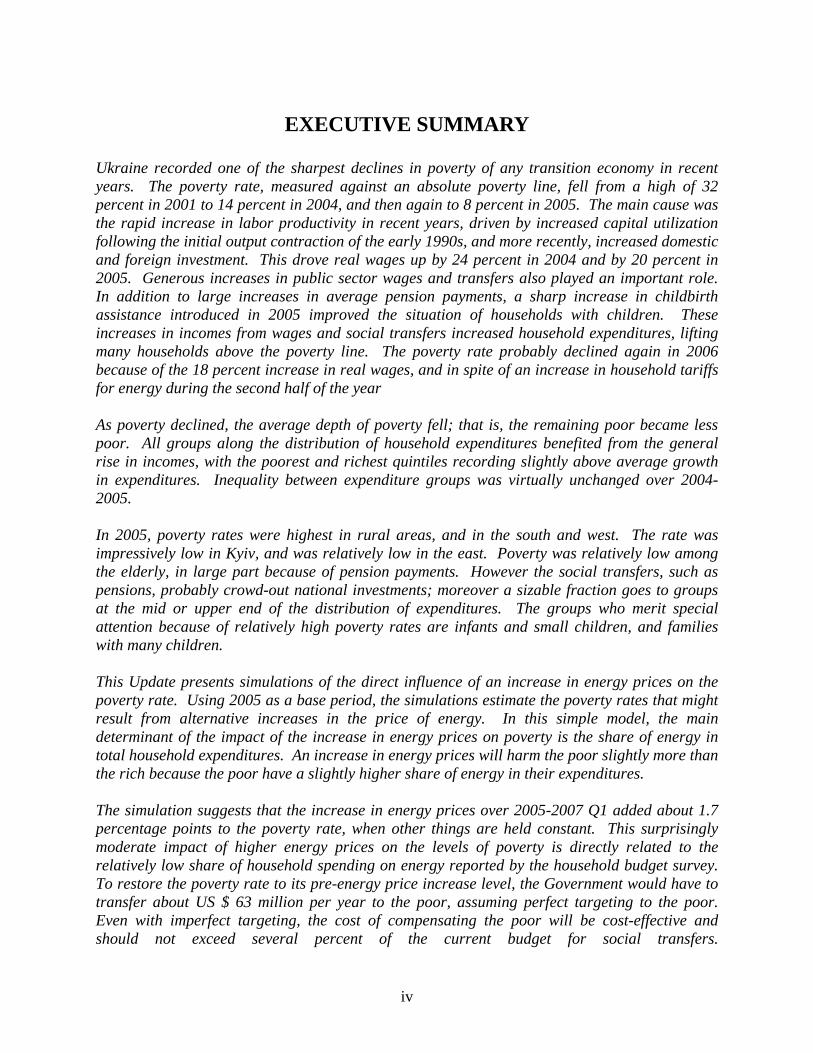
EXECUTIVE SUMMARY Ukraine recorded one of the sharpest declines in poverty of any transition economy in recent years. The poverty rate, measured against an absolute poverty line, fell from a high of 32 percent in 2001 to 14 percent in 2004, and then again to 8 percent in 2005. The main cause was the rapid increase in labor productivity in recent years, driven by increased capital utilization following the initial output contraction of the early 1990s, and more recently, increased domestic and foreign investment. This drove real wages up by 24 percent in 2004 and by 20 percent in 2005. Generous increases in public sector wages and transfers also played an important role. In addition to large increases in average pension payments, a sharp increase in childbirth assistance introduced in 2005 improved the situation of households with children. These increases in incomes from wages and social transfers increased household expenditures, lifting many households above the poverty line. The poverty rate probably declined again in 2006 because of the 18 percent increase in real wages, and in spite of an increase in household tariffs for energy during the second half of the year As poverty declined, the average depth of poverty fell; that is, the remaining poor became less poor. All groups along the distribution of household expenditures benefited from the general rise in incomes, with the poorest and richest quintiles recording slightly above average growth in expenditures. Inequality between expenditure groups was virtually unchanged over 2004-2005. In 2005, poverty rates were highest in rural areas, and in the south and west. The rate was impressively low in Kyiv, and was relatively low in the east. Poverty was relatively low among the elderly, in large part because of pension payments. However the social transfers, such as pensions, probably crowd-out national investments; moreover a sizable fraction goes to groups at the mid or upper end of the distribution of expenditures. The groups who merit special attention because of relatively high poverty rates are infants and small children, and families with many children. This Update presents simulations of the direct influence of an increase in energy prices on the poverty rate. Using 2005 as a base period, the simulations estimate the poverty rates that might result from alternative increases in the price of energy. In this simple model, the main determinant of the impact of the increase in energy prices on poverty is the share of energy in total household expenditures. An increase in energy prices will harm the poor slightly more than the rich because the poor have a slightly higher share of energy in their expenditures. The simulation suggests that the increase in energy prices over 2005-2007 Q1 added about 1.7 percentage points to the poverty rate, when other things are held constant. This surprisingly moderate impact of higher energy prices on the levels of poverty is directly related to the relatively low share of household spending on energy reported by the household budget survey. To restore the poverty rate to its pre-energy price increase level, the Government would have to transfer about US $ 63 million per year to the poor, assuming perfect targeting to the poor. Even with imperfect targeting, the cost of compensating the poor will be cost-effective and should not exceed several percent of the current budget for social transfers.

Section 1. Links between poverty and economic trends The national poverty rate fell steeply over 2001-2005. Dynamic and sustained growth of the Ukrainian economy drove the national poverty rate down from a peak of nearly 32 percent in 2001 to less than 8 percent in 2005, and data on real wages suggest that this trend continued in 2006 (Figure 1 and Table 1). The rapid decline in the poverty rates reflects the strength and broad base of the recent economic recovery.
Figure 1. Poverty rate in Ukraine: 2000 - 2005
(Poverty line = 1813 UAH per person per year; in percentage points)
0%
5%
10%
15%
20%
25%
30%
35%
2000 2001 2002 2003 2004 2005
Sources: Ukraine HBS & World Bank
Table 1. Macro-economic indicators and corresponding poverty rates
2001 2002 2003 2004 2005 2006 EstReal GDP (% changes) 9.2 5.2 9.6 12.1 2.7 7.1of which, Household consumption 9.6 9.5 11.5 13.1 20.6 14.4Unemployment rate (ILO, % point rate) 10.9 9.6 9.1 8.6 7.2 6.7Real wages (% changes) 19.3 18.2 15.2 23.8 20.3 18.3Poverty rate (% point rate) 31.7 25.5 19.5 14.0 7.9 NASources: State Statistics Committee, ILO, World Bank Development Data base.
The strength of the recent recovery reflects, in part, the depth of the initial output contractions. GDP fell throughout the 1990s (Figure 2). GDP fell faster than employment, so labor productivity fell, and real wages fell from relatively uncompetitive levels in the early years of transition. At the end of this adjustment, real wages were relatively low and much capital lay idle. But starting in the late 1990s, monetary and fiscal policy helped stabilize inflation and exchange rates. Moreover, the passing of the Russian financial crisis of 1998 boosted demand for Ukraine’s exports and improved the availability of credit. In this more stable environment, competitive costs of production increased demand, production, and labor productivity. The large real exchange rate depreciation after 1999, together with the downward adjustment of real wages lowered unit costs of production (in foreign currency terms) and allowed Ukrainian exporters to offer their goods and services at
1
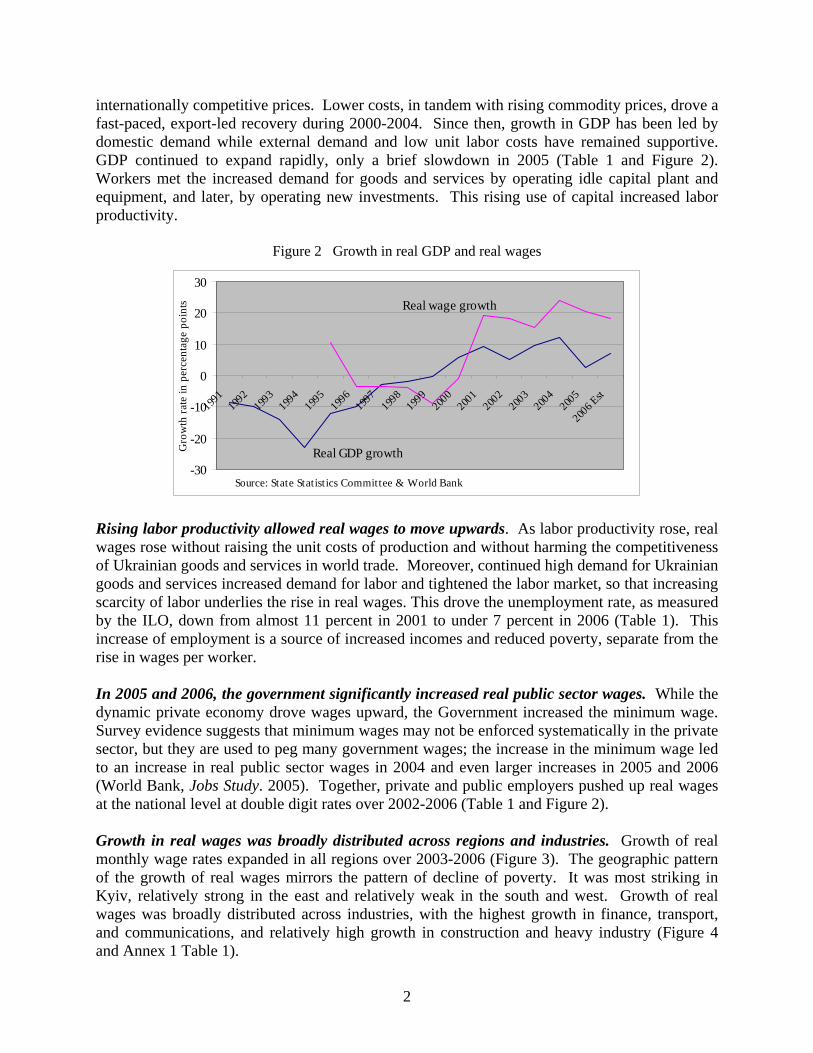
internationally competitive prices. Lower costs, in tandem with rising commodity prices, drove a fast-paced, export-led recovery during 2000-2004. Since then, growth in GDP has been led by domestic demand while external demand and low unit labor costs have remained supportive. GDP continued to expand rapidly, only a brief slowdown in 2005 (Table 1 and Figure 2). Workers met the increased demand for goods and services by operating idle capital plant and equipment, and later, by operating new investments. This rising use of capital increased labor productivity.
Figure 2 Growth in real GDP and real wages
-30
-20
-10
0
10
20
30
1991
1992
1993
1994
1995
1996
1997
1998
1999
2000
2001
2002
2003
2004
2005
2006 E
st
Gro
wth
rate
in p
erce
ntag
e po
ints
Real GDP growth
Real wage growth
Source: State Statistics Committee & World Bank
Rising labor productivity allowed real wages to move upwards. As labor productivity rose, real wages rose without raising the unit costs of production and without harming the competitiveness of Ukrainian goods and services in world trade. Moreover, continued high demand for Ukrainian goods and services increased demand for labor and tightened the labor market, so that increasing scarcity of labor underlies the rise in real wages. This drove the unemployment rate, as measured by the ILO, down from almost 11 percent in 2001 to under 7 percent in 2006 (Table 1). This increase of employment is a source of increased incomes and reduced poverty, separate from the rise in wages per worker. In 2005 and 2006, the government significantly increased real public sector wages. While the dynamic private economy drove wages upward, the Government increased the minimum wage. Survey evidence suggests that minimum wages may not be enforced systematically in the private sector, but they are used to peg many government wages; the increase in the minimum wage led to an increase in real public sector wages in 2004 and even larger increases in 2005 and 2006 (World Bank, Jobs Study. 2005). Together, private and public employers pushed up real wages at the national level at double digit rates over 2002-2006 (Table 1 and Figure 2). Growth in real wages was broadly distributed across regions and industries. Growth of real monthly wage rates expanded in all regions over 2003-2006 (Figure 3). The geographic pattern of the growth of real wages mirrors the pattern of decline of poverty. It was most striking in Kyiv, relatively strong in the east and relatively weak in the south and west. Growth of real wages was broadly distributed across industries, with the highest growth in finance, transport, and communications, and relatively high growth in construction and heavy industry (Figure 4 and Annex 1 Table 1).
2
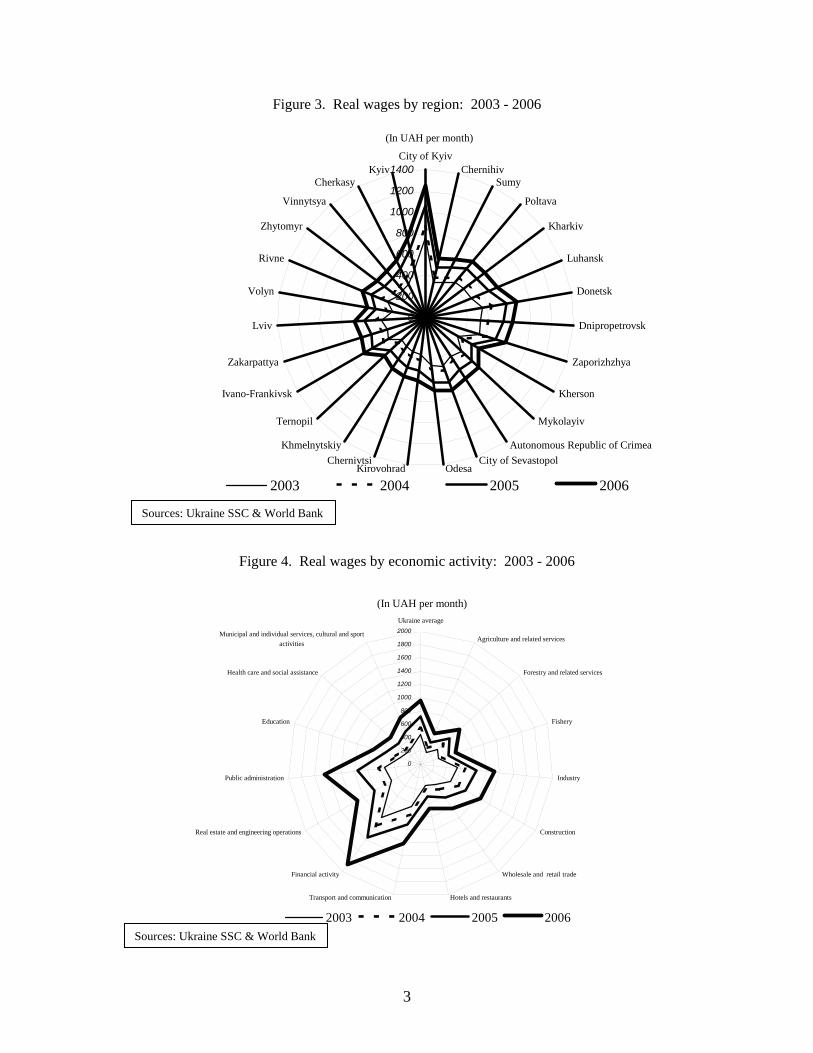
Figure 3. Real wages by region: 2003 - 2006
(In UAH per month)
0
200
400
600
800
1000
1200
1400City of Kyiv
ChernihivSumy
Poltava
Kharkiv
Luhansk
Donetsk
Dnipropetrovsk
Zaporizhzhya
Kherson
Mykolayiv
Autonomous Republic of CrimeaCity of Sevastopol
OdesaKirovohradChernivtsi
Khmelnytskiy
Ternopil
Ivano-Frankivsk
Zakarpattya
Lviv
Volyn
Rivne
Zhytomyr
Vinnytsya
CherkasyKyiv
2003 2004 2005 2006
Sources: Ukraine SSC & World Bank
Figure 4. Real wages by economic activity: 2003 - 2006
(In UAH per month)
0
200
400
600
800
1000
1200
1400
1600
1800
2000Ukraine average
Agriculture and related services
Forestry and related services
Fishery
Industry
Construction
Wholesale and retail trade
Hotels and restaurantsTransport and communication
Financial activity
Real estate and engineering operations
Public administration
Education
Health care and social assistance
Municipal and individual services, cultural and sportactivities
2003 2004 2005 2006Sources: Ukraine SSC & World Bank
3

Besides wages, the main reason for the decrease in the poverty rate was a sharp increase in social transfers. Over past years, the growing proportion of elderly people in the population has exerted upward pressure on pension payments. To control this, the authorities imposed a limit on pensions and allowed occasional inflation adjustments. As a result pension benefits were almost flat. In September, 2004, during the presidential election campaign, the Government raised pensions sharply upward to the subsistence minimum, an indicator established each year by Parliament (Box 1).
Box 1: The subsistence minimum
The subsistence minimum, as defined in Article 45 of the Constitution, is the reference income for securing living standards for all Ukrainians. The Parliament began setting the subsistence minimum in 2000 and since 2004 the Parliament has set the subsistence minimum as part of the annual State Budget Law. Over 2000-2001 the subsistence minimum was set close to the average wage, but in later years average wages rose more quickly. The subsistence minimum is important because the Government of Ukraine uses it to set some wages and transfers. According to the law, the subsistence minimum should be the basis for fixing the minimum wage. Over 2000-2006 the minimum wage rose from about 35 to 70 percent of the subsistence minimum. A Presidential Order fixing the minimum wage at the subsistence minimum level will become effective in 2009. While the minimum wage is not generally enforced, it is used to set some public sector wages. Importantly, the Government has used the subsistence minimum to guide minimum pensions, especially since September 2004.
In September 2004, the real minimum pension rose by 177 percent to a level higher than the average wage. On a 12 months end-year basis, the real average pension rose by 35 percent in 2004 and then by a further 29 percent in 2005 (Table 2 and Annex 1 Table 3). In addition to pensions, the Government increased the childbirth benefit to families.
Table 2. Growth of real pension payments (Percentage point changes in payments per person per month, end of year figures)
2003 2004 2005 2006 Minimum pension -- 176.9% 5.3% -0.9%Average pension -- 34.8% 28.9% 0.5%Source: Ministry of Labor & Social Policy, Pension Fund of Ukraine, annual State Budget Laws, & World Bank.
The increase in social transfers significantly reduced poverty. The team estimated the impact on the poverty rate of the increases in social transfers (including pensions), when all other sources of income are constant, through a simulation. It added the 2004-2005 average increase in social transfers per capita to the consumption expenditure per capita of households receiving these benefits in 2004, and then re-calculated the poverty rate. Based on this simulation, the team estimates that the increase in social transfers explains a bit less than 2 percentage points of the more than 6 percentage point decline in the poverty rate over 2004-2005. This was a simplified simulation, since households were assumed to spend all of the income from increased transfers, although they might save or defer spending of part of the increase.
4

The decrease in poverty as a result of rising social transfers happened even though social transfers are not well targeted to the poor. Households who are not poor receive a substantial proportion of the social transfers; this means that the transfers are not an efficient means to reduce poverty. Or alternatively, much less could be spent on poverty-reducing social transfers if they were better targeted to the poor. Table 3 presents the percentage of social transfers received by each quintile (20 percent group) of household consumption expenditure, ranked from the poorest quintile on the left to the richest quintile on the right. The poorest quintile receives 45 percent of the transfers and the next poorest receives 21 percent; about a third of the transfers accrue to the top three quintiles.
Table 3. Distribution of social transfers across quintiles of net consumption expenditure in 2005
(Percentage point distribution over consumption expenditures net of social transfers)
Poorest Richest 1st 2nd 3d 4th 5thPension 45.7 20.2 13.3 10.6 10.3Social assistance to families with children 22.7 26.6 23.7 15 .8 11.8Social assistance to poor families 37.9 32.6 22.3 4.2 3.0Housing subsidy 32.3 18.6 19.9 16.0 13.2Liquefied natural gas 40.9 21.9 11.0 12.3 13.9Total social transfers 44.7 20.6 13.7 10.7 10.3Note: Ukraine household budget survey & World Bank
Pensions form 89 percent of all transfers and about a third are received by the top three quintiles (Table 3). Social assistance to families with children forms almost 8 percent of transfers and more than half is sent to the upper three quintiles. The remaining three transfer programs are small. Social assistance to the poor families sends more than a quarter of its funds to the upper three quintiles. The social transfers are probably not fiscally sustainable. The increase in the minimum in 2004 drove pension expenditures up from 9.2 percent of GDP in 2003 to 11.4 percent in 2004 and a record 15.2 percent in 2005 (with deficits in the pension fund of 1 and 3 percent of GDP in 2004 and 2005). The Government introduced measures to contain the hike in 2006, and this helped to control increases in the pension fund deficit. But the system could still benefit from action to reduce the burdensome rates on payroll taxes, to face the rising “dependency ratio” (the product of an aging population and the early retirement age provisions), and to assure long run sustainability for current pensioners. Such actions could include a higher retirement age for women and an increased number of contribution years And the transfers may have undesirable consequences for the economy. The costs of social transfers most likely crowd-out expenditures in areas such as health and education and renewal of national infrastructure, for example, in roads. The high level of government expenditures would complicate any effort to reduce taxes, and these taxes may discourage private investment. High taxes might also prevent some enterprises from emerging from the informal economy, where they do not contribute to the pension fund.
5

In summary, the poverty rate declined in 2005 because the growth of real wages and of real social transfers. The high fiscal spending and tax rates that result from the inefficient pension system will probably exert some drag on the economy in the future. But this drag was more than counterbalanced over 2000-2006 by improvements in demand and productivity that boosted real wages by a cumulative 190 percent. This, together with the 70 percent cumulative increase in real pensions over 2004-2006, lifted household incomes and expenditures and explains the impressive decline of the poverty rate. The next section explains how the team measured poverty and then focuses on the composition of poverty.
Section 2. Poverty measurement and poverty profile This Update monitors poverty over time mainly by using a constant poverty line that measures the approximate cost of meeting minimum human needs. The World Bank monitors the poverty rate in Ukraine computed from a poverty line of 1,813 UAH per year per person in 2003 prices (Box 2). This line is an estimate of minimum needs for food and non-food goods &
services and was developed with an expert from the Ukrainian Institute of Demography. The World Bank also monitors a rate based on a line of 1,275 UAH, the estimated cost in 2003 of the 2,508 minimum necessary daily calories per person. Buying the minimum number of calories costs 1,275 UAH per year (151 UAH per month), and this translates into small monthly purchases of food (Table 4). Poverty rates declined. Poverty rates estimated using both poverty lines declined steeply in 2005; only 2 percent of the population could not buy the minimum necessary calories (Table 5). The standard errors in Table 5 are relatively low, indicating a low probability of measurement error from sampling a non-representative population.
Table 4: Composition of the monthly per capita 2,508-calorie minimum food basket in 2002
Kg.s % of cost Bread products & cereals 9.8 16.4 Meat & meat products 2.2 18.5 Fish & seafood 1.1 4.9 Mild & milk products 6.9 10.5 Eggs, count 15.4 3.8 Butter 0.2 2.0 Margarine & other animal fats 6.9 4.1 Vegetable oil 1.0 4.2 Fruit 2.9 4.7 Vegetables 6.9 9.9 Potatoes 8.4 7.6 Sugar & confectionery 2.6 10.7 Sauces, Seasonings, spices 0.5 1.2 Coffee, tea, cocoa 0.0 0.0 Soft drinks & juices 1.6 1.6 Total 100.0 Source: Libanova, et. al. (2004)
Table 5. National poverty rates: 2003-2005
(In percentage point shares of the population; standard errors in parentheses)
Poverty rates 2003 2004 2005 Standard line for monitoring: Line=1,813UAH/year/person in 2003 prices 18.8 14.0 7.9 (0.27) (0.23) (0.18) Cost of min necessary calories: Line=1,275UAH/year/person in 2003 prices 4.8 4.1 1.9 (0,15) (0.13) (0.09) Source: World Bank estimates, based on the Ukraine Budget Survey.
6

Box 2. Measurement of the poverty rate. Sources. In Ukraine, the source of information for computation of the rate is the State Statistics Committee, which conducts the Household Budget Expenditure Survey. This survey of about 10,000 people produces information on households’ expenditures on goods and services, on household size, and related matters. The methodology applied here is described in the World Bank (2005) Ukraine: Poverty Assessment, Poverty and Inequality in a Growing Economy. Consumption expenditure. The first step is to compute total consumption per household. The methodology excludes durables because these are a stock rather than a flow; it excludes tax payments and repayments of debt and interest because these are not direct contributors to current well-being; and excludes health expenditures because of measurement difficulties. Next, the methodology adjusts the resulting total consumption expenditure for prices differences across economic regions and types of settlement by using disaggregated regional price indexes. The computation puts consumption per household on a per person basis by dividing by the size of the household. Poverty lines. The poverty lines applied here are absolute, that is, they are constant after adjustment for inflation. In line with the earlier World Bank work on Ukraine, the team uses a basic needs measure of the poverty line, where the principle need is for food. According to nutritional guidelines, people are assumed to need a minimum of 2,508 calories per day. The cost of these calories is computed using the food basket of households who are near the calorie threshold and by using the prices they face (Table 4). In addition, a non-food allowance is estimated using the share of non food consumption for the population around the calorie threshold. Based on the above methodology, the resulting poverty line is 1,813 UAH per year per person (UAH 151 per person per month) in 2003 and the underlying food basket is valued at 1,275 UAH per year person (UAH 106.3) per person per month. Poverty rates. The poverty rate in 2003 is the percentage of people whose consumption expenditures fall below the poverty line. To compute the 2004 and 2005 poverty estimates, total consumption per person is adjusted to 2003 prices using consumer prices indexes.
Poverty declines no matter what the choice of poverty line. The large decline in the poverty rate is not explained by the choice of a relatively low poverty line. The standard poverty rate declined by 6.1 percentage points over 2004-05 (Table 6). The choice of a 10 percent higher poverty line would actually lead to a larger, 7.2 percentage point, decline in poverty, while the choice of a 20 percent higher line would lead to a 9 percentage point, decline.
Table 6. Sensitivity of poverty rate to the choice of poverty line (In percentage points, poverty line =1813 UAH per person per year)
2003 2004 2005 Actual 18.8 14.0 7.9 +5% 21.7 16.5 9.8 +10% 24.7 18.8 11.6 +20% 31.5 24.4 15.4 -5% 16.0 12.0 6.5 -10% 13.0 10.3 5.2 -20% 8.3 6.7 3.1 Source: Ukraine household budget survey & World Bank
7

Table 7. National poverty rates over 2003-05 using the subsistence minimum in 2006 as a poverty line
(In percentage point shares of the population)
Poverty rate 2003 2004 2005 Subsistence minimum in 2006: Line=4,393UAH/year/person in 2003 prices 83.7 78.2 67.7 Note: Subsistence minimum in 2006 in current UAH averaged 464 per month. Sources: World Bank estimates, based on the Ukraine Budget Survey.
Poverty rates decline even when the 2006 subsistence minimum is used as the absolute poverty line. The subsistence minimum set by the Parliament is much higher than the poverty lines applied in Table 6; the subsistence minimum presumably reflects its perception of socially acceptable minimum consumption. Table 7 presents poverty rates computed using the 2006 subsistence minimum, put in constant 2003 UAH, as the absolute poverty line. Under this definition, the poverty rate declines from about 84 percent in 2003 to 68 percent in 2005. No matter how the household budget survey is analyzed, the conclusion is that poverty has declined.
Figure 5. Density functions of real consumption per capita from 2004 to 2005 (Probabilities on the y axis and the natural log of real consumption per capita on the x axis)
0.2
.4.6
.8D
ensi
ty
6 7 8 9 10 11ln_rconsaggpc
2004 2005
Sources: Ukraine HBS & World Bank
Poverty line = 1812.8 UAH
The expansion of consumption expenditures in 2005 led to a substantial decline in the poverty rate because so many households were just below the poverty line in 2004. The density function for real household consumption expenditures per capita (ln_ronconsaggpc) across expenditure groups, ranked from the poorest to the richest groups of households, shifted to the right, while the shape of the density function hardly changed (Figure 5). The number of poor is measured by the area under the density function to the left of the poverty line. Rightward movement of the density function from 2004 to 2005 greatly reduces poverty since the function slopes steeply upward in the area of the poverty line and since the standard poverty line is constant in real terms.
8

The poverty line of 1813 UAH remains valid for tracking the Ukraine’s progress in overcoming poverty, but other lines are also valid. The poverty line of 1,813 UAH per year per person is less than 5 UAH per person per day in 2003, which seems quite low. But because of relatively high purchasing power for food this amounts to about US$4.50 per day at the purchasing power parity exchange rate for 2004 (of 1.1 UAH per US$). Ukraine might want to follow poverty rates computed from higher, but still constant poverty lines. This would assist in analysis of the distribution of poverty, since for any fixed sample size there would be a larger number of poor people. The use of a changing poverty line can be useful for analyzing policies, but not for monitoring changes in poverty over time. Leaving poverty rates, the analysis turns to other statistical measures of poverty.
Table 8. Characteristics of poverty: 2003-2005 (Poverty line=1813 UAH; all figures expressed as a percentages of the population
with standard errors in parentheses)
Characteristic 2003 2004 2005 Poverty gap 3.9 3.1 1.5 (0.07) (0.06) (0.05) Poverty severity (squared poverty gap) 1.3 1.0 0.5 (0.03) (0.03) (0.02) Source: World Bank estimates, based on the Ukraine Budget Survey.
The poor, on average, became less poor in 2005. The poverty gap measures the shortfall of expenditures of the poor from the poverty line. (It is computed by summing the distance between each person’s expenditures and the poverty line, considering all the non poor households to have a gap of zero, and then dividing by the population.) Thus, the poverty gap is an indicator of the total resources needed to bring all the poor to the level of the poverty line, assuming that the transfer of resources was perfectly targeted and sustainable. Happily, the poverty gap fell by about half from 2004 to 2005 (Table 8). Poverty severity is an indicator of the average depth of poverty (Table 8). It takes into account not only the distance separating the poor from the poverty line (the poverty gap), but also the inequality among the poor (by giving a greater weight to those furthest beneath the poverty line). Impressively, poverty severity fell by half over 2004-2005. The household expenditure data can also be used to compute indicators of inequality between households.
Table 9. Indicators of inequality: 2003-2005 (Poverty line = 1813 UAH; figures expressed in absolute terms)
Indicators 2003 2004 2005 Gini 0.274 0.275 0.276 Theil 0.127 0.128 0.126 Source: World Bank estimates, based on the Ukraine Household Budget Survey.
However, inequality in household expenditures was almost unchanged. The Gini Coefficient is derived from the Lorenz Curve. It equals 0 when expenditures are distributed equally across groups of households and 1 when the richest household has all the expenditure. So inequality diminishes when the Coefficient moves closer to 0. The Gini coefficient is nearly constant over
9

2003-2005 (Table 9). An alternative measure of inequality, the Theil index, also indicates nearly constant inequality from 2004 to 2005. The generalized entropy (GE) measures of inequality show a similar tendency (Annex 1 Tables 7 & 8). There is no strong evidence of a change in inequality over 2003-05.
Box 3: Explanation of Growth Incidence Curves Growth incidence curves illustrate the relationship between growth and poverty reduction. The flat line in each figure is the average rate of growth of nominal consumer expenditures over the period. The curved line in each figure is the growth incidence curve. The curved line shows the average rate of growth of consumption expenditures (on the vertical axis) of each group of the distribution of expenditure per capita (horizontal axis), running, from left to right, from the poorest to the richest. Each group of households with a particular consumption per capita benefits disproportionately from growth when the curve lies above the line, and benefits less than proportionally when the curve lies below the line. In other words, poor groups, who lie to the left on the figures, benefit more than other groups when the growth incidence curve lies above the horizontal line. Poor groups benefit less than others from growth when the growth incidence curve lies below the horizontal line.
Growth incidence analysis shows that growth of consumption expenditures favored the poorest and the richest groups. A further means of understanding trends in poverty is to analyze the distribution of the growth in consumption expenditures among richer and poorer groups. One way to do this is by charting growth incidence curves (Box 3). At the national level, growth of consumption over 2004-05 favored the poorest group –roughly the poorest 10 percent of the population. Growth also favored, approximately, the richest third (Figure 6). Pro-poor growth was concentrated in small towns and in rural areas. Growth of consumption expenditures in small towns over 2004-05 led to a disproportionate gain in expenditures among relatively poor and middle income groups (Figure 6d). In rural areas, the poorest 10 to 15 percent of the population benefited from growth, along with the top 40 percent (Figure 6c). The growth in consumption in cities benefited the poorest and wealthiest groups (Figure 6b).
Figure 6. Growth Incidence Curve 2004-2005 Ukraine
Figure 6b. Growth Incidence Curve 2004-2005 Big Cities
1516
1718
1920
Ann
ual P
erce
ntag
e C
hang
e
0 20 40 60 80 100Expenditure per capita percentile
Median spline Growth rate in mean
Growth Incidence Curve 2004-2005 Ukraine
1416
1820
22A
nnua
l Per
cent
age
Cha
nge
0 20 40 60 80 100Expenditure per capita percentile
Median spline Growth rate in mean
Growth Incidence Curve 2004-2005 Big Cities
10
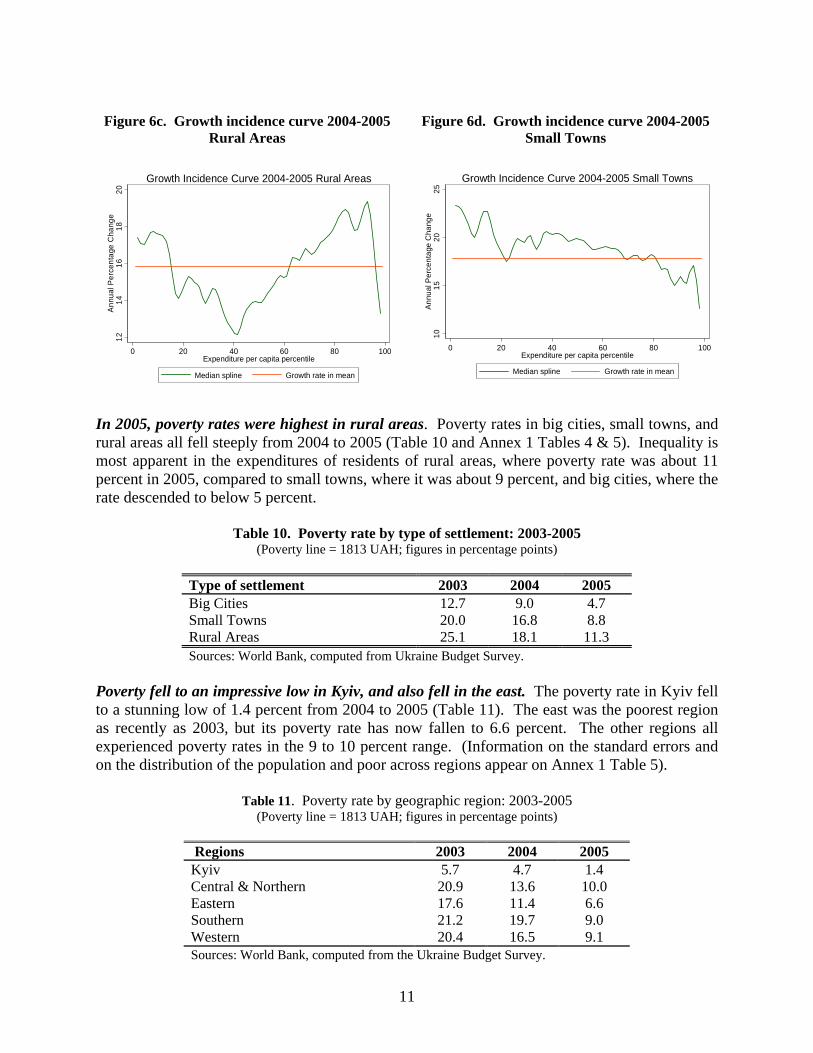
Figure 6c. Growth incidence curve 2004-2005
Rural Areas
Figure 6d. Growth incidence curve 2004-2005
Small Towns
1214
1618
20A
nnua
l Per
cent
age
Cha
nge
0 20 40 60 80 100Expenditure per capita percentile
Median spline Growth rate in mean
Growth Incidence Curve 2004-2005 Rural Areas
1015
2025
Annu
al P
erce
ntag
e C
hang
e
0 20 40 60 80 100Expenditure per capita percentile
Median spline Growth rate in mean
Growth Incidence Curve 2004-2005 Small Towns
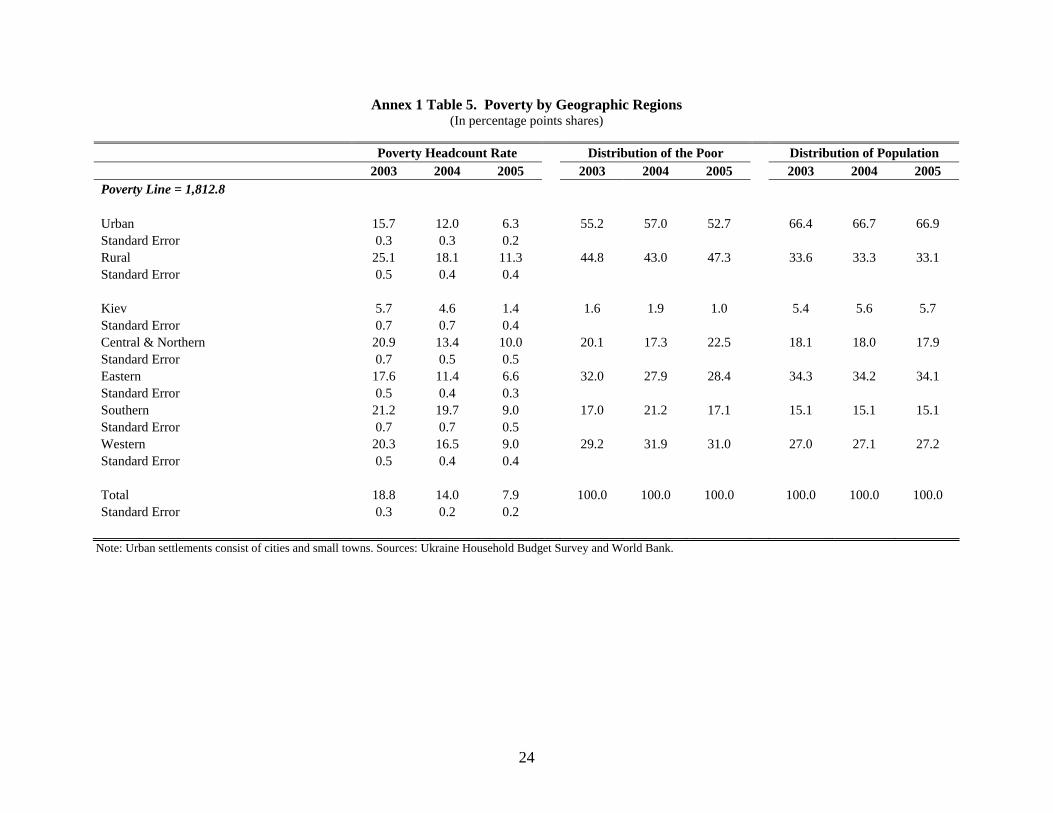
In 2005, poverty rates were highest in rural areas. Poverty rates in big cities, small towns, and rural areas all fell steeply from 2004 to 2005 (Table 10 and Annex 1 Tables 4 & 5). Inequality is most apparent in the expenditures of residents of rural areas, where poverty rate was about 11 percent in 2005, compared to small towns, where it was about 9 percent, and big cities, where the rate descended to below 5 percent.
Table 10. Poverty rate by type of settlement: 2003-2005 (Poverty line = 1813 UAH; figures in percentage points)
Type of settlement 2003 2004 2005 Big Cities 12.7 9.0 4.7 Small Towns 20.0 16.8 8.8 Rural Areas 25.1 18.1 11.3 Sources: World Bank, computed from Ukraine Budget Survey.
Poverty fell to an impressive low in Kyiv, and also fell in the east. The poverty rate in Kyiv fell to a stunning low of 1.4 percent from 2004 to 2005 (Table 11). The east was the poorest region as recently as 2003, but its poverty rate has now fallen to 6.6 percent. The other regions all experienced poverty rates in the 9 to 10 percent range. (Information on the standard errors and on the distribution of the population and poor across regions appear on Annex 1 Table 5).
Table 11. Poverty rate by geographic region: 2003-2005 (Poverty line = 1813 UAH; figures in percentage points)
Regions 2003 2004 2005 Kyiv 5.7 4.7 1.4 Central & Northern 20.9 13.6 10.0 Eastern 17.6 11.4 6.6 Southern 21.2 19.7 9.0 Western 20.4 16.5 9.1 Sources: World Bank, computed from the Ukraine Budget Survey.
11

The poverty rate rises with household size. Poverty rates are quite low for households with one or two members and extraordinarily high for large families (Figure 7 and Annex 1 Table 16). Over half of poor households have five or five members; over 20 percent of the poor have six or more members, and these are the poorest groups.
Figure 7. Poverty rate by household size
(Poverty line =1813 UAH; in percentage points)
1.5 2.84.8
10.3
16.6
26.424.6
0
5
10
15
20
25
30
1 2 3 4 5 6 7 or moreHousehold size (number of people)
In p
erce
ntag
e po
ints Sources: Ukraine HBS & World Bank
The poverty rate falls with age and is highest among infants and children. Infants aged from birth to five suffer from a poverty rate of about 15 percent while children aged 6 to 14 experience nearly 13 percent poverty rate (Figure 8). Families with several children aged 0-6 have some of the highest poverty rates in Ukraine; however only 0.8 percent of the poor have three or more children (Figure 9 and Annex 1 Table 16). The poverty rate among adolescents and young adults fluctuated around 8 to 9 percent, well above the population average. (Annex 1 Table 13 presents the standard errors of estimate of these poverty rates and the distribution of the poor and the population across these age groups).
Figure 8. Poverty rate by age group in 2005
(Poverty line =1813 UAH; in percentage points)
14.5
12.8
9.68.3
9.58.5 8.9
6.9 7.06.4
4.5 4.6 4.7
0
2
4
6
8
10
12
14
16
0-5 6-14 15-19 20-24 25-29 30-34 35-39 40-44 45-49 50-54 55-59 60-64 65+Age groups
Pove
rty ra
tes
Sources: Ukraine HBS & World Bank
12

Figure 9. Households’ poverty rates by number of children aged 0-6
(Poverty line = 1813 UAH; in percentage points)
6.0
14.6
22.7
36.7
0
5
10
15
20
25
30
35
40
no children 1 2 3 or morechildren
In p
erce
ntag
e po
ints Sources: Ukraine HBS & World Bank
Poverty rates among the elderly are relatively low, in part because of social transfers. Older Ukrainians experience poverty rates in the 4 to 5 percent range, lower than any other age group (Figure 9). This is in part because the pensions are effective in reducing poverty among the elderly. To demonstrate this, the team simulated what would happen to the distribution of consumption expenditures if all social transfers (all pensions, social assistance, etc.) had been introduced in 2005. The answer can be approximated by cross- tabulating the distribution of the population over quintiles of the consumption expenditure when the social transfers are included (that is when they fund some expenditures) and when they are not included (the transfers are subtracted from actual consumption expenditures). Table 12 presents the results. Giving the social transfers to households in the poorest, 1st, quintile leaves only 44 percent in the 1st quintile. About 23 percent move up into the 3rd quintile, and 13 percent move into the 4th quintile. This demonstrates the importance of the transfers in advancing poor households out of poverty. While old age is closely associated with relatively low poverty, another demographic variable, gender, is not.
Table 12. Distribution on population across quintiles of consumption expenditure with and without social transfers in 2005
(In percentage points)
Consumption expenditures with transfers
Poorest Richest
1st 2nd 3d 4th 5th TotalPoorest 1st 44.0 22.5 19.1 12.8 1.6 100.0
2nd 45.1 26.4 13.0 10.8 4.6 100.0 3d 10.9 49.0 19.8 11.3 9.0 100.0 4th 0.0 2.1 48.1 36.7 13.1 100.0
Con
sum
ptio
n ex
pend
iture
s ex
clud
ing
trans
fers
Richest 5th 0.0 0.0 0.0 28.4 71.6 100.0 Total 100.0 100.0 100.0 100.0 100.0
Sources: Ukraine HBS and World Bank
13

Table 13. Poverty rates by household head’s gender: 2004-2005 (Poverty line = 1813 UAH per year in percentage points)
Gender 2004 2005
Male 14.1 7.6 Female 13.9 8.4 Source: World Bank, computed from Ukraine Household Budget Survey.
Male and female headed households experience similar poverty rates. The rates were nearly identical in 2004 and the male rate was nearly a percentage point higher in 2005 (Table 13 and see Annex 1 Table 15 for further details). Poverty rates fall with the level of education. The poverty rate in 2005 was a striking 34 percent among illiterate people, although this is a small group; and was 14 percent for people with no elementary education (Figure 10 and Annex 1 Table 14). The poverty rate fell to 10 percent among people who completed secondary education (for a total of 12 years of education). Poverty rates were particularly low among people who completed higher education: 5 percent among people with the equivalent of a Bachelor’s degree and less than 3 percent for those with the equivalent of a Master’s degree.
Figure 10. Poverty rate by household head’s education: 2005
(Poverty line-1813 UAH; in percentage points)
Higher Ed -Master's equiv
Higher Ed -Bachelor's equiv
12 years -complete secondary
10 years of ed3 years of ed
Illiterate
No elementary
0
5
10
15
20
25
30
35
40
Level of education
In p
erce
ntag
e po
ints
Sources: Ukraine HBS & World Bank
Households headed by unemployed people and housewives are more likely to be poor. Together, households headed by unemployed people and housewives form more than 30 percent of the poor and have poverty rates of around 15 percent (Figure 11). This group may include many of the poor infants and children as dependents. People working for hire (for wages and salaries) form nearly 43 percent of the poor and retired people form nearly 30 percent of the poor; however, the poverty rate among both groups is less than the population average. (Annex 1 Table 12 gives further statistical detail on poverty by status of employment.)
14

Figure 11. Poverty rates by status of head of household
6.5
7.8
15.4
15.2
0.0 2.0 4.0 6.0 8.0 10.0 12.0 14.0 16.0 18.0
Working for hire
Retired person
Unemployed
Housewife
In percentage points
Sources: Ukraine HBS & World Bank
In summary, the groups who would merit special attention because of their poverty rates are large families, infants and children, and people without education and the unemployed. On average, as poverty declined, the remaining poor became less poor. All groups along the distribution of household expenditures benefited from the general rise in incomes, and inequality between the expenditure groups was virtually unchanged over 2004-2005. In 2005, poverty rates were highest in rural areas, and in the south and west. The rate was impressively low in Kyiv, and was relatively low in the east. The poverty rate was quite high among children and infants and lowest than among the elderly. As might be expected, poverty rates fell with years of education. Turning away from the situation in 2005, the outstanding questions about poverty over 2006-2007 concern the impact of the increase in energy prices and in particular of the rise in the price of Russian natural gas.
Section 3. Impact of the increase in energy prices on poverty rates Most of the increase in the price of Russian natural gas has not been passed through to households. The tariff (price) paid by Ukrainian households for natural gas was unchanged in 2005 (Figure 12). After the Russian-Ukrainian dispute over natural gas prices, prices paid by industry and by heating companies increased, but household tariffs rose by less and most of the increase was in the summer and fall of 2006. Retail electricity tariffs paid by households also rose much less than the unregulated price paid by non-household retail consumers (Figure 13). This section estimates the impact on poverty rates of increases in the energy prices they pay. The simulation asks what the poverty rate would have been in 2005 if households had faced higher prices for all categories of energy. Annex 2 presents a full description of the methodology applied. The simulation examines increases in the categories of energy expenditures that appear in the household budget survey (Table 14 and Annex 2 Table 1). The largest energy expenditure in Ukraine is on direct supplies of natural gas to households, followed by expenditures on district heating and on electricity.
15

Figure 12. Natural gas prices by type of user
Sources: Naftogaz, Min. of Mines & Energy, NERC & World Bank
(In UAH per 1000 cubic meters )
0
100
200
300
400
500
600
700
800
1999-2
002Jan
-04
Mar-04
May-04
Jul-04
Sep-04
Nov-04
Jan-05
Mar-05
May-05
Jul-05
Sep-05
Nov-05
Jan-06
Apr-06
Jul-06
Jul-07
Figure 13. Retail prices of electricity by type of user
Table 14. Shares of expenditures on energy in total household expenditures by category in 2005
Category of expenditure % points Electricity 1.54 District Heating & hot water 1.69 Natural gas (incl. bottled gas) 2.18 Gasoline & diesel 0.48 Solid fuel (coal, peat & wood) 1.04 Total 6.92 Sources: Household budget survey & World Bank
(Kopeks per KWH without VAT)
0
5
10
15
20
25
30
35
2001 2002 2003 2004 2005 2006 07-Jan 07-Feb
Avg household tariff (regulated)
Avg non-household tariff (unregulated)
Sources: NERC & World Bank
Households, for heating
Households , not for heating
Heat & power co.s, VAT payers
Heat & power co.s, non VAT
Industrial
16
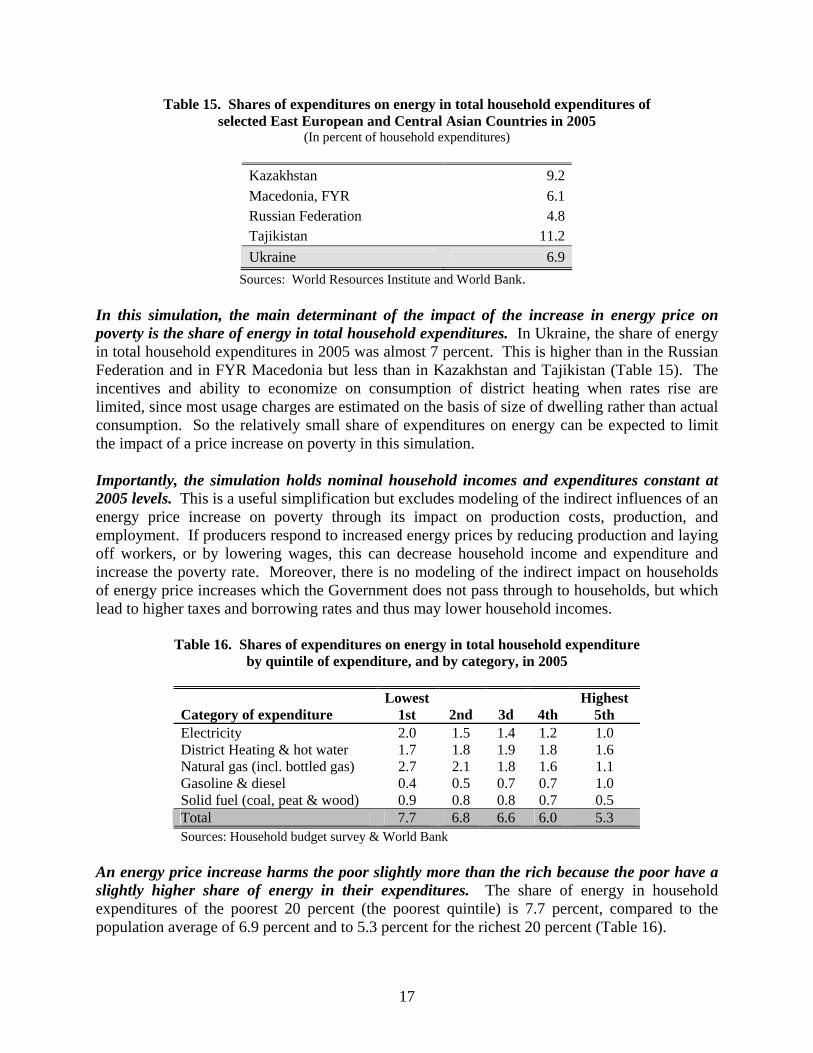
Table 15. Shares of expenditures on energy in total household expenditures of selected East European and Central Asian Countries in 2005
(In percent of household expenditures)
Kazakhstan 9.2Macedonia, FYR 6.1Russian Federation 4.8Tajikistan 11.2Ukraine 6.9
Sources: World Resources Institute and World Bank. In this simulation, the main determinant of the impact of the increase in energy price on poverty is the share of energy in total household expenditures. In Ukraine, the share of energy in total household expenditures in 2005 was almost 7 percent. This is higher than in the Russian Federation and in FYR Macedonia but less than in Kazakhstan and Tajikistan (Table 15). The incentives and ability to economize on consumption of district heating when rates rise are limited, since most usage charges are estimated on the basis of size of dwelling rather than actual consumption. So the relatively small share of expenditures on energy can be expected to limit the impact of a price increase on poverty in this simulation. Importantly, the simulation holds nominal household incomes and expenditures constant at 2005 levels. This is a useful simplification but excludes modeling of the indirect influences of an energy price increase on poverty through its impact on production costs, production, and employment. If producers respond to increased energy prices by reducing production and laying off workers, or by lowering wages, this can decrease household income and expenditure and increase the poverty rate. Moreover, there is no modeling of the indirect impact on households of energy price increases which the Government does not pass through to households, but which lead to higher taxes and borrowing rates and thus may lower household incomes.
Table 16. Shares of expenditures on energy in total household expenditure by quintile of expenditure, and by category, in 2005
Category of expenditure Lowest
1st 2nd 3d 4th Highest
5th Electricity 2.0 1.5 1.4 1.2 1.0 District Heating & hot water 1.7 1.8 1.9 1.8 1.6 Natural gas (incl. bottled gas) 2.7 2.1 1.8 1.6 1.1 Gasoline & diesel 0.4 0.5 0.7 0.7 1.0 Solid fuel (coal, peat & wood) 0.9 0.8 0.8 0.7 0.5 Total 7.7 6.8 6.6 6.0 5.3 Sources: Household budget survey & World Bank
An energy price increase harms the poor slightly more than the rich because the poor have a slightly higher share of energy in their expenditures. The share of energy in household expenditures of the poorest 20 percent (the poorest quintile) is 7.7 percent, compared to the population average of 6.9 percent and to 5.3 percent for the richest 20 percent (Table 16).
17
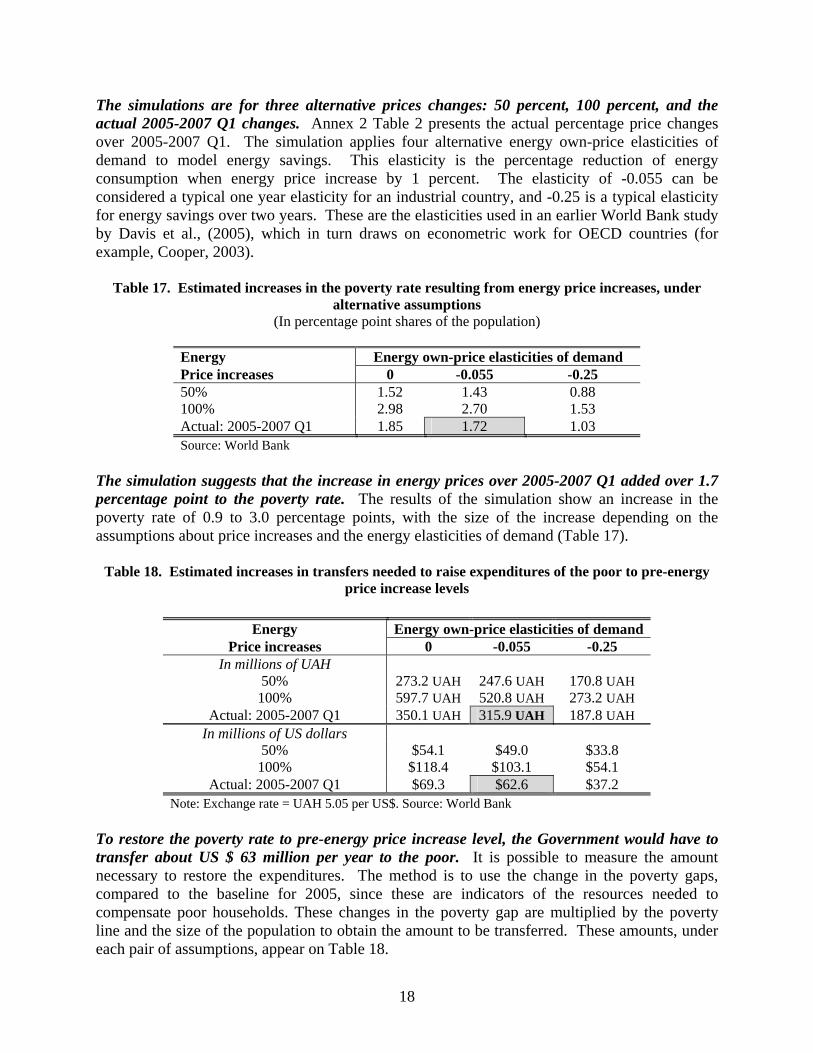
The simulations are for three alternative prices changes: 50 percent, 100 percent, and the actual 2005-2007 Q1 changes. Annex 2 Table 2 presents the actual percentage price changes over 2005-2007 Q1. The simulation applies four alternative energy own-price elasticities of demand to model energy savings. This elasticity is the percentage reduction of energy consumption when energy price increase by 1 percent. The elasticity of -0.055 can be considered a typical one year elasticity for an industrial country, and -0.25 is a typical elasticity for energy savings over two years. These are the elasticities used in an earlier World Bank study by Davis et al., (2005), which in turn draws on econometric work for OECD countries (for example, Cooper, 2003).
Table 17. Estimated increases in the poverty rate resulting from energy price increases, under alternative assumptions
(In percentage point shares of the population)
Energy Energy own-price elasticities of demand Price increases 0 -0.055 -0.25 50% 1.52 1.43 0.88 100% 2.98 2.70 1.53 Actual: 2005-2007 Q1 1.85 1.72 1.03 Source: World Bank
The simulation suggests that the increase in energy prices over 2005-2007 Q1 added over 1.7 percentage point to the poverty rate. The results of the simulation show an increase in the poverty rate of 0.9 to 3.0 percentage points, with the size of the increase depending on the assumptions about price increases and the energy elasticities of demand (Table 17).
Table 18. Estimated increases in transfers needed to raise expenditures of the poor to pre-energy price increase levels
Energy Energy own-price elasticities of demand
Price increases 0 -0.055 -0.25 In millions of UAH
50% 273.2 UAH 247.6 UAH 170.8 UAH 100% 597.7 UAH 520.8 UAH 273.2 UAH
Actual: 2005-2007 Q1 350.1 UAH 315.9 UAH 187.8 UAH In millions of US dollars
50% $54.1 $49.0 $33.8 100% $118.4 $103.1 $54.1
Actual: 2005-2007 Q1 $69.3 $62.6 $37.2 Note: Exchange rate = UAH 5.05 per US$. Source: World Bank
To restore the poverty rate to pre-energy price increase level, the Government would have to transfer about US $ 63 million per year to the poor. It is possible to measure the amount necessary to restore the expenditures. The method is to use the change in the poverty gaps, compared to the baseline for 2005, since these are indicators of the resources needed to compensate poor households. These changes in the poverty gap are multiplied by the poverty line and the size of the population to obtain the amount to be transferred. These amounts, under each pair of assumptions, appear on Table 18.
18
The most reasonable elasticity estimate is -0.055, which gives a transfer of about US$63 million a year. However, the US$63 million amount will suffice only if targeting to the poor is perfect, and this is not the case with any transfers today. Almost half the housing subsidy and more than a third of the liquefied natural gas subsidy go to the top 60 percent of the distribution of expenditures. Any realistic transfer that actually reduces poverty will probably need to be larger. The total transfer needed to compensate the poorest Ukrainians is small relative to current total transfers. Even transfers of three times US$63 million would be less than 2 percent of the US$ 10.2 billion spent on social transfers in 2005. The reason for this is that the main direct burden of the energy price increases falls mainly on urban areas, which are generally richer than rural areas and small towns, and the burden falls mainly on groups in the middle and upper parts of the distribution of expenditures.
Section 4. Conclusions Ukraine is doing well. The poverty rate declined rapidly from around 32 percent in 2001 to below 8 percent in 2005, using an absolute (constant) poverty line that reflects the cost of meeting minimum human needs. Furthermore, the decline was widespread across regions and industries. Poverty declined over time when higher or lower absolute poverty lines are applied in the computation. Moreover, inspection of the household budget expenditure survey data did not reveal any errors that could explain the decline. The further good news is that the poverty rate probably fell again in 2006, judging by the real wage and real consumption data. The poverty rate declined over 2001-2005 using the recent average subsistence minimum as the absolute poverty line, but it declined to a much higher level of about 68 percent in 2005. This decline in the poverty rate is part of a recovery from the roughly 50 percent decline of GDP per capita during the 1990s; however, Ukrainian consumption is still not recovered much beyond its level of 1990. Moreover, real wages in Ukraine, while rising quickly, are still below those in several neighboring countries. Therefore it is not surprising that some Ukrainians would feel poor. Ukrainian government devotes considerable resources to preventing poverty among the elderly through its pension program. Infants and children have the greatest claim on public intervention, based on their poverty rates. Poverty rates are exceptionally high among infants and children and families with many children while poverty rates of elderly people are below the national average. So some shift in the focus of public intervention seems justified. Poverty rates also run above average among households headed by unemployed people and by housewives. This could be addressed directly, when appropriate, by interventions to integrate the unemployed and housewives into the labor market, and in other cases, to aid their households indirectly through programs for vulnerable infants and children. The annual transfers needed to fully compensate the poor for the increase in energy prices are relatively small. The poorest Ukrainians could be compensated for the increase in energy prices over 2005-Q1 2007 by transferring only about US$63 million per year, assuming that the funds were perfectly targeted to the poor. The current energy-related transfer programs, such as the housing subsidies, are poorly targeted. But even a transfer several times US$63 million would
19

still be a tiny fraction of the more than US$11 billion that the Ukrainian government spends on social transfers each year. The amount needed to compensate poor Ukrainians is small in part because most of the increase in the international price of natural gas has not been passed on to Ukrainian households. Another reason is that the poverty line is low relative to the average consumption expenditures of the population, and most of the increase in energy expenditures is paid by the middle and upper consumption expenditure groups.
20

Annex 1. Statistical Tables
Annex 1 Table 1. Real wages by economic activity (UAH per month)
2003 2004 2005 2006 Ukraine average 439.4 540.9 710.3 954.6 Agriculture and related services 199.7 270.8 365.6 506.7 Forestry and related services 333.1 457.0 588.2 779.6 Fishery 276.2 343.7 439.6 556.1 Industry 561.9 682.0 851.6 1,111.0 Construction 519.3 650.2 787.7 1,044.5 Wholesale and retail trade 374.2 466.7 628.4 823.2 Hotels and restaurants 322.8 393.9 499.1 673.8 Transport and communication 651.1 773.5 931.7 1,217.4 Financial activity 999.2 1,154.1 1,368.6 1,878.7 Real estate and engineering operations 500.8 611.7 792.9 1,093.7 Public administration 548.4 633.9 957.4 1,446.8 Education 323.6 394.0 564.4 739.1 Health care and social assistance 265.2 322.2 455.6 603.0 Municipal and individual services, cultural and sport activities
284.0 366.6 545.9 759.0
Sources: State Statistical Committee and World Bank.
21

22
Annex 1 Table 2. Major Pension-Wage Ratios
(as of January 1 of each year)
2000 2001 2002 2003 2004 2005 2006 Subsistence minimum (UAH/month) 216.6 248.8 268 268 284.7 332 350 Min wage (UAH/month) 91 118 140 185 237 300.3 350 Minimum pension benefit (UAH/month) … 58 86.9 91.8 102.8 332 350 Min old-age pension as a % of the minimum wage
… 49% 62% 50% 36% 105% 100%
Average wage, UAH 181 253.4 320.9 400.6 499.7 640.9 864.9 Average pension (UAH/month) 68.9 84 125.8 139.5 189.9 317.4 409.1 Average pension as a % of the average wage
38% 33% 39% 35% 38% 50% 47%
Source: Ministry of Labor and Social Policy and World Bank, Draft Public Finance Review 1 (2007).
Annex 1 Table 3. Pensions (Payment per person per month)
2003 2004 2005 2006 In current year UAH (end of year) Minimum pension 91.8 284.7 332.0 366.0 Average pension 189.9 317.4 409.1 457.5 In constant UAH (2003=100, end of year) Minimum pension 91.8 254.2 267.7 265.2 Average pension 189.9 256.0 329.9 331.5 Percentage point annual change (end-year/end-year) Minimum pension -- 176.9% 5.3% -0.9% Average pension -- 34.8% 28.9% 0.5% Source: Ministry of Labor and Social Policy, Pension Fund of Ukraine, annual State Budget Laws, & World Bank.
.
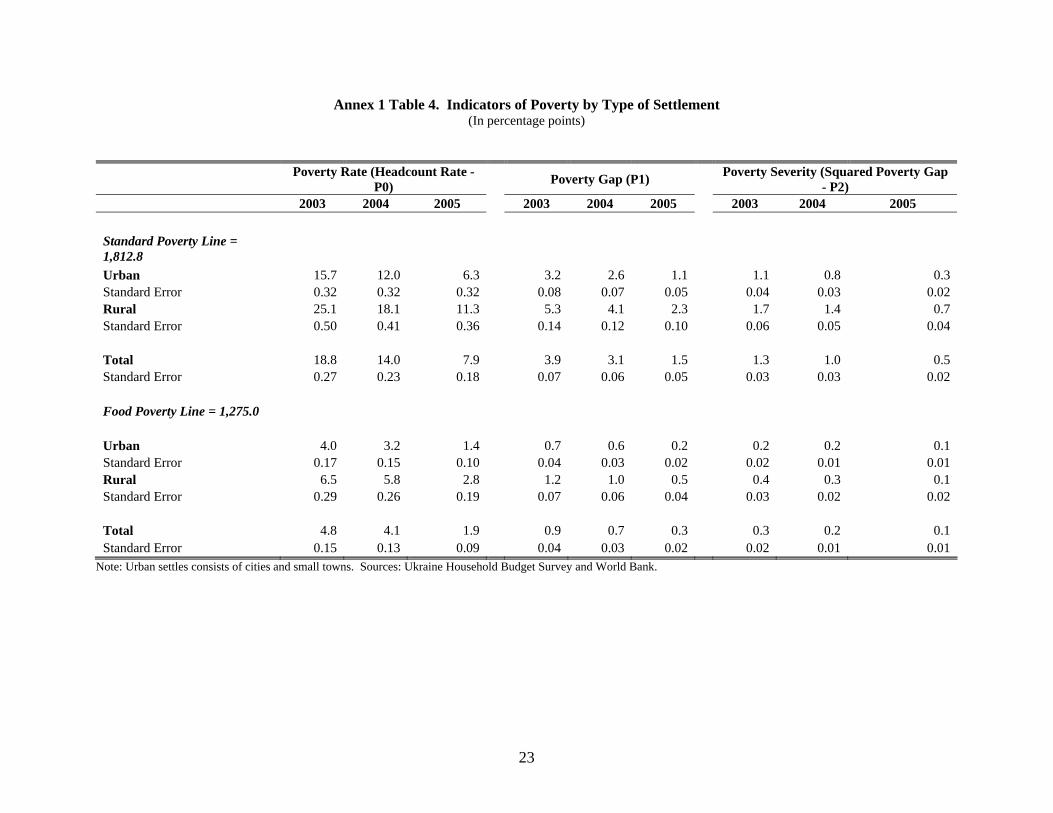
Annex 1 Table 4. Indicators of Poverty by Type of Settlement (In percentage points)
Poverty Rate (Headcount Rate - P0) Poverty Gap (P1)
Poverty Severity (Squared Poverty Gap - P2)
2003 2004 2005 2003 2004 2005 2003 2004 2005 Standard Poverty Line = 1,812.8
Urban 15.7 12.0 6.3 3.2 2.6 1.1 1.1 0.8 0.3 Standard Error 0.32 0.32 0.32 0.08 0.07 0.05 0.04 0.03 0.02 Rural 25.1 18.1 11.3 5.3 4.1 2.3 1.7 1.4 0.7 Standard Error 0.50 0.41 0.36 0.14 0.12 0.10 0.06 0.05 0.04 Total 18.8 14.0 7.9 3.9 3.1 1.5 1.3 1.0 0.5 Standard Error 0.27 0.23 0.18 0.07 0.06 0.05 0.03 0.03 0.02 Food Poverty Line = 1,275.0 Urban 4.0 3.2 1.4 0.7 0.6 0.2 0.2 0.2 0.1 Standard Error 0.17 0.15 0.10 0.04 0.03 0.02 0.02 0.01 0.01 Rural 6.5 5.8 2.8 1.2 1.0 0.5 0.4 0.3 0.1 Standard Error 0.29 0.26 0.19 0.07 0.06 0.04 0.03 0.02 0.02 Total 4.8 4.1 1.9 0.9 0.7 0.3 0.3 0.2 0.1 Standard Error 0.15 0.13 0.09 0.04 0.03 0.02 0.02 0.01 0.01
Note: Urban settles consists of cities and small towns. Sources: Ukraine Household Budget Survey and World Bank.
23
24
Annex 1 Table 5. Poverty by Geographic Regions (In percentage points shares)
Poverty Headcount Rate Distribution of the Poor Distribution of Population 2003 2004 2005 2003 2004 2005 2003 2004 2005 Poverty Line = 1,812.8 Urban 15.7 12.0 6.3 55.2 57.0 52.7 66.4 66.7 66.9 Standard Error 0.3 0.3 0.2 Rural 25.1 18.1 11.3 44.8 43.0 47.3 33.6 33.3 33.1 Standard Error 0.5 0.4 0.4 Kiev 5.7 4.6 1.4 1.6 1.9 1.0 5.4 5.6 5.7 Standard Error 0.7 0.7 0.4 Central & Northern 20.9 13.4 10.0 20.1 17.3 22.5 18.1 18.0 17.9 Standard Error 0.7 0.5 0.5 Eastern 17.6 11.4 6.6 32.0 27.9 28.4 34.3 34.2 34.1 Standard Error 0.5 0.4 0.3 Southern 21.2 19.7 9.0 17.0 21.2 17.1 15.1 15.1 15.1 Standard Error 0.7 0.7 0.5 Western 20.3 16.5 9.0 29.2 31.9 31.0 27.0 27.1 27.2 Standard Error 0.5 0.4 0.4 Total 18.8 14.0 7.9 100.0 100.0 100.0 100.0 100.0 100.0 Standard Error 0.3 0.2 0.2
Note: Urban settlements consist of cities and small towns. Sources: Ukraine Household Budget Survey and World Bank.
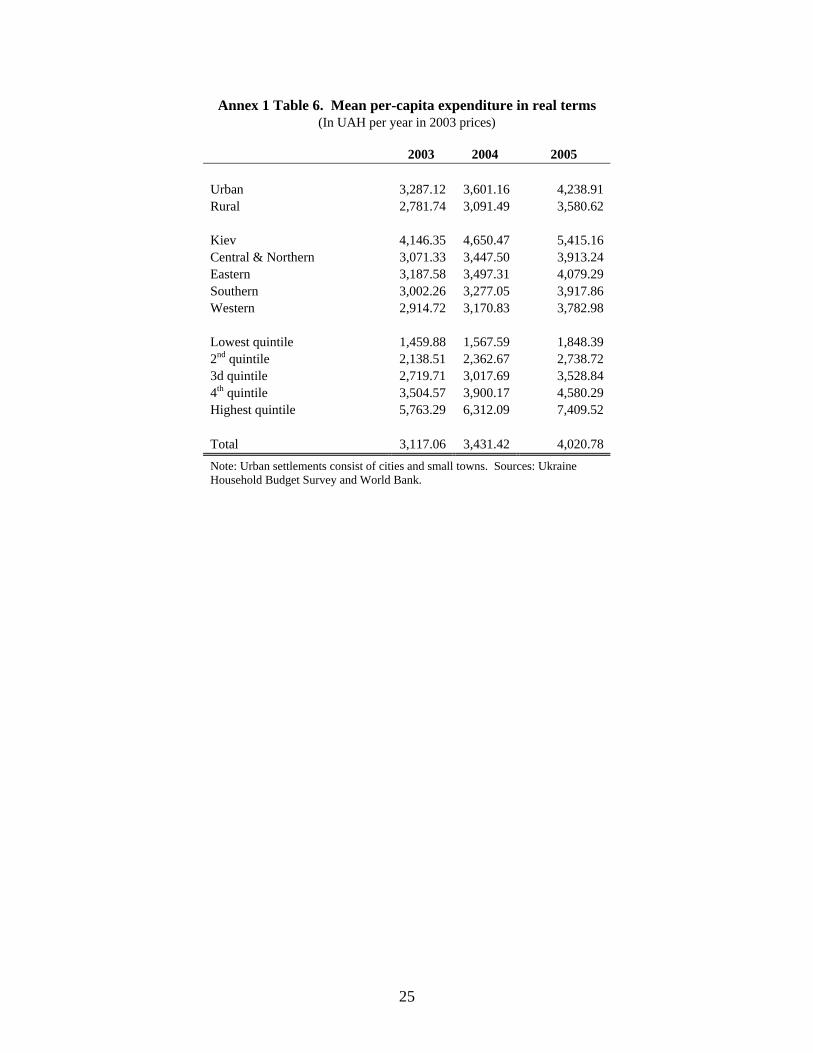
Annex 1 Table 6. Mean per-capita expenditure in real terms (In UAH per year in 2003 prices)
2003 2004 2005 Urban 3,287.12 3,601.16 4,238.91 Rural 2,781.74 3,091.49 3,580.62 Kiev 4,146.35 4,650.47 5,415.16 Central & Northern 3,071.33 3,447.50 3,913.24 Eastern 3,187.58 3,497.31 4,079.29 Southern 3,002.26 3,277.05 3,917.86 Western 2,914.72 3,170.83 3,782.98 Lowest quintile 1,459.88 1,567.59 1,848.39 2nd quintile 2,138.51 2,362.67 2,738.72 3d quintile 2,719.71 3,017.69 3,528.84 4th quintile 3,504.57 3,900.17 4,580.29 Highest quintile 5,763.29 6,312.09 7,409.52 Total 3,117.06 3,431.42 4,020.78 Note: Urban settlements consist of cities and small towns. Sources: Ukraine Household Budget Survey and World Bank.
25

Annex 1 Table 7. Decomposition of inequality by regions (Three generalized entropy measures of inequality in expenditures)
GE(0) GE(1) GE(2) Overall inequality 2003 12.3 12.7 15.1 Kiev 11.3 11.4 12.9 Central & Northern 12.7 12.8 14.8 Eastern 12.3 12.8 15.7 Southern 12.4 12.7 15.0 Western 10.8 11.3 13.4 2004 12.5 12.8 15.5 Kiev 13.5 14.7 20.1 Central & Northern 11.6 11.5 13.0 Eastern 11.3 11.5 13.5 Southern 14.2 14.8 18.2 Western 11.9 12.2 14.4 2005 12.4 12.6 14.7 Kiev 12.7 12.9 14.7 Central & Northern 12.9 13.2 15.3 Eastern 11.6 11.8 13.4 Southern 12.5 12.7 14.9 Western 11.7 11.9 14.0 Within group inequality 2003 11.9 12.3 14.7 2004 12.1 12.4 15.1 2005 12.1 12.3 14.3 Between group inequality 2003 0.3 0.3 0.4 2004 0.4 0.4 0.5 2005 0.3 0.4 0.4 Between group inequality as % of overall inequality 2003 2.7 2.7 2.5 2004 3.1 3.3 2.9 2005 2.8 2.9 2.7 Sources: Ukraine Household Budget Survey and World Bank.
26

Annex 1 Table 8. Decomposition of inequality by urban and rural areas
(Three generalized entropy measures of inequality of expenditures)
GE(0) GE(1) GE(2) Overall inequality 2003 12.3 12.7 15.1 Urban 12.5 12.9 15.5 Rural 10.9 11.1 12.7 2004 12.5 12.8 15.5 Urban 12.6 13.0 15.8 Rural 11.5 11.6 13.4 2005 12.4 12.6 14.7 Urban 12.3 12.6 14.7 Rural 11.6 11.7 13.3 Within group inequality 2003 12.0 12.4 14.8 2004 12.2 12.6 15.3 2005 12.1 12.3 14.4 Between group inequality 2003 0.3 0.3 0.3 2004 0.3 0.2 0.2 2005 0.3 0.3 0.3 Between group inequality as % of overall inequality 2003 2.5 2.4 1.9 2004 2.0 1.9 1.6 2005 2.5 2.4 2.0
Annex 1 Table 9. Inequality in per-capita expenditure distribution by urban and rural areas
bottom Half of the Distribution
Upper Half of the Distribution
Interquartile Range
Tails
p25/p10 p50/p25 p75/p50 p90/p50 p75/p25 p90/p10 Gini Total 2003 1.32 1.36 1.37 1.90 1.87 3.42 27.40 2004 1.36 1.37 1.38 1.89 1.89 3.52 27.51 2005 1.33 1.38 1.39 1.91 1.92 3.50 27.56 Urban 2003 1.31 1.35 1.39 1.94 1.87 3.44 27.63 2004 1.34 1.37 1.39 1.89 1.90 3.48 27.64 2005 1.32 1.38 1.39 1.92 1.92 3.50 27.50 Rural 2003 1.27 1.36 1.40 1.83 1.91 3.17 25.93 2004 1.37 1.37 1.34 1.81 1.83 3.39 26.39 2005 1.33 1.36 1.39 1.89 1.88 3.40 26.68 Sources: Ukraine Household Budget Survey and World Bank.
27

28
Annex 1 Table 10. Growth and redistribution decomposition of poverty changes (In percentage points)
Change in incidence of poverty
2003 2005
actual change Growth Redistribution Interaction
Poverty Line = 1,812.8 Total 18.83 7.93 -10.90 -11.48 0.92 -0.34 Urban 15.65 6.25 -9.40 -9.54 1.24 -1.10 Rural 25.10 11.31 -13.79 -15.27 0.26 1.22 Poverty Line = 1,275.0 Total 4.83 1.87 -2.96 -3.14 0.45 -0.27 Urban 4.00 1.41 -2.58 -2.79 -0.07 0.28 Rural 6.48 2.79 -3.70 -3.84 1.50 -1.36 Sources: Ukraine Household Budget Survey and World Bank.
Annex 1 Table 11. Regional Poverty Decomposition (In percentage points)
Absolute change Percentage change
Poverty Line = 1,812.8 Change in poverty (HC) -10.90 100.00 Total Intra-sectoral effect -10.89 99.86 Population-shift effect -0.03 0.29 Interaction effect 0.02 -0.15 Intra-regional effects: Kiev -0.23 2.11 Central & Northern -1.98 18.16 Eastern -3.77 34.57 Southern -1.85 16.99 Western -3.06 28.03 Sources: Ukraine Household Budget Survey and World Bank.

Annex 1 Table 12. Poverty rates by Labor Market Status of Head of Household
Poverty Headcount Rate Distribution of the Poor Distribution of Population 2003 2004 2005 2003 2004 2005 2003 2004 2005 Poverty Line = 1,812.8 working for hire 14.3 10.2 5.6 29.9 28.6 30.2 37.7 36.9 40.2 Standard Error 0.4 0.4 0.3 0.8 0.9 1.2 0.4 0.3 0.4 employer 3.0 3.5 1.9 0.1 0.2 0.2 0.4 0.6 0.6 Standard Error 1.5 1.5 1.5 0.0 0.1 0.1 0.1 0.1 0.1 household member working at family enterprise 32.0 4.3 0.0
0.2 0.0
0.1 0.1 0.0
Standard Error 9.1 3.0 0.0 0.1 0.0 0.0 0.0 0.0 self-employed 16.4 10.1 4.7 1.1 1.1 0.9 1.2 1.4 1.5 Standard Error 2.3 1.6 1.1 0.2 0.2 0.2 0.1 0.1 0.1 retired person 13.4 8.9 5.0 19.0 17.5 16.4 25.5 25.8 24.6 Standard Error 0.5 0.4 0.3 0.6 0.7 0.9 0.3 0.3 0.3 student 11.4 8.8 4.6 2.1 2.6 2.5 3.3 3.8 4.0 Standard Error 1.3 0.9 0.7 0.3 0.3 0.4 0.1 0.1 0.1 pupil 26.7 19.9 11.3 23.3 22.5 20.4 15.8 14.8 13.6 Standard Error 0.8 0.7 0.6 0.7 0.8 1.0 0.3 0.2 0.2 unemployed 28.7 22.5 15.0 15.1 17.1 18.1 9.5 10.0 9.1 Standard Error 1.1 0.9 0.8 0.6 0.7 1.0 0.2 0.2 0.2 housewife 27.2 21.8 14.0 6.1 6.6 8.4 4.0 4.0 4.5 Standard Error 1.6 1.5 1.2 0.4 0.5 0.7 0.1 0.1 0.2 child 32.2 29.8 22.4 0.7 0.8 1.0 0.4 0.3 0.3 Standard Error 5.9 5.6 5.5 0.2 0.2 0.3 0.1 0.0 0.0 other 45.2 16.1 46.9 0.2 0.1 0.1 0.1 0.0 0.0 Standard Error 12.3 7.9 23.7 0.1 0.0 0.1 0.0 0.0 0.0 does not know 20.7 17.8 9.0 2.2 3.0 1.8 1.9 2.2 1.5 Standard Error 2.2 1.7 1.6 0.3 0.3 0.3 0.1 0.1 0.1 Total 18.8 14.0 7.9 100.0 100.0 100.0 100.0 100.0 100.0 Standard Error 0.3 0.2 0.2 0.0 0.0 0.0 0.0 0.0 0.0
29

Annex 1 Table 13. Poverty rates by Age Group
(In percentage points)
Poverty Headcount Rate Distribution of the Poor Distribution of Population 2003 2004 2005 2003 2004 2005 2003 2004 2005 Poverty Line = 1,812.8 0-5 30.4 28.6 14.5 6.6 8.5 8.6 4.1 4.2 4.7 Standard Error 1.6 1.5 1.1 6-14 28.7 22.3 12.8 17.3 16.8 15.8 11.3 10.6 9.8 Standard Error 1.0 0.8 0.7 15-19 22.0 16.6 9.6 9.1 9.3 8.5 7.8 7.9 7.0 Standard Error 1.0 0.9 0.7 20-24 19.4 15.7 8.3 6.6 7.4 7.9 6.4 6.6 7.5 Standard Error 1.1 1.0 0.7 25-29 19.4 16.4 9.5 6.4 7.4 9.0 6.2 6.3 7.5 Standard Error 1.1 1.0 0.8 30-34 25.0 16.2 8.5 8.5 7.5 8.1 6.4 6.5 7.6 Standard Error 1.2 1.0 0.7 35-39 23.6 15.7 8.9 8.6 7.0 7.0 6.9 6.2 6.3 Standard Error 1.2 1.0 0.7 40-44 17.4 12.0 6.9 7.5 6.6 6.1 8.1 7.7 7.0 Standard Error 0.9 0.8 0.6 45-49 13.7 11.1 7.0 5.8 6.2 7.3 8.0 7.8 8.2 Standard Error 0.8 0.8 0.6 50-54 13.2 9.6 6.4 5.1 5.4 5.9 7.2 7.9 7.2 Standard Error 0.9 0.7 0.6 55-59 12.2 8.7 4.5 3.2 3.3 3.7 4.9 5.4 6.4 Standard Error 1.1 0.8 0.5 60-64 12.0 7.9 4.6 3.8 2.9 2.5 5.9 5.1 4.3 Standard Error 0.9 0.8 0.6 65+ 13.1 9.2 4.7 11.6 11.7 9.8 16.8 17.9 16.6 Standard Error 0.5 0.4 0.3 Total 18.8 14.0 7.9 100.0 100.0 100.0 100.0 100.0 100.0 Standard Error 0.3 0.2 0.2
30

Annex 1 Table 14. Poverty by Education Level (In percentage points)
Poverty Headcount Rate Distribution of the Poor Distribution of Population 2003 2004 2005 2003 2004 2005 2003 2004 2005 Poverty Line = 1,812.8 Higher Ed - Master's equiv 7.3 5.8 2.2 5.2 6.2 4.5 12.8 13.9 15.1 Standard Error 0.5 0.4 0.3 Higher Ed - Bachelor's equiv 9.3 8.3 5.7 0.7 0.8 0.8 1.4 1.2 1.1
Standard Error 2.0 1.9 1.7 Higher Ed - Some 12.4 8.1 4.3 11.3 10.5 10.2 16.3 16.9 17.8 Standard Error 0.6 0.5 0.3 12 years - complete secondary 20.0 14.4 9.1 38.2 38.0 44.7 34.4 34.5 36.9
Standard Error 0.5 0.4 0.3 10 years 21.0 15.6 9.7 16.3 16.0 15.8 14.0 13.5 12.2 Standard Error 0.8 0.7 0.6 3 years of 23.6 18.1 9.8 17.0 16.6 13.0 13.0 12.0 10.0 Standard Error 0.8 0.7 0.6 No elementary 26.3 20.2 12.3 8.2 8.3 8.5 5.6 5.4 5.2 Standard Error 1.3 1.2 1.0 Illiterate 30.5 20.9 16.1 0.9 0.7 0.6 0.5 0.4 0.3 Standard Error 4.4 4.2 4.9 Does not know, refuse to answer 20.7 17.8 9.0 2.2 3.0 1.8 1.9 2.2 1.5
Standard Error 2.2 1.7 1.6 Total 18.8 14.0 7.9 100.0 100.0 100.0 100.0 100.0 100.0 Standard Error 0.3 0.2 0.2 Sources: Ukraine Household Budget Survey and World Bank.
31

Annex 1 Table 15. Poverty by Household Head's Gender
(In percentage points)
Poverty Headcount Rate Distribution of the Poor Distribution of Population 2003 2004 2005 2003 2004 2005 2003 2004 2005 Poverty Line = 1,812.8 Gender of the household head
Male 19.4 14.1 7.6 53.7 57.8 54.0 52.2 57.5 56.5 Standard Error 0.4 0.3 0.2 Female 18.2 13.9 8.4 46.3 42.2 46.0 47.8 42.5 43.5 Standard Error 0.4 0.3 0.3 Total 18.8 14.0 7.9 100.0 100.0 100.0 100.0 100.0 100.0 Standard Error 0.3 0.2 0.2 Sources: Ukraine Household Budget Survey and World Bank.
32

33
Annex 1 Table 16. Poverty by Demographic Composition
(In percentage points)
Poverty Headcount Rate Distribution of the Poor Distribution of Population 2003 2004 2005 2003 2004 2005 2003 2004 2005 Poverty Line = 1,812.8 Number of children 0-6 years old
no children 15.9 10.5 6.0 68.8 60.6 60.0 81.4 80.9 79.8 Standard Error 0.3 0.2 0.2 1 29.2 25.6 14.6 24.8 29.2 32.8 16.0 16.0 17.9 Standard Error 0.8 0.8 0.6 2 46.1 42.4 22.7 5.4 8.3 6.4 2.2 2.8 2.2 Standard Error 2.4 2.0 1.8 3 or more children 44.1 88.9 36.7 1.1 1.9 0.8 0.5 0.3 0.2 Standard Error 5.5 3.4 6.2 Household size 1 4.5 2.2 1.5 2.0 1.3 1.7 8.5 8.6 8.6 Standard Error 0.4 0.3 0.3 2 8.2 4.9 2.8 9.8 8.1 7.9 22.6 23.0 22.4 Standard Error 0.4 0.3 0.2 3 14.5 9.6 4.8 20.6 18.2 16.9 26.9 26.7 27.9 Standard Error 0.5 0.4 0.3 4 23.8 17.0 10.3 31.6 29.4 32.2 25.0 24.2 24.9 Standard Error 0.6 0.5 0.4 5 37.4 27.5 16.6 19.9 19.7 20.2 10.0 10.0 9.7 Standard Error 1.1 0.9 0.8 6 39.3 35.1 26.4 10.0 12.4 14.5 4.8 4.9 4.4 Standard Error 1.6 1.4 1.5 7 or more 51.1 61.5 24.6 6.0 10.8 6.7 2.2 2.5 2.1 Standard Error 2.4 2.2 2.0 Total 18.8 14.0 7.9 100.0 100.0 100.0 100.0 100.0 100.0
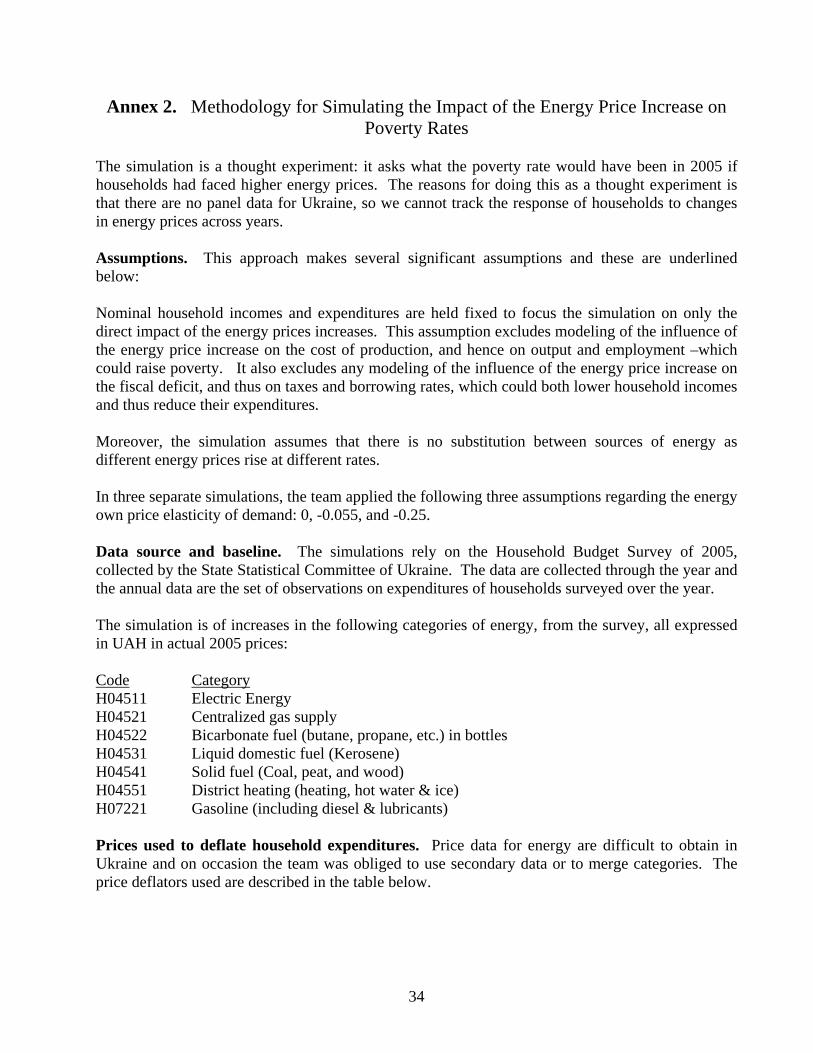
Annex 2. Methodology for Simulating the Impact of the Energy Price Increase on Poverty Rates
The simulation is a thought experiment: it asks what the poverty rate would have been in 2005 if households had faced higher energy prices. The reasons for doing this as a thought experiment is that there are no panel data for Ukraine, so we cannot track the response of households to changes in energy prices across years. Assumptions. This approach makes several significant assumptions and these are underlined below: Nominal household incomes and expenditures are held fixed to focus the simulation on only the direct impact of the energy prices increases. This assumption excludes modeling of the influence of the energy price increase on the cost of production, and hence on output and employment –which could raise poverty. It also excludes any modeling of the influence of the energy price increase on the fiscal deficit, and thus on taxes and borrowing rates, which could both lower household incomes and thus reduce their expenditures. Moreover, the simulation assumes that there is no substitution between sources of energy as different energy prices rise at different rates. In three separate simulations, the team applied the following three assumptions regarding the energy own price elasticity of demand: 0, -0.055, and -0.25. Data source and baseline. The simulations rely on the Household Budget Survey of 2005, collected by the State Statistical Committee of Ukraine. The data are collected through the year and the annual data are the set of observations on expenditures of households surveyed over the year. The simulation is of increases in the following categories of energy, from the survey, all expressed in UAH in actual 2005 prices: Code Category H04511 Electric Energy H04521 Centralized gas supply H04522 Bicarbonate fuel (butane, propane, etc.) in bottles H04531 Liquid domestic fuel (Kerosene) H04541 Solid fuel (Coal, peat, and wood) H04551 District heating (heating, hot water & ice) H07221 Gasoline (including diesel & lubricants) Prices used to deflate household expenditures. Price data for energy are difficult to obtain in Ukraine and on occasion the team was obliged to use secondary data or to merge categories. The price deflators used are described in the table below.
34

Annex 2 Table 1: Energy prices used in modeling consumption expenditure, by type
Code Category Unit Description Source H04511 Electricity UAH/kWh Retail (household) tariff for electricity; NERC H04521 Central
nat gas UAH/M3 Household tariff for natural gas used for
heat (deflated H04521+H04522); Naftogaz & Ministry of Mines and Energy
H04522 Bottled gas
UAH/ M3 Merged with nature gas, above. (This is a very small sub-component of energy.)
Use natural gas prices (above)
H04531 Liquid domestic fuel
UAH/liter Merged with gasoline & diesel below. (This is a very small sub-component)
Use gasoline & diesel prices (below)
H04541 Solid fuel Price index with 2003 =100
(PPI) for mined & quarried materials used for heat (coal & peat) and the PPI for wood products with 2/3, 1/3 weights.
State Statistical Committee & World Bank
H04551 Dist. Heating & hot water
UAH/GCal Average tariff for central heating in Kyiv Joint Stock Company "Kyivenergo"
H07221 Fuels (Gasoline & Diesel)
UAH/liter Retail prices of gasoline and diesel fuel, with ½, ½ weights.
Psyhea (a private research firm)
Computation Use the household budget survey for 2005 to compute the aggregate consumption expenditure per capita; Apply the following three increases in prices for the energy categories, in separate simulations: • The price of each category increases by 50 % relative to the actual price in 2005; • The price of each category increases by 100% relative to the actual price in 2005; and • The actual price increase from 2005 (average) to end-Q1 2007 (Annex 2 Table 2)
Annex 2 Table 2. Prices changes applied in simulation of the actual
change in energy prices from the 2005 average to end-Q1 2007 Category % point change Electricity 73.9 Central natural gas (incl bottled gas) 8.2 Solid fuel (coal & wood) 12.1 Dist. heating & hot water 83.2 Gasoline & diesel (incl. kerosene & lubricants) 56.6 Sources: Annex 2 Table 1, and World Bank computations
Next, compute the change in energy expenditures per capita, applying one of the assumptions about the energy-own price elasticities. The change in expenditures for a single category of energy is:
35

Q1 * P2 - Q1 *P1 = {Q1 + Q1*EED * [P2-P1]/P1} * P2 – Q1*P1 where Q1 is the volume of household energy consumption in period 1, P1 is the price of energy in period 1, P2 is the price of energy in period 2, and EED is the energy own elasticity of demand. Compute the new consumption aggregate per capita net of the change in energy expenditures per capita. Adjust the poverty line to reflect 2005 prices (leading to a line of 1812.8 UAH). Finally, compute the percentage of households that fall below the poverty line at the simulated energy prices.
36

37
BIBLIOGRAPHY
Anusic, Zoran and Katerina Petrina (2005). “Pension Reform in Ukraine: Remedies to Recent Fiscal and Structural challenges.” World Bank, February. Cooper, John C.B. (2003), “Price Elasticity of Demand for Crude Oil: Estimates for 23 Countries.” OPEC Review. Davis, Mark, Ruslan Piontkivsky, Olga Pindyuk, and Dejan Ostojic “Ukraine: the Impact of Higher Natural Gas and Oil Prices.” Xerox, Paper prepared for the World Bank, December 6. Finkel, Eugen (2006). “Ukraine Energy and Poverty Note.” Xerox, paper written for the World Bank, May. IMF (2005). Ukraine: Selected Issues. IMF Country Report No 05/416, Washington, DC, November. Lybanova, E., Cherenko L., Makarova O., Krykun O., Shyshkin V., Zotova O., Malikov A., Hersymenko H., Holyuk S. (2004). “Scientific Report on the topic Poverty in Urkaine,” Background paper for the PULSE Poverty Assessment. Raiser, Martin (2007). “Are Wages in Ukraine Too Low? And What Could Be Done to Increase Them?” draft note for the World Bank, Kyiv, Ukraine: World Bank (2005). Ukraine Poverty Assessment: Poverty and Inequality in a Growing Economy. Report no. 34631-UA, World Bank: Washington, DC, December. World Bank (2005). Ukraine: Jobs Study. World Bank (2006). Ukraine Poverty Assessment: Poverty and Inequality in Social Dimensions. World Bank: Washington, DC, June. World Bank (2006). Creating Fiscal Space for Growth in Ukraine: A Public Finance Review. Report no. 36671-UA, September 14.