ulcerative colitis-associated e. coli pathobionts
TRANSCRIPT
HAL Id: hal-03003143https://hal.archives-ouvertes.fr/hal-03003143
Submitted on 13 Nov 2020
HAL is a multi-disciplinary open accessarchive for the deposit and dissemination of sci-entific research documents, whether they are pub-lished or not. The documents may come fromteaching and research institutions in France orabroad, or from public or private research centers.
L’archive ouverte pluridisciplinaire HAL, estdestinée au dépôt et à la diffusion de documentsscientifiques de niveau recherche, publiés ou non,émanant des établissements d’enseignement et derecherche français ou étrangers, des laboratoirespublics ou privés.
Distributed under a Creative Commons Attribution| 4.0 International License
Ulcerative Colitis-associated E. coli pathobiontspotentiate colitis in susceptible hosts
Hyungjun Yang, Hengameh Chloé Mirsepasi-Lauridsen, Carsten Struve,Joannie Allaire, Adeline Sivignon, Wayne Vogl, Else Bosman, Caixia Ma,
Abbas Fotovati, Gregor Reid, et al.
To cite this version:Hyungjun Yang, Hengameh Chloé Mirsepasi-Lauridsen, Carsten Struve, Joannie Allaire, AdelineSivignon, et al.. Ulcerative Colitis-associated E. coli pathobionts potentiate colitis in suscepti-ble hosts. Journal of Immunology, Publisher : Baltimore : Williams & Wilkins, c1950-. Lat-est Publisher : Bethesda, MD : American Association of Immunologists, 2020, 12 (1), pp.1-20.�10.1080/19490976.2020.1847976�. �hal-03003143�
1
Ulcerative Colitis-associated E. coli pathobionts potentiate colitis in susceptible hosts
Hyungjun Yang1, Hengameh Chloé Mirsepasi-Lauridsen2, 3, Carsten Struve2, Joannie M. Allaire1, Adeline Sivignon4,5, Wayne Vogl6, Else S. Bosman1, Caixia Ma1, Abbas Fotovati1, Gregor S. Reid1, Xiaoxia Li7, Andreas Munk Petersen8,9, Sébastien G. Gouin10, Nicolas Barnich4,5, Kevan Jacobson1, Hong Bing Yu1, *, Karen Angeliki Krogfelt2, *, and Bruce A. Vallance1, 11 *
1Department of Pediatrics, BC Children’s Hospital, University of British Columbia, Vancouver, British Columbia, Canada. 2Department of Bacteria, Parasites and Fungi, Statens Serum Institute, Copenhagen, Denmark. 3Department of Biology, University of Copenhagen, Copenhagen, Denmark. 4Université Clermont Auvergne, Laboratoire Microbes Intestin Inflammation et Susceptibilité de l'Hôte (M2iSH), Inserm U1071, M2iSH, F-63000 Clermont-Ferrand, France. 5INRA, Unité Sous Contrat 2018, Clermont-Ferrand, France. 6Department of Cellular and Physiological Sciences, University of British Columbia, Vancouver, British Columbia, Canada. 7Department of Immunology, Cleveland Clinic Lerner Research Institute, Cleveland, Ohio, USA. 8Department of Gastroenterology, Copenhagen University Hospital, Hvidovre, Denmark. 9Department of Clinical Microbiology, Copenhagen University Hospital, Hvidovre, Denmark. 10Université de Nantes, Chimie et Interdisciplinarité, Synthèse, Analyse, Modélisation (CEISAM), UMR CNRS 6230, UFR des Sciences et des Techniques, Nantes, France. 11Lead contact * Correspondence, Hong Bing Yu (HBY), [email protected]; Karen Angeliki Krogfelt (KAK), [email protected]; and Bruce A. Vallance (BAV), [email protected] Short title: E. coli pathobionts isolated from UC patients worsen murine colitis.
2
Abstract
Ulcerative colitis (UC) is a chronic inflammatory condition linked to intestinal microbial
dysbiosis, including the expansion of E. coli strains related to extra-intestinal pathogenic E. coli.
These “pathobionts” exhibit pathogenic properties, but their potential to promote UC is unclear
due to the lack of relevant animal models. Here, we established a mouse model using a
representative UC pathobiont strain (p19A), and mice lacking single immunoglobulin and toll-
interleukin 1 receptor domain (SIGIRR), a deficiency increasing susceptibility to gut infections.
Strain p19A was found to adhere to the cecal mucosa of Sigirr -/- mice, causing modest
inflammation. Moreover, it dramatically worsened dextran sodium sulfate-induced colitis. This
potentiation was attenuated using a p19A strain lacking α-hemolysin genes, or when we targeted
pathobiont adherence using a p19A strain lacking the adhesin FimH, or following treatment with
FimH antagonists. Thus, UC pathobionts adhere to the intestinal mucosa, and worsen the course
of colitis in susceptible hosts.
Key words
Inflammatory Bowel Disease, Ulcerative colitis, Crohn’s disease, intestinal microbiota, in vivo
mouse model
Abbreviations
Inflammatory Bowel Disease (IBD), Gastrointestinal (GI), Ulcerative colitis UC), Crohn´s
disease (CD), Extra-intestinal Pathogenic E. coli (ExPEC), Adherent-invasive E. coli (AIEC),
dendritic cells (DC)
3
Introduction
Inflammatory bowel diseases (IBD) are chronic inflammatory conditions traditionally divided
into Crohn’s disease (CD) and Ulcerative Colitis (UC). CD is a chronic, segmentally localized
and penetrating granulomatous inflammatory disease that can affect any part of the
gastrointestinal (GI) tract1. In contrast, UC is a relapsing, superficial mucosal inflammatory
disease restricted to the colon that is characterized by bloody diarrhoea during flares of the
disease. The aetiology of IBD is still unknown, but thought to reflect the convergence of
environmental stimuli and genetic susceptibility factors that together promote chronic intestinal
inflammation. A variety of IBD susceptibility genes have been identified, many of them
encoding proteins that regulate innate immune control over enteric bacterial pathogens, such as
NOD2, NALP3 and ATG16L12. Correspondingly, numerous investigations suggest the
characteristic intestinal inflammation seen in IBD patients occurs concurrently with, and is
potentially exacerbated by dysbiotic changes in the intestinal microbiome3. In many studies, the
loss of potentially beneficial microbes such as Faecalbacterium prausnitzii and Lactobacilli
species, as well as a reduction in microbial diversity have been suggested as pathogenic steps
towards the development of IBD.
Even so, the loss of beneficial microbes alone does not explain the complicated role played by
the gut microbiota in IBD. For example, placebo-controlled studies have shown that antibiotic
treatment can induce remission in some IBD patients4, 5. Moreover, the overgrowth of specific
Escherichia coli species has been suspected since the 1970’s as the reason for relapses in some
patients with IBD6. In 1988, Burke et al 7 showed a significantly higher frequency of adherent E.
coli isolated from UC and CD patients undergoing disease relapse, as compared to healthy
4
persons. Several additional studies have demonstrated an increased prevalence of E. coli with
virulence properties in the GI tracts of IBD patients, especially within IBD patients undergoing
disease relapse8-10. Recent studies indicate the involvement of adherent-invasive E. coli (AIEC)
in the pathogenesis of CD11-14, with demonstrations that AIEC can invade intestinal epithelial
cells as well as persist within macrophages15, 16. The development of several mouse models of
AIEC infection has aided in defining the virulence properties of AIEC, as well as the host factors
that control susceptibility to these microbes17, 18.
Although AIEC is frequently seen in CD patients, it is uncommon in UC patients. Instead,
diffusely adherent E. coli (DAEC) have been linked to UC19. Bacteriological analysis of biopsies
and fecal samples from UC patients shows the increased prevalence of E. coli species belonging
to the B2 phylogenetic group that harbour extra-intestinal pathogenic E. coli (ExPEC) genes20, 21,
including α-hemolysin genes, as well as the gene encoding the adhesin FimH. Notably, studies
focusing on a representative UC-associated E. coli strain termed p19A found that upon
phagocytosis, this hemolysin-expressing microbe triggered the death of dendritic cells as well as
strongly stimulated the secretion of the proinflammatory cytokines TNF-α, IL-6 and IL-2322.
Studies of p19A interactions with the Caco-2 intestinal epithelial cell line have also shown that
p19A induces α-hemolysin dependent damage to the tight junction protein occludin and thereby
disrupts tight junctions in Caco-2 cells, increasing barrier permeability20, 23. Despite these
pathogenic properties, the potential for these E. coli pathobionts to promote the course of UC
remains unclear due to the lack of relevant animal models.
Recently, we have made significant progress developing mouse models of enteric infection,
using mice deficient in Single IgG IL-1 Related Receptor (SIGIRR). SIGIRR is highly expressed
by intestinal epithelial cells, acting as a negative regulator of innate signaling through most Toll-
5
like receptors (TLR) as well as IL-1R24. The absence of SIGIRR results in an increased
inflammatory tone within the GI tract under baseline conditions, as well as exaggerated
inflammatory and antimicrobial responses to murine and human enteric bacterial pathogens 25, 26.
Similarly, many IBD patients, even in remission, have a higher inflammatory tone in their GI
tracts. Interestingly, upon Citrobacter rodentium infection, Sigirr -/- mice exhibited exaggerated
antimicrobial responses that were largely ineffective against this pathogen, but instead depleted
competing resident commensal microbes. We also found Sigirr -/- mice to be uniquely
susceptible to infection by the clinically important foodborne pathogen Campylobacter jejuni,
developing overt gastroenteritis upon infection26.
Based on these findings, we explored the potential to establish a mouse model of GI infection by
the UC-associated E. coli strain p19A, as well as characterize the pathogenic features of p19A.
Initial studies showed that mice orally gavaged with high and/or repeated doses of p19A suffered
severe damage within the small and large intestine as well as systemic spread of the bacteria,
leading to high mortality rates 27. Interestingly, these responses were at least partially dependent
on α-hemolysin. In our current study, to develop a mouse model more representative of UC, mice
were pretreated with vancomycin and then infected with a single moderate dose of p19A. Indeed,
vancomycin pretreatment of wildtype C57BL/6 mice enabled p19A to persistently colonize the
intestinal lumen, whereas the same treatment of Sigirr -/- mice also led to p19A adherence to the
cecal mucosal surface. While p19A infection caused modest cecal inflammation in non-DSS
treated Sigirr -/- mice, it dramatically worsened the course of colitis in DSS treated Sigirr -/-
mice, with p19A showing increased adherence to the inflamed intestinal mucosa. Notably, this
adherence, and its ability to worsen colitis was lost with a p19A strain lacking the adhesin FimH,
or when mice were given FimH antagonists to block p19A adhesion. Moreover, a p19A strain
6
lacking α-hemolysin genes (∆hlyI∆hlyII) was attenuated in its ability to promote DSS colitis. Our
findings thus provide evidence that UC associated E. coli strains can readily and persistently
colonize the intestines of susceptible hosts, and significantly worsen the course of colitis in a
manner dependent on specific virulence factors, including α-hemolysin and the type 1 fimbrial
adhesin FimH.

7
Results
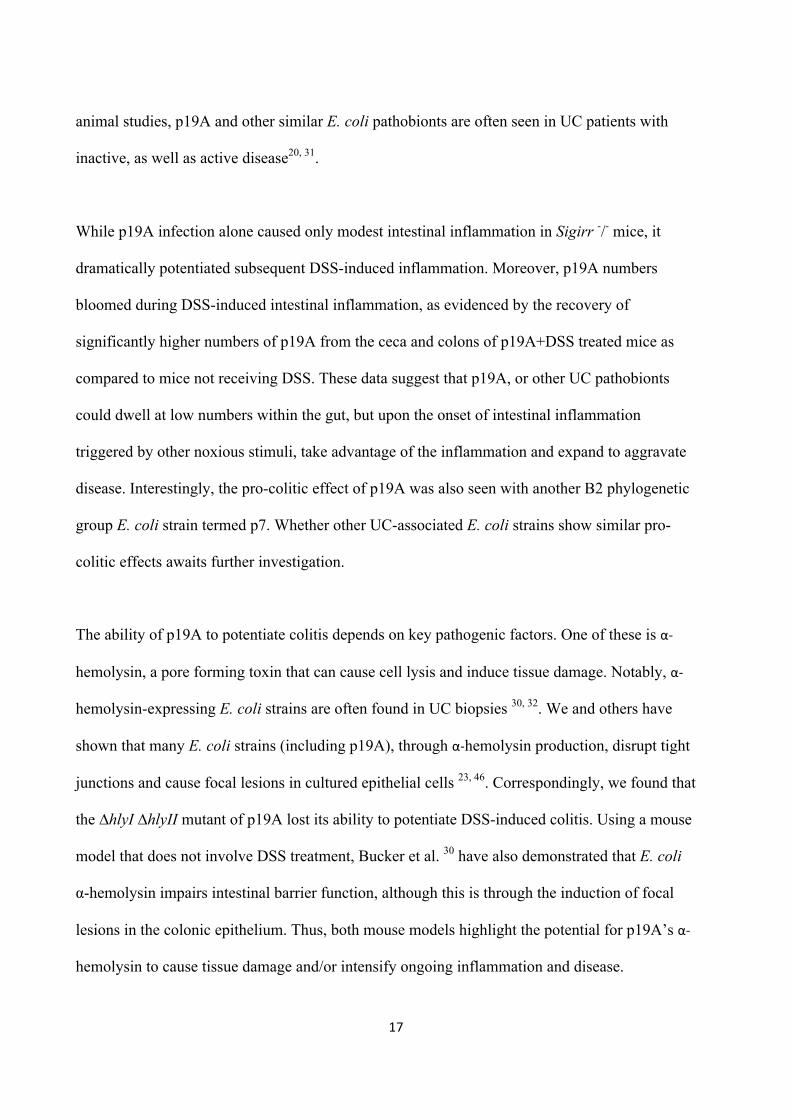
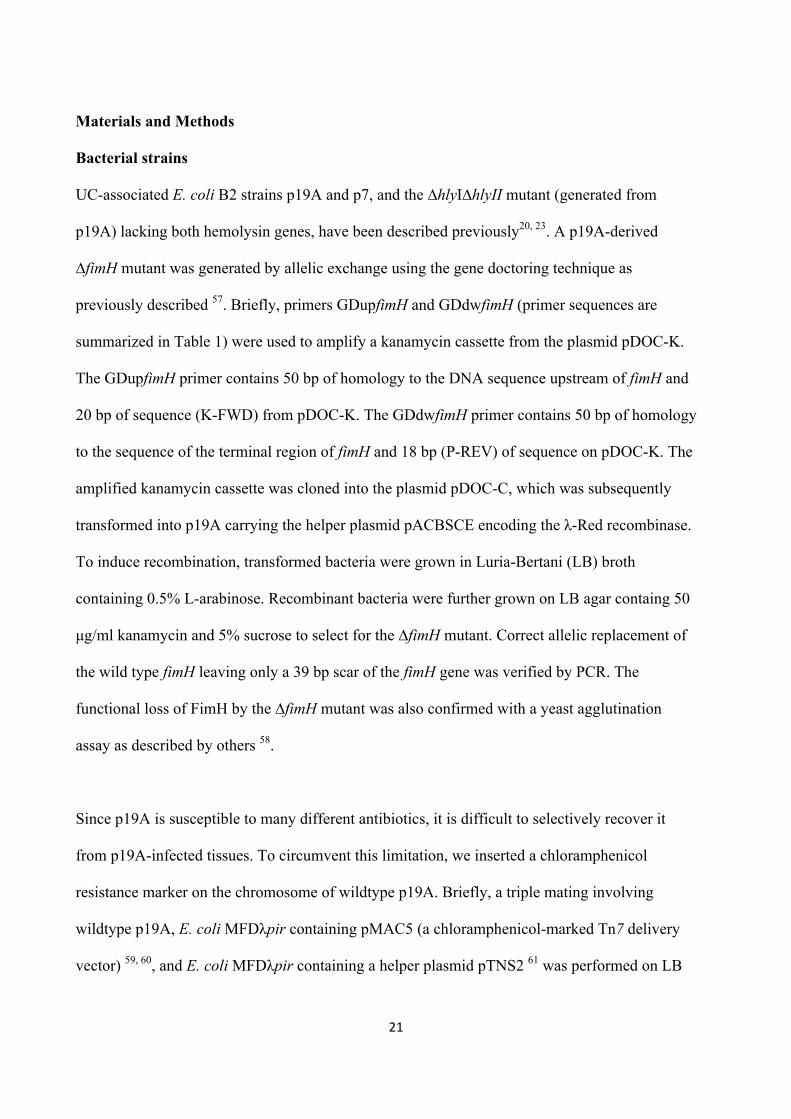
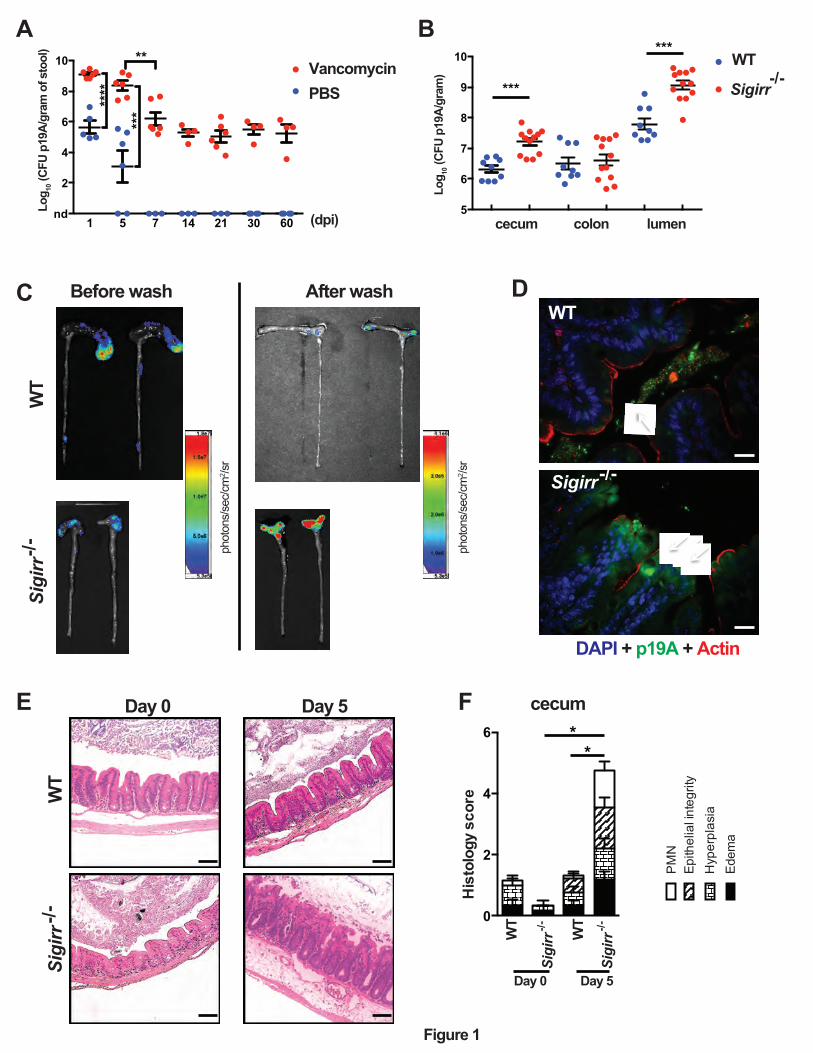
Vancomycin pretreatment facilitates persistent p19A intestinal colonization of C57BL/6
mice.
A variety of B2 phylogenetic group E. coli strains have been isolated from patients with either
active or inactive UC20. Whether these E. coli strains play a pathogenic role in UC remains
unclear. To address this, we examined the ability of p19A, one of the best-characterized human
UC isolates 23, to colonize the intestines of mice. Groups of C57BL/6 wildtype (WT) mice were
left untreated, or pretreated with vancomycin for 6 hours, followed by infection with p19A. We
then quantified the number of p19A in the stool by plating. As shown in Figure 1A, mice not
receiving vancomycin showed only moderate shedding of p19A in the stool (105 colony forming
units (CFU)/gram) at 1 day post-infection (dpi), but by 5 and 7 dpi, p19A was greatly reduced
(~103 CFU/gram) or even cleared from the stool. By 14 dpi, p19A was cleared from the stool of
all mice. In contrast, pretreatment with vancomycin dramatically increased p19A shedding to
109 CFU/gram of stool at 1 dpi, and similar levels (5 x 10⁸ CFU/gram) were shed at 5 dpi. The
shedding of p19A gradually decreased to an average of 106 CFU/gram by 7 dpi and to 105
CFU/gram of stool by 14 dpi. This level of shedding continued out to 60 dpi, and potentially
beyond, showing that p19A can persistently colonize the intestines of mice following antibiotic
treatment.
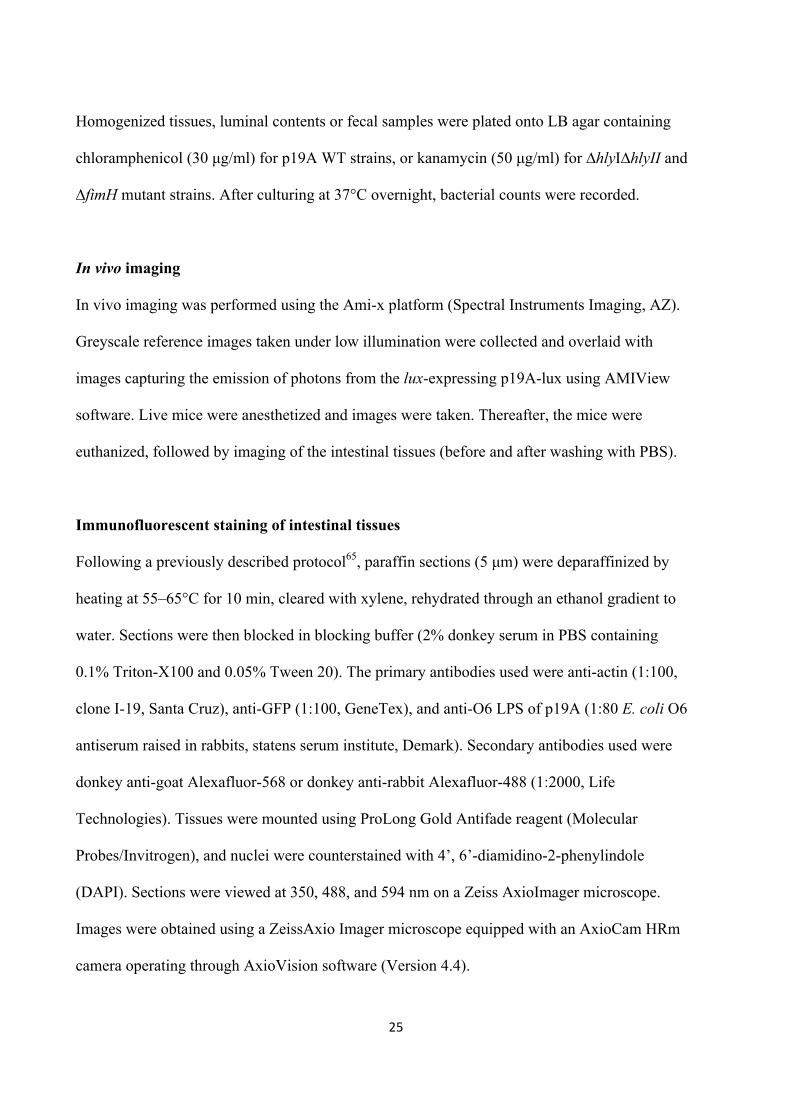
Sigirr -/- mice show increased susceptibility to p19A colonization of the GI tract.
Our group has previously shown that Sigirr -/- mice display heightened susceptibility to several
intestinal pathogens25, 26. We tested whether these mice would also be susceptible to p19A
infection. WT and Sigirr -/- mice were pretreated with vancomycin for 6 hours and then infected
with p19A. At 5 dpi, the numbers of p19A recovered from the ceca and colonic lumen of Sigirr -
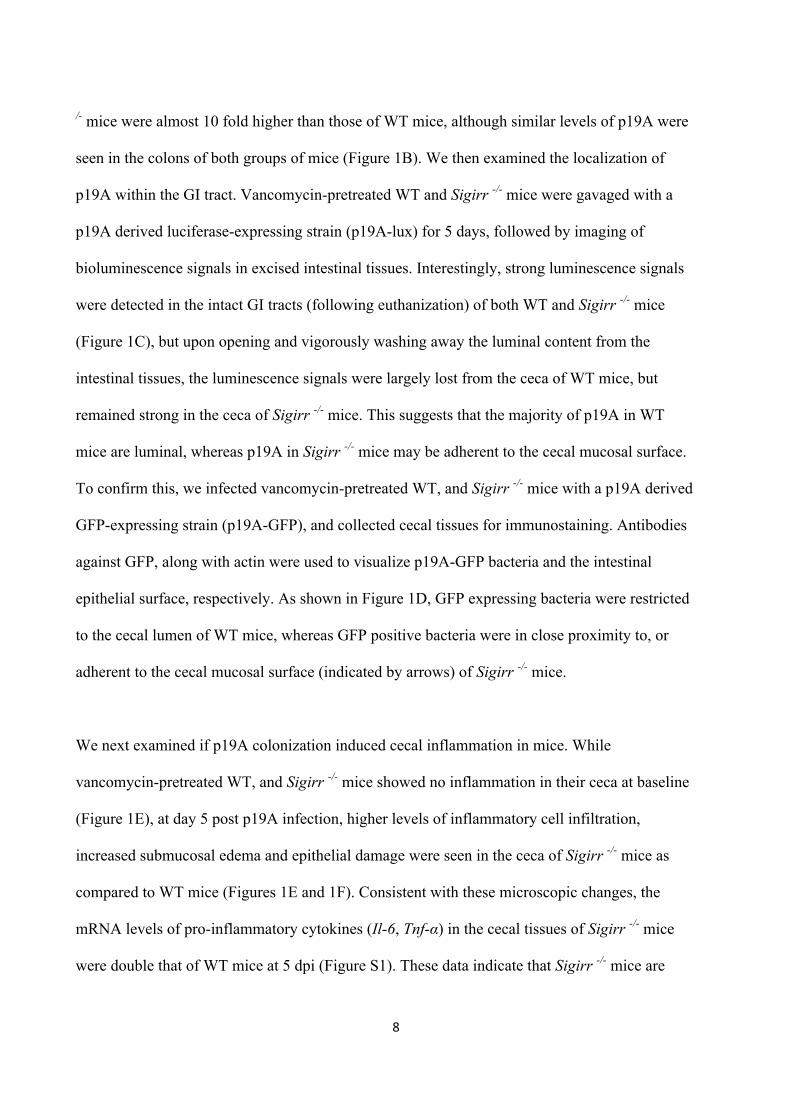
8
/- mice were almost 10 fold higher than those of WT mice, although similar levels of p19A were
seen in the colons of both groups of mice (Figure 1B). We then examined the localization of
p19A within the GI tract. Vancomycin-pretreated WT and Sigirr -/- mice were gavaged with a
p19A derived luciferase-expressing strain (p19A-lux) for 5 days, followed by imaging of
bioluminescence signals in excised intestinal tissues. Interestingly, strong luminescence signals
were detected in the intact GI tracts (following euthanization) of both WT and Sigirr -/- mice
(Figure 1C), but upon opening and vigorously washing away the luminal content from the
intestinal tissues, the luminescence signals were largely lost from the ceca of WT mice, but
remained strong in the ceca of Sigirr -/- mice. This suggests that the majority of p19A in WT
mice are luminal, whereas p19A in Sigirr -/- mice may be adherent to the cecal mucosal surface.
To confirm this, we infected vancomycin-pretreated WT, and Sigirr -/- mice with a p19A derived
GFP-expressing strain (p19A-GFP), and collected cecal tissues for immunostaining. Antibodies
against GFP, along with actin were used to visualize p19A-GFP bacteria and the intestinal
epithelial surface, respectively. As shown in Figure 1D, GFP expressing bacteria were restricted
to the cecal lumen of WT mice, whereas GFP positive bacteria were in close proximity to, or
adherent to the cecal mucosal surface (indicated by arrows) of Sigirr -/- mice.
We next examined if p19A colonization induced cecal inflammation in mice. While
vancomycin-pretreated WT, and Sigirr -/- mice showed no inflammation in their ceca at baseline
(Figure 1E), at day 5 post p19A infection, higher levels of inflammatory cell infiltration,
increased submucosal edema and epithelial damage were seen in the ceca of Sigirr -/- mice as
compared to WT mice (Figures 1E and 1F). Consistent with these microscopic changes, the
mRNA levels of pro-inflammatory cytokines (Il-6, Tnf-α) in the cecal tissues of Sigirr -/- mice
were double that of WT mice at 5 dpi (Figure S1). These data indicate that Sigirr -/- mice are
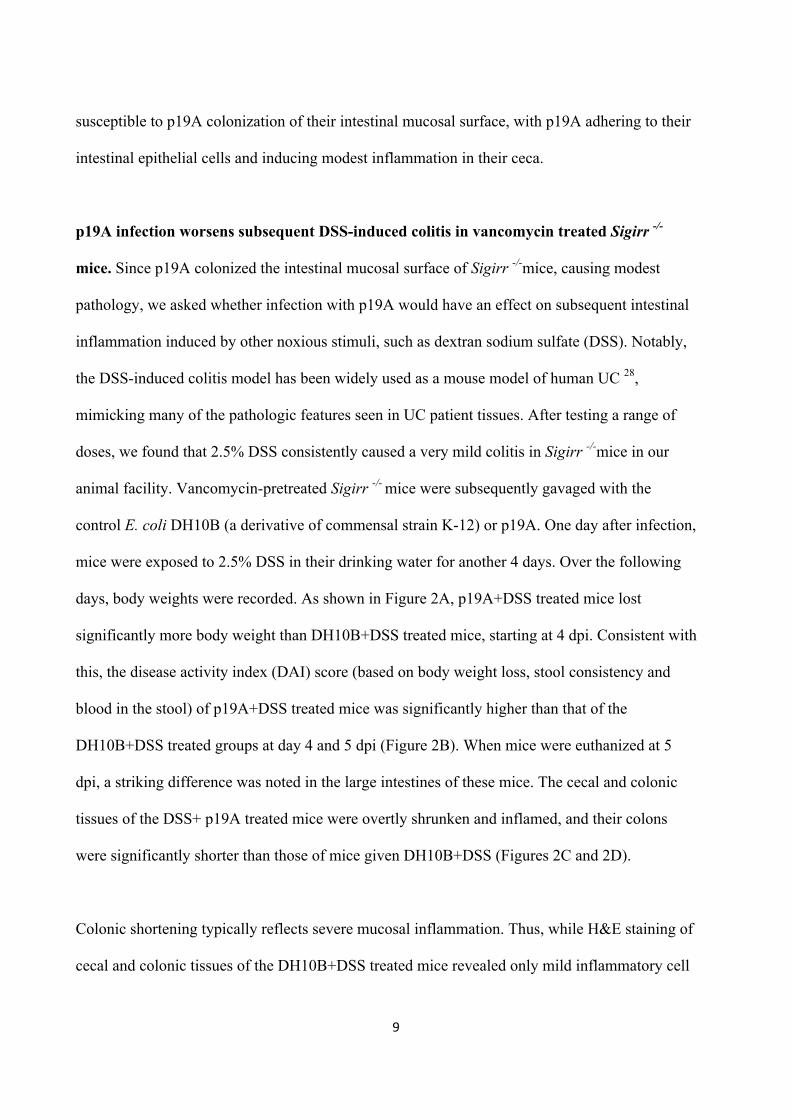
9
susceptible to p19A colonization of their intestinal mucosal surface, with p19A adhering to their
intestinal epithelial cells and inducing modest inflammation in their ceca.
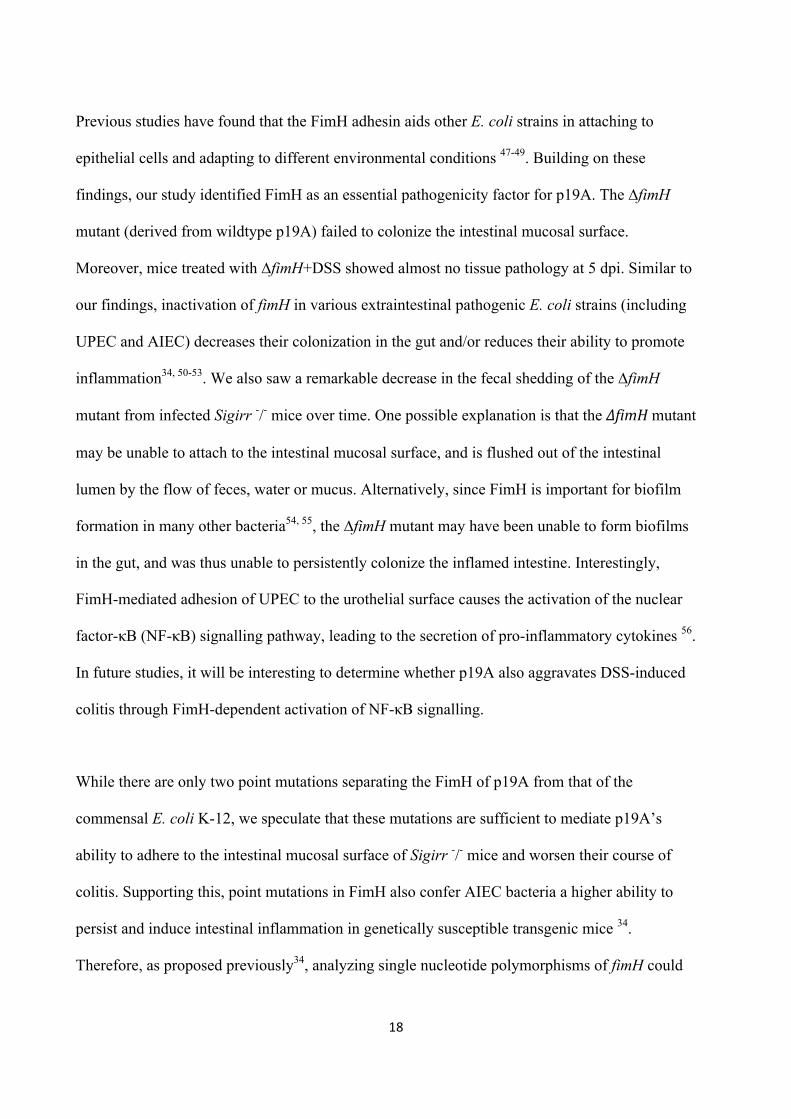
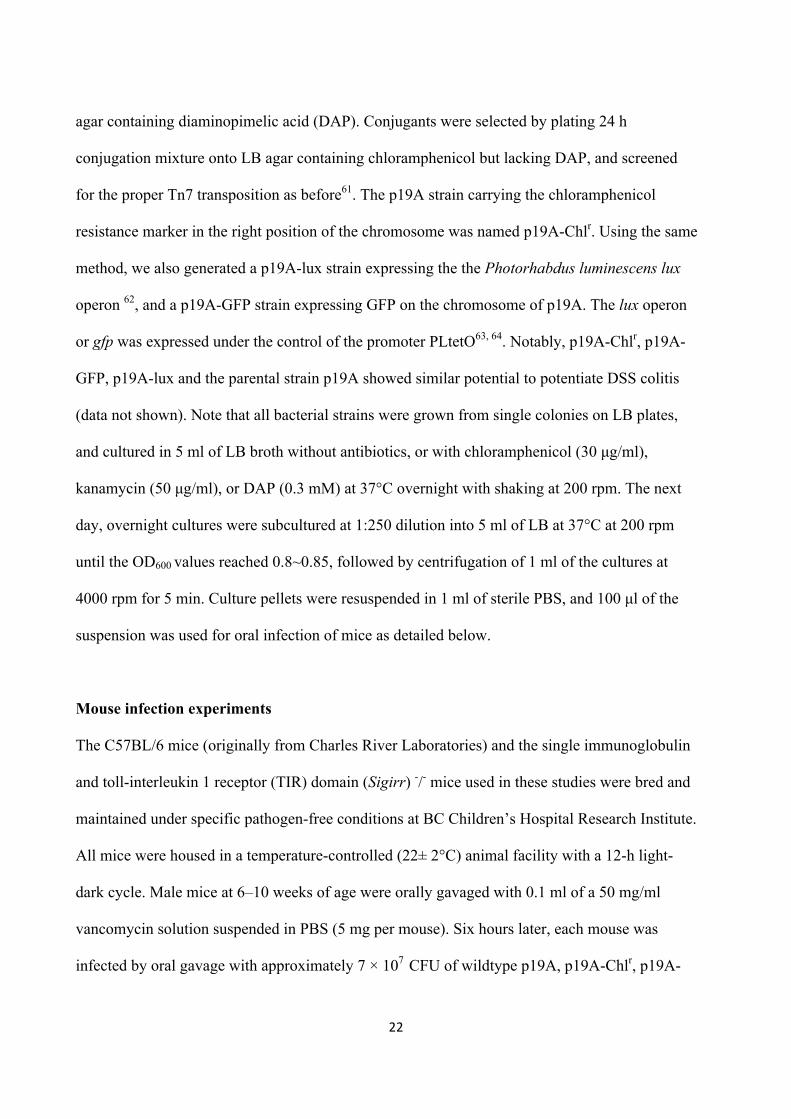
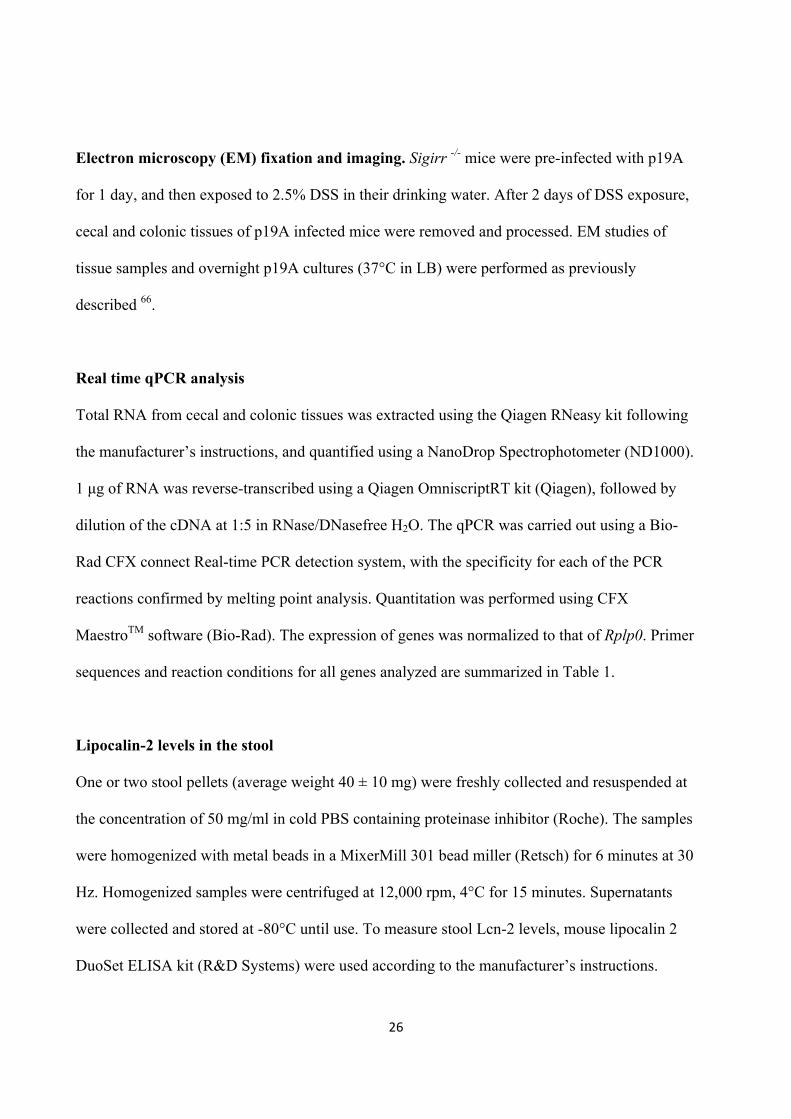
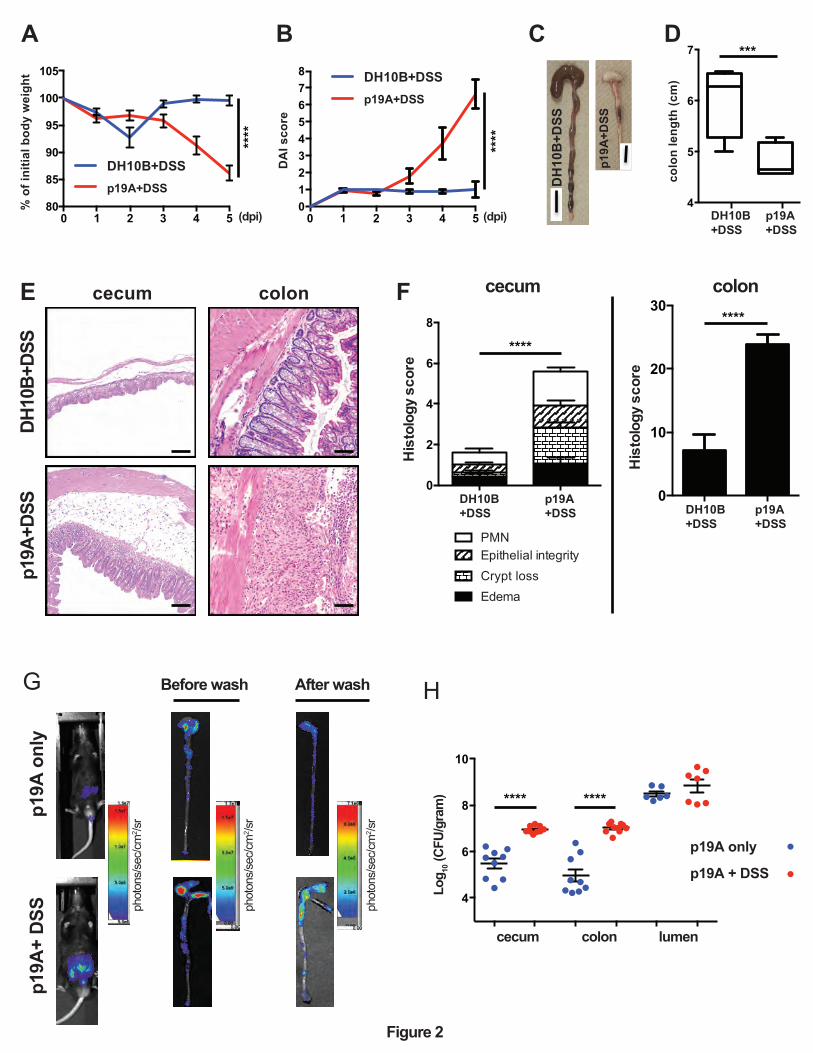
p19A infection worsens subsequent DSS-induced colitis in vancomycin treated Sigirr -/-
mice. Since p19A colonized the intestinal mucosal surface of Sigirr -/-mice, causing modest
pathology, we asked whether infection with p19A would have an effect on subsequent intestinal
inflammation induced by other noxious stimuli, such as dextran sodium sulfate (DSS). Notably,
the DSS-induced colitis model has been widely used as a mouse model of human UC 28,
mimicking many of the pathologic features seen in UC patient tissues. After testing a range of
doses, we found that 2.5% DSS consistently caused a very mild colitis in Sigirr -/-mice in our
animal facility. Vancomycin-pretreated Sigirr -/- mice were subsequently gavaged with the
control E. coli DH10B (a derivative of commensal strain K-12) or p19A. One day after infection,
mice were exposed to 2.5% DSS in their drinking water for another 4 days. Over the following
days, body weights were recorded. As shown in Figure 2A, p19A+DSS treated mice lost
significantly more body weight than DH10B+DSS treated mice, starting at 4 dpi. Consistent with
this, the disease activity index (DAI) score (based on body weight loss, stool consistency and
blood in the stool) of p19A+DSS treated mice was significantly higher than that of the
DH10B+DSS treated groups at day 4 and 5 dpi (Figure 2B). When mice were euthanized at 5
dpi, a striking difference was noted in the large intestines of these mice. The cecal and colonic
tissues of the DSS+ p19A treated mice were overtly shrunken and inflamed, and their colons
were significantly shorter than those of mice given DH10B+DSS (Figures 2C and 2D).
Colonic shortening typically reflects severe mucosal inflammation. Thus, while H&E staining of
cecal and colonic tissues of the DH10B+DSS treated mice revealed only mild inflammatory cell
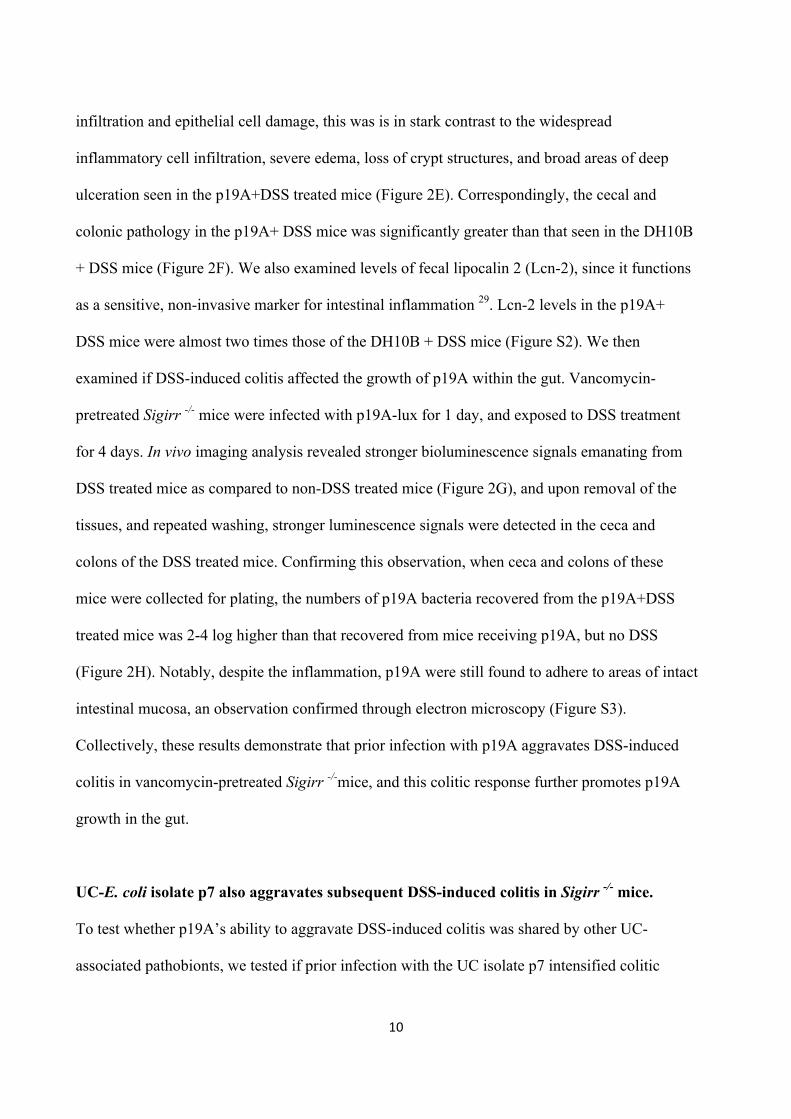
10
infiltration and epithelial cell damage, this was is in stark contrast to the widespread
inflammatory cell infiltration, severe edema, loss of crypt structures, and broad areas of deep
ulceration seen in the p19A+DSS treated mice (Figure 2E). Correspondingly, the cecal and
colonic pathology in the p19A+ DSS mice was significantly greater than that seen in the DH10B
+ DSS mice (Figure 2F). We also examined levels of fecal lipocalin 2 (Lcn-2), since it functions
as a sensitive, non-invasive marker for intestinal inflammation 29. Lcn-2 levels in the p19A+
DSS mice were almost two times those of the DH10B + DSS mice (Figure S2). We then
examined if DSS-induced colitis affected the growth of p19A within the gut. Vancomycin-
pretreated Sigirr -/- mice were infected with p19A-lux for 1 day, and exposed to DSS treatment
for 4 days. In vivo imaging analysis revealed stronger bioluminescence signals emanating from
DSS treated mice as compared to non-DSS treated mice (Figure 2G), and upon removal of the
tissues, and repeated washing, stronger luminescence signals were detected in the ceca and
colons of the DSS treated mice. Confirming this observation, when ceca and colons of these
mice were collected for plating, the numbers of p19A bacteria recovered from the p19A+DSS
treated mice was 2-4 log higher than that recovered from mice receiving p19A, but no DSS
(Figure 2H). Notably, despite the inflammation, p19A were still found to adhere to areas of intact
intestinal mucosa, an observation confirmed through electron microscopy (Figure S3).
Collectively, these results demonstrate that prior infection with p19A aggravates DSS-induced
colitis in vancomycin-pretreated Sigirr -/-mice, and this colitic response further promotes p19A
growth in the gut.
UC-E. coli isolate p7 also aggravates subsequent DSS-induced colitis in Sigirr -/- mice.
To test whether p19A’s ability to aggravate DSS-induced colitis was shared by other UC-
associated pathobionts, we tested if prior infection with the UC isolate p7 intensified colitic
11
responses induced by DSS. Notably, the pathobionts p7 and p19A both belong to the B2
phylogenetic group, but they display different sero-type profiles 20. Vancomycin pretreated Sigirr
-/- mice were infected with E. coli DH10B or p7 for 1 day, followed by exposure to DSS as
above. As shown in Figure S4, p7+DSS treated mice showed significantly worsened clinical
symptoms as compared to DH10B+DSS treated mice, including greater body weight loss, higher
DAI, and exaggerated tissue pathology. Thus, E. coli isolates from different UC patients are
conserved in their ability to worsen DSS-induced colitis in Sigirr -/- mice.
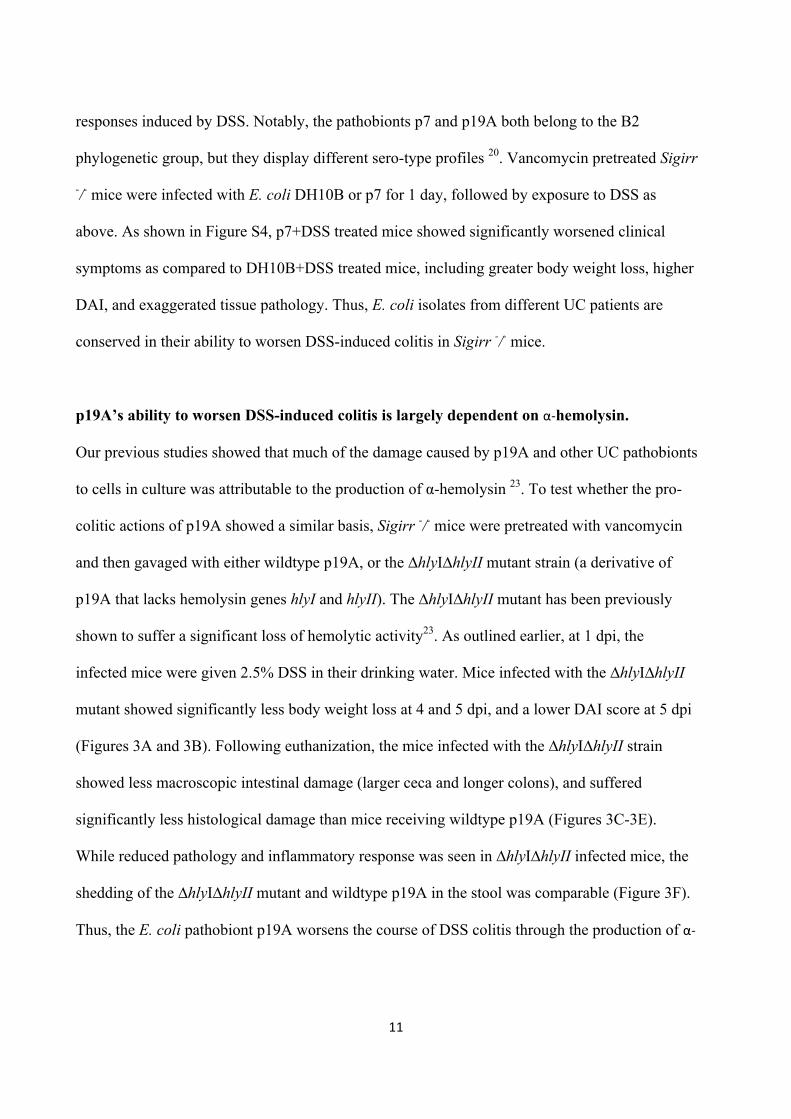
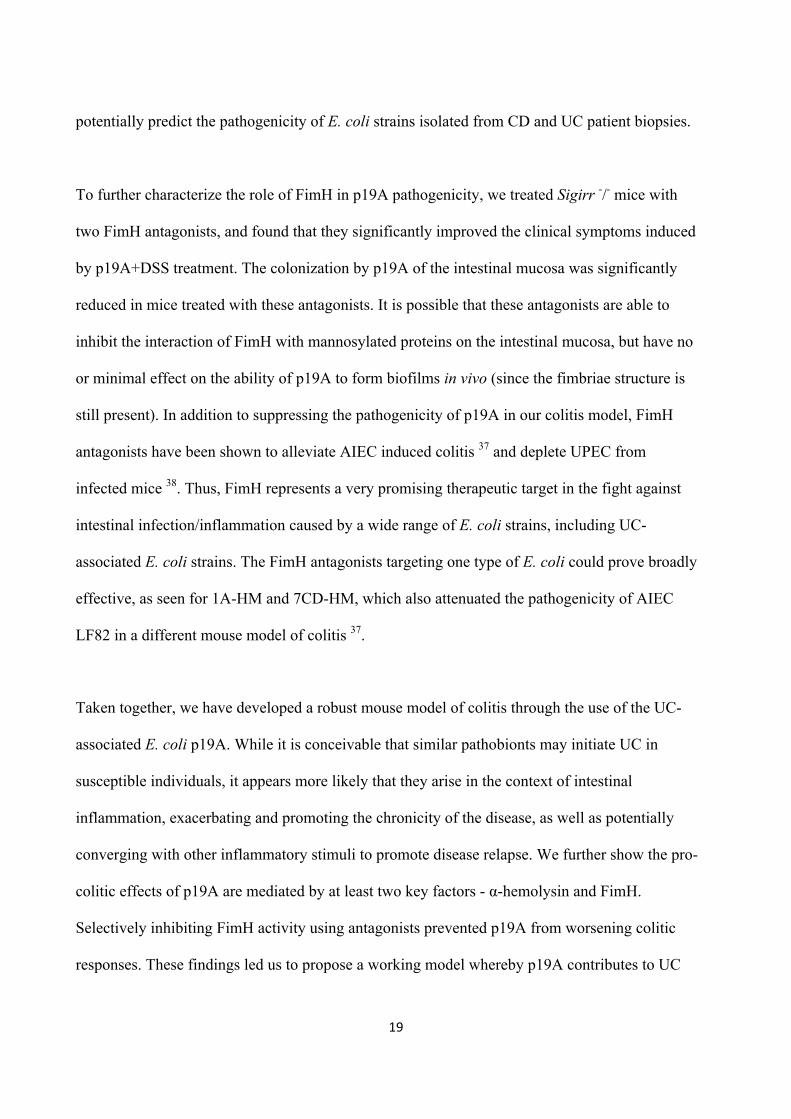
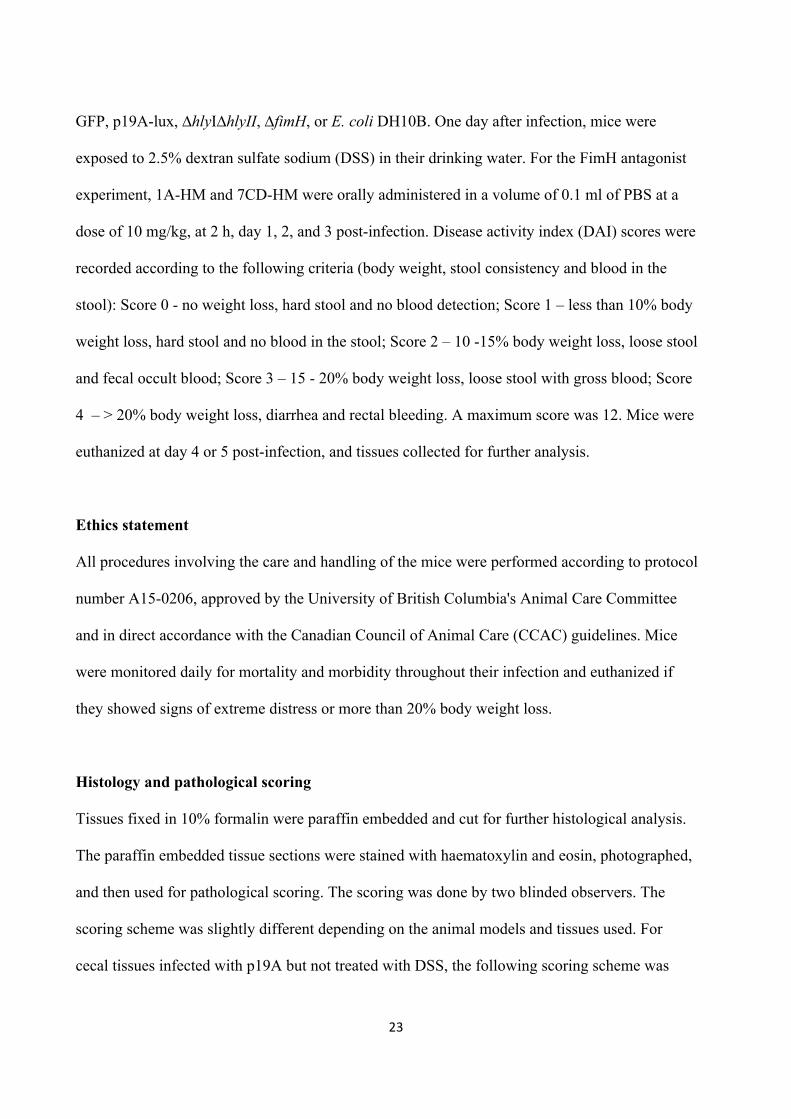
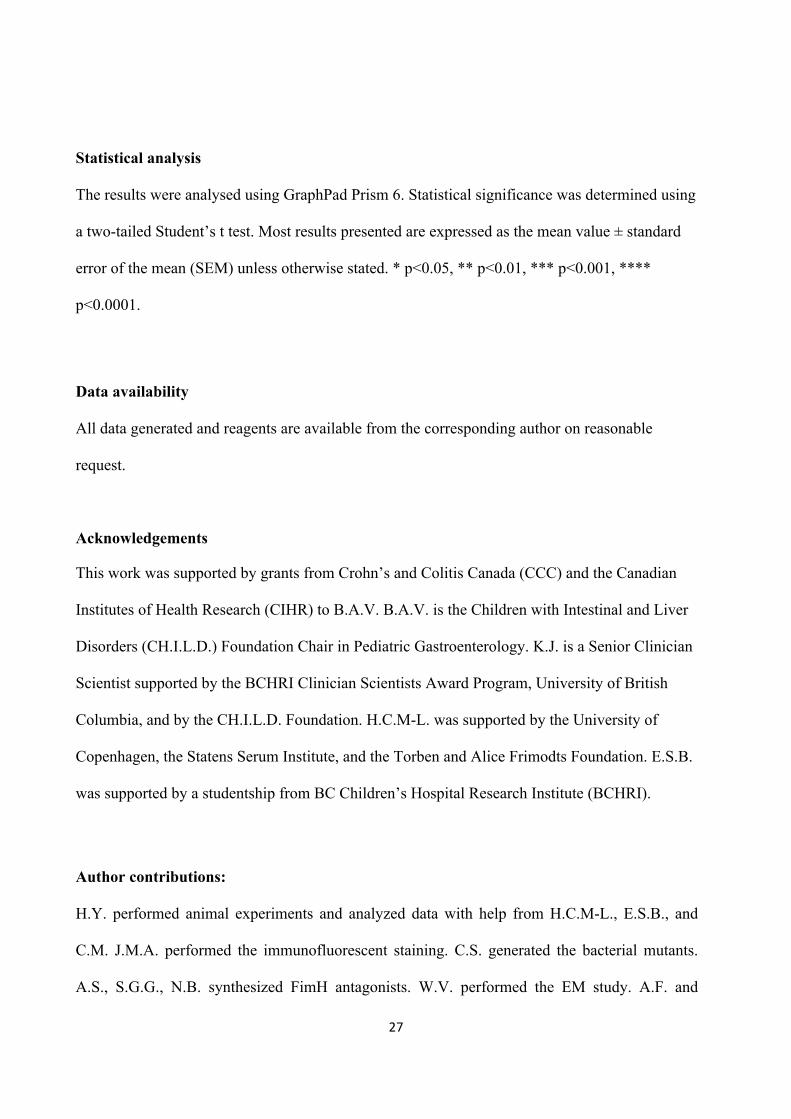
p19A’s ability to worsen DSS-induced colitis is largely dependent on α-hemolysin.
Our previous studies showed that much of the damage caused by p19A and other UC pathobionts
to cells in culture was attributable to the production of α-hemolysin 23. To test whether the pro-
colitic actions of p19A showed a similar basis, Sigirr -/- mice were pretreated with vancomycin
and then gavaged with either wildtype p19A, or the ∆hlyI∆hlyII mutant strain (a derivative of
p19A that lacks hemolysin genes hlyI and hlyII). The ∆hlyI∆hlyII mutant has been previously
shown to suffer a significant loss of hemolytic activity23. As outlined earlier, at 1 dpi, the
infected mice were given 2.5% DSS in their drinking water. Mice infected with the ∆hlyI∆hlyII
mutant showed significantly less body weight loss at 4 and 5 dpi, and a lower DAI score at 5 dpi
(Figures 3A and 3B). Following euthanization, the mice infected with the ∆hlyI∆hlyII strain
showed less macroscopic intestinal damage (larger ceca and longer colons), and suffered
significantly less histological damage than mice receiving wildtype p19A (Figures 3C-3E).
While reduced pathology and inflammatory response was seen in ∆hlyI∆hlyII infected mice, the
shedding of the ∆hlyI∆hlyII mutant and wildtype p19A in the stool was comparable (Figure 3F).
Thus, the E. coli pathobiont p19A worsens the course of DSS colitis through the production of α-
12
hemolysin, a virulence factor previously linked to this microbe’s ability to trigger inflammatory
responses in vivo and damage intestinal epithelial barrier function in vitro 23, 30, 31.
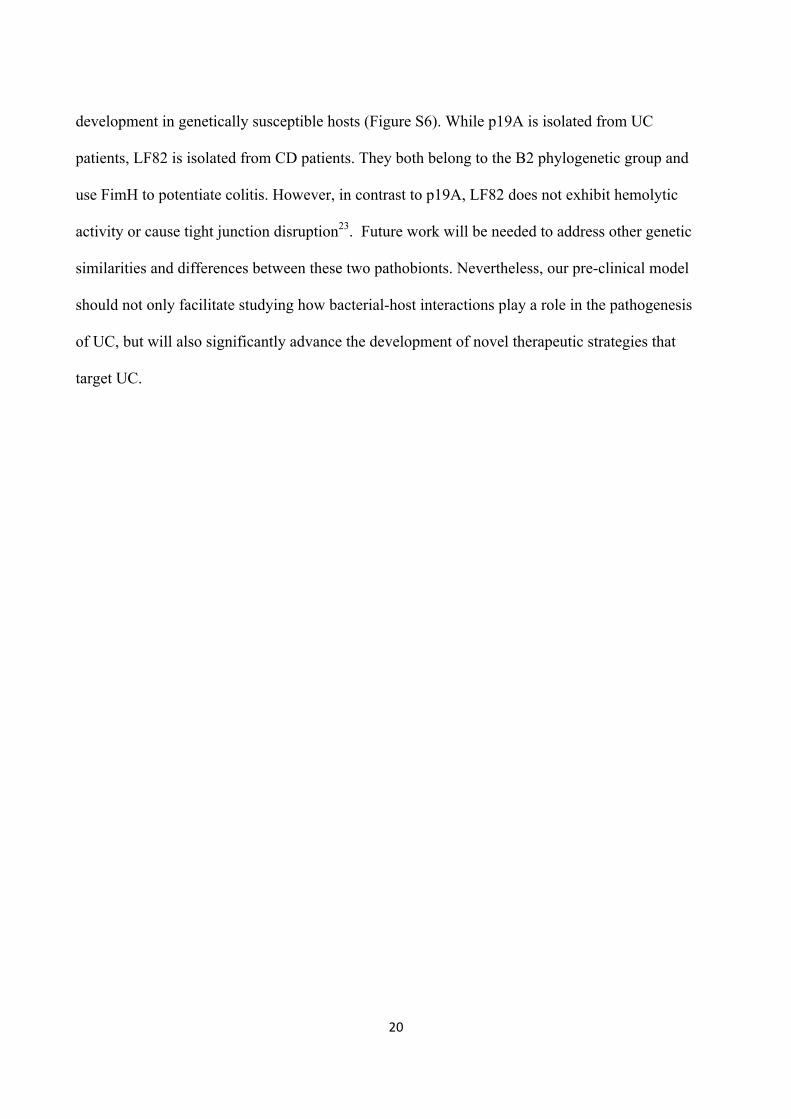
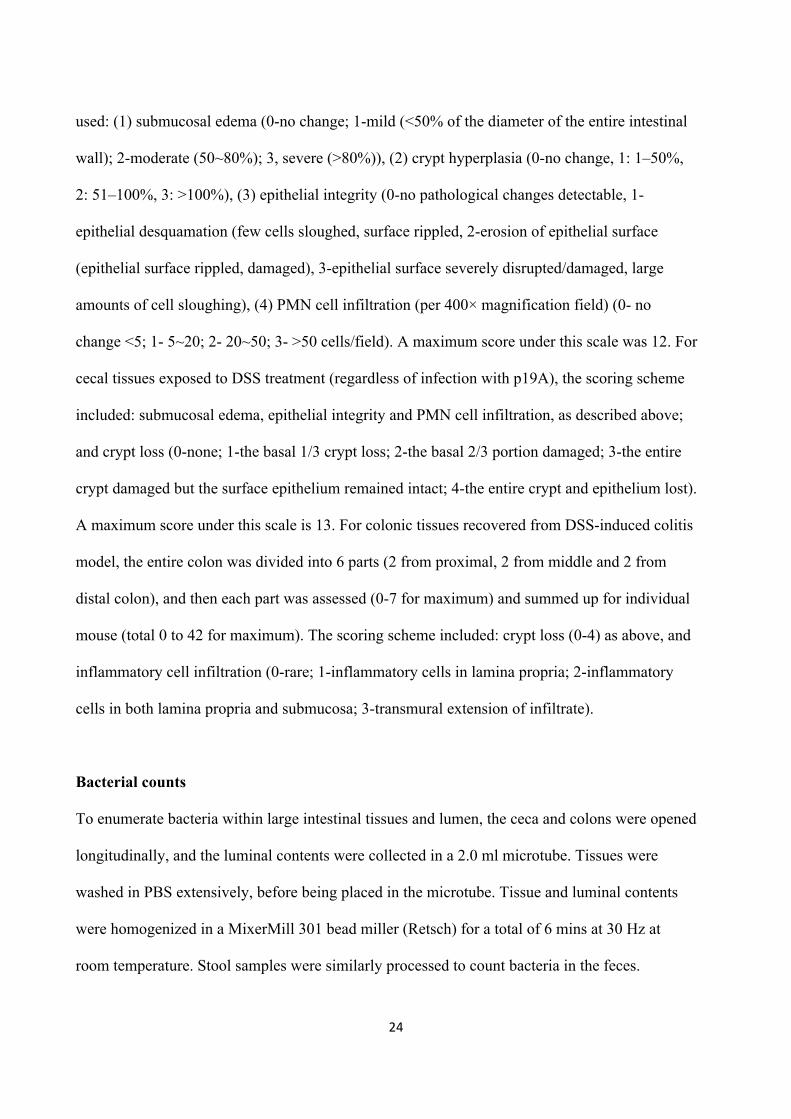
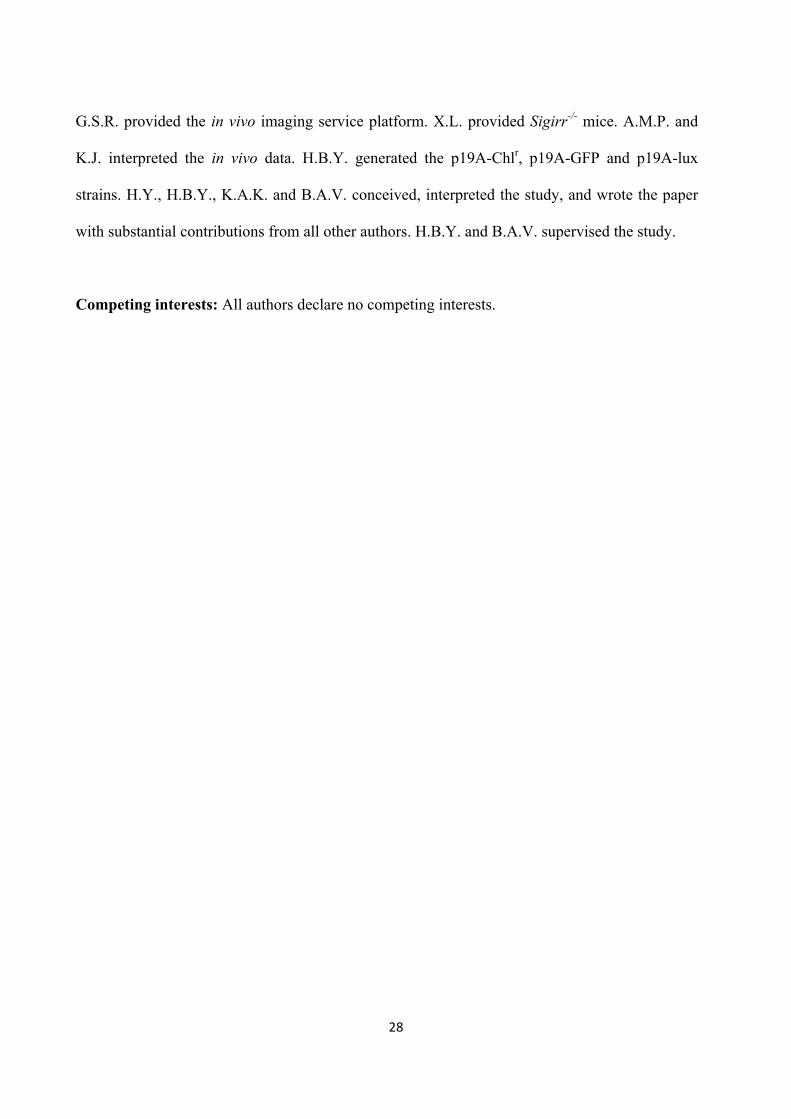
p19A’s potentiating effects on colitis depend on the adhesin FimH.
The ability of p19A to adhere to the intestinal mucosal surface of Sigirr -/- mice suggests that
p19A may express certain adherence factor(s) mediating its interaction with host cells. Indeed,
the genome of p19A (unpublished data) consists of many genes encoding adherence factors,
including pili and fimbriae 32. Of note, p19A contains fimH, a gene encoding a mannose-binding
lectin named FimH. FimH is expressed by many other E. coli strains, including AIEC, and
uropathogenic E. coli (UPEC), mediating their adherence to epithelial cells 33-35. Comparing
amino acid sequences of FimH from different E. coli strains, we found that p19A FimH was
phylogenetically most similar to E. coli K-12 FimH, containing two mutations (V51A and
R190H) (Figure S5). To test whether FimH was a pathogenic factor of p19A, we generated an
isogenic strain of p19A lacking fimH (∆fimH), and infected Sigirr -/- mice as outlined earlier. As
shown in Figures 4A-E, compared to mice receiving wildtype p19A+DSS, ∆fimH+DSS treated
mice showed significantly improved clinical symptoms, losing less body weight, displaying
lower DAI scores, and suffering dramatically less macroscopic and histologic damage in their
ceca and colons. Remarkably, the colitis developed in ∆fimH+DSS treated mice was similar to
that seen in the control DH10B+DSS treated mice. To better understand how the mutation in
fimH attenuates p19A pathogenicity, we compared p19A and ∆fimH burdens in infected mice.
Although ∆fimH and wildtype p19A showed comparable levels of shedding in the stool at 1 dpi,
by 5 dpi (4 days post-DSS), the levels of ∆fimH were dramatically reduced, to 4 logs lower (104
CFU/gram) than those of wildtype p19A (108 CFU/gram) (Figure 4F). Immunostaining of
infected cecal and colonic tissues showed that wildtype p19A was present in both the lumen and
13
on the intestinal epithelial surface, whereas ∆fimH was rarely detected, and only in the intestinal
lumen (Figure 4G). These results suggest that FimH is not only critical for p19A to remain
within the inflamed gut and be shed at high levels in the stool, but the mucosal adherence/lasting
presence of p19A within the inflamed gut is also essential for p19A to aggravate DSS colitis.
FimH antagonists prevent p19A from aggravating DSS-induced colitis.
FimH contains a carbohydrate recognition domain (CRD) that interacts with mannosylated
proteins expressed on the surface of epithelial cells36. FimH antagonists mimicking the natural
ligands of FimH have been developed to saturate this CRD, thus inhibiting the binding of
FimH37, 38. We were therefore interested in determining whether these antagonists would
diminish the ability of p19A to potentiate colitis. Vancomycin treated Sigirr -/- mice were
infected with p19A or DH10B, followed by oral administration of PBS (vehicle control) or
different FimH antagonists (1A-HM and 7CD-HM, 10 mg/kg per mouse)37 at 2 h post-infection,
as well as at days 1, 2 and 3 post-infection. 1A-HM 39and 7CD-HM 40are structural analogues of
heptyl-α-D-mannoside (HM), a nanomolar FimH antagonist. 1A-HM is an optimized monovalent
HM derivative bearing an isopropylamide group while 7CD-HM is an heptavalent
glycoconjugate where the HM ligands are grafted onto a β-cyclodextrin core. At 1 dpi, DSS was
given to these mice as outlined earlier, and they were monitored for another 4 days. As shown in
Figures 5A-E, mice receiving either antagonist showed significantly less weight loss, lower DAI
scores, as well as less macroscopic and microscopic damage, although 7CD-HM appeared to be
more effective than 1A-HM. To determine if these FimH antagonists affected the interaction of
p19A with intestinal epithelial cells, cecal and colonic tissues were opened and washed
extensively, followed by homogenization and plating. The numbers of p19A recovered from
cecal and colonic tissues of antagonist-treated mice were significantly lower than those
14
recovered from vehicle treated mice (Figure 5F), suggesting that p19A were prevented from
adhering to the intestinal mucosa in the presence of antagonists. Thus, FimH antagonists, by
inhibiting the adherence of p19A to the intestinal mucosa, reduced p19A’s ability to aggravate
DSS-induced colitis.
15
Discussion
The aetiology of IBD is complex, and appears to involve the interaction of genetic,
environmental and immunologic factors. Also, luminal bacteria or their products play a critical
role in the instigation and exacerbation of the chronic intestinal inflammation seen in IBD 10, 11,
41, 42. For instance, AIEC is associated with CD, whereas a variety of recently isolated B2
phylogenetic group E. coli strains are associated with UC20, 31. Many in vitro and in vivo models
have been developed to define how AIEC pathogenicity factors and the host response to this
microbe act in concert to potentially contribute to the aetiology of CD. In contrast, the potential
contribution of B2 phylogroup E. coli strains to UC has received less attention, with their
pathogenesis primarily studied in cell culture23. Robust animal models that utilize these UC
associated E. coli strains in a relevant fashion are clearly needed. Here, we found that the
clinically isolated UC pathobiont p19A was able to colonize the intestines of genetically
susceptible mice (Sigirr -/-) following antibiotic treatment. While p19A caused only modest
intestinal inflammation on its own, it was found to adhere to the intestinal mucosal surface and
worsen subsequent DSS-induced colitis. Using this robust animal model, we also characterized
key pathogenicity factors of p19A involved in colitis development.
Our results indicate an increased susceptibility of Sigirr -/- mice (compared to C57BL/6 mice) to
p19A infection following antibiotic treatment. This may not be surprising, considering that this
mouse strain is also more susceptible to many other enteric pathogens, including C. rodentium, S.
Typhimurium and C. jejuni25, 26. Upon infection with these pathogens, Sigirr -/- mice display
exaggerated inflammatory and/or antimicrobial responses that promote their expansion and
colonization in the gut. Sigirr -/- mice infected with p19A also exhibited slightly higher
16
inflammatory responses than WT mice, as well as modest gut inflammation. We reason that
p19A causes only modest inflammation on its own because it does not express the typical
pathogenicity factors used by intestinal bacterial pathogens to induce strong inflammatory
responses, such as a type III secretion system and the capsular polysaccharides expressed by
many Gram-negative bacterial pathogens43, 44. From an evolutionary perspective, lacking the
expression of these factors may benefit p19A, allowing this microbe to survive and thrive within
the GI tract without excessively agitating its host.
Vancomycin pretreatment enabled p19A to heavily colonize the intestines of both C57BL/6 mice
and Sigirr -/- mice, suggesting that the microbial dysbiosis caused by antibiotic treatment created
an environment that favored the expansion of p19A in both mouse strains. Even so,
immunostaining of intestinal tissues showed that p19A was able to adhere to the intestinal
mucosa of Sigirr -/- mice (but not C57BL/6 mice). The basis for this difference is unclear, but
could reflect the greater inflammatory response in p19A+vancomycin treated Sigirr -/- mice (as
compared to C57BL/6 mice). Similar to the report by Winter et al. 45, the heightened
inflammatory tone of Sigirr -/- mice may differentially induce p19A’s virulence factors, allowing
it to colonize the surface of the inflamed gut. It is also possible there are key factors expressed on
the inflamed intestinal mucosa of Sigirr -/- mice that permit p19A binding. For example, AIEC
infection has been shown to up-regulate the expression of the carcinoembryonic antigen related
cell adhesion molecule (CEACAM6) by intestinal epithelial cells, thus facilitating its adherence
to the ileal mucosa of CD patients18. The fact that antibiotic pretreatment alone was sufficient to
increase p19A colonization levels in the gut suggests a potential for p19A to worsen already
existing UC, or exacerbate disease relapses in the clinical setting. Consistent with our findings in
17
animal studies, p19A and other similar E. coli pathobionts are often seen in UC patients with
inactive, as well as active disease20, 31.
While p19A infection alone caused only modest intestinal inflammation in Sigirr -/- mice, it
dramatically potentiated subsequent DSS-induced inflammation. Moreover, p19A numbers
bloomed during DSS-induced intestinal inflammation, as evidenced by the recovery of
significantly higher numbers of p19A from the ceca and colons of p19A+DSS treated mice as
compared to mice not receiving DSS. These data suggest that p19A, or other UC pathobionts
could dwell at low numbers within the gut, but upon the onset of intestinal inflammation
triggered by other noxious stimuli, take advantage of the inflammation and expand to aggravate
disease. Interestingly, the pro-colitic effect of p19A was also seen with another B2 phylogenetic
group E. coli strain termed p7. Whether other UC-associated E. coli strains show similar pro-
colitic effects awaits further investigation.
The ability of p19A to potentiate colitis depends on key pathogenic factors. One of these is α-
hemolysin, a pore forming toxin that can cause cell lysis and induce tissue damage. Notably, α-
hemolysin-expressing E. coli strains are often found in UC biopsies 30, 32. We and others have
shown that many E. coli strains (including p19A), through α-hemolysin production, disrupt tight
junctions and cause focal lesions in cultured epithelial cells 23, 46. Correspondingly, we found that
the ∆hlyI ∆hlyII mutant of p19A lost its ability to potentiate DSS-induced colitis. Using a mouse
model that does not involve DSS treatment, Bucker et al. 30 have also demonstrated that E. coli
α-hemolysin impairs intestinal barrier function, although this is through the induction of focal
lesions in the colonic epithelium. Thus, both mouse models highlight the potential for p19A’s α-
hemolysin to cause tissue damage and/or intensify ongoing inflammation and disease.
18
Previous studies have found that the FimH adhesin aids other E. coli strains in attaching to
epithelial cells and adapting to different environmental conditions 47-49. Building on these
findings, our study identified FimH as an essential pathogenicity factor for p19A. The ∆fimH
mutant (derived from wildtype p19A) failed to colonize the intestinal mucosal surface.
Moreover, mice treated with ∆fimH+DSS showed almost no tissue pathology at 5 dpi. Similar to
our findings, inactivation of fimH in various extraintestinal pathogenic E. coli strains (including
UPEC and AIEC) decreases their colonization in the gut and/or reduces their ability to promote
inflammation34, 50-53. We also saw a remarkable decrease in the fecal shedding of the ∆fimH
mutant from infected Sigirr -/- mice over time. One possible explanation is that the ∆fimH mutant
may be unable to attach to the intestinal mucosal surface, and is flushed out of the intestinal
lumen by the flow of feces, water or mucus. Alternatively, since FimH is important for biofilm
formation in many other bacteria54, 55, the ∆fimH mutant may have been unable to form biofilms
in the gut, and was thus unable to persistently colonize the inflamed intestine. Interestingly,
FimH-mediated adhesion of UPEC to the urothelial surface causes the activation of the nuclear
factor-κB (NF-κB) signalling pathway, leading to the secretion of pro-inflammatory cytokines 56.
In future studies, it will be interesting to determine whether p19A also aggravates DSS-induced
colitis through FimH-dependent activation of NF-κB signalling.
While there are only two point mutations separating the FimH of p19A from that of the
commensal E. coli K-12, we speculate that these mutations are sufficient to mediate p19A’s
ability to adhere to the intestinal mucosal surface of Sigirr -/- mice and worsen their course of
colitis. Supporting this, point mutations in FimH also confer AIEC bacteria a higher ability to
persist and induce intestinal inflammation in genetically susceptible transgenic mice 34.
Therefore, as proposed previously34, analyzing single nucleotide polymorphisms of fimH could
19
potentially predict the pathogenicity of E. coli strains isolated from CD and UC patient biopsies.
To further characterize the role of FimH in p19A pathogenicity, we treated Sigirr -/- mice with
two FimH antagonists, and found that they significantly improved the clinical symptoms induced
by p19A+DSS treatment. The colonization by p19A of the intestinal mucosa was significantly
reduced in mice treated with these antagonists. It is possible that these antagonists are able to
inhibit the interaction of FimH with mannosylated proteins on the intestinal mucosa, but have no
or minimal effect on the ability of p19A to form biofilms in vivo (since the fimbriae structure is
still present). In addition to suppressing the pathogenicity of p19A in our colitis model, FimH
antagonists have been shown to alleviate AIEC induced colitis 37 and deplete UPEC from
infected mice 38. Thus, FimH represents a very promising therapeutic target in the fight against
intestinal infection/inflammation caused by a wide range of E. coli strains, including UC-
associated E. coli strains. The FimH antagonists targeting one type of E. coli could prove broadly
effective, as seen for 1A-HM and 7CD-HM, which also attenuated the pathogenicity of AIEC
LF82 in a different mouse model of colitis 37.
Taken together, we have developed a robust mouse model of colitis through the use of the UC-
associated E. coli p19A. While it is conceivable that similar pathobionts may initiate UC in
susceptible individuals, it appears more likely that they arise in the context of intestinal
inflammation, exacerbating and promoting the chronicity of the disease, as well as potentially
converging with other inflammatory stimuli to promote disease relapse. We further show the pro-
colitic effects of p19A are mediated by at least two key factors - α-hemolysin and FimH.
Selectively inhibiting FimH activity using antagonists prevented p19A from worsening colitic
responses. These findings led us to propose a working model whereby p19A contributes to UC
20
development in genetically susceptible hosts (Figure S6). While p19A is isolated from UC
patients, LF82 is isolated from CD patients. They both belong to the B2 phylogenetic group and
use FimH to potentiate colitis. However, in contrast to p19A, LF82 does not exhibit hemolytic
activity or cause tight junction disruption23. Future work will be needed to address other genetic
similarities and differences between these two pathobionts. Nevertheless, our pre-clinical model
should not only facilitate studying how bacterial-host interactions play a role in the pathogenesis
of UC, but will also significantly advance the development of novel therapeutic strategies that
target UC.
21
Materials and Methods
Bacterial strains
UC-associated E. coli B2 strains p19A and p7, and the ∆hlyI∆hlyII mutant (generated from
p19A) lacking both hemolysin genes, have been described previously20, 23. A p19A-derived
∆fimH mutant was generated by allelic exchange using the gene doctoring technique as
previously described 57. Briefly, primers GDupfimH and GDdwfimH (primer sequences are
summarized in Table 1) were used to amplify a kanamycin cassette from the plasmid pDOC-K.
The GDupfimH primer contains 50 bp of homology to the DNA sequence upstream of fimH and
20 bp of sequence (K-FWD) from pDOC-K. The GDdwfimH primer contains 50 bp of homology
to the sequence of the terminal region of fimH and 18 bp (P-REV) of sequence on pDOC-K. The
amplified kanamycin cassette was cloned into the plasmid pDOC-C, which was subsequently
transformed into p19A carrying the helper plasmid pACBSCE encoding the λ-Red recombinase.
To induce recombination, transformed bacteria were grown in Luria-Bertani (LB) broth
containing 0.5% L-arabinose. Recombinant bacteria were further grown on LB agar containg 50
µg/ml kanamycin and 5% sucrose to select for the ∆fimH mutant. Correct allelic replacement of
the wild type fimH leaving only a 39 bp scar of the fimH gene was verified by PCR. The
functional loss of FimH by the ∆fimH mutant was also confirmed with a yeast agglutination
assay as described by others 58.
Since p19A is susceptible to many different antibiotics, it is difficult to selectively recover it
from p19A-infected tissues. To circumvent this limitation, we inserted a chloramphenicol
resistance marker on the chromosome of wildtype p19A. Briefly, a triple mating involving
wildtype p19A, E. coli MFDλpir containing pMAC5 (a chloramphenicol-marked Tn7 delivery
vector) 59, 60, and E. coli MFDλpir containing a helper plasmid pTNS2 61 was performed on LB
22
agar containing diaminopimelic acid (DAP). Conjugants were selected by plating 24 h
conjugation mixture onto LB agar containing chloramphenicol but lacking DAP, and screened
for the proper Tn7 transposition as before61. The p19A strain carrying the chloramphenicol
resistance marker in the right position of the chromosome was named p19A-Chlr. Using the same
method, we also generated a p19A-lux strain expressing the the Photorhabdus luminescens lux
operon 62, and a p19A-GFP strain expressing GFP on the chromosome of p19A. The lux operon
or gfp was expressed under the control of the promoter PLtetO63, 64. Notably, p19A-Chlr, p19A-
GFP, p19A-lux and the parental strain p19A showed similar potential to potentiate DSS colitis
(data not shown). Note that all bacterial strains were grown from single colonies on LB plates,
and cultured in 5 ml of LB broth without antibiotics, or with chloramphenicol (30 µg/ml),
kanamycin (50 µg/ml), or DAP (0.3 mM) at 37°C overnight with shaking at 200 rpm. The next
day, overnight cultures were subcultured at 1:250 dilution into 5 ml of LB at 37°C at 200 rpm
until the OD600 values reached 0.8~0.85, followed by centrifugation of 1 ml of the cultures at
4000 rpm for 5 min. Culture pellets were resuspended in 1 ml of sterile PBS, and 100 µl of the
suspension was used for oral infection of mice as detailed below.
Mouse infection experiments
The C57BL/6 mice (originally from Charles River Laboratories) and the single immunoglobulin
and toll-interleukin 1 receptor (TIR) domain (Sigirr) -/- mice used in these studies were bred and
maintained under specific pathogen-free conditions at BC Children’s Hospital Research Institute.
All mice were housed in a temperature-controlled (22± 2°C) animal facility with a 12-h light-
dark cycle. Male mice at 6–10 weeks of age were orally gavaged with 0.1 ml of a 50 mg/ml
vancomycin solution suspended in PBS (5 mg per mouse). Six hours later, each mouse was
infected by oral gavage with approximately 7 × 10⁷ CFU of wildtype p19A, p19A-Chlr, p19A-
23
GFP, p19A-lux, ∆hlyI∆hlyII, ∆fimH, or E. coli DH10B. One day after infection, mice were
exposed to 2.5% dextran sulfate sodium (DSS) in their drinking water. For the FimH antagonist
experiment, 1A-HM and 7CD-HM were orally administered in a volume of 0.1 ml of PBS at a
dose of 10 mg/kg, at 2 h, day 1, 2, and 3 post-infection. Disease activity index (DAI) scores were
recorded according to the following criteria (body weight, stool consistency and blood in the
stool): Score 0 - no weight loss, hard stool and no blood detection; Score 1 – less than 10% body
weight loss, hard stool and no blood in the stool; Score 2 – 10 -15% body weight loss, loose stool
and fecal occult blood; Score 3 – 15 - 20% body weight loss, loose stool with gross blood; Score
4 – > 20% body weight loss, diarrhea and rectal bleeding. A maximum score was 12. Mice were
euthanized at day 4 or 5 post-infection, and tissues collected for further analysis.
Ethics statement
All procedures involving the care and handling of the mice were performed according to protocol
number A15-0206, approved by the University of British Columbia's Animal Care Committee
and in direct accordance with the Canadian Council of Animal Care (CCAC) guidelines. Mice
were monitored daily for mortality and morbidity throughout their infection and euthanized if
they showed signs of extreme distress or more than 20% body weight loss.
Histology and pathological scoring
Tissues fixed in 10% formalin were paraffin embedded and cut for further histological analysis.
The paraffin embedded tissue sections were stained with haematoxylin and eosin, photographed,
and then used for pathological scoring. The scoring was done by two blinded observers. The
scoring scheme was slightly different depending on the animal models and tissues used. For
cecal tissues infected with p19A but not treated with DSS, the following scoring scheme was
24
used: (1) submucosal edema (0-no change; 1-mild (<50% of the diameter of the entire intestinal
wall); 2-moderate (50~80%); 3, severe (>80%)), (2) crypt hyperplasia (0-no change, 1: 1–50%,
2: 51–100%, 3: >100%), (3) epithelial integrity (0-no pathological changes detectable, 1-
epithelial desquamation (few cells sloughed, surface rippled, 2-erosion of epithelial surface
(epithelial surface rippled, damaged), 3-epithelial surface severely disrupted/damaged, large
amounts of cell sloughing), (4) PMN cell infiltration (per 400× magnification field) (0- no
change <5; 1- 5~20; 2- 20~50; 3- >50 cells/field). A maximum score under this scale was 12. For
cecal tissues exposed to DSS treatment (regardless of infection with p19A), the scoring scheme
included: submucosal edema, epithelial integrity and PMN cell infiltration, as described above;
and crypt loss (0-none; 1-the basal 1/3 crypt loss; 2-the basal 2/3 portion damaged; 3-the entire
crypt damaged but the surface epithelium remained intact; 4-the entire crypt and epithelium lost).
A maximum score under this scale is 13. For colonic tissues recovered from DSS-induced colitis
model, the entire colon was divided into 6 parts (2 from proximal, 2 from middle and 2 from
distal colon), and then each part was assessed (0-7 for maximum) and summed up for individual
mouse (total 0 to 42 for maximum). The scoring scheme included: crypt loss (0-4) as above, and
inflammatory cell infiltration (0-rare; 1-inflammatory cells in lamina propria; 2-inflammatory
cells in both lamina propria and submucosa; 3-transmural extension of infiltrate).
Bacterial counts
To enumerate bacteria within large intestinal tissues and lumen, the ceca and colons were opened
longitudinally, and the luminal contents were collected in a 2.0 ml microtube. Tissues were
washed in PBS extensively, before being placed in the microtube. Tissue and luminal contents
were homogenized in a MixerMill 301 bead miller (Retsch) for a total of 6 mins at 30 Hz at
room temperature. Stool samples were similarly processed to count bacteria in the feces.
25
Homogenized tissues, luminal contents or fecal samples were plated onto LB agar containing
chloramphenicol (30 µg/ml) for p19A WT strains, or kanamycin (50 µg/ml) for ∆hlyI∆hlyII and
∆fimH mutant strains. After culturing at 37°C overnight, bacterial counts were recorded.
In vivo imaging
In vivo imaging was performed using the Ami-x platform (Spectral Instruments Imaging, AZ).
Greyscale reference images taken under low illumination were collected and overlaid with
images capturing the emission of photons from the lux-expressing p19A-lux using AMIView
software. Live mice were anesthetized and images were taken. Thereafter, the mice were
euthanized, followed by imaging of the intestinal tissues (before and after washing with PBS).
Immunofluorescent staining of intestinal tissues
Following a previously described protocol65, paraffin sections (5 µm) were deparaffinized by
heating at 55–65°C for 10 min, cleared with xylene, rehydrated through an ethanol gradient to
water. Sections were then blocked in blocking buffer (2% donkey serum in PBS containing
0.1% Triton-X100 and 0.05% Tween 20). The primary antibodies used were anti-actin (1:100,
clone I-19, Santa Cruz), anti-GFP (1:100, GeneTex), and anti-O6 LPS of p19A (1:80 E. coli O6
antiserum raised in rabbits, statens serum institute, Demark). Secondary antibodies used were
donkey anti-goat Alexafluor-568 or donkey anti-rabbit Alexafluor-488 (1:2000, Life
Technologies). Tissues were mounted using ProLong Gold Antifade reagent (Molecular
Probes/Invitrogen), and nuclei were counterstained with 4’, 6’-diamidino-2-phenylindole
(DAPI). Sections were viewed at 350, 488, and 594 nm on a Zeiss AxioImager microscope.
Images were obtained using a ZeissAxio Imager microscope equipped with an AxioCam HRm
camera operating through AxioVision software (Version 4.4).
26
Electron microscopy (EM) fixation and imaging. Sigirr -/- mice were pre-infected with p19A
for 1 day, and then exposed to 2.5% DSS in their drinking water. After 2 days of DSS exposure,
cecal and colonic tissues of p19A infected mice were removed and processed. EM studies of
tissue samples and overnight p19A cultures (37°C in LB) were performed as previously
described 66.
Real time qPCR analysis
Total RNA from cecal and colonic tissues was extracted using the Qiagen RNeasy kit following
the manufacturer’s instructions, and quantified using a NanoDrop Spectrophotometer (ND1000).
1 µg of RNA was reverse-transcribed using a Qiagen OmniscriptRT kit (Qiagen), followed by
dilution of the cDNA at 1:5 in RNase/DNasefree H2O. The qPCR was carried out using a Bio-
Rad CFX connect Real-time PCR detection system, with the specificity for each of the PCR
reactions confirmed by melting point analysis. Quantitation was performed using CFX
MaestroTM software (Bio-Rad). The expression of genes was normalized to that of Rplp0. Primer
sequences and reaction conditions for all genes analyzed are summarized in Table 1.
Lipocalin-2 levels in the stool
One or two stool pellets (average weight 40 ± 10 mg) were freshly collected and resuspended at
the concentration of 50 mg/ml in cold PBS containing proteinase inhibitor (Roche). The samples
were homogenized with metal beads in a MixerMill 301 bead miller (Retsch) for 6 minutes at 30
Hz. Homogenized samples were centrifuged at 12,000 rpm, 4°C for 15 minutes. Supernatants
were collected and stored at -80°C until use. To measure stool Lcn-2 levels, mouse lipocalin 2
DuoSet ELISA kit (R&D Systems) were used according to the manufacturer’s instructions.
27
Statistical analysis
The results were analysed using GraphPad Prism 6. Statistical significance was determined using
a two-tailed Student’s t test. Most results presented are expressed as the mean value ± standard
error of the mean (SEM) unless otherwise stated. * p<0.05, ** p<0.01, *** p<0.001, ****
p<0.0001.
Data availability
All data generated and reagents are available from the corresponding author on reasonable
request.
Acknowledgements
This work was supported by grants from Crohn’s and Colitis Canada (CCC) and the Canadian
Institutes of Health Research (CIHR) to B.A.V. B.A.V. is the Children with Intestinal and Liver
Disorders (CH.I.L.D.) Foundation Chair in Pediatric Gastroenterology. K.J. is a Senior Clinician
Scientist supported by the BCHRI Clinician Scientists Award Program, University of British
Columbia, and by the CH.I.L.D. Foundation. H.C.M-L. was supported by the University of
Copenhagen, the Statens Serum Institute, and the Torben and Alice Frimodts Foundation. E.S.B.
was supported by a studentship from BC Children’s Hospital Research Institute (BCHRI).
Author contributions:
H.Y. performed animal experiments and analyzed data with help from H.C.M-L., E.S.B., and
C.M. J.M.A. performed the immunofluorescent staining. C.S. generated the bacterial mutants.
A.S., S.G.G., N.B. synthesized FimH antagonists. W.V. performed the EM study. A.F. and
28
G.S.R. provided the in vivo imaging service platform. X.L. provided Sigirr-/- mice. A.M.P. and
K.J. interpreted the in vivo data. H.B.Y. generated the p19A-Chlr, p19A-GFP and p19A-lux
strains. H.Y., H.B.Y., K.A.K. and B.A.V. conceived, interpreted the study, and wrote the paper
with substantial contributions from all other authors. H.B.Y. and B.A.V. supervised the study.
Competing interests: All authors declare no competing interests.
29
Figure Legends
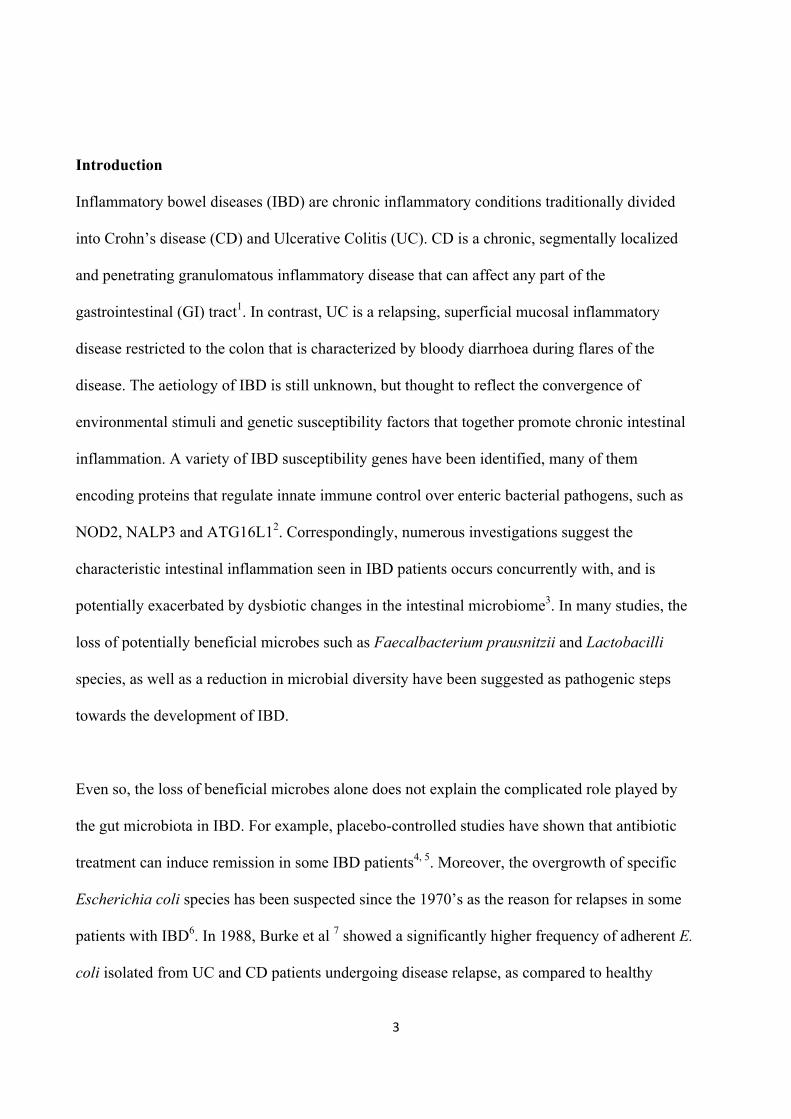
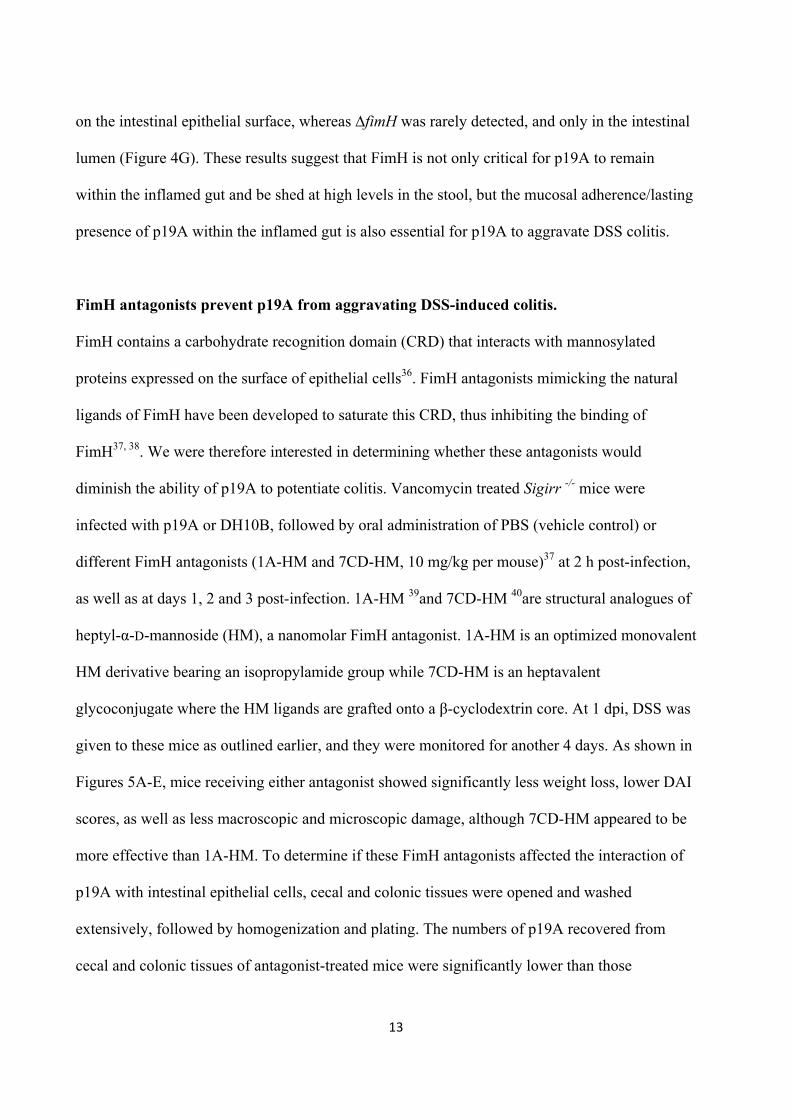
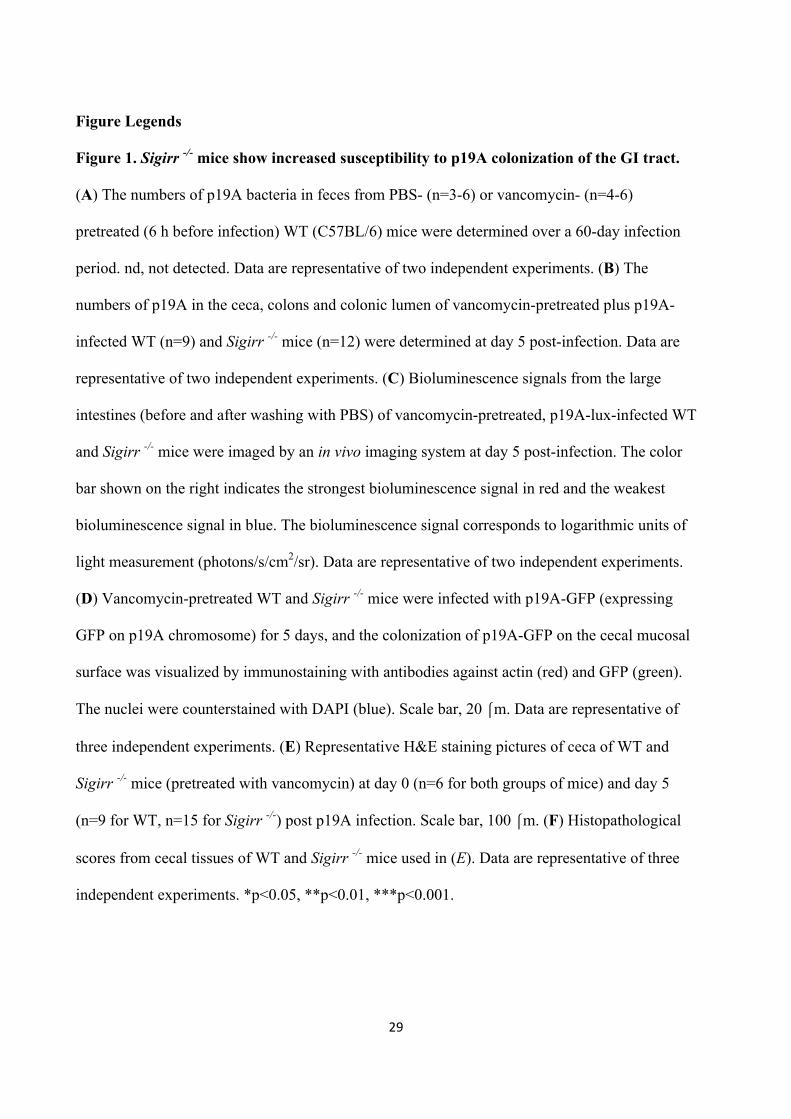
Figure 1. Sigirr -/- mice show increased susceptibility to p19A colonization of the GI tract.
(A) The numbers of p19A bacteria in feces from PBS- (n=3-6) or vancomycin- (n=4-6)
pretreated (6 h before infection) WT (C57BL/6) mice were determined over a 60-day infection
period. nd, not detected. Data are representative of two independent experiments. (B) The
numbers of p19A in the ceca, colons and colonic lumen of vancomycin-pretreated plus p19A-
infected WT (n=9) and Sigirr -/- mice (n=12) were determined at day 5 post-infection. Data are
representative of two independent experiments. (C) Bioluminescence signals from the large
intestines (before and after washing with PBS) of vancomycin-pretreated, p19A-lux-infected WT
and Sigirr -/- mice were imaged by an in vivo imaging system at day 5 post-infection. The color
bar shown on the right indicates the strongest bioluminescence signal in red and the weakest
bioluminescence signal in blue. The bioluminescence signal corresponds to logarithmic units of
light measurement (photons/s/cm2/sr). Data are representative of two independent experiments.
(D) Vancomycin-pretreated WT and Sigirr -/- mice were infected with p19A-GFP (expressing
GFP on p19A chromosome) for 5 days, and the colonization of p19A-GFP on the cecal mucosal
surface was visualized by immunostaining with antibodies against actin (red) and GFP (green).
The nuclei were counterstained with DAPI (blue). Scale bar, 20 ⎧m. Data are representative of
three independent experiments. (E) Representative H&E staining pictures of ceca of WT and
Sigirr -/- mice (pretreated with vancomycin) at day 0 (n=6 for both groups of mice) and day 5
(n=9 for WT, n=15 for Sigirr -/-) post p19A infection. Scale bar, 100 ⎧m. (F) Histopathological
scores from cecal tissues of WT and Sigirr -/- mice used in (E). Data are representative of three
independent experiments. *p<0.05, **p<0.01, ***p<0.001.
30
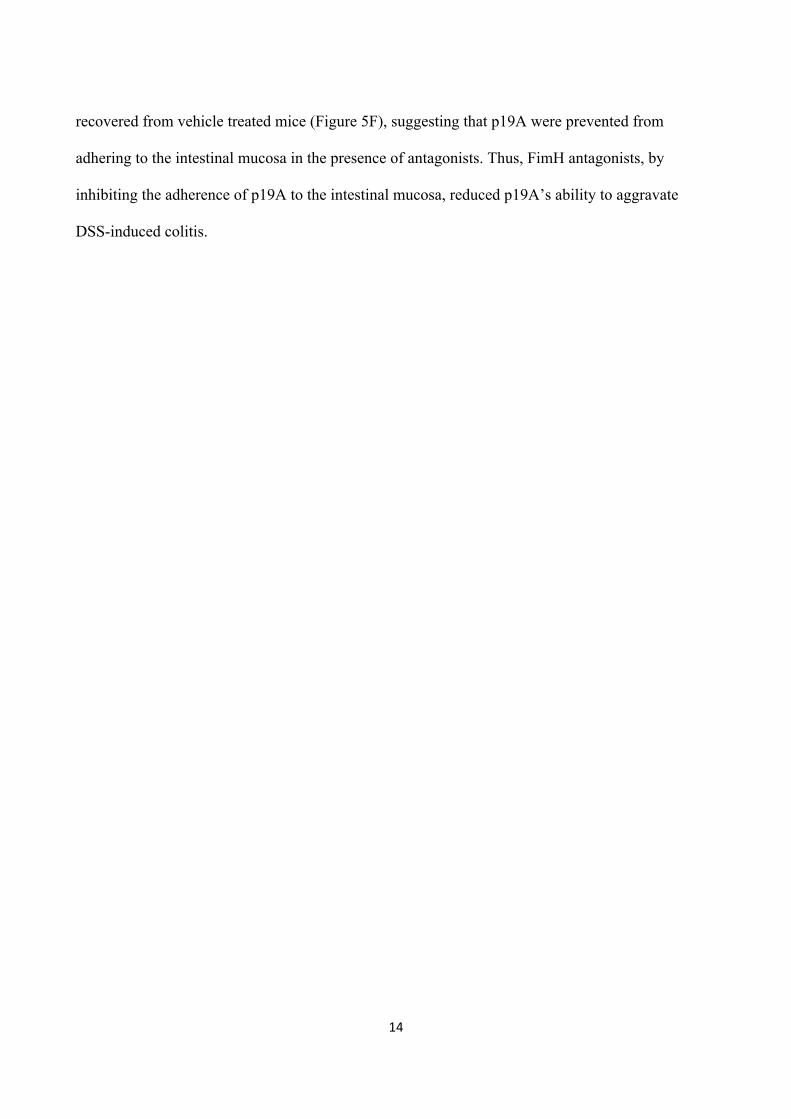
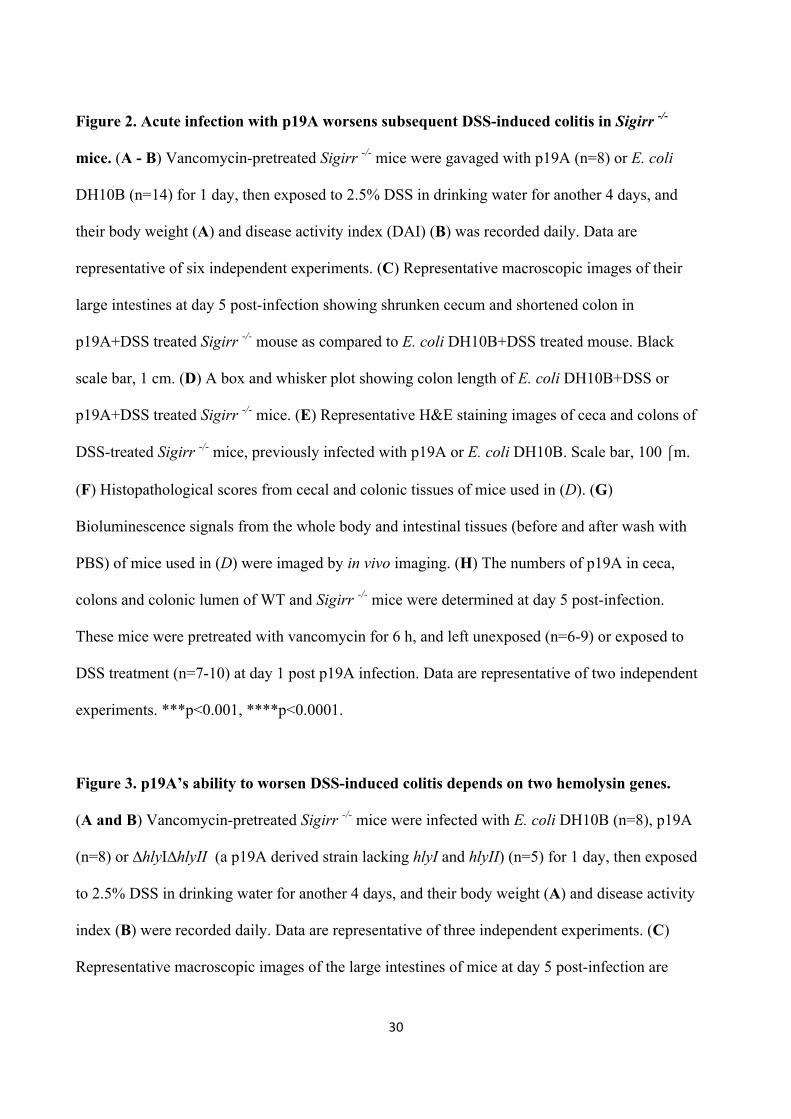
Figure 2. Acute infection with p19A worsens subsequent DSS-induced colitis in Sigirr -/-
mice. (A - B) Vancomycin-pretreated Sigirr -/- mice were gavaged with p19A (n=8) or E. coli
DH10B (n=14) for 1 day, then exposed to 2.5% DSS in drinking water for another 4 days, and
their body weight (A) and disease activity index (DAI) (B) was recorded daily. Data are
representative of six independent experiments. (C) Representative macroscopic images of their
large intestines at day 5 post-infection showing shrunken cecum and shortened colon in
p19A+DSS treated Sigirr -/- mouse as compared to E. coli DH10B+DSS treated mouse. Black
scale bar, 1 cm. (D) A box and whisker plot showing colon length of E. coli DH10B+DSS or
p19A+DSS treated Sigirr -/- mice. (E) Representative H&E staining images of ceca and colons of
DSS-treated Sigirr -/- mice, previously infected with p19A or E. coli DH10B. Scale bar, 100 ⎧m.
(F) Histopathological scores from cecal and colonic tissues of mice used in (D). (G)
Bioluminescence signals from the whole body and intestinal tissues (before and after wash with
PBS) of mice used in (D) were imaged by in vivo imaging. (H) The numbers of p19A in ceca,
colons and colonic lumen of WT and Sigirr -/- mice were determined at day 5 post-infection.
These mice were pretreated with vancomycin for 6 h, and left unexposed (n=6-9) or exposed to
DSS treatment (n=7-10) at day 1 post p19A infection. Data are representative of two independent
experiments. ***p<0.001, ****p<0.0001.
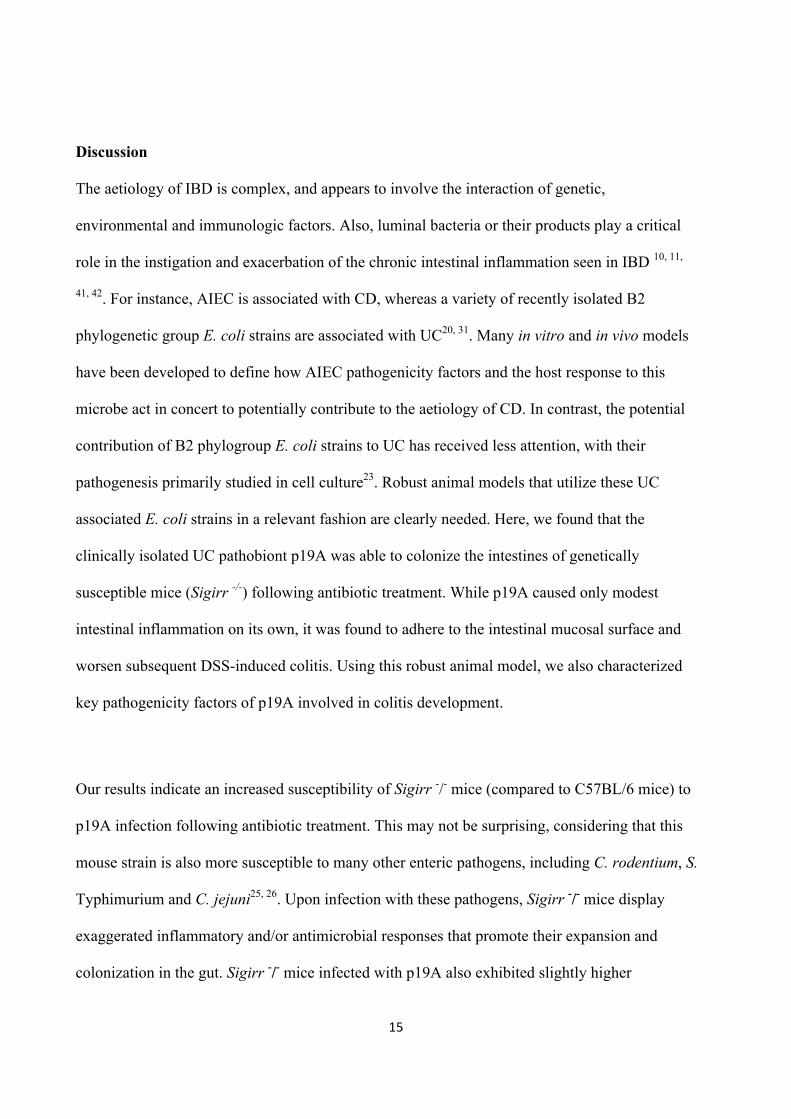
Figure 3. p19A’s ability to worsen DSS-induced colitis depends on two hemolysin genes.
(A and B) Vancomycin-pretreated Sigirr -/- mice were infected with E. coli DH10B (n=8), p19A
(n=8) or ∆hlyI∆hlyII (a p19A derived strain lacking hlyI and hlyII) (n=5) for 1 day, then exposed
to 2.5% DSS in drinking water for another 4 days, and their body weight (A) and disease activity
index (B) were recorded daily. Data are representative of three independent experiments. (C)
Representative macroscopic images of the large intestines of mice at day 5 post-infection are
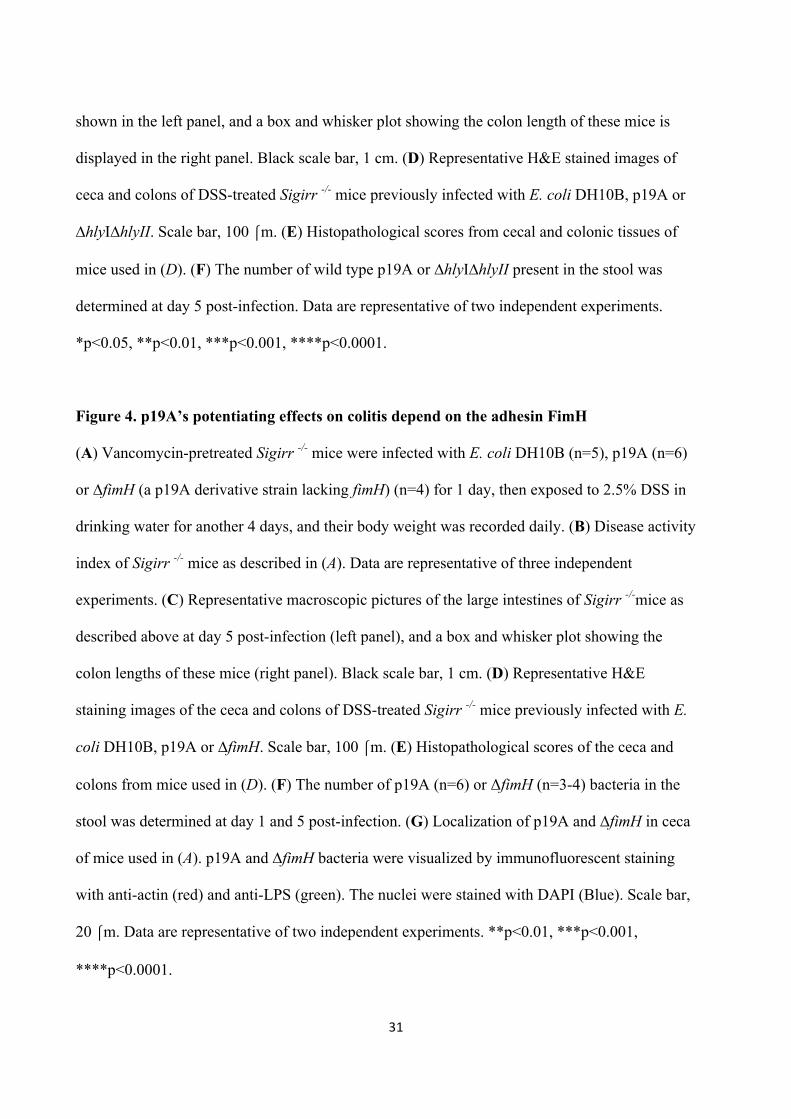
31
shown in the left panel, and a box and whisker plot showing the colon length of these mice is
displayed in the right panel. Black scale bar, 1 cm. (D) Representative H&E stained images of
ceca and colons of DSS-treated Sigirr -/- mice previously infected with E. coli DH10B, p19A or
∆hlyI∆hlyII. Scale bar, 100 ⎧m. (E) Histopathological scores from cecal and colonic tissues of
mice used in (D). (F) The number of wild type p19A or ∆hlyI∆hlyII present in the stool was
determined at day 5 post-infection. Data are representative of two independent experiments.
*p<0.05, **p<0.01, ***p<0.001, ****p<0.0001.
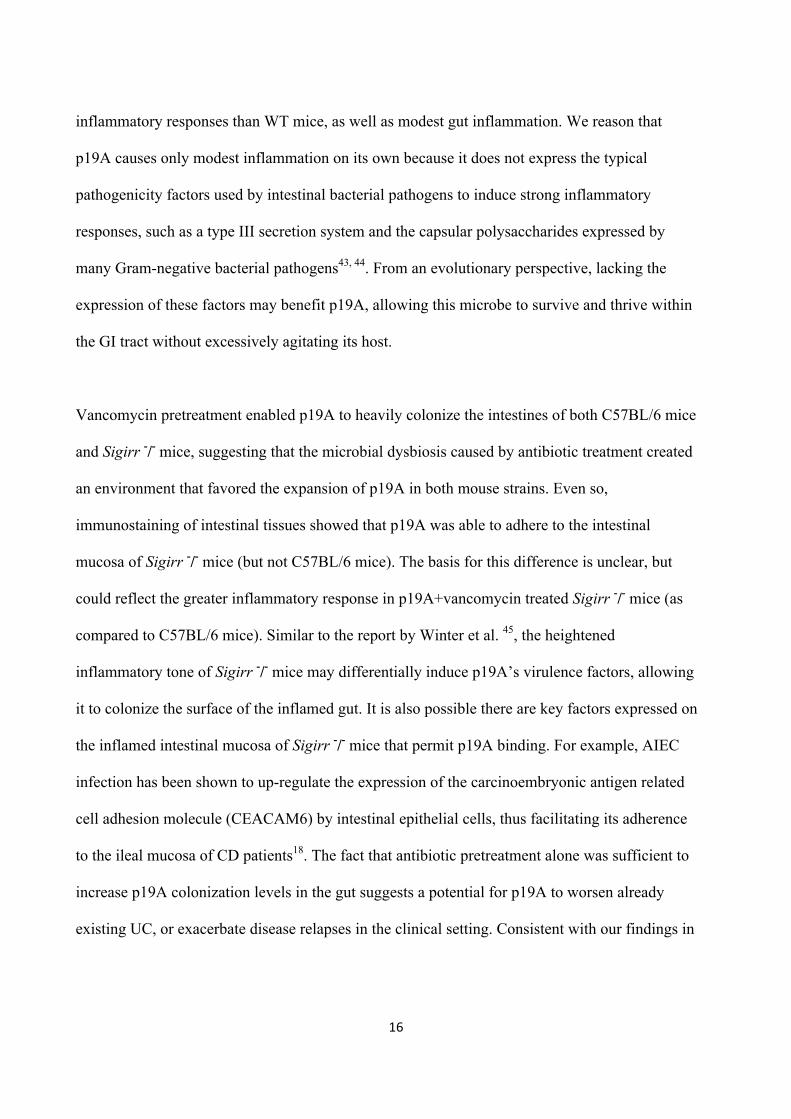
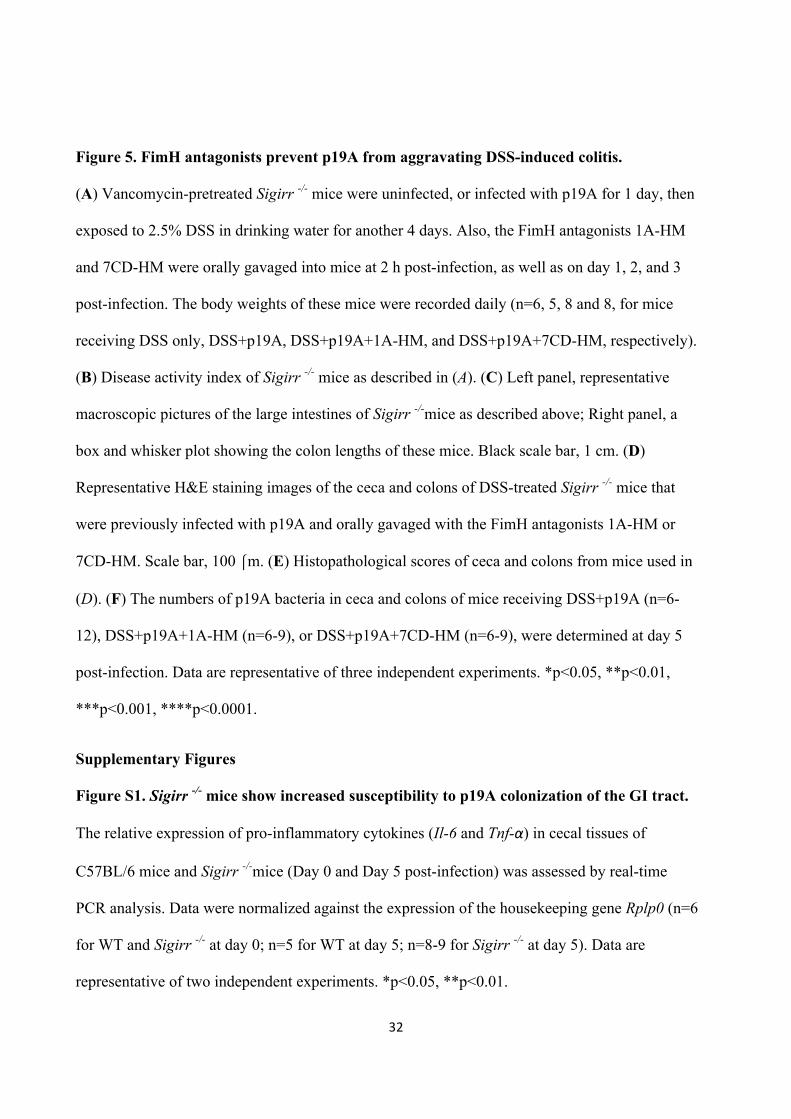
Figure 4. p19A’s potentiating effects on colitis depend on the adhesin FimH
(A) Vancomycin-pretreated Sigirr -/- mice were infected with E. coli DH10B (n=5), p19A (n=6)
or ∆fimH (a p19A derivative strain lacking fimH) (n=4) for 1 day, then exposed to 2.5% DSS in
drinking water for another 4 days, and their body weight was recorded daily. (B) Disease activity
index of Sigirr -/- mice as described in (A). Data are representative of three independent
experiments. (C) Representative macroscopic pictures of the large intestines of Sigirr -/-mice as
described above at day 5 post-infection (left panel), and a box and whisker plot showing the
colon lengths of these mice (right panel). Black scale bar, 1 cm. (D) Representative H&E
staining images of the ceca and colons of DSS-treated Sigirr -/- mice previously infected with E.
coli DH10B, p19A or ∆fimH. Scale bar, 100 ⎧m. (E) Histopathological scores of the ceca and
colons from mice used in (D). (F) The number of p19A (n=6) or ΔfimH (n=3-4) bacteria in the
stool was determined at day 1 and 5 post-infection. (G) Localization of p19A and ∆fimH in ceca
of mice used in (A). p19A and ∆fimH bacteria were visualized by immunofluorescent staining
with anti-actin (red) and anti-LPS (green). The nuclei were stained with DAPI (Blue). Scale bar,
20 ⎧m. Data are representative of two independent experiments. **p<0.01, ***p<0.001,
****p<0.0001.
32
Figure 5. FimH antagonists prevent p19A from aggravating DSS-induced colitis.
(A) Vancomycin-pretreated Sigirr -/- mice were uninfected, or infected with p19A for 1 day, then
exposed to 2.5% DSS in drinking water for another 4 days. Also, the FimH antagonists 1A-HM
and 7CD-HM were orally gavaged into mice at 2 h post-infection, as well as on day 1, 2, and 3
post-infection. The body weights of these mice were recorded daily (n=6, 5, 8 and 8, for mice
receiving DSS only, DSS+p19A, DSS+p19A+1A-HM, and DSS+p19A+7CD-HM, respectively).
(B) Disease activity index of Sigirr -/- mice as described in (A). (C) Left panel, representative
macroscopic pictures of the large intestines of Sigirr -/-mice as described above; Right panel, a
box and whisker plot showing the colon lengths of these mice. Black scale bar, 1 cm. (D)
Representative H&E staining images of the ceca and colons of DSS-treated Sigirr -/- mice that
were previously infected with p19A and orally gavaged with the FimH antagonists 1A-HM or
7CD-HM. Scale bar, 100 ⎧m. (E) Histopathological scores of ceca and colons from mice used in
(D). (F) The numbers of p19A bacteria in ceca and colons of mice receiving DSS+p19A (n=6-
12), DSS+p19A+1A-HM (n=6-9), or DSS+p19A+7CD-HM (n=6-9), were determined at day 5
post-infection. Data are representative of three independent experiments. *p<0.05, **p<0.01,
***p<0.001, ****p<0.0001.
Supplementary Figures
Figure S1. Sigirr -/- mice show increased susceptibility to p19A colonization of the GI tract.
The relative expression of pro-inflammatory cytokines (Il-6 and Tnf-α) in cecal tissues of
C57BL/6 mice and Sigirr -/-mice (Day 0 and Day 5 post-infection) was assessed by real-time
PCR analysis. Data were normalized against the expression of the housekeeping gene Rplp0 (n=6
for WT and Sigirr -/- at day 0; n=5 for WT at day 5; n=8-9 for Sigirr -/- at day 5). Data are
representative of two independent experiments. *p<0.05, **p<0.01.
33
Figure S2. Sigirr -/- mice treated with p19A plus DSS show increased fecal Lcn-2 levels.
Vancomycin-pretreated Sigirr -/- mice were gavaged with p19A or E. coli DH10B (n=8 for both
groups) for 1 day, then exposed to 2.5% DSS in drinking water for another 4 days, and fecal
Lcn-2 levels at 5 dpi were measured by ELISA. **p<0.01.
Figure S3. p19A adheres to the intestinal mucosal surface of Sigirr -/- mice.
(A) Electron micrograph of p19A recovered from overnight cultures (grown in LB). (B) Electron
micrograph of p19A recovered from the colonic lumen of a vancomycin-pretreatd Sigirr -/-
mouse infected with p19A. Electron micrgraph of p19A recovered from the cecum (C) and colon
(D) of Sigirr -/- mice that were treated with vancomycin 6 h before infection, infected with p19A
for 1 day and exposed to 2.5% DSS treatment for another 2 days. Pictures in the right panels of
(C) and (D) correspond to the boxed areas in the left panels of (C) and (D), respectively, which
show that p19A bacteria are in close proximity to the microvilli of intestinal epithelial cells.
Figure S4. The UC-E.coli isolate p7 also aggravates DSS-induced colitis in Sigirr -/- mice.
(A-E) Vancomycin-pretreated Sigirr -/- mice were infected with DH10B (n=7) or p7 (n=7-8)
(another E. coli strain isolated from a UC patient) for 1 day, then exposed to 2.5% DSS in
drinking water for another 3 days, and their body weights (A) and disease activity index (B) were
recorded daily until 4 dpi. (C) Left panel, representative macroscopic images of the large
intestines of mice at 4 dpi; Right panel, a box and whisker plot showing the colon lengths of
these mice at 4 dpi. Black scale bar, 1 cm. (D) Representative H&E staining pictures of ceca and
colons of mice at 4 dpi. Scale bar, 100 ⎧m. (E) Histopathological scores of ceca and colons at 4
dpi. Data are representative of two independent experiments. *p<0.05, **p<0.01, ***p<0.001.
34
Figure S5. Sequence analysis of FimH from different E. coli strains. (A) Alignment of FimH
sequences from AIEC strains LF82 and NRG857c, UPEC CFT073, E. coli K-12 and p19A. (B)
Phylogenetic analysis of FimH sequences from the above bacteria by Vector NTI software
(Thermo Fisher).
Figure S6. A proposed working model illustrating how p19A contributes to UC
development.
(Left panel) In WT mice, orally gavaged p19A remains in the intestinal lumen, and is unable to
attach to intestinal epithelial cells. These mice maintain intestinal homeostasis and do not
develop overt intestinal pathology or inflammation. (Middle panel) In contrast, in genetically
susceptible mice (i.e. Sigirr-/- mice), p19A attaches to the surface of intestinal epithelial cells and
aggravates DSS-induced colitis, and this effect is mediated by at least two key factors - α-
hemolysin and FimH. (Right panel) Selectively inhibiting FimH activity using antagonists
prevents p19A from worsening DSS-induced colitic responses. This figure is created with
Biorender.com.
35
REFERENCES1. MulderDJ,NobleAJ,JustinichCJ,DuffinJM.Ataleoftwodiseases:thehistoryofinflammatoryboweldisease.JCrohnsColitis2014;8:341-8.2. DavisBK,PhilipsonC,HontecillasR,EdenK,Bassaganya-RieraJ,AllenIC.EmergingsignificanceofNLRsininflammatoryboweldisease.InflammBowelDis2014;20:2412-32.3. deSouzaHS,FiocchiC.ImmunopathogenesisofIBD:currentstateoftheart.NatRevGastroenterolHepatol2016;13:13-27.4. SartorRB.Therapeuticmanipulationoftheentericmicrofloraininflammatoryboweldiseases:antibiotics,probiotics,andprebiotics.Gastroenterology2004;126:1620-33.5. FellerM,HuwilerK,SchoepferA,ShangA,FurrerH,EggerM.Long-termantibiotictreatmentforCrohn'sdisease:systematicreviewandmeta-analysisofplacebo-controlledtrials.ClinInfectDis2010;50:473-80.6. KeighleyMR,ArabiY,DimockF,BurdonDW,AllanRN,Alexander-WilliamsJ.Influenceofinflammatoryboweldiseaseonintestinalmicroflora.Gut1978;19:1099-104.7. BurkeDA,AxonAT.AdhesiveEscherichiacoliininflammatoryboweldiseaseandinfectivediarrhoea.BMJ1988;297:102-4.8. IlnyckyjA,GreenbergH,BernsteinCN.EscherichiacoliO157:H7infectionmimickingCrohn'sdisease.Gastroenterology1997;112:995-9.9. GiafferMH,HoldsworthCD,DuerdenBI.VirulencepropertiesofEscherichiacolistrainsisolatedfrompatientswithinflammatoryboweldisease.Gut1992;33:646-50.10. Mirsepasi-LauridsenHC,VallanceBA,KrogfeltKA,PetersenAM.EscherichiacoliPathobiontsAssociatedwithInflammatoryBowelDisease.ClinMicrobiolRev2019;32.11. SmallCL,Reid-YuSA,McPheeJB,CoombesBK.PersistentinfectionwithCrohn'sdisease-associatedadherent-invasiveEscherichiacolileadstochronicinflammationandintestinalfibrosis.NatCommun2013;4:1957.12. DelaFuenteM,FranchiL,ArayaD,Diaz-JimenezD,OlivaresM,Alvarez-LobosM,etal.EscherichiacoliisolatesfrominflammatoryboweldiseasespatientssurviveinmacrophagesandactivateNLRP3inflammasome.IntJMedMicrobiol2014;304:384-92.13. ChassaingB,RolhionN,deValleeA,SalimSY,Prorok-HamonM,NeutC,etal.Crohndisease--associatedadherent-invasiveE.colibacteriatargetmouseandhumanPeyer'spatchesvialongpolarfimbriae.JClinInvest2011;121:966-75.14. PalmelaC,ChevarinC,XuZ,TorresJ,SevrinG,HirtenR,etal.Adherent-invasiveEscherichiacoliininflammatoryboweldisease.Gut2017.15. GlasserAL,BoudeauJ,BarnichN,PerruchotMH,ColombelJF,Darfeuille-MichaudA.AdherentinvasiveEscherichiacolistrainsfrompatientswithCrohn'sdiseasesurviveandreplicatewithinmacrophageswithoutinducinghostcelldeath.InfectImmun2001;69:5529-37.16. BoudeauJ,GlasserAL,MasseretE,JolyB,Darfeuille-MichaudA.InvasiveabilityofanEscherichiacolistrainisolatedfromtheilealmucosaofapatientwithCrohn'sdisease.InfectImmun1999;67:4499-509.17. CarvalhoFA,BarnichN,SivignonA,DarchaC,ChanCH,StannersCP,etal.Crohn'sdiseaseadherent-invasiveEscherichiacolicolonizeandinducestronggutinflammationintransgenicmiceexpressinghumanCEACAM.JExpMed2009;206:2179-89.18. BarnichN,CarvalhoFA,GlasserAL,DarchaC,JantscheffP,AllezM,etal.CEACAM6actsasareceptorforadherent-invasiveE.coli,supportingilealmucosacolonizationinCrohndisease.JClinInvest2007;117:1566-74.
36
19. SchultszC,MoussaM,vanKetelR,TytgatGN,DankertJ.FrequencyofpathogenicandenteroadherentEscherichiacoliinpatientswithinflammatoryboweldiseaseandcontrols.JClinPathol1997;50:573-9.20. PetersenAM,NielsenEM,LitrupE,BrynskovJ,MirsepasiH,KrogfeltKA.AphylogeneticgroupofEscherichiacoliassociatedwithactiveleft-sidedinflammatoryboweldisease.BMCMicrobiol2009;9:171.21. KotlowskiR,BernsteinCN,SepehriS,KrauseDO.HighprevalenceofEscherichiacolibelongingtotheB2+Dphylogeneticgroupininflammatoryboweldisease.Gut2007;56:669-75.22. JensenSR,Mirsepasi-LauridsenHC,ThysenAH,BrynskovJ,KrogfeltKA,PetersenAM,etal.DistinctinflammatoryandcytopathiccharacteristicsofEscherichiacoliisolatesfrominflammatoryboweldiseasepatients.IntJMedMicrobiol2015;305:925-36.23. Mirsepasi-LauridsenHC,DuZ,StruveC,CharbonG,KarczewskiJ,KrogfeltKA,etal.SecretionofAlpha-HemolysinbyEscherichiacoliDisruptsTightJunctionsinUlcerativeColitisPatients.ClinTranslGastroenterol2016;7:e149.24. XiaoH,GulenMF,QinJ,YaoJ,BulekK,KishD,etal.TheToll-interleukin-1receptormemberSIGIRRregulatescolonicepithelialhomeostasis,inflammation,andtumorigenesis.Immunity2007;26:461-75.25. ShamHP,YuEY,GulenMF,BhinderG,StahlM,ChanJM,etal.SIGIRR,anegativeregulatorofTLR/IL-1RsignallingpromotesMicrobiotadependentresistancetocolonizationbyentericbacterialpathogens.PLoSPathog2013;9:e1003539.26. StahlM,RiesJ,VermeulenJ,YangH,ShamHP,CrowleySM,etal.AnovelmousemodelofCampylobacterjejunigastroenteritisrevealskeypro-inflammatoryandtissueprotectiverolesforToll-likereceptorsignalingduringinfection.PLoSPathog2014;10:e1004264.27. LauridsenHC,YangH,BosmanE,YuH,WuX,MaC,etal.UlcerativeColitis-AssociatedEscherichiacoliColonizetheIleumandCecumofInfectedMicebyAdheringtotheIntestinalEpithelium.Gastroenterology2015;148:Supplement1,S-712.28. KieslerP,FussIJ,StroberW.ExperimentalModelsofInflammatoryBowelDiseases.CellMolGastroenterolHepatol2015;1:154-70.29. ChassaingB,SrinivasanG,DelgadoMA,YoungAN,GewirtzAT,Vijay-KumarM.Fecallipocalin2,asensitiveandbroadlydynamicnon-invasivebiomarkerforintestinalinflammation.PLoSOne2012;7:e44328.30. BuckerR,SchulzE,GunzelD,BojarskiC,LeeIF,JohnLJ,etal.alpha-HaemolysinofEscherichiacoliinIBD:apotentiatorofinflammatoryactivityinthecolon.Gut2014;63:1893-901.31. Mirsepasi-LauridsenHC,HalkjaerSI,MortensenEM,LydolphMC,Nordgaard-LassenI,KrogfeltKA,etal.ExtraintestinalpathogenicEscherichiacoliareassociatedwithintestinalinflammationinpatientswithulcerativecolitis.SciRep2016;6:31152.32. VejborgRM,HancockV,PetersenAM,KrogfeltKA,KlemmP.ComparativegenomicsofEscherichiacoliisolatedfrompatientswithinflammatoryboweldisease.BMCGenomics2011;12:316.33. MysorekarIU,MulveyMA,HultgrenSJ,GordonJI.MolecularregulationofurothelialrenewalandhostdefensesduringinfectionwithuropathogenicEscherichiacoli.JBiolChem2002;277:7412-9.34. DreuxN,DenizotJ,Martinez-MedinaM,MellmannA,BilligM,KisielaD,etal.PointmutationsinFimHadhesinofCrohn'sdisease-associatedadherent-invasiveEscherichiacolienhanceintestinalinflammatoryresponse.PLoSPathog2013;9:e1003141.35. BoudeauJ,BarnichN,Darfeuille-MichaudA.Type1pili-mediatedadherenceofEscherichiacolistrainLF82isolatedfromCrohn'sdiseaseisinvolvedinbacterialinvasionofintestinalepithelialcells.MolMicrobiol2001;39:1272-84.36. SivignonA,BouckaertJ,BernardJ,GouinSG,BarnichN.ThepotentialofFimHasanoveltherapeutictargetforthetreatmentofCrohn'sdisease.ExpertOpinTherTargets2017;21:837-47.
37
37. SivignonA,YanX,AlvarezDortaD,BonnetR,BouckaertJ,FleuryE,etal.DevelopmentofHeptylmannoside-BasedGlycoconjugateAntiadhesiveCompoundsagainstAdherent-InvasiveEscherichiacoliBacteriaAssociatedwithCrohn'sDisease.MBio2015;6:e01298-15.38. SpauldingCN,KleinRD,RuerS,KauAL,SchreiberHL,CusumanoZT,etal.SelectivedepletionofuropathogenicE.colifromthegutbyaFimHantagonist.Nature2017;546:528-32.39. AlvarezDortaD,SivignonA,ChalopinT,DumychTI,RoosG,BilyyRO,etal.TheAntiadhesiveStrategyinCrohn'sDisease:OrallyActiveMannosidestoDecolonizePathogenicEscherichiacolifromtheGut.Chembiochem2016;17:936-52.40. BouckaertJ,LiZ,XavierC,AlmantM,CaveliersV,LahoutteT,etal.Heptylalpha-D-mannosidesgraftedonabeta-cyclodextrincoretointerferewithEscherichiacoliadhesion:aninvivomultivalenteffect.Chemistry2013;19:7847-55.41. CarvalhoFA,KorenO,GoodrichJK,JohanssonME,NalbantogluI,AitkenJD,etal.TransientinabilitytomanageproteobacteriapromoteschronicgutinflammationinTLR5-deficientmice.CellHostMicrobe2012;12:139-52.42. ChassaingB,KorenO,CarvalhoFA,LeyRE,GewirtzAT.AIECpathobiontinstigateschroniccolitisinsusceptiblehostsbyalteringmicrobiotacomposition.Gut2014;63:1069-80.43. RobertsIS.Thebiochemistryandgeneticsofcapsularpolysaccharideproductioninbacteria.AnnuRevMicrobiol1996;50:285-315.44. GalanJE,Lara-TejeroM,MarlovitsTC,WagnerS.BacterialtypeIIIsecretionsystems:specializednanomachinesforproteindeliveryintotargetcells.AnnuRevMicrobiol2014;68:415-38.45. WinterSE,WinterMG,XavierMN,ThiennimitrP,PoonV,KeestraAM,etal.Host-derivednitrateboostsgrowthofE.coliintheinflamedgut.Science2013;339:708-11.46. TroegerH,RichterJF,BeutinL,GunzelD,DobrindtU,EppleHJ,etal.Escherichiacolialpha-haemolysininducesfocalleaksincolonicepithelium:anovelmechanismofbacterialtranslocation.CellMicrobiol2007;9:2530-40.47. KrogfeltKA,BergmansH,KlemmP.DirectevidencethattheFimHproteinisthemannose-specificadhesinofEscherichiacolitype1fimbriae.InfectImmun1990;58:1995-8.48. OfekI,MirelmanD,SharonN.AdherenceofEscherichiacolitohumanmucosalcellsmediatedbymannosereceptors.Nature1977;265:623-5.49. SokurenkoEV,ChesnokovaV,DykhuizenDE,OfekI,WuXR,KrogfeltKA,etal.PathogenicadaptationofEscherichiacolibynaturalvariationoftheFimHadhesin.ProcNatlAcadSciUSA1998;95:8922-6.50. PooleNM,GreenSI,RajanA,VelaLE,ZengXL,EstesMK,etal.RoleforFimHinExtraintestinalPathogenicEscherichiacoliInvasionandTranslocationthroughtheIntestinalEpithelium.InfectImmun2017;85.51. SchillingJD,MulveyMA,HultgrenSJ.StructureandfunctionofEscherichiacolitype1pili:newinsightintothepathogenesisofurinarytractinfections.JInfectDis2001;183Suppl1:S36-40.52. RussellCW,FlemingBA,JostCA,TranA,StenquistAT,WambaughMA,etal.Context-DependentRequirementsforFimHandOtherCanonicalVirulenceFactorsinGutColonizationbyExtraintestinalPathogenicEscherichiacoli.InfectImmun2018;86.53. KalasV,HibbingME,MaddiralaAR,ChuganiR,PinknerJS,Mydock-McGraneLK,etal.Structure-baseddiscoveryofglycomimeticFmlHligandsasinhibitorsofbacterialadhesionduringurinarytractinfection.ProcNatlAcadSciUSA2018;115:E2819-E28.54. DwyerBE,NewtonKL,KisielaD,SokurenkoEV,CleggS.SinglenucleotidepolypmorphismsoffimHassociatedwithadherenceandbiofilmformationbyserovarsofSalmonellaenterica.Microbiology2011;157:3162-71.55. SchembriMA,KlemmP.Biofilmformationinahydrodynamicenvironmentbynovelfimhvariantsandramificationsforvirulence.InfectImmun2001;69:1322-8.56. LiuY,MemetS,SabanR,KongX,AprikianP,SokurenkoE,etal.Dualligand/receptorinteractionsactivateurothelialdefensesagainsturopathogenicE.coli.SciRep2015;5:16234.
38
57. LeeDJ,BingleLE,HeurlierK,PallenMJ,PennCW,BusbySJ,etal.Genedoctoring:amethodforrecombineeringinlaboratoryandpathogenicEscherichiacolistrains.BMCMicrobiol2009;9:252.58. SchembriMA,ChristiansenG,KlemmP.FimH-mediatedautoaggregationofEscherichiacoli.MolMicrobiol2001;41:1419-30.59. ShamHP,ShamesSR,CroxenMA,MaC,ChanJM,KhanMA,etal.AttachingandeffacingbacterialeffectorNleCsuppressesepithelialinflammatoryresponsesbyinhibitingNF-kappaBandp38mitogen-activatedproteinkinaseactivation.InfectImmun2011;79:3552-62.60. FerrieresL,HemeryG,NhamT,GueroutAM,MazelD,BeloinC,etal.Silentmischief:bacteriophageMuinsertionscontaminateproductsofEscherichiacolirandommutagenesisperformedusingsuicidaltransposondeliveryplasmidsmobilizedbybroad-host-rangeRP4conjugativemachinery.JBacteriol2010;192:6418-27.61. ChoiKH,GaynorJB,WhiteKG,LopezC,BosioCM,Karkhoff-SchweizerRR,etal.ATn7-basedbroad-rangebacterialcloningandexpressionsystem.NatMethods2005;2:443-8.62. RobinsonGM,TonksKM,ThornRM,ReynoldsDM.Applicationofbacterialbioluminescencetoassesstheefficacyoffast-actingbiocides.AntimicrobAgentsChemother2011;55:5214-20.63. LutzR,BujardH.IndependentandtightregulationoftranscriptionalunitsinEscherichiacoliviatheLacR/O,theTetR/OandAraC/I1-I2regulatoryelements.NucleicAcidsRes1997;25:1203-10.64. YuHB,CroxenMA,MarchiandoAM,FerreiraRB,CadwellK,FosterLJ,etal.AutophagyfacilitatesSalmonellareplicationinHeLacells.MBio2014;5:e00865-14.65. BergstromKS,Kissoon-SinghV,GibsonDL,MaC,MonteroM,ShamHP,etal.Muc2protectsagainstlethalinfectiouscolitisbydisassociatingpathogenicandcommensalbacteriafromthecolonicmucosa.PLoSPathog2010;6:e1000902.66. StahlM,TremblayS,MonteroM,VoglW,XiaL,JacobsonK,etal.TheMuc2mucincoatsmurinePanethcellgranulesandfacilitatestheircontentreleaseanddispersion.AmJPhysiolGastrointestLiverPhysiol2018;315:G195-G205.
A B
Figure 1
C D
(dpi)1 5 7 14 21 30 60nd
2
4
6
8
10
PBSVancomycin
Log 10
(CFU
p19
A/gr
am o
f sto
ol)
Log 10
(CFU
p19
A/gr
am)
WT
Sigirr-/-
5
6
7
8
9
10
cecum colon lumen
**
***
***
WT
Sigirr-/-
DAPI + p19A + Actin
Edem
aH
yper
plas
iaEp
ithel
ial in
tegr
ity
PM
N
0
2
4
6
His
tolo
gy s
core
*
F
WT
Sigi
rr-/-
Day 0 Day 5E
WT
WT
Sigi
rr-/-
Sigi
rr-/-
Day 0 Day 5
WT
Sigi
rr-/- ph
oton
s/se
c/cm
2 /sr
phot
ons/
sec/
cm2 /s
r
Before wash After wash
cecum
****
***
*
A
E
Figure 2
B
F
0 1 2 3 4 580
85
90
95
100
105
% o
f ini
tial b
ody
wei
ght
CDH10B+DSSp19A+DSS
0 1 2 3 4 5012345678
4
5
6
7
DA
I sco
re
D
DH10B+DSSp19A+DSS
colo
n le
ngth
(cm
)
(dpi) (dpi)
****
****
DH10B+DSS
p19A+DSS
DH
10B
+DSS
p19A
+DSS
***DH
10B+
DSS
p19A
+DSS
cecum colon
0
2
4
6
8
0
10
20
30
His
tolo
gy s
core
EdemaCrypt lossEpithelial integrity PMN
****
****
DH10B+DSS
p19A+DSS DH10B
+DSSp19A+DSS
His
tolo
gy s
core
G Before wash After wash
p19A
+ D
SSp1
9A o
nly
H
4
6
8
10
Log 10
(CFU
/gra
m)
p19A only
p19A + DSS
**** ****
phot
ons/
sec/
cm2 /s
r
phot
ons/
sec/
cm2 /s
r
phot
ons/
sec/
cm2 /s
r
cecum colon lumen
cecum colon
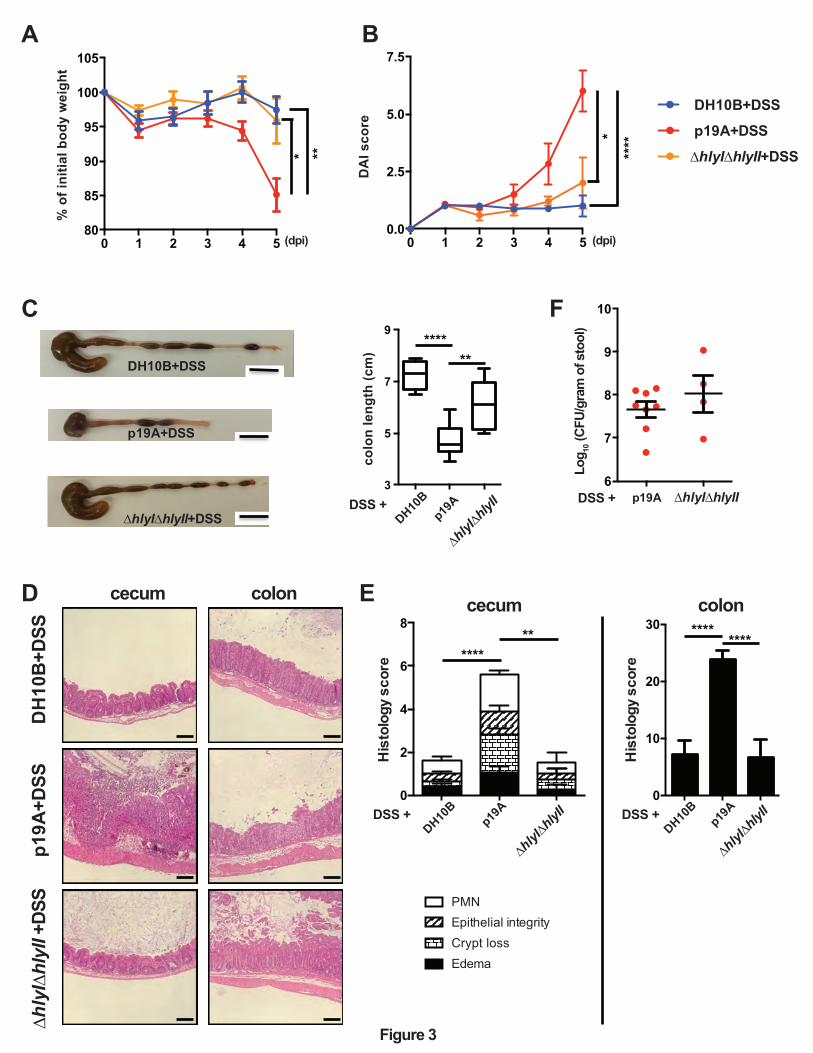
Figure 3
0 1 2 3 4 580
85
90
95
100
105
DH10B+DSS
p19A+DSS
∆hlyI∆hlyII+DSS
0 1 2 3 4 50.0
2.5
5.0
7.5
(dpi)(dpi)
% o
f ini
tial b
ody
wei
ght
DA
I sco
re
* **
* **
**
A B
DH10B+DSS
p19A+DSS
∆hlyI∆hlyII+DSS
cecum colon
DH
10B
+DSS
p1
9A+D
SS∆h
lyI∆
hlyI
I +DS
S
C
D
3
5
7
9
colo
n le
ngth
(cm
)
DH10B
p19A
∆hlyI∆h
lyII
**** **
DSS +
6
7
8
9
10
Log 10
(CFU
/gra
m o
f sto
ol)
p19A ∆hlyI∆hlyII DSS +
F
0
2
4
6
8
0
10
20
30
His
tolo
gy s
core
His
tolo
gy s
core
DH10B
p19A
∆hlyI∆h
lyII DSS +
DH10B
p19A
∆hlyI∆h
lyII DSS +
EdemaCrypt lossEpithelial integrity PMN
**** ** ****
****
E cecum colon
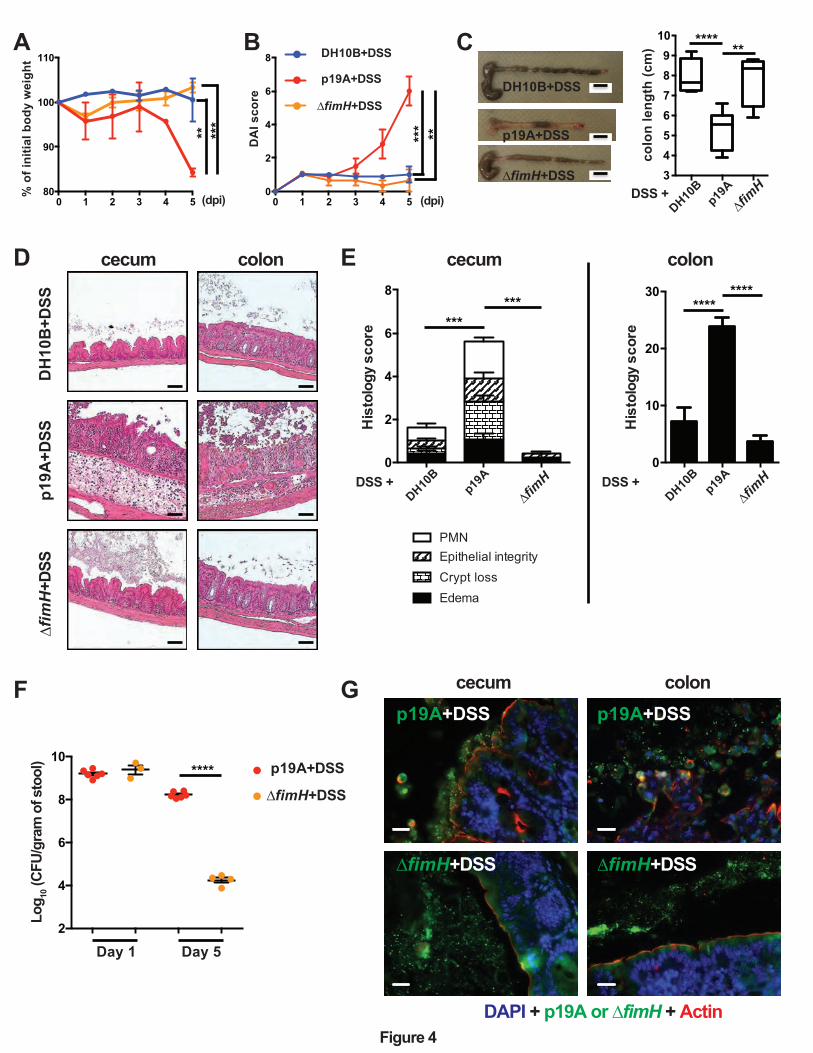
Figure 4
0 1 2 3 4 580
90
100
110
0 1 2 3 4 50
2
4
6
8 DH10B+DSS
p19A+DSS
∆fimH+DSS
% o
f ini
tial b
ody
wei
ght
DA
I sco
re
***
** ** ***
(dpi) (dpi)
A BDH10B+DSS
p19A+DSS
∆fimH+DSS
C
3456789
10
DH10B
p19A∆fi
mH DSS +
**** **
colo
n le
ngth
(cm
)
cecum colon
DH
10B
+DSS
p1
9A+D
SS∆f
imH
+DSS
D
cecum colonp19A+DSS
∆fimH+DSS
DAPI + p19A or ∆fimH + Actin
p19A+DSS
∆fimH+DSS
0
2
4
6
8
0
10
20
30
His
tolo
gy s
core
His
tolo
gy s
core
EdemaCrypt lossEpithelial integrity PMN
DH10B
p19A
∆fimH
DSS + DH10
Bp19
A
∆fimH
DSS +
*** *** ****
****
E cecum colon
G
2
4
6
8
10
Log 10
(CFU
/gra
m o
f sto
ol) p19A+DSS
∆fimH+DSS
Day 1 Day 5
****
F
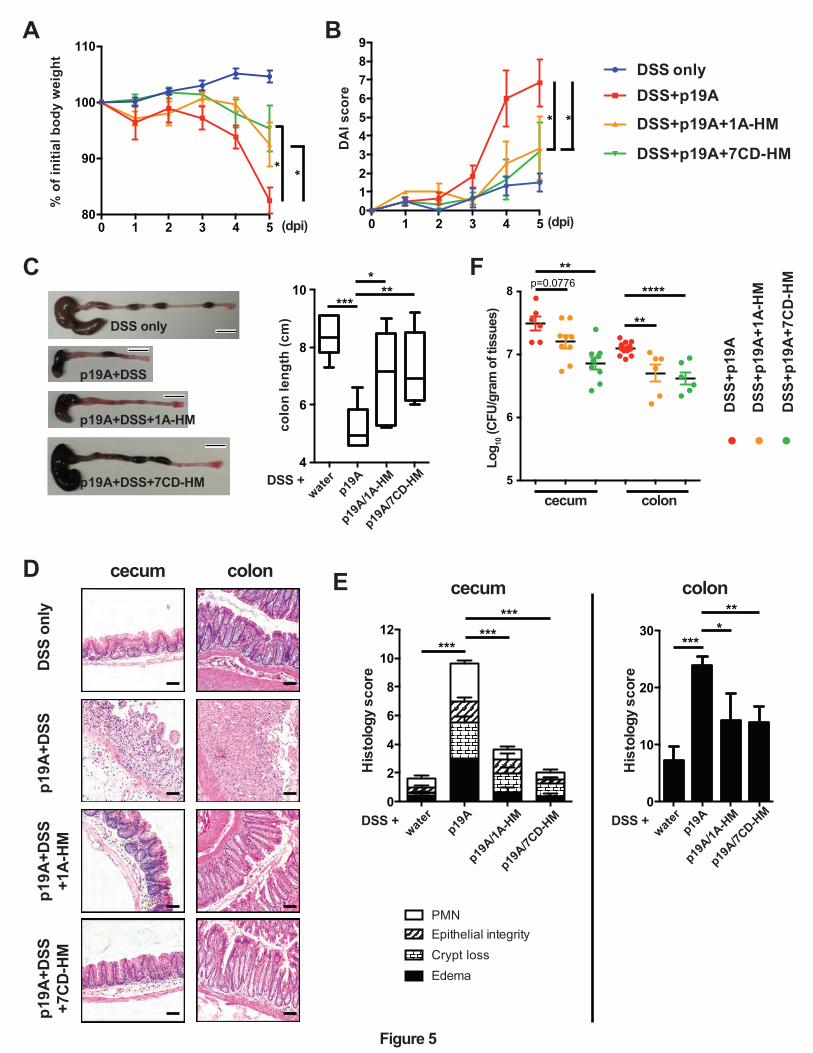
Figure 5
0 1 2 3 4 580
90
100
110
0 1 2 3 4 50123456789
DSS onlyDSS+p19A
DSS+p19A+1A-HM
DSS+p19A+7CD-HM
(dpi)
% o
f ini
tial b
ody
wei
ght
DA
I sco
reDSS only
p19A+DSS
p19A+DSS+1A-HM
p19A+DSS+7CD-HM
cecum colon
p19A
+DSS
DSS
onl
yp1
9A+D
SS+1
A-H
Mp1
9A+D
SS+7
CD
-HM
A B
C
D E
*
(dpi)
* *
4
6
8
10
water
p19ADSS +
colo
n le
ngth
(cm
)
p19A/1A
-HM
p19A/7C
D-HM
***
* **
5
6
7
8
Log 10
(CFU
/gra
m o
f tis
sues
)cecum colon
** p=0.0776
**
****F
DSS
+p19
A
DSS
+p19
A+1
A-H
M
DSS
+p19
A+7
CD
-HM
0
2
4
6
8
10
12
0
10
20
30
cecum colon
His
tolo
gy s
core
His
tolo
gy s
core
water
p19ADSS +
p19A/1A
-HM
p19A/7C
D-HM
water
p19ADSS +
p19A/1A
-HM
p19A/7C
D-HM
EdemaCrypt lossEpithelial integrity PMN
*** ***
***
*** *
**
*
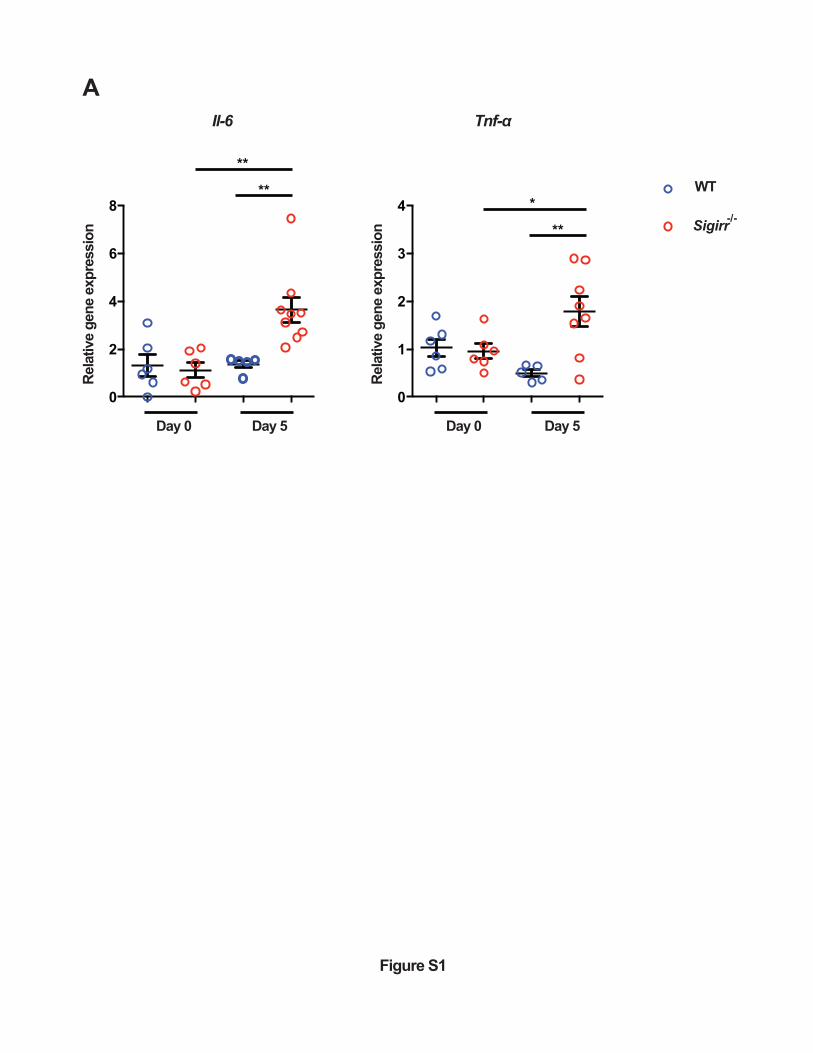
A
Figure S1
0
2
4
6
8
0
1
2
3
4
Rela
tive
gene
exp
ress
ion
Il-6 Tnf-α
WT
Sigirr-/-
Day 0 Day 0 Day 5Day 5
**
**
*
**
Rela
tive
gene
exp
ress
ion
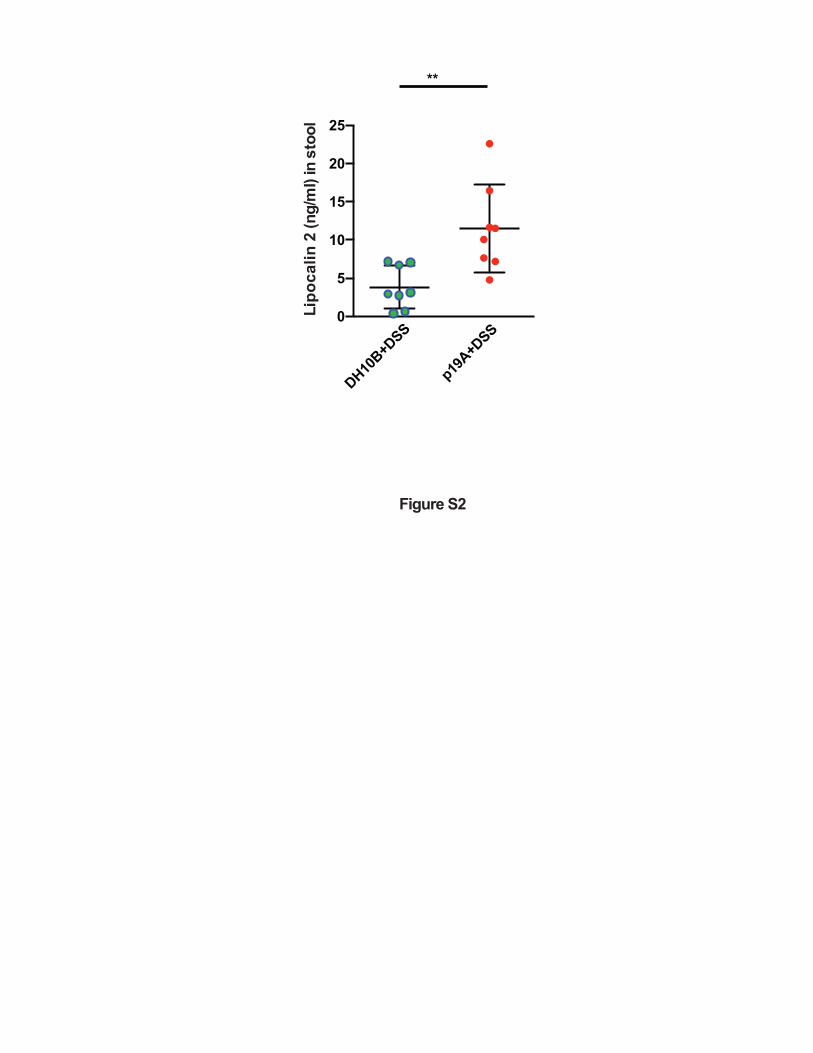
Figure S2
DH10B+D
SS
p19A+D
SS0
5
10
15
20
25
Lipo
calin
2 (n
g/m
l) in
sto
ol
**
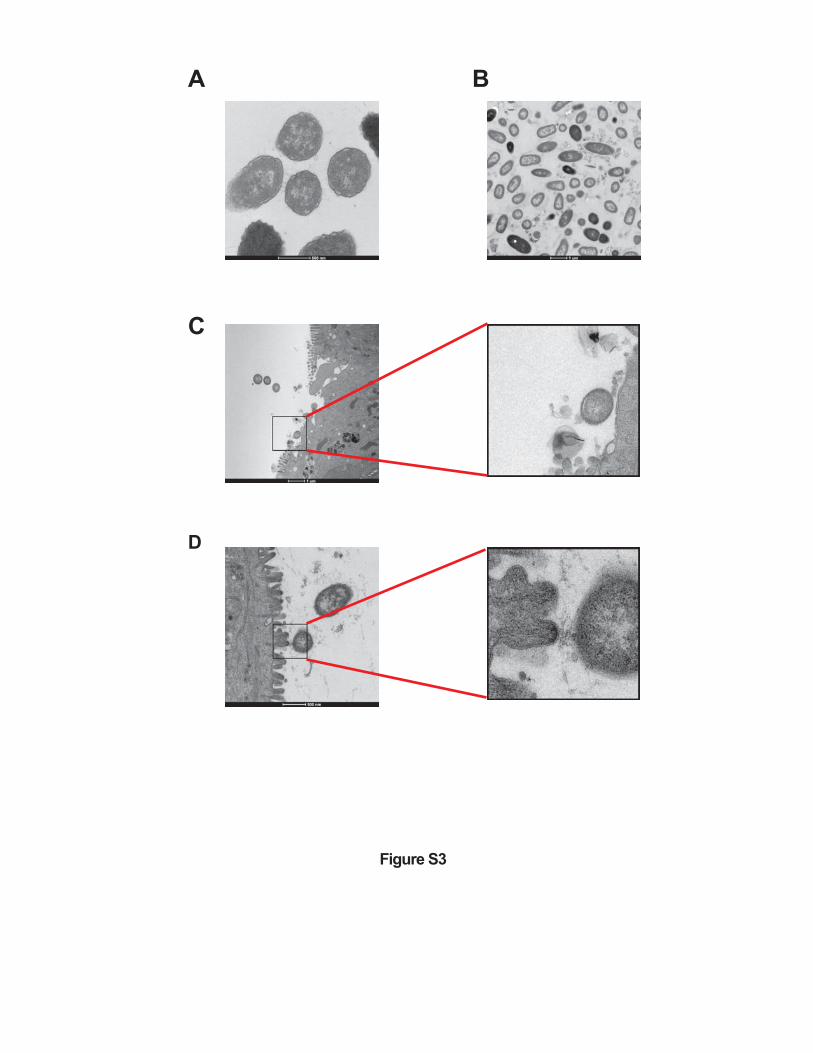
A
Figure S3
B
D
C
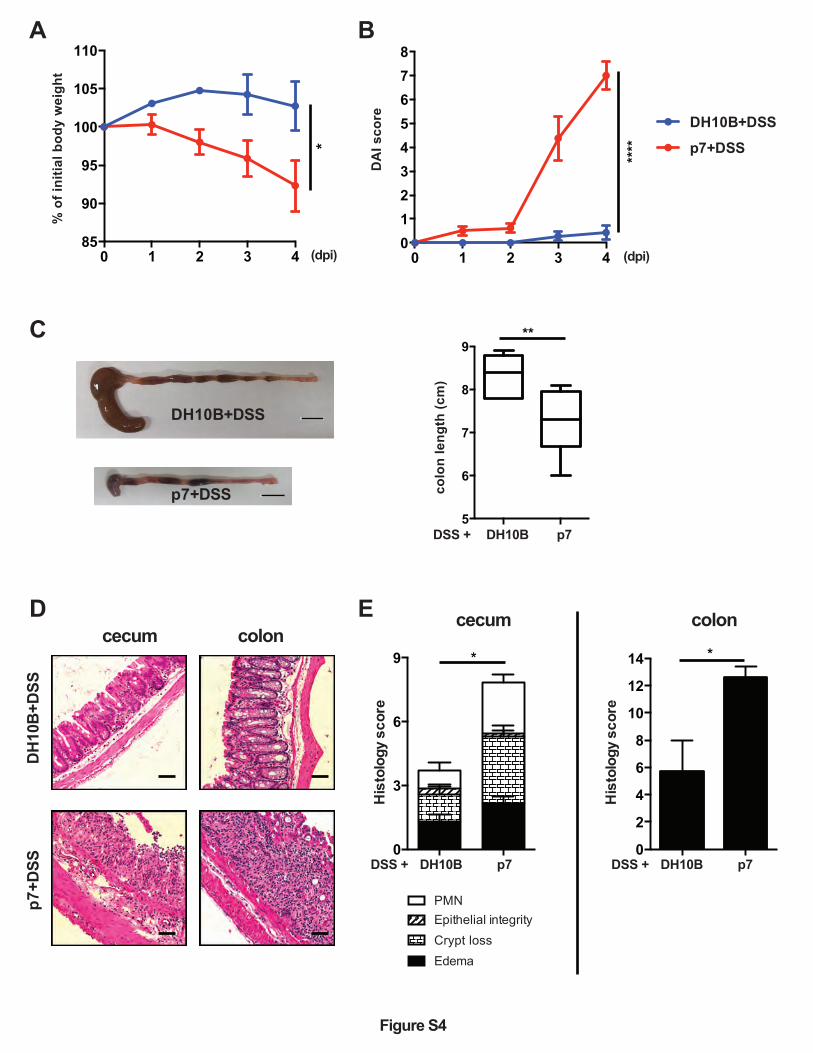
Figure S4
0 1 2 3 4012345678
DH10B+DSS
p7+DSS
(dpi) (dpi)
% o
f ini
tial b
ody
wei
ght
DA
I sco
re
*
****
DH10B+DSS
p7+DSS 5
6
7
8
9
colo
n le
ngth
(cm
)
DSS + DH10B p7
**
A B
C
D E
p7+D
SSD
H10
B+D
SS
cecum colon
0
3
6
9
0
2
4
6
8
10
12
14
cecum colon
His
tolo
gy s
core
His
tolo
gy s
core
EdemaCrypt lossEpithelial integrity PMN
* *
DSS + DH10B p7DSS + DH10B p7
0 1 2 3 485
90
95
100
105
110
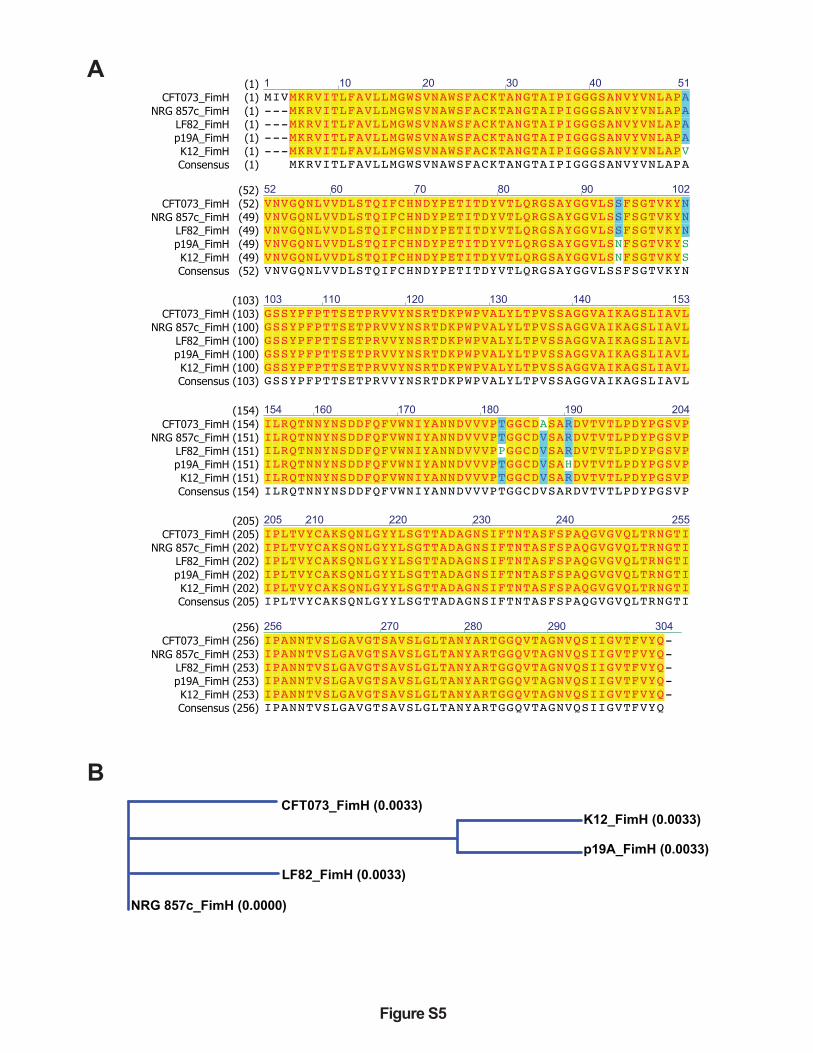
Figure S5
A
B
1 5110 20 30 40(1) MIVMKRVITLFAVLLMGWSVNAWSFACKTANGTAIPIGGGSANVYVNLAPACFT073_FimH (1) ---MKRVITLFAVLLMGWSVNAWSFACKTANGTAIPIGGGSANVYVNLAPANRG 857c_FimH (1) ---MKRVITLFAVLLMGWSVNAWSFACKTANGTAIPIGGGSANVYVNLAPALF82_FimH (1) ---MKRVITLFAVLLMGWSVNAWSFACKTANGTAIPIGGGSANVYVNLAPAp19A_FimH (1) ---MKRVITLFAVLLMGWSVNAWSFACKTANGTAIPIGGGSANVYVNLAPVK12_FimH (1)
MKRVITLFAVLLMGWSVNAWSFACKTANGTAIPIGGGSANVYVNLAPAConsensus (1)
52 10260 70 80 90(52) VNVGQNLVVDLSTQIFCHNDYPETITDYVTLQRGSAYGGVLSSFSGTVKYNCFT073_FimH (52) VNVGQNLVVDLSTQIFCHNDYPETITDYVTLQRGSAYGGVLSSFSGTVKYNNRG 857c_FimH (49) VNVGQNLVVDLSTQIFCHNDYPETITDYVTLQRGSAYGGVLSSFSGTVKYNLF82_FimH (49) VNVGQNLVVDLSTQIFCHNDYPETITDYVTLQRGSAYGGVLSNFSGTVKYSp19A_FimH (49) VNVGQNLVVDLSTQIFCHNDYPETITDYVTLQRGSAYGGVLSNFSGTVKYSK12_FimH (49) VNVGQNLVVDLSTQIFCHNDYPETITDYVTLQRGSAYGGVLSSFSGTVKYNConsensus (52)
103 153110 120 130 140(103) GSSYPFPTTSETPRVVYNSRTDKPWPVALYLTPVSSAGGVAIKAGSLIAVLCFT073_FimH (103) GSSYPFPTTSETPRVVYNSRTDKPWPVALYLTPVSSAGGVAIKAGSLIAVLNRG 857c_FimH (100) GSSYPFPTTSETPRVVYNSRTDKPWPVALYLTPVSSAGGVAIKAGSLIAVLLF82_FimH (100) GSSYPFPTTSETPRVVYNSRTDKPWPVALYLTPVSSAGGVAIKAGSLIAVLp19A_FimH (100) GSSYPFPTTSETPRVVYNSRTDKPWPVALYLTPVSSAGGVAIKAGSLIAVLK12_FimH (100) GSSYPFPTTSETPRVVYNSRTDKPWPVALYLTPVSSAGGVAIKAGSLIAVLConsensus (103)
154 204160 170 180 190(154) ILRQTNNYNSDDFQFVWNIYANNDVVVPTGGCDASARDVTVTLPDYPGSVPCFT073_FimH (154) ILRQTNNYNSDDFQFVWNIYANNDVVVPTGGCDVSARDVTVTLPDYPGSVPNRG 857c_FimH (151) ILRQTNNYNSDDFQFVWNIYANNDVVVPPGGCDVSARDVTVTLPDYPGSVPLF82_FimH (151) ILRQTNNYNSDDFQFVWNIYANNDVVVPTGGCDVSAHDVTVTLPDYPGSVPp19A_FimH (151) ILRQTNNYNSDDFQFVWNIYANNDVVVPTGGCDVSARDVTVTLPDYPGSVPK12_FimH (151) ILRQTNNYNSDDFQFVWNIYANNDVVVPTGGCDVSARDVTVTLPDYPGSVPConsensus (154)
205 255210 220 230 240(205) IPLTVYCAKSQNLGYYLSGTTADAGNSIFTNTASFSPAQGVGVQLTRNGTICFT073_FimH (205) IPLTVYCAKSQNLGYYLSGTTADAGNSIFTNTASFSPAQGVGVQLTRNGTINRG 857c_FimH (202) IPLTVYCAKSQNLGYYLSGTTADAGNSIFTNTASFSPAQGVGVQLTRNGTILF82_FimH (202) IPLTVYCAKSQNLGYYLSGTTADAGNSIFTNTASFSPAQGVGVQLTRNGTIp19A_FimH (202) IPLTVYCAKSQNLGYYLSGTTADAGNSIFTNTASFSPAQGVGVQLTRNGTIK12_FimH (202) IPLTVYCAKSQNLGYYLSGTTADAGNSIFTNTASFSPAQGVGVQLTRNGTIConsensus (205)
256 304270 280 290(256) IPANNTVSLGAVGTSAVSLGLTANYARTGGQVTAGNVQSIIGVTFVYQ-CFT073_FimH (256) IPANNTVSLGAVGTSAVSLGLTANYARTGGQVTAGNVQSIIGVTFVYQ-NRG 857c_FimH (253) IPANNTVSLGAVGTSAVSLGLTANYARTGGQVTAGNVQSIIGVTFVYQ-LF82_FimH (253) IPANNTVSLGAVGTSAVSLGLTANYARTGGQVTAGNVQSIIGVTFVYQ-p19A_FimH (253) IPANNTVSLGAVGTSAVSLGLTANYARTGGQVTAGNVQSIIGVTFVYQ-K12_FimH (253) IPANNTVSLGAVGTSAVSLGLTANYARTGGQVTAGNVQSIIGVTFVYQConsensus (256)
CFT073_FimH (0.0033)K12_FimH (0.0033)
p19A_FimH (0.0033)
LF82_FimH (0.0033)
NRG 857c_FimH (0.0000)
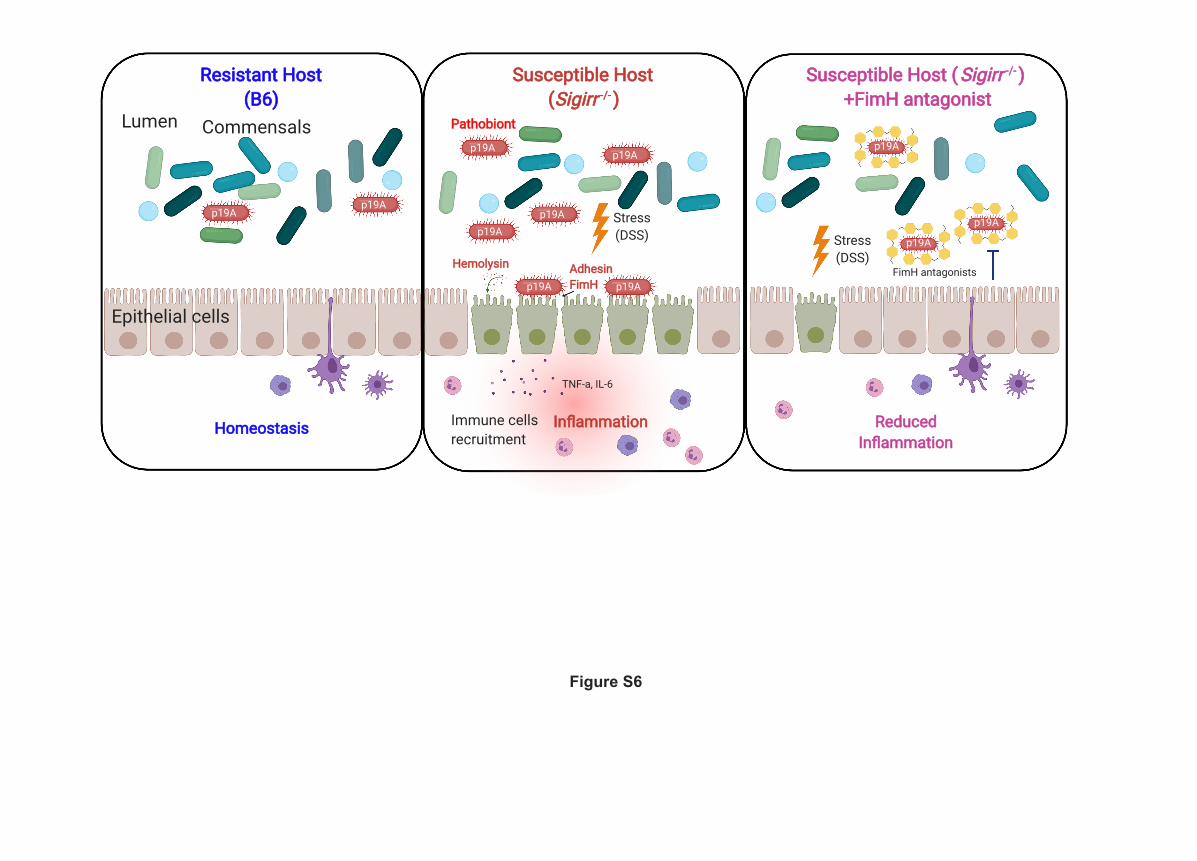
Inflammation Immune cells recruitment
Resistant Host (B6)
Susceptible Host ( Sigirr -/- )
Pathobiont
Adhesin FimH
p19A
Hemolysin FimH antagonists
p19A
p19A p19A
p19A
p19A
Commensals
TNF-a, IL-6
p19A
Epithelial cells
Stress (DSS)
Lumen
p19A
Homeostasis
p19A
p19A
p19A
Susceptible Host ( Sigirr -/- ) +FimH antagonist
Stress (DSS)
Reduced Inflammation
Figure S6