ullage tank fuel-air mixture characterisation · ullage tank fuel-air mixture characterisation ....
TRANSCRIPT

UNCLASSIFIED
Ullage Tank Fuel-Air Mixture Characterisation
Conrad Skibinski and David Armitt
Weapons Systems Division Defence Science and Technology Organisation
DSTO-TN-1059
ABSTRACT This technical note discusses method development for the gas chromatography/mass spectrometry (GC/MS) vapour characterisation of Jet A-1 fuel. The vapour characterisation was conducted in the ullage; the void volume above the liquid fuel. A key objective was to determine the relative headspace concentrations, of different compounds at various equilibrium temperatures. This study was conducted to further understand the mechanisms of flame propagation in fuel tank vulnerability tests under experimental conditions that reflect the field environment of aviation fuel tanks used by the Australian Defence Force (ADF). The results showed that the major constituents were 1,2,4-trimethylbenzene, 1,3,5-trimethylbenzene, decane and undecane. Equilibrium was reached in the system after 10 minutes of incubation regardless of the temperature.
RELEASE LIMITATION
Approved for public release
UNCLASSIFIED
UNCLASSIFIED
Published by Weapons Systems Division DSTO Defence Science and Technology Organisation PO Box 1500 Edinburgh South Australia 5111 Australia Telephone: (08) 7389 5555 Fax: (08) 7389 6567 © Commonwealth of Australia 2012 AR-015-192 December 2011 APPROVED FOR PUBLIC RELEASE
UNCLASSIFIED

UNCLASSIFIED
Ullage Tank Fuel-Air Mixture Characterisation
Executive Summary The aim of the project was to develop a reproducible gas chromatography/mass spectrometry (GC/MS) method to characterise samples of Jet A-1 fuel, to further understand the mechanisms of flame propagation in fuel tank vulnerability tests. The characterisation of the fuel involved:
i. GC/MS method development to determine instrumental and sampling variables,
ii. Characterisation of liquid and vapour fuel samples using mass spectral libraries and standard reference samples, and
iii. Establishing a quality control procedure to confirm the integrity of the characterisation.
The experimental conditions reflected the field conditions of aviation fuel tanks used by the Australian Defence Force (ADF). Extensive experimentations were conducted for various fuel sample temperatures and equilibrium times, as these parameters were considered to be the most significant for vapour characterisation. Other variables that were not able to be tested include sample volume, fuel-air ratio and location of sampling fibre in test cell. Investigation of these parameters is recommended for future work in the area. The results, from the chromatograms, show that the major constituents included 1,2,4-trimethylbenzene, 1,3,5 trimethylbenzene, decane and undecane. The method developed was found to not only characterise a considerable portion of the fuel sample, but also to exhibit excellent reproducibility. Quality control measures established that the gas chromatogram peak areas were within a difference of 1.55% for the liquid sample and 2.08% for the vapour sample after three consecutive analyses.
UNCLASSIFIED

UNCLASSIFIED
UNCLASSIFIED
UNCLASSIFIED DSTO –TN-1059
Contents NOMENCLATURE .............................................................................................................IV
ACRONYMS ........................................................................................................................IV
1. INTRODUCTION ............................................................................................................. 1
1.1 PREVIOUS JET A-1 CHARACTERISATIONS.............................................................. 1 1.2 HEADSPACE ANALYSIS........................................................................................... 5 1.3 SOLID-PHASE MICROEXTRACTION ........................................................................ 7 1.4 EXPERIMENTAL AIMS.............................................................................................. 9
2. EXPERIMENTAL........................................................................................................ 10
2.1 INSTRUMENTATION PARAMETERS .............................................................................. 10 2.2 MATERIALS............................................................................................................ 12 2.3 EXPERIMENTAL PROCEDURES ..................................................................................... 13
2.3.1 GC/MS Extraction Optimisation .......................................................................... 13
2.3.1.1 Sampling Height ............................................................................................ 14 2.3.1.2 Incubation Time ............................................................................................. 14 2.3.1.3 Extraction Time.............................................................................................. 15 2.3.1.4 Agitation ........................................................................................................ 15 2.3.1.5 Carry-over of Sample Analyte........................................................................ 15 2.3.1.6 Depressurisation of Vial................................................................................. 16 2.3.1.7 Large Vessel Comparison ............................................................................... 16
2.3.2 Vapour and Liquid Characterisation ..................................................................... 16
3. RESULTS AND DISCUSSION .................................................................................... 17
3.1 SPME SAMPLING METHOD OPTIMISATION ............................................................... 17 3.1.1 Incubation Time..................................................................................................... 17
3.1.1.1 Thermal Equilibrium Experiments ................................................................ 17 3.1.1.2 Phase Equilibrium Experiments..................................................................... 17
3.1.2 Extraction Time..................................................................................................... 20
3.1.3 Agitation................................................................................................................ 22
3.1.4 Carry-over of Analyte............................................................................................ 22
3.1.5 Depressurisation of Vial ........................................................................................ 23
3.1.6 Large Vessel Comparison ...................................................................................... 24
3.1.7 Optimised Vapour Sampling Method ................................................................... 25
3.2 VAPOUR CHARACTERISATION .................................................................................... 26 3.3 LIQUID FUEL CHARACTERISATION ............................................................................. 30 3.5 REPEATABILITY EVALUATION ..................................................................................... 33
4. CONCLUSIONS.............................................................................................................. 36
4.1 CONCLUSION................................................................................................................ 36 4.2 FUTURE WORK ............................................................................................................. 36
5. ACKNOWLEDGEMENTS ............................................................................................ 37
6. REFERENCES................................................................................................................... 38
i

UNCLASSIFIED DSTO-TN-1059
APPENDIX A: GC/MS RESULTS FOR LIQUID FUEL AND REFERENCE SAMPLES.............................................................................................................................. 40
A.1. Reference Standards .............................................................................................. 40
APPENDIX B: GC/MS RESULTS FOR FUEL VAPOUR ............................................. 44
B.1. SPME Sampling Method Optimisation – Thermal Equilibrium .................. 44 B.2. Fuel Vapour Analysis ............................................................................................ 46
UNCLASSIFIED ii

UNCLASSIFIED DSTO-TN-1059
Nomenclature English Symbols
Co Initial Concentration of Analyte in Condensed Phase K Partition coefficient Kfs Distribution Coefficient between Fibre Coating and
Condensed Phase Khs Distribution Coefficient between Fibre Coating and Headspace m/z Mass on Charge Ratio n Absorbance V Voltage V/L Ratio of Headspace Volume and Liquid Volume Vf Volume of Fibre Coating Vh Volume of Headspace Vs Volume of Condensed Phase wt Weight
Greek Symbols β Phase Ratio ΔT Change in Time
Acronyms All acronyms used in this document are defined at first use. However, to aid the reader a list of the most common acronyms used in this document follows.
ADF Australian Defence Force ASTM American Society of Testing and Materials AVTUR Aviation Turbine Fuel CI Chemical Ionisation DSTO Defence Science and Technology Organisation EI Electron Ionisation FAR Fuel to Air Mass Ratio FID Flame Ionisation Detector GC Gas Chromatography HS Headspace MS Mass Spectrometry NIST National Institute of Standards and Testing PDMS Polydimethylsiloxane RPM Revolutions per minute SPME Solid-Phase Microextraction VOC Volatile Organic Compounds
UNCLASSIFIED iv

UNCLASSIFIED DSTO –TN-1059
v
UNCLASSIFIED DSTO-TN-1059
1. Introduction Weapons Systems Division (WSD) had been tasked to provide assistance with the characterisation of Jet A-1 fuel. The characterisation involves developing a reproducible methodology for analysing both liquid and gaseous (vapour) states of the fuel. The vapour characterisation was conducted in the ullage; the void volume above the liquid fuel. This study was performed to further understand the mechanisms of flame propagation in fuel tank vulnerability tests. The kerosene-based Jet A-1 fuel (boiling point range 160 to 300 °C) is described by the American Society of Testing and Materials (ASTM) as “refined hydrocarbons derived from conventional sources including crude oil, natural gas liquids, heavy oil, and tar sands” (ASTM, 2010). The fuel consists of hundreds of compounds, controlled only by the defined boiling point ranges. Previous analyses can identify over 200 chemical species in a sample fuel (Mayfield, 1996). The technique chosen to characterise the vapour was headspace solid-phase microextraction (SPME), interfaced with a gas chromatograph and mass spectrometer (GC/MS). This was chosen in preference to the direct injection headspace method, as it allowed for easier characterisation. The study involved developing a non-subjective GC/MS method capable of performing analyses that would characterise the vapour at an equilibrium temperature. Furthermore, the study established a quality control procedure to confirm the integrity of the analyses undertaken.
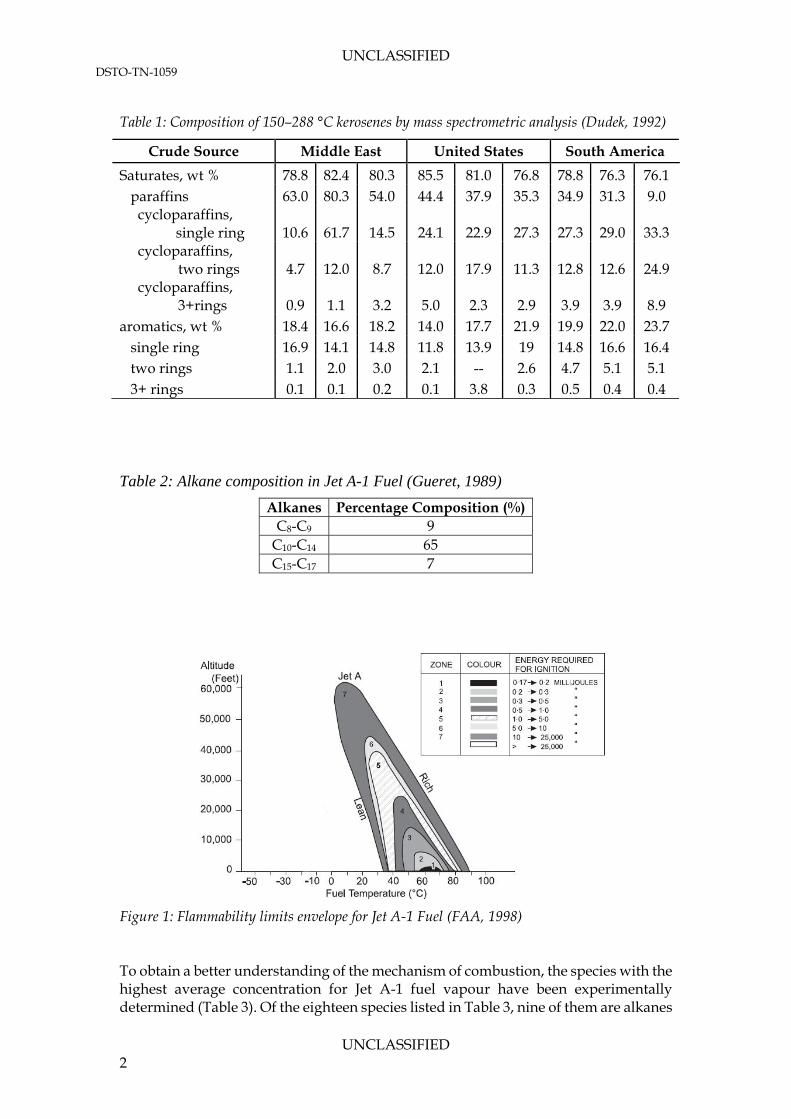
1.1 Previous Jet A-1 Characterisations The actual composition, and consequently performance, of a Jet A-1 fuel is highly dependent on the crude oil from which it is sourced and the refining practices used to obtain the product. This is illustrated by the composition of 150–288 °C kerosenes of different crudes (Table 1). Generally, the Jet A-1 fuel consists of 75-85% paraffins, both straight chain and cyclic, with the remainder composed of aromatic compounds. The alkane content has been divided into aliphatic alkanes and its isomers by Dietzel et al. (2005) (Table 1). It was found that 65% of the total fuel composition was made up of alkane compounds between decane and tetradecane. Unsaturated compounds (olefins), nitrogen, oxygen, sulphur and additives constitute less than 1% of the jet fuel composition (FAA, 1998). Kerosene sourced from the United States is rich in saturates when compared to crude from the Middle East or South America (Dudek, 1992). However, the kerosene from South America has a higher percentage of single ring cycloparaffins and aromatics when compared to the other two sources. The composition of the fuel has a direct correspondence to the flammability limits of the fuel. The electrostatic discharge energy ranges, for which sustained ignition is attained, is a function of the fuel temperature and altitude. From Figure 1, ignition of fuel at sea level is observed for fuel temperatures above 35°C. The lowest energy required occurs at a fuel temperature of approximately 60–65°C.
UNCLASSIFIED 1
UNCLASSIFIED DSTO-TN-1059
Table 1: Composition of 150–288 °C kerosenes by mass spectrometric analysis (Dudek, 1992)
Crude Source Middle East United States South America
Saturates, wt % 78.8 82.4 80.3 85.5 81.0 76.8 78.8 76.3 76.1 paraffins 63.0 80.3 54.0 44.4 37.9 35.3 34.9 31.3 9.0 cycloparaffins,
single ring 10.6 61.7 14.5 24.1 22.9 27.3 27.3 29.0 33.3 cycloparaffins, two rings 4.7 12.0 8.7 12.0 17.9 11.3 12.8 12.6 24.9 cycloparaffins, 3+rings 0.9 1.1 3.2 5.0 2.3 2.9 3.9 3.9 8.9 aromatics, wt % 18.4 16.6 18.2 14.0 17.7 21.9 19.9 22.0 23.7 single ring 16.9 14.1 14.8 11.8 13.9 19 14.8 16.6 16.4 two rings 1.1 2.0 3.0 2.1 -- 2.6 4.7 5.1 5.1 3+ rings 0.1 0.1 0.2 0.1 3.8 0.3 0.5 0.4 0.4 Table 2: Alkane composition in Jet A-1 Fuel (Gueret, 1989)
Alkanes Percentage Composition (%) C8-C9 9
C10-C14 65 C15-C17 7
Figure 1: Flammability limits envelope for Jet A-1 Fuel (FAA, 1998) To obtain a better understanding of the mechanism of combustion, the species with the highest average concentration for Jet A-1 fuel vapour have been experimentally determined (Table 3). Of the eighteen species listed in Table 3, nine of them are alkanes
UNCLASSIFIED 2

UNCLASSIFIED DSTO-TN-1059
(eight straight-chain or branched-chain alkanes and one cycloalkane). The other nine species are aromatic. The principal hydrocarbons of each class are: n-decane for the alkanes, isopropylcyclohexane for the cycloalkanes and 1,2,4-trimethybenzene for the aromatics (Gueret, 1989, Sagiebel, 1997 and Sochet, 2002). Considering the difference in chemical behaviour between these two classes, a classification of the fuel vapour is very important (Sagebiel, 1997).
Table 3: Highest concentration species in Jet A-1 fuel vapour (Sagebiel, 1997)
Species Average Amount (ppmC)
Average Composition (%)
n-decane 5416 6.62 n-nonane 4331 5.30 1,2,4-trimethylbenzene 3321 4.06 n-undecane 2829 3.46 isopropylcyclohexane 2579 3.15 m-xylene 2353 2.88 n-octane 2352 2.88 1,2,3-trimethylbenzene 1977 2.42 1,3,5-trimethylbenzene 1673 2.05 C10 paraffin 1565 1.91 indene 1448 1.77 p-diethylbenzene 1423 1.74 m-ethyltoluene 1422 1.74 2-methyloctane 1386 1.69 3-methyloctane 1274 1.56 2,5-dimethylheptane 1237 1.51 p-ethyltoluene 1169 1.43 2-propyltoluene 1148 1.40
A GC/MS analysis of liquid and vapour Jet A-1 samples has previously been conducted to illustrate the difference in composition between the two phases (Shepherd, 1997). The MS analysis enabled the identification of the n-alkane peaks in the chromatograms (Figure 2). Results showed that the median carbon number was 12 (dodecane) at a test temperature of 40°C.
UNCLASSIFIED 3

UNCLASSIFIED DSTO-TN-1059
Figure 2: Normalised total ion chromatogram for Jet A-1 liquid (Shepherd, 1997) The headspace (vapour) results showed a median alkane composition, after integration of the total ion chromatogram, of C6 (hexane) to C7 (heptane), as illustrated in Figure 3. The two chromatograms shown in Figure 2 and Figure 3 demonstrate the difference between the liquid and vapour compositions. The large number of peaks also highlights the complexity associated with modelling Jet A-1 fuel as a multi-component fuel.
Figure 3: Normalised total ion chromatogram for Jet A-1 vapour at 40°C with mass loading of
300 kg/m3 (Shephard, 1997).
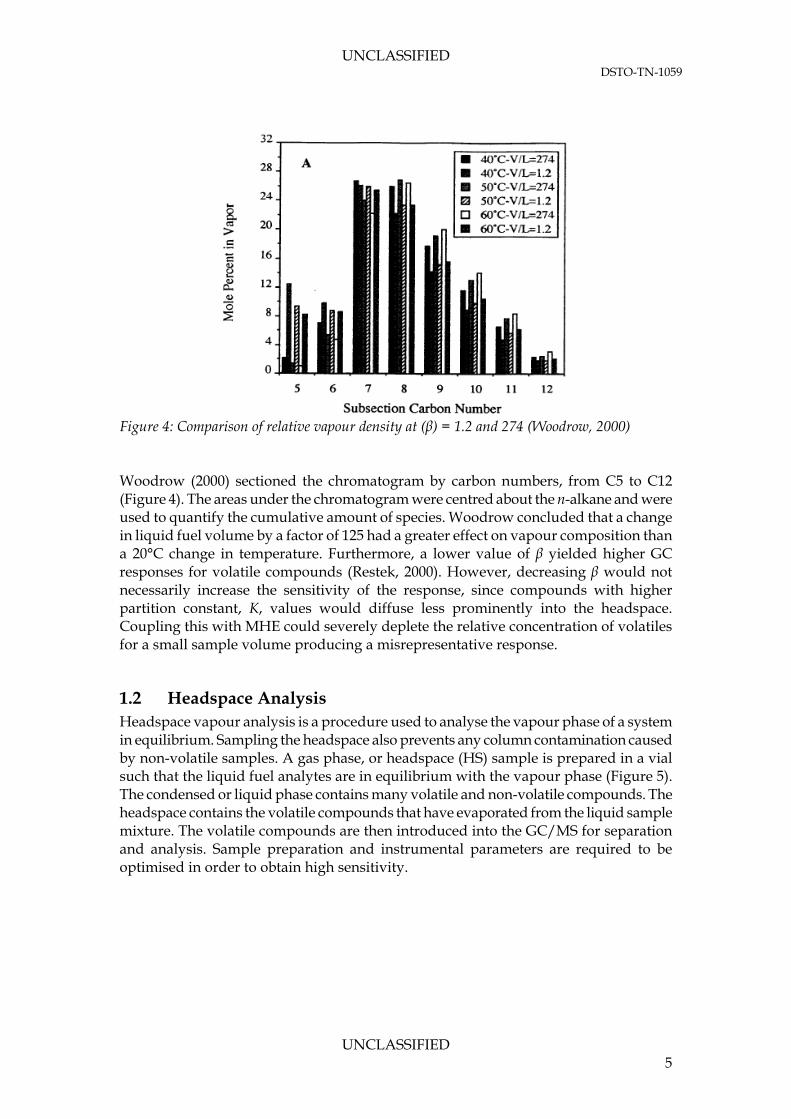
A previous study by Woodrow (2000) has shown compositional differences in headspace samples with phase ratios (vapour volume-to-liquid volume, β or V/L) of 274 and 1.2 (i.e. an almost empty tank and an approximately half-filled tank respectively). The differences were most extreme with lower molecular weight compounds, as shown in Figure 4. This particular form of analysis is important when conducting multiple headspace extractions (MHE).
UNCLASSIFIED 4
UNCLASSIFIED DSTO-TN-1059
Figure 4: Comparison of relative vapour density at (β) = 1.2 and 274 (Woodrow, 2000) Woodrow (2000) sectioned the chromatogram by carbon numbers, from C5 to C12 (Figure 4). The areas under the chromatogram were centred about the n-alkane and were used to quantify the cumulative amount of species. Woodrow concluded that a change in liquid fuel volume by a factor of 125 had a greater effect on vapour composition than a 20°C change in temperature. Furthermore, a lower value of β yielded higher GC responses for volatile compounds (Restek, 2000). However, decreasing β would not necessarily increase the sensitivity of the response, since compounds with higher partition constant, K, values would diffuse less prominently into the headspace. Coupling this with MHE could severely deplete the relative concentration of volatiles for a small sample volume producing a misrepresentative response.
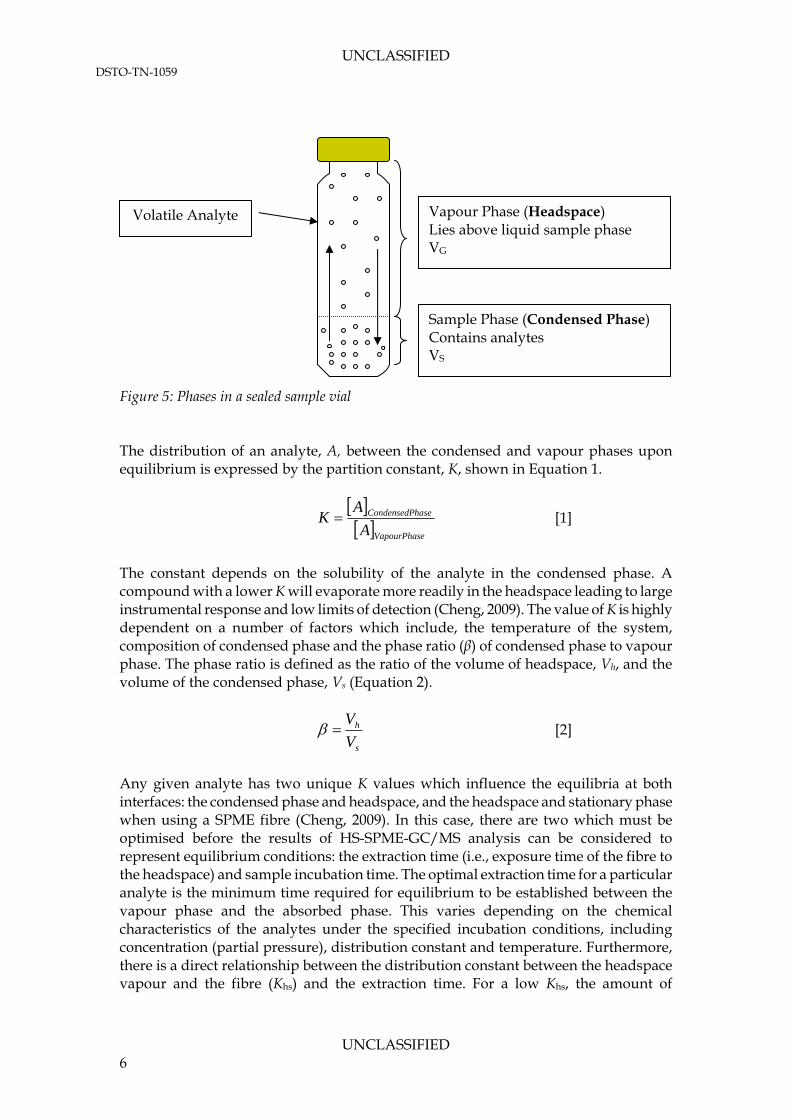
1.2 Headspace Analysis Headspace vapour analysis is a procedure used to analyse the vapour phase of a system in equilibrium. Sampling the headspace also prevents any column contamination caused by non-volatile samples. A gas phase, or headspace (HS) sample is prepared in a vial such that the liquid fuel analytes are in equilibrium with the vapour phase (Figure 5). The condensed or liquid phase contains many volatile and non-volatile compounds. The headspace contains the volatile compounds that have evaporated from the liquid sample mixture. The volatile compounds are then introduced into the GC/MS for separation and analysis. Sample preparation and instrumental parameters are required to be optimised in order to obtain high sensitivity.
UNCLASSIFIED 5
UNCLASSIFIED DSTO-TN-1059
Vapour Phase (Headspace) Lies above liquid sample phase VG
Sample Phase (Condensed Phase) Contains analytes VS
Volatile Analyte
Figure 5: Phases in a sealed sample vial The distribution of an analyte, A, between the condensed and vapour phases upon equilibrium is expressed by the partition constant, K, shown in Equation 1.
eVapourPhas
haseCondensedP
A
AK [1]
The constant depends on the solubility of the analyte in the condensed phase. A compound with a lower K will evaporate more readily in the headspace leading to large instrumental response and low limits of detection (Cheng, 2009). The value of K is highly dependent on a number of factors which include, the temperature of the system, composition of condensed phase and the phase ratio (β) of condensed phase to vapour phase. The phase ratio is defined as the ratio of the volume of headspace, Vh, and the volume of the condensed phase, Vs (Equation 2).
s
h
V
V [2]
Any given analyte has two unique K values which influence the equilibria at both interfaces: the condensed phase and headspace, and the headspace and stationary phase when using a SPME fibre (Cheng, 2009). In this case, there are two which must be optimised before the results of HS-SPME-GC/MS analysis can be considered to represent equilibrium conditions: the extraction time (i.e., exposure time of the fibre to the headspace) and sample incubation time. The optimal extraction time for a particular analyte is the minimum time required for equilibrium to be established between the vapour phase and the absorbed phase. This varies depending on the chemical characteristics of the analytes under the specified incubation conditions, including concentration (partial pressure), distribution constant and temperature. Furthermore, there is a direct relationship between the distribution constant between the headspace vapour and the fibre (Khs) and the extraction time. For a low Khs, the amount of
UNCLASSIFIED 6

UNCLASSIFIED DSTO-TN-1059
compound absorbed onto the fibre is generally low and results in a longer required extraction time.
1.3 Solid-Phase Microextraction SPME is a fast and solvent-less extraction technique developed for rapid, accurate volatile organic compound (VOC) analysis (Pawliszyn, 1997). SPME can be used to sample compounds in both solution (typically aqueous) and vapour phases. Commercially available SPME instruments consist of two parts: a fibre and a fibre holder (Figure 6).
Figure 6: Commercially available autosampler SPME (Sigma-Aldrich, 2010) The fused-silica fibre is coated with a thin film of polymeric extraction phase. It is enveloped for protection by a septa-piercing needle. Protection of the fibre is required during storage, transportation and sampling procedures. The needle plays a dual role, by protecting the fibre as well as piercing the septa. The fibre holder consists of a barrel, a plunger and an adjustable depth gauge. The insertion depth determines the length of fibre exposed to the headspace analyte. Selection of fibre coating (Table 4) has a significant effect on the quality of the chromatogram. There are two families of fibres that can be used: absorption fibres, which extract the vapour phase by partitioning and adsorption fibres, which physically entrap the analyte. The absorption fibres can be classified into polar (e.g., polyacrylate) and non-polar (e.g., polydimethylsiloxane [PDMS]) coatings. The analytes are extracted and concentrated onto the fibre then thermally desorbed into the GC for analysis, where the fibre is exposed to a temperature exceeding 250 °C. In HS-SPME, the fibre is directly exposed to the headspace of the vial. Prior to sampling, equilibrium has to be reached between the headspace and condensed phase. The
UNCLASSIFIED 7

UNCLASSIFIED DSTO-TN-1059
extraction time, is dependent upon the type of fibre and partition coefficients of the target analytes. Low molecular weight compounds with high volatility reach equilibrium faster than heavier, non-volatile compounds. After an appropriate time, the fibre is withdrawn from the vial and transferred to the GC injection port for thermal desorption and further analysis. A compromise has to be achieved between sufficient extraction of analyte and the clouding of small signals (Vu, 2011). Table 4: Fibre type and commercially available application (Sigma-Aldrich, 2010)
Fibre Type Coating
Thickness (μm)
Application
Polydimethylsiloxane (PDMS)
100 general volatiles
PDMS
30 non-polar semi-volatiles
PDMS 7 non-polar high-molecular-weight
compound PDMS/divinylbenzene
(PDMS/DVB)
65 volatiles, amines nitroaromatics
Polyacrylate (PA)
85 polar semi-volatiles
Carbowax/DVB (CW/DVB)
65 polar compounds
CW/PDMS
75 low-molecular weight compound
PDMS/DVB 50/30 flavour compounds The main advantage of SPME is that no solvent is required to elute the analytes from the polymer (coating of the fibre) and there is a direct transfer from sample preparation to the separation method (Michulec, 2005). The combination of sample collection and sample concentration in one step minimises sample losses. In addition, since SPME is based on a partitioning equilibrium between the condensed phase and polymeric fibre, the amount of analyte extracted is directly proportional to the sample concentration. Finally, the amount of analyte absorbed is small, and thus does not disturb the equilibrium conditions in the sample headspace (Pawliszyn, 1999). There are some drawbacks associated with SPME headspace extraction. Firstly, there is preferential absorption of compounds onto the fibre, due to the availability of different fibre properties. Therefore, SPME would only give a relative composition and not a true representation. Secondly, extra precautions must be made with handling and sample preparation, due to the fragile nature of the fibre. A list of the advantages and disadvantages of SPME is presented in Table 5.
UNCLASSIFIED 8

UNCLASSIFIED DSTO-TN-1059
Table 5: Advantages and Disadvantages with SPME
Advantages Disadvantages Small sample size (equilibrium not disturbed) Individual fibres are expensive Reusable (up to 100 samples) Polymer fibre fragile No solvent (environmentally friendly/faster/
increased throughput) Failure to extract all volatiles
Easily automated Collection of cleaner samples
SPME is complete when the analyte has reached distribution equilibrium between the vapour phase and fibre coating. By considering the law of mass conservation, the amount of analyte absorbed by the fibre is governed by Equation 3 (Pawliszyn, 1997).
shhsffs
osffs
VVKVK
CVVKn
[3]
Where,
Co is the initial concentration of the analyte in the condensed phase, Vs is the volume of the condensed phase, Vh is the volume of the vapour phase, Vf is the volume of fibre coating, Kfs is the distribution coefficient between fibre coating and condensed phase, and Khs is the distribution coefficient between fibre coating and headspace.
Equation 3 shows that the amount of analyte extracted is independent of the location of the fibre in a closed system. The absorbance, n, is governed by the distribution coefficients, volume ratio and initial concentration of analyte.
1.4 Experimental Aims The aim of the experimentation was to characterise vapour and liquid Jet A-1 fuel samples using a GC/MS. A number of design variables were considered for a thorough characterisation of the fuel vapour, including:
Temperature conditions (30–60°C), Sample volume, Carry-over of sample analytes, Depressurisation of system, Location of sampling SPME fibre in test cell, and Time to equilibrium.
For characterisation clarity, the temperature of the fuel sample, sample volume, carry-over of analytes, depressurisation of system and time to equilibrium were investigated. These were initially believed to be the most critical factors which would influence the composition of the fuel vapour. Furthermore, the liquid characterisation was completed by considering a fuel sample at ambient (22 °C) conditions.
UNCLASSIFIED 9
UNCLASSIFIED DSTO-TN-1059
2. Experimental
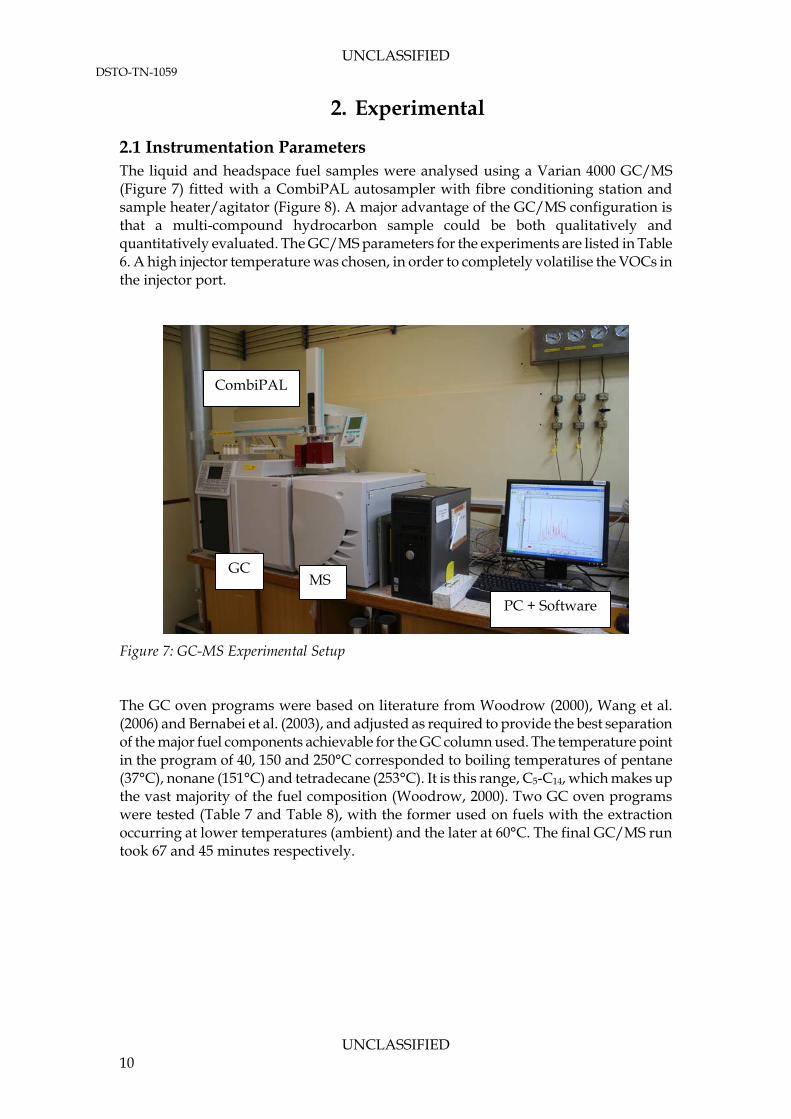
2.1 Instrumentation Parameters The liquid and headspace fuel samples were analysed using a Varian 4000 GC/MS (Figure 7) fitted with a CombiPAL autosampler with fibre conditioning station and sample heater/agitator (Figure 8). A major advantage of the GC/MS configuration is that a multi-compound hydrocarbon sample could be both qualitatively and quantitatively evaluated. The GC/MS parameters for the experiments are listed in Table 6. A high injector temperature was chosen, in order to completely volatilise the VOCs in the injector port.
CombiPAL
GC MS
PC + Software
Figure 7: GC-MS Experimental Setup The GC oven programs were based on literature from Woodrow (2000), Wang et al. (2006) and Bernabei et al. (2003), and adjusted as required to provide the best separation of the major fuel components achievable for the GC column used. The temperature point in the program of 40, 150 and 250°C corresponded to boiling temperatures of pentane (37°C), nonane (151°C) and tetradecane (253°C). It is this range, C5-C14, which makes up the vast majority of the fuel composition (Woodrow, 2000). Two GC oven programs were tested (Table 7 and Table 8), with the former used on fuels with the extraction occurring at lower temperatures (ambient) and the later at 60°C. The final GC/MS run took 67 and 45 minutes respectively.
UNCLASSIFIED 10

UNCLASSIFIED DSTO-TN-1059
Fibre Conditioning
Station
SPME Fibre
Sample Heater/Agitator Injector Port
Figure 8: CombiPAL Autosampler Table 6: Experimental Parameters for GC/MS
Column type 5% phenyl-PDMS Column dimensions 15m, 0.25mm I.D., 0.25μm film thickness
Carrier gas 99.999% Helium, 1 mL/min Injector temperature 300 °C
GC
Split ratio Headspace: Off (first 3min), 30:1 (remainder)
Liquid: 200:1 SPME Fibre type PDMS, 30μm film thickness
Type Bevel tip Syringe
Volume 10 L ( 1 L injection volume) Ionisation method Electron impact, 70 eV
Scan type/mode Full/Normal Data acquisition 3 μScans achieving a data rate of 1.18Hz
Target total ion current 20,000 counts Emission current 10 μA
Mass range m/z 40-500
MS
Delay time 2 min
UNCLASSIFIED 11
UNCLASSIFIED DSTO-TN-1059
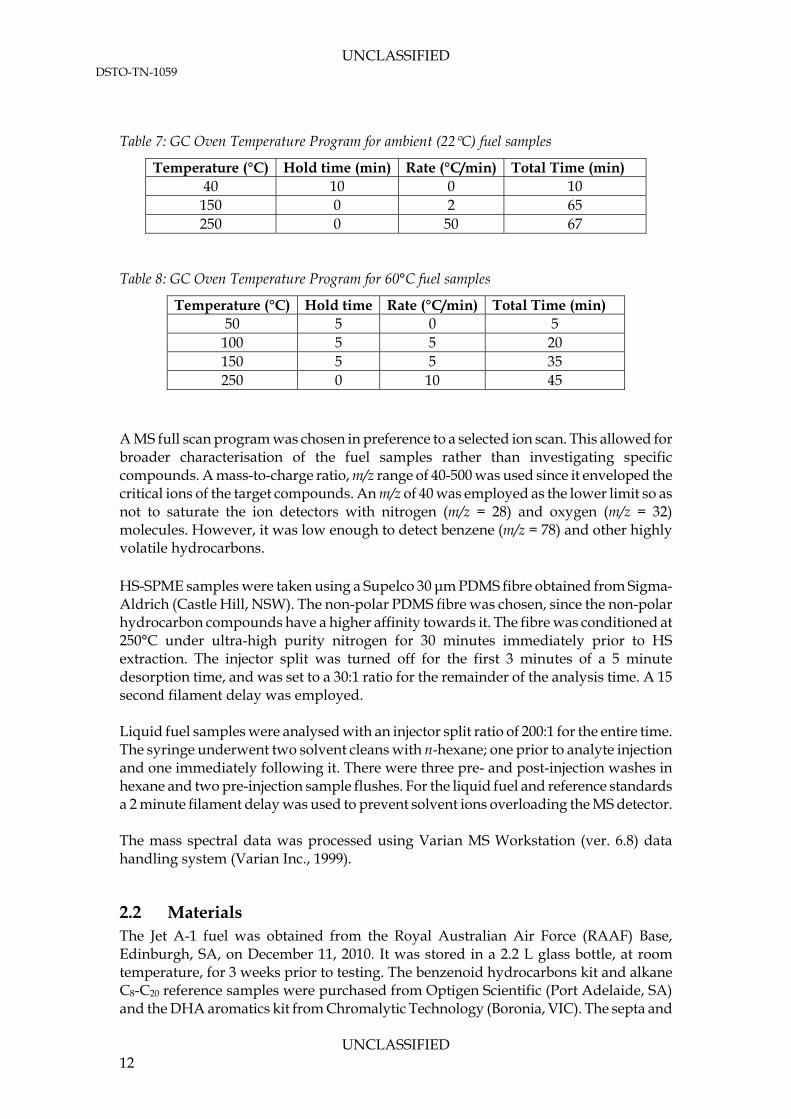
Table 7: GC Oven Temperature Program for ambient (22C) fuel samples
Temperature (°C) Hold time (min) Rate (°C/min) Total Time (min) 40 10 0 10
150 0 2 65 250 0 50 67
Table 8: GC Oven Temperature Program for 60°C fuel samples
Temperature (°C) Hold time Rate (°C/min) Total Time (min) 50 5 0 5
100 5 5 20 150 5 5 35 250 0 10 45
A MS full scan program was chosen in preference to a selected ion scan. This allowed for broader characterisation of the fuel samples rather than investigating specific compounds. A mass-to-charge ratio, m/z range of 40-500 was used since it enveloped the critical ions of the target compounds. An m/z of 40 was employed as the lower limit so as not to saturate the ion detectors with nitrogen (m/z = 28) and oxygen (m/z = 32) molecules. However, it was low enough to detect benzene (m/z = 78) and other highly volatile hydrocarbons. HS-SPME samples were taken using a Supelco 30 μm PDMS fibre obtained from Sigma-Aldrich (Castle Hill, NSW). The non-polar PDMS fibre was chosen, since the non-polar hydrocarbon compounds have a higher affinity towards it. The fibre was conditioned at 250°C under ultra-high purity nitrogen for 30 minutes immediately prior to HS extraction. The injector split was turned off for the first 3 minutes of a 5 minute desorption time, and was set to a 30:1 ratio for the remainder of the analysis time. A 15 second filament delay was employed. Liquid fuel samples were analysed with an injector split ratio of 200:1 for the entire time. The syringe underwent two solvent cleans with n-hexane; one prior to analyte injection and one immediately following it. There were three pre- and post-injection washes in hexane and two pre-injection sample flushes. For the liquid fuel and reference standards a 2 minute filament delay was used to prevent solvent ions overloading the MS detector.
The mass spectral data was processed using Varian MS Workstation (ver. 6.8) data handling system (Varian Inc., 1999).
2.2 Materials The Jet A-1 fuel was obtained from the Royal Australian Air Force (RAAF) Base, Edinburgh, SA, on December 11, 2010. It was stored in a 2.2 L glass bottle, at room temperature, for 3 weeks prior to testing. The benzenoid hydrocarbons kit and alkane C8-C20 reference samples were purchased from Optigen Scientific (Port Adelaide, SA) and the DHA aromatics kit from Chromalytic Technology (Boronia, VIC). The septa and
UNCLASSIFIED 12

UNCLASSIFIED DSTO-TN-1059
vials were purchased from Sigma-Aldrich. Individual n-alkane reference samples were donated as analytical reagent grade samples by the School of Chemistry & Physics, The University of Adelaide. n-Hexane (Ajax Finechem, HPLC grade, 99%) was purchased from Crown Scientific (Minto, NSW). To prevent ions overloading the GC column and the MS detector, the liquid fuel and reference standards were diluted in hexane. For the liquid fuel sample, 100 μL of Jet A-1 fuel was diluted with 900 μL of hexane (e.g. 10-times dilution). For the reference standards, 50 μL of aromatics or alkane mix was diluted with 950 μL of hexane (e.g. 20-times dilution). This corresponded to a 1:9 and 1:19 ratio for the fuel and reference standard respectively. Two different vials were used for the vapour and liquid fuel analyses. For the HS-SPME, a 20 mL SPME vial (Figure 9) was used, whereas for the liquid samples a 2 mL screw-thread vial was the preferred choice. Both vials used PTFE-silicone septa.
O.D = 22.6 mm h = 75 mm
Stainless steel crimp seal
PTFE-Silicone Septa
True Volume = 20.6 mL
Figure 9: Schematic of HS-SPME vial
Similarly, for the large vessel experimentation, a 2325 mL glass bottle was used to house 40 mL of Jet A-1 fuel at ambient conditions (V/L = 57.125). The top of the bottle was covered with aluminium foil, which replicated the septa used in the vial experiments.
2.3 Experimental Procedures
2.3.1 GC/MS Extraction Optimisation To strengthen the validity of the vapour characterisation, a method development was undertaken. Prior to transferring into the test vial, the liquid fuel was stored at ambient conditions. A fuel quantity of 1 mL, corresponding to a liquid layer thickness of 7 mm in a SPME vial and vapour volume to liquid volume (V/L) of 19.6 was used for each test, so as to prevent any misrepresentation of the results. Higher fuel loadings were investigated; however similar GC responses were produced. Selection of a higher
UNCLASSIFIED 13
UNCLASSIFIED DSTO-TN-1059
loading was not practised, as this would result in fibre saturation, requiring more blanks and longer bake-out periods. Incubation and extraction time experimentations were conducted at ambient, 30°C, 40°C, 45°C, 50°C and 60°C. These fuel temperatures lied at the heart of the flammability limit envelope (Figure 1). Similarly, 1 mL of diluted liquid fuel and standard reference samples at ambient (22 °C) temperature were analysed with the GC/MS.
2.3.1.1 Sampling Height To enhance the validity of the methodology, sampling at a constant height above the liquid fuel was preferred. A sampling height of 10 mm from the bottom of the vial was selected to be the most appropriate for the analysis of the fuel vapour. This corresponded to a height of 3 mm above the liquid-vapour interface.
2.3.1.2 Incubation Time During incubation, the volatile compounds evaporate from the liquid phase into the headspace of the vial. As previously mentioned, this process is described by the partition constant (Khs). However, since no simple theoretical solution exists for determining the time to reach phase equilibrium in a liquid-vapour system, this had to be determined experimentally. In order for a system to reach phase equilibrium, it must first come to thermal equilibrium. A series of thermal equilibrium experiments were devised to determine how long it took a vial to reach thermal equilibrium inside the incubation oven. A K-type thermocouple, of 1000 mm length, was used to carry out the investigation. The K-type was deemed to be the most appropriate for the experimentation due to its availability and well documented characteristics. The samples were not agitated in these experiments. Equation 4 (Agilent, 2011) was used for the temperature calculations, with selected theoretical voltages under different thermal conditions,
,27550000000105.0340000010577.00000441303.00009804036.0
01228034.00831527.02503131.007860106.008355.259876
5432
VVVV
VVVVVT
[4]
where, ΔT is the difference in temperature of the vial and the ambient temperature (°C), and V is the voltage reading on the voltmeter (mV). Experiments were carried out using the following procedure:
1) The heater/agitator of the Combi-PAL was preset to the required temperature using the System Control/Automation,
2) A glass SPME vial was filled with 1 mL of fuel and crimped shut with a septum, 3) One end of the thermocouple wire was connected to a Fluke 19 Multimeter at the
DC terminals, 4) The other end of the thermocouple was inserted into the vial through the septum
and placed into the fuel mixture. The thermocouple was positioned so that it was completely enveloped by the fuel sample. Special care was taken so as not to touch the glass vial,
5) The ambient temperature was recorded using a thermometer in the room,
UNCLASSIFIED 14
UNCLASSIFIED DSTO-TN-1059
6) The heater/agitator was allowed to come to the required equilibrium temperature,
7) The vial was placed into the oven and a stopwatch was started, 8) A Microsoft Office spreadsheet was used to convert the recorded voltage
readings into temperature differences, and hence fuel temperatures, 9) Data was collected so as to produce a voltage vs. time plot, 10) Once the multimeter displayed the correct voltage for 10 minutes the vial was
taken out of the oven and allowed to cool to room temperature, and 11) Steps 5-10 were repeated twice.
To supplement the thermal equilibrium investigation, phase equilibrium tests were conducted. Literature found that an equilibrating time range of 15 to 60 minutes was recommended for pre-chilled volatile hydrocarbons (Seto, 1994, Woodrow and Seiber, 1988). To determine the time needed for the system to reach phase equilibrium, the incubation time was varied at each target temperature from 0 to 40 minutes. The fuel samples were incubated at test temperatures (excluding ambient temperature).
2.3.1.3 Extraction Time As a common methodology was sought for the analysis of multiple fuel components over a range of temperatures, experiments were conducted to visualise the effects of a change in extraction time at various temperature conditions. An optimal extraction time was defined as one that would have favourable extraction for both highly volatile and less-volatile compounds. Consequently, SPME extraction times of 1, 2, 5, 10, 20 and 25 minutes were considered at each fuel temperature.
2.3.1.4 Agitation Equilibrium times are greatly influenced by the rate of diffusion from the condensed phase to the headspace, and the headspace to the polymeric fibre. Agitation of the vial imparts additional kinetic energy to molecules in the liquid/solution phase and increases the surface area of the phase boundary. This enhances the rate of diffusion from the liquid phase. Also, the formation of a concentration gradient or stratification is prevented. This culminates in a decrease in the time required to reach phase equilibrium inside the vial. In addition, agitating at a high RPM can create high liquid turbulence inside the vial, causing the septa to get undesirably wet. To quicken the thermal equilibrium time, an agitation speed was employed for all characterisation experiments, with a cycle of 2 seconds ‘on’ followed by 60 seconds ‘off’ for the duration of the incubation. A sensitivity analysis was conducted to investigate the influence of agitation during SPME extraction. A constant 500 RPM agitation was employed for a 10 minute extraction.
2.3.1.5 Carry-over of Sample Analyte To prevent carry-over of sample analytes to subsequent analyses, reconditioning of the SPME fibre was required. The number of blank samples between fuel vapour sampling was incremented from one to four to determine the optimum number.
UNCLASSIFIED 15

UNCLASSIFIED DSTO-TN-1059
2.3.1.6 Depressurisation of Vial Liquid fuel in a hermetically sealed container, like a vial, will evaporate in the space above the liquid surface until the system is in equilibrium. At this point the space becomes saturated and the rate of molecules leaving the liquid is balanced by the number of molecules returning to the liquid. The vapour pressure in a sealed system, or the pressure measured in the vapour state at equilibrium, increases as the temperature of the liquid is increased. In a non-sealed system, this pressure is released to the ambient atmosphere. For aircraft flying at high altitudes the volumetric concentration of fuel molecules in the ullage of the fuel tank will be higher than at standard sea level for a liquid (Ochs, 2009). Also, since aircraft fuel tanks are not a sealed system, an investigation was undertaken to see the differences in GC response between a pressurised and depressurised vial. A simple test was conducted to observe the increase of pressure at 60°C. A syringe, filled with water, was pierced through the septum. The result was a single small bubble of gas hovering inside the syringe barrel. Although the volume of released gas was small, it did warrant further investigation. Subsequent experiments were conducted to evaluate the difference in GC response between a depressurised and non-depressurised sample. The experiment was conducted twice at 60°C, since the vial would experience the greatest pressure rise at this temperature. After 30 minutes of incubation the vial was depressurised, by piercing the septum with a syringe. A further 30 minutes of incubation was permitted for the system to re-equilibrate.
2.3.1.7 Large Vessel Comparison To investigate the validity of the small-scale characterisation, a test was conducted on a larger scale using a modified set-up. The system was allowed to equilibrate for 3 hours prior to a 5 minute manual sampling with the SPME fibre. The resulting chromatogram was compared to a small-scale vial experiment (V/L = 57.857) conducted at ambient conditions.
2.3.2 Vapour and Liquid Characterisation Characterisation of the fuel was conducted for both vapour and liquid phases for comparison. For the vapour phase, characterisations were conducted at ambient, 30, 40, 45, 50 and 60°C using the optimised GC/MS extraction methodology, whereas the liquid characterisation was limited to ambient conditions (22°C). The compounds were identified comparing retention times/mass spectra with reference standards, National Institute of Standards and Technology (NIST) 2008 database and critical ions search. An evaluation of the repeatability was accomplished to validate the experimental methodology.
UNCLASSIFIED 16

UNCLASSIFIED DSTO-TN-1059
3. Results and Discussion The following section presents the results and discussion for the SPME sampling method characterisation and the vapour and liquid characterisations. A repeatability study is also included to highlight the validity of the chosen SPME method.
3.1 SPME Sampling Method Optimisation Extensive studies were carried out to obtain the optimum conditions for HS-SPME sampling at various equilibrium temperatures. Various factors including incubation time, extraction time and sample volume played significant roles in increasing the efficiency and validity of the analysis. A comprehensive optimisation study was conducted so as to enable repeatable results.
3.1.1 Incubation Time
3.1.1.1 Thermal Equilibrium Experiments The thermal equilibrium experiments found that it took 2-5 minutes for the fuel to reach thermal equilibrium at all temperatures. Table 10 lists the average time required for the fuel to reach the incubation temperature over three trials. The results show no intuitive correlation between fuel temperature and average incubation time. However, to prevent any inconsistencies in the incubation and variation of thermal properties in the different fuel samples, the incubation time in a SPME vial should be prolonged to a safe duration regardless of the target fuel temperature. Table 9: Time required for fuel to reach incubation temperature
Fuel Temperature (°C) Time (s) Average Time (s)
Trial 1 300 Trial 2 300 40 Trial 3 240
280
Trial 1 180 Trial 2 180 50 Trial 3 120
160
Trial 1 240 Trial 2 240 60 Trial 3 300
260
3.1.1.2 Phase Equilibrium Experiments Phase equilibrium experiments were used to highlight the similarities or differences in chromatograms between various incubation times. Figure 10 illustrates the location of the 5 minute extraction to the incubation times and the experimentally observed thermal equilibrium of the fuel for the phase equilibrium tests performed. The blue line represents the percentage of equilibrium fuel temperature inside the vial. The green
UNCLASSIFIED 17

UNCLASSIFIED DSTO-TN-1059
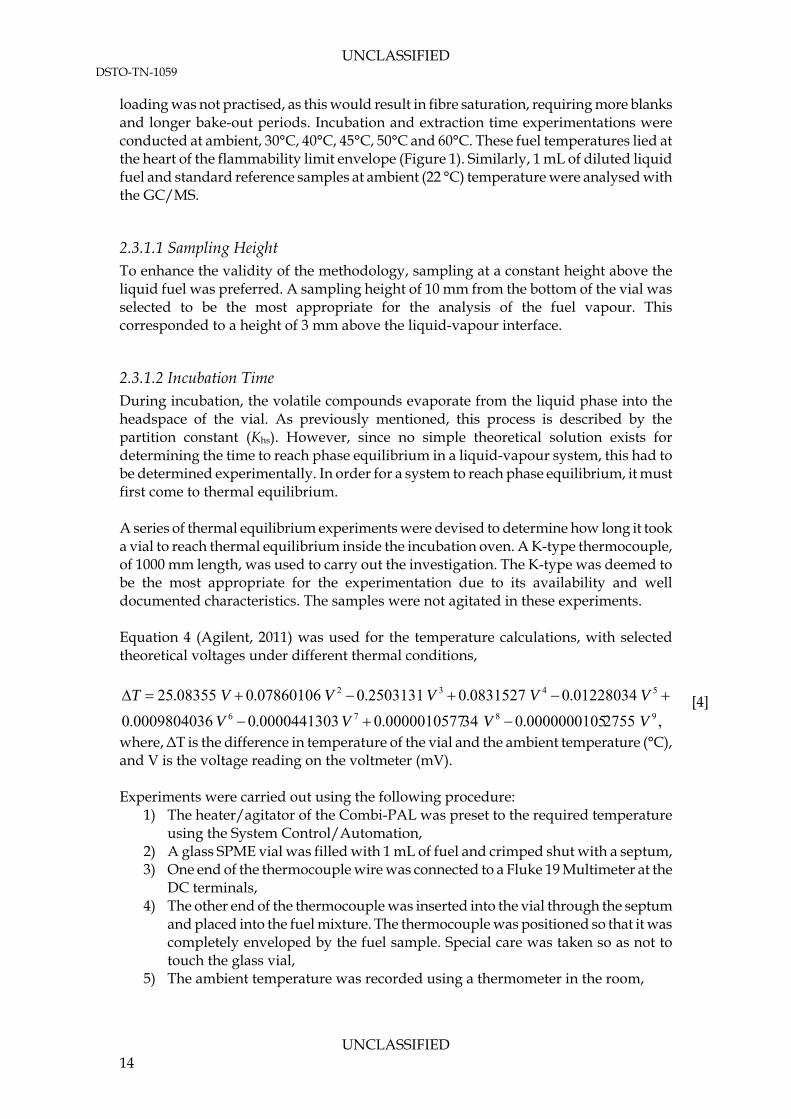
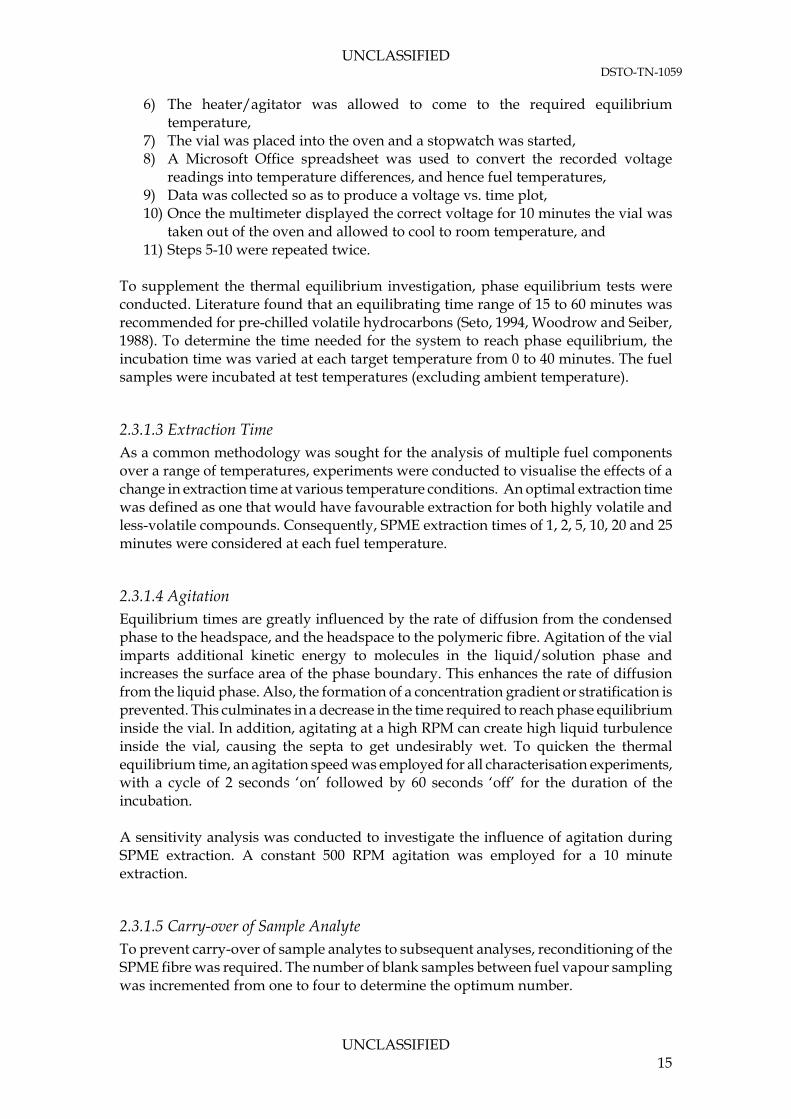
blocks are the SPME extraction times for various incubation times. Since the extraction took place in the incubator, a zero minute system corresponded to a system that was reaching thermal and phase equilibrium simultaneously during extraction. The stacked chromatograms for an oven temperature of 50°C are presented in Figures 11 and 12. A zero minute incubation (purely extraction) is shown for comparison against a non-equilibrium state.
0
25
50
75
100
0 10 20 30 40 50 60 70 80
Time (min)
Fuel
Tem
per
atu
re (%
)
Temperature
Figure 10: Graphical representation of various extraction times (green blocks) and recorded
incubator temperature (blue line) For the more volatile compounds (Figure 11) there is a visible discrepancy between the zero minute incubation time and the other times, suggesting that either the volatile compounds have not achieved an equilibrium state with themselves or the fibre phase. However, for the heavier compounds (Figure 12), similar peaks are observed. Therefore, to prevent any characterisation inconsistencies, it is concluded a longer incubation time would be employed.
UNCLASSIFIED 18
UNCLASSIFIED DSTO-TN-1059
Figure 11: Stacked chromatogram of volatile compounds for various incubation times at an
oven temperature of 50 °C, where red trace – 0 minute; yellow trace – 5 minutes; blue trace – 20 minutes; and, green trace – 40 minutes incubation times.
Figure 12: Stacked chromatogram of heavier compounds for various incubation times at an
oven temperature of 50 °C, where red trace – 0 minute; yellow trace – 5 minutes; blue trace – 20 minutes; and, green trace – 40 minutes incubation times
In an attempt to semi-quantify any changes observed, the chromatograms were divided into 10 minute long sections up to a retention time of 50 minutes. The summed peak areas of each section were then expressed as a percentage of the total area of the chromatogram in the 0-50 minute retention time range. For a fuel sample at 40°C, the relative peak areas for various incubation times are graphically presented (Figure 13).
UNCLASSIFIED 19

UNCLASSIFIED DSTO-TN-1059
The plot illustrates that there are smaller differences in relative peak areas for incubation times longer than 10 minutes, with the largest changes observed for the 0-10 minute retention time section. This may indicate that the lower molecular weight species take longer to equilibrate with the liquid phase and/or the fibre coating than the heavier molecules in the fuel. Furthermore, an increase in volatile compounds (0–10 minutes) was observed for longer incubation times. Whereas, a decrease in relative vapour density for time sections greater than 20 minutes, suggests that smaller molecules are preferentially absorbed onto the fibre.
0.00
5.00
10.00
15.00
20.00
25.00
30.00
35.00
40.00
45.00
0--10 10--20 20--30 30--40 40--50
Subsection Retention Time (min)
ity
(%
)R
ela
tiv
e V
ap
ou
r D
en
s 40deg_0min
40deg_5min
40deg_10min
40deg_20min
40deg_40min
Rel
ativ
e P
eak
Are
a (%
)
Figure 13: Relative peak areas of chromatogram sections of Jet A-1 fuel at 40 °C for various incubation times
Subsequent graphical interpretations of phase equilibrium experiments at different fuel temperatures are presented in Appendix B. To minimise any variations due to these parameters, all characterisation testing was conducted at an incubation time of 60 minutes. This would leave no doubt as to the equilibrium condition of the system.
3.1.2 Extraction Time The experiments were conducted at the target temperatures of ambient (22°C), 30, 40, 45, 50 and 60°C. Figures 14 and 15 show the chromatograms obtained for different extraction times at ambient conditions. A large discrepancy is observed between the 1 minute and other extraction times for both the volatile and heavier compounds. This suggests that insufficient molecules are present in the headspace or that they have not fully reached equilibrium with the fibre. Furthermore, a correlation between short extraction times and higher GC responses for volatile compounds is observed. This is due to the larger, less volatile molecules taking longer to reach equilibrium with the PDMS fibre. Thus, a longer extraction time would allow more interactions between the
UNCLASSIFIED 20

UNCLASSIFIED DSTO-TN-1059
headspace and the polymer fibre. A 5 minute extraction time was selected to be the most optimum as it provides adequate absorption of lower and higher molecular weight species and causes minimal carry over of analytes on the fibre.
Figure 14: Various extraction times at ambient temperature for the volatile compounds, where
yellow trace – 1minute; red trace – 5 minutes; and green trace - 20 minutes extraction times
Figure 15: Various extraction times at ambient conditions for heavier compounds, where
yellow trace – 1minute; red trace – 5 minutes; and green trace - 20 minutes extraction times
UNCLASSIFIED 21
UNCLASSIFIED DSTO-TN-1059
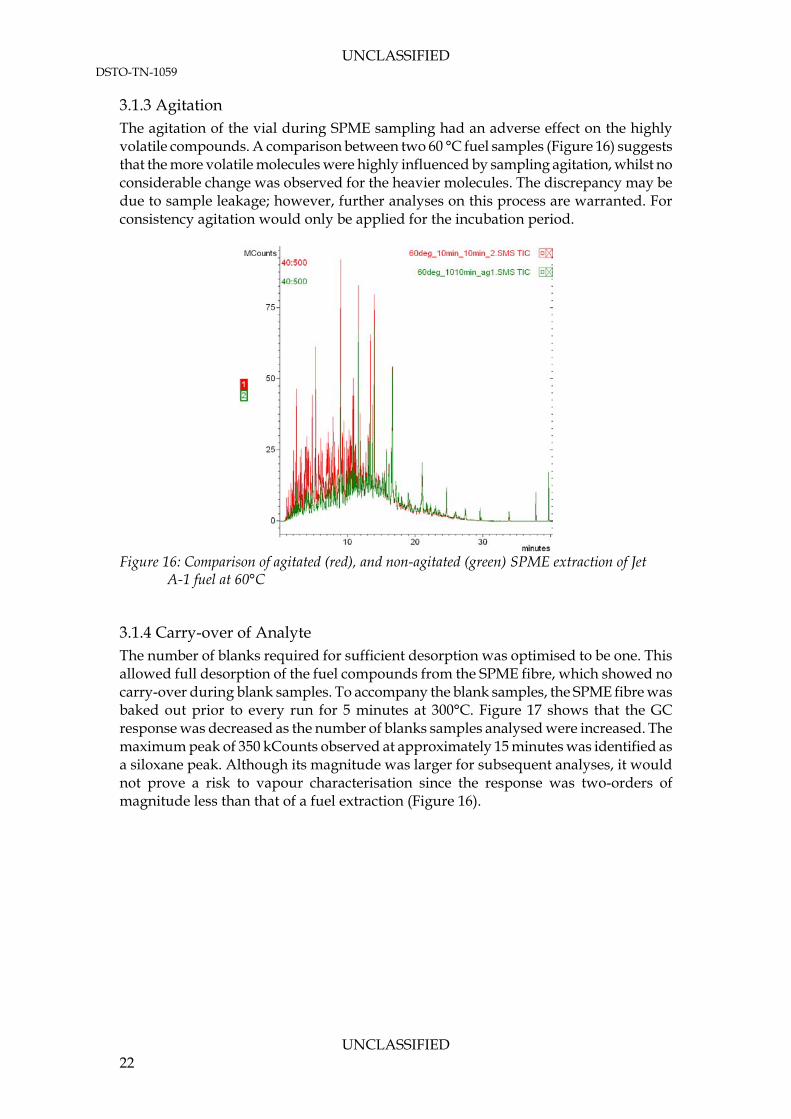
3.1.3 Agitation The agitation of the vial during SPME sampling had an adverse effect on the highly volatile compounds. A comparison between two 60 °C fuel samples (Figure 16) suggests that the more volatile molecules were highly influenced by sampling agitation, whilst no considerable change was observed for the heavier molecules. The discrepancy may be due to sample leakage; however, further analyses on this process are warranted. For consistency agitation would only be applied for the incubation period.
Figure 16: Comparison of agitated (red), and non-agitated (green) SPME extraction of Jet
A-1 fuel at 60°C
3.1.4 Carry-over of Analyte The number of blanks required for sufficient desorption was optimised to be one. This allowed full desorption of the fuel compounds from the SPME fibre, which showed no carry-over during blank samples. To accompany the blank samples, the SPME fibre was baked out prior to every run for 5 minutes at 300°C. Figure 17 shows that the GC response was decreased as the number of blanks samples analysed were increased. The maximum peak of 350 kCounts observed at approximately 15 minutes was identified as a siloxane peak. Although its magnitude was larger for subsequent analyses, it would not prove a risk to vapour characterisation since the response was two-orders of magnitude less than that of a fuel extraction (Figure 16).
UNCLASSIFIED 22
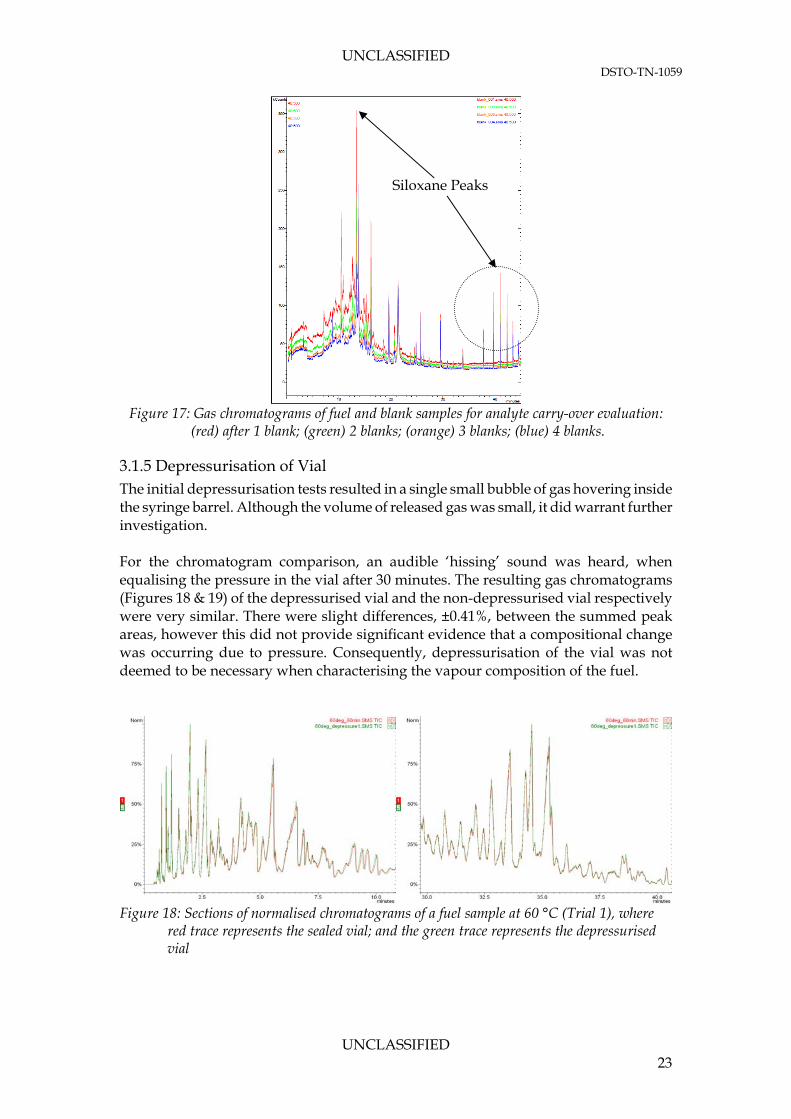
UNCLASSIFIED DSTO-TN-1059
Siloxane Peaks
Figure 17: Gas chromatograms of fuel and blank samples for analyte carry-over evaluation: (red) after 1 blank; (green) 2 blanks; (orange) 3 blanks; (blue) 4 blanks.
3.1.5 Depressurisation of Vial The initial depressurisation tests resulted in a single small bubble of gas hovering inside the syringe barrel. Although the volume of released gas was small, it did warrant further investigation. For the chromatogram comparison, an audible ‘hissing’ sound was heard, when equalising the pressure in the vial after 30 minutes. The resulting gas chromatograms (Figures 18 & 19) of the depressurised vial and the non-depressurised vial respectively were very similar. There were slight differences, ±0.41%, between the summed peak areas, however this did not provide significant evidence that a compositional change was occurring due to pressure. Consequently, depressurisation of the vial was not deemed to be necessary when characterising the vapour composition of the fuel.
Figure 18: Sections of normalised chromatograms of a fuel sample at 60 °C (Trial 1), where
red trace represents the sealed vial; and the green trace represents the depressurised vial
UNCLASSIFIED 23

UNCLASSIFIED DSTO-TN-1059
Figure 19: Sections of normalised chromatograms of a fuel sample at 60 °C (Trial 2), where
red trace represents the sealed vial; and the green trace represents the depressurised vial.
3.1.6 Large Vessel Comparison The large vessel comparison found a significant difference between small-scale vial and less controlled large vessel experiments. It is evident from the stacked chromatograms, that the more volatile species are present in lower relative concentrations than the less volatile species (Figure 20) in the large vessel scenario. However, the peaks corresponding to the more prominent aromatic compounds, namely 1,2,4-trimethylbenzene and p-xylene, are still present in detectable amounts. A possible explanation for the low detection of volatile species is the leakage of those compounds from the glass bottle during SPME sampling. As the aluminium foil would not reseal about the SPME fibre, volatile species may have leaked from the headspace. Large scale field tests are required to explain this observation.
UNCLASSIFIED 24

UNCLASSIFIED DSTO-TN-1059
1,2,4-trimethylbenzene
p-Xylene
Figure 20: Sections of chromatograms of simulated field test (red) and verification sample (green)
3.1.7 Optimised Vapour Sampling Method Having considered the sensitivity of the sampling methodology on extraction time, incubation time, phase equilibrium, agitation and depressurisation an optimised sampling method could be formulated. Prior to extraction, the SPME fibre would be conditioned for 30 minutes at 250°C, while the vial would be incubated at the desired temperature for 60 minutes. Depressurisation of the vial would not be necessary as this showed no significant chromatographic differences in the results and would only add unnecessary sampling technique complexity. For efficient analyte extraction and desorption, the fibre would be exposed into the headspace for 5 minutes and later inserted into the GC injector port at 300°C for 5 minutes. Following a post-injection bake-out, the fibre would undergo the same GC method with one blank air sample.
UNCLASSIFIED 25

UNCLASSIFIED DSTO-TN-1059
3.2 Vapour Characterisation Using the optimised SPME GC/MS experimental methodology outlined previously, a vapour sample of Jet A-1 fuel at various incubation temperatures was analysed with the GC/MS (Figure 21). The peaks (Table 11) were identified using similar methods to those used for the fuel solution sample.
15 16 14 13 12 11 9 10
n-alkane peaks 17
sections
Figure 21: Chromatogram of Jet A-1 vapour at 40°C chromatogram and n-alkane retention times. The n-alkane peaks are identified by the solid line and the carbon number sections with a dashed line.
UNCLASSIFIED 26

UNCLASSIFIED DSTO-TN-1059
Table 10: Relative chromatographic areas of identified aromatic and n-alkane compounds in Jet A-1 vapour at various incubation temperatures
Temperature (°C) Compound Name
Ambient 30 40 45 50 60 Aromatics Relative Peak Areas (%) p-xylene 1.16 1.35 0.94 0.74 0.92 0.82
isopropylbenzene 0.46 0.39 0.36 0.26 0.30 0.15 n-propylbenzene 0.75 0.58 0.62 0.49 0.62 0.38
1-ethyl-3-methylbenzene 1.89 1.57 1.73 1.44 1.25 1.08 1-ethyl-4-methylbenzene 0.64 0.65 0.55 0.51 0.47 0.53 1,3,5-trimethylbenzene 1.30 1.01 1.17 1.14 1.05 0.78
1-ethyl-2-methylbenzene 1.59 1.46 1.24 1.02 0.73 0.67 1,2,4-trimethylbenzene 3.71 3.23 3.30 3.20 3.04 3.07
sec-butylbenzene 1.44 1.20 1.08 0.95 0.95 1.00 1-methyl-3-
isopropylbenzene 0.86 0.73 0.94 0.86 0.90 0.89
1-methyl-4-isopropylbenzene
0.47 0.38 0.61 0.66 0.37 0.48
1-methyl-3-n-propylbenzene
1.58 1.42 1.22 1.18 1.26 1.36
1-methyl-4-n-propylbenzene/ n-butylbenzene
1.07 0.91 0.83 0.78 0.79 0.81
1,3-dimethyl-5-ethylbenzene/
1,2-diethylbenzene 1.09 1.00 0.74 0.74 0.89 0.78
1-methyl-2-n-propylbenzene
0.95 0.86 0.52 0.52 0.58 0.61
1,4-dimethyl-2-ethylbenzene/1,2-dimethyl-
4-ethylbenzene 0.51 0.59 0.54 0.45 0.54 0.43
1,2-dimethyl-2-ethylbenzene
0.87 0.82 0.70 0.67 0.66 0.62
1,2,4,5-tetramethylbenzene 0.70 0.56 0.79 0.73 0.43 0.42 n-Alkanes Relative Peak Areas (%)
nonane 2.41 2.19 2.16 2.01 1.90 1.80 decane 5.82 5.29 4.78 4.60 4.32 3.94
undecane 5.20 5.19 4.86 4.53 4.25 4.22 dodecane 2.42 2.89 3.36 3.24 3.12 3.00 tridecane 0.86 1.18 1.76 1.94 1.96 2.00
tetradecane 0.16 0.32 0.61 0.82 1.02 1.13
Of the 38 compounds contained in the aromatics reference standard (Appendix A), the GC/MS method was able to identify 23 in the vapour phase of Jet A-1 fuel. The highly volatile compounds including toluene, m- and o-xylene, and ethylbenzene were also identified, using a NIST library search, in the vapour. However, these compounds could not be unequivocally identified, since they were not part of the reference standards. Thus, these compounds were excluded from the characterisation.
UNCLASSIFIED 27
UNCLASSIFIED DSTO-TN-1059
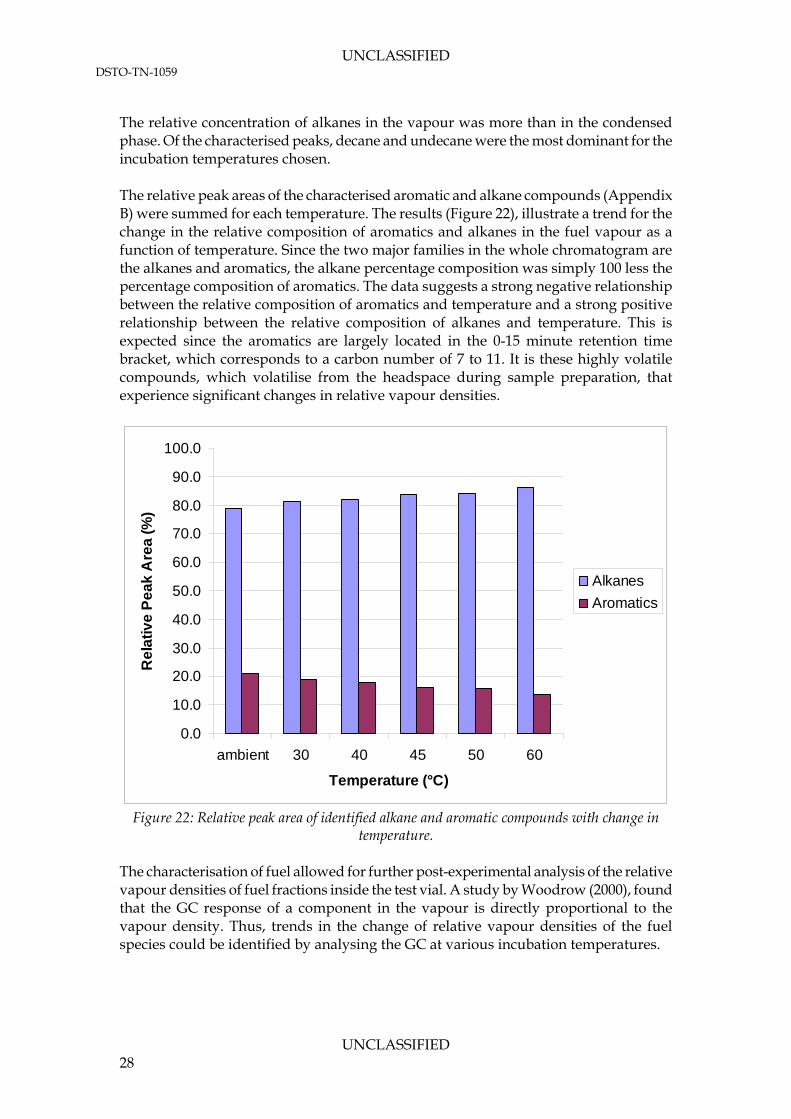
The relative concentration of alkanes in the vapour was more than in the condensed phase. Of the characterised peaks, decane and undecane were the most dominant for the incubation temperatures chosen. The relative peak areas of the characterised aromatic and alkane compounds (Appendix B) were summed for each temperature. The results (Figure 22), illustrate a trend for the change in the relative composition of aromatics and alkanes in the fuel vapour as a function of temperature. Since the two major families in the whole chromatogram are the alkanes and aromatics, the alkane percentage composition was simply 100 less the percentage composition of aromatics. The data suggests a strong negative relationship between the relative composition of aromatics and temperature and a strong positive relationship between the relative composition of alkanes and temperature. This is expected since the aromatics are largely located in the 0-15 minute retention time bracket, which corresponds to a carbon number of 7 to 11. It is these highly volatile compounds, which volatilise from the headspace during sample preparation, that experience significant changes in relative vapour densities.
0.0
10.0
20.0
30.0
40.0
50.0
60.0
70.0
80.0
90.0
100.0
ambient 30 40 45 50 60
Temperature (°C)
Re
lati
ve
Pe
ak
Are
a (
%)
Alkanes
Aromatics
Figure 22: Relative peak area of identified alkane and aromatic compounds with change in
temperature. The characterisation of fuel allowed for further post-experimental analysis of the relative vapour densities of fuel fractions inside the test vial. A study by Woodrow (2000), found that the GC response of a component in the vapour is directly proportional to the vapour density. Thus, trends in the change of relative vapour densities of the fuel species could be identified by analysing the GC at various incubation temperatures.
UNCLASSIFIED 28
UNCLASSIFIED DSTO-TN-1059
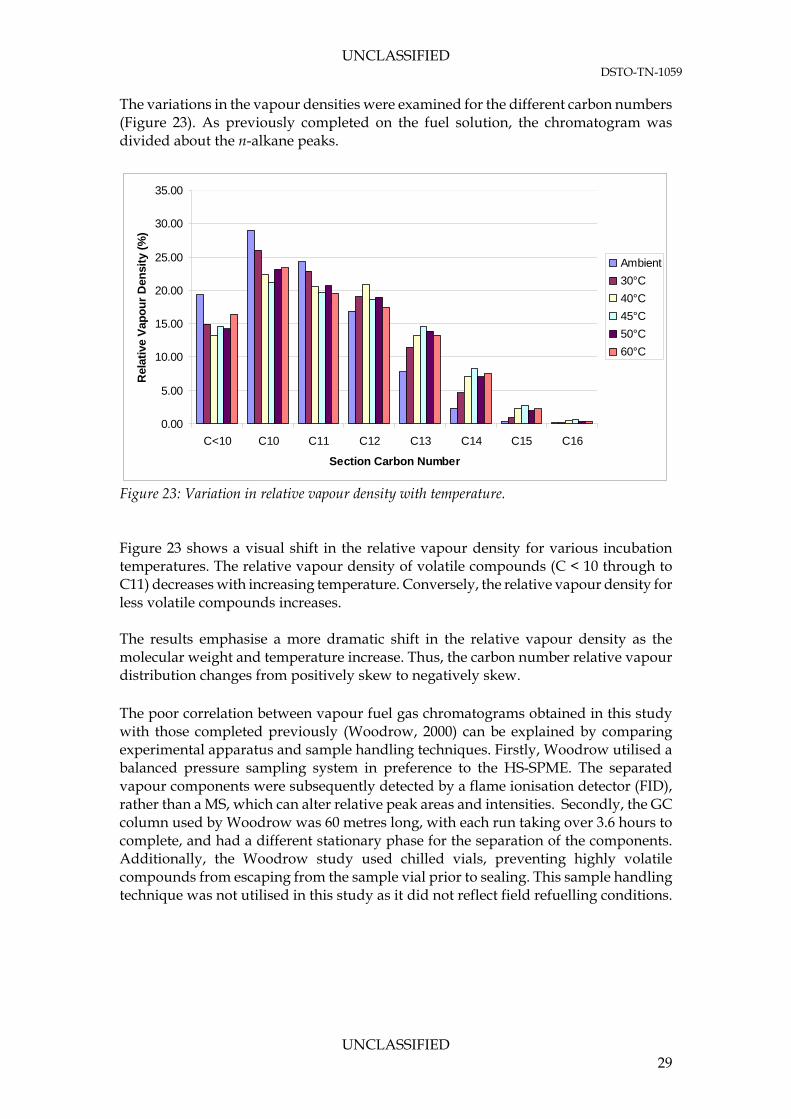
The variations in the vapour densities were examined for the different carbon numbers (Figure 23). As previously completed on the fuel solution, the chromatogram was divided about the n-alkane peaks.
0.00
5.00
10.00
15.00
20.00
25.00
30.00
35.00
C<10 C10 C11 C12 C13 C14 C15 C16
Section Carbon Number
Rel
ativ
e V
apo
ur
Den
sity
(%
)
Ambient
30°C
40°C
45°C
50°C
60°C
Figure 23: Variation in relative vapour density with temperature. Figure 23 shows a visual shift in the relative vapour density for various incubation temperatures. The relative vapour density of volatile compounds (C < 10 through to C11) decreases with increasing temperature. Conversely, the relative vapour density for less volatile compounds increases. The results emphasise a more dramatic shift in the relative vapour density as the molecular weight and temperature increase. Thus, the carbon number relative vapour distribution changes from positively skew to negatively skew. The poor correlation between vapour fuel gas chromatograms obtained in this study with those completed previously (Woodrow, 2000) can be explained by comparing experimental apparatus and sample handling techniques. Firstly, Woodrow utilised a balanced pressure sampling system in preference to the HS-SPME. The separated vapour components were subsequently detected by a flame ionisation detector (FID), rather than a MS, which can alter relative peak areas and intensities. Secondly, the GC column used by Woodrow was 60 metres long, with each run taking over 3.6 hours to complete, and had a different stationary phase for the separation of the components. Additionally, the Woodrow study used chilled vials, preventing highly volatile compounds from escaping from the sample vial prior to sealing. This sample handling technique was not utilised in this study as it did not reflect field refuelling conditions.
UNCLASSIFIED 29

UNCLASSIFIED DSTO-TN-1059
3.3 Liquid Fuel Characterisation A solution of Jet A-1 fuel in hexane at ambient conditions was analysed by GC/MS using identical column oven and injector temperature programs to those described for HS-SPME analysis (Figure 24). The major difference in the solution GC/MS method, aside from the sample introduction, is that the MS detector is not activated until 2 minutes after injection, to prevent saturation of the detector with solvent ions. The peaks (Tables 12 and 13) were identified using a combination of comparison of retention times/mass spectra with reference standards, with NIST database and critical ions search.
n-alkane peaks
9 10 11 12 13 14 16 15 17
sections Figure 24: Jet A-1 fuel solution chromatogram and n-alkane retention times. The n-alkane
peaks are identified by the solid line and the carbon number sections with a dashed line.
UNCLASSIFIED 30

UNCLASSIFIED DSTO-TN-1059
Table 11: Identified aromatic compounds in liquid sample of Jet A-1 fuel
Identified Compound Jet A-1
Retention time (min)
Standard Solution Retention time
(min)
Relative Peak Area
% p-xylene 2.305 2.276 0.69
isopropylbenzene 2.961 2.919 0.25 n-propylbenzene 3.77 3.732 0.42
1-ethyl-3-methylbenzene 4.019 3.981 1.10 1-ethyl-4-methylbenzene 4.115 4.076 0.69 1,3,5-trimethylbenzene 4.326 4.263 1.52
1-ethyl-2-methylbenzene 4.584 4.543 1.06 1,2,4-trimethylbenzene 5.252 5.201 2.12
sec-butylbenzene 5.976 5.943 0.85 1-methyl-3-isopropylbenzene 6.665 6.61 0.68 1-methyl-4-isopropylbenzene 6.906 6.872 0.46 1-methyl-1-isopropylbenzene 7.484 7.432 0.34 1-methyl-3-n-propylbenzene 8.638 8.585 0.73 1-methyl-4-n-propylbenzene 8.958 8.936
n-butylbenzene 8.958 8.936 0.77
1,3-dimethyl-5-ethylbenzene 9.17 9.118 1,2-diethylbenzene 9.17 9.118
0.83
1-methyl-2-n-propylbenzene 9.578 9.535 0.52
1,4-dimethyl-2-ethylbenzene 10.529 10.512
1,2-dimethyl-4-ethylbenzene 10.529 10.512 1.21
1,3-dimethyl-2-ethylbenzene 10.711 10.657 0.68
1,2-dimethyl-2-ethylbenzene 11.243 11.178 0.74
1,2,4,5-tetramethylbenzene 13.954 13.641 0.87 Note: Compounds with a retention time of less than 2 minutes were not identified due to the solvent delay in the detector. Thus, o-xylene, m-xylene, toluene, ethylbenzene and other volatile compounds, known to be contained in the Jet A-1 fuel (Sagebiel, 1997 and Bernabei et al., 2003), were not characterised. Although, the aforementioned compounds were identified in the fuel vapour using only the NIST search; their identities could not be confirmed with the sample solution. Of the 38 compounds contained in the aromatics reference standard (Appendix A), the GC/MS method was able to identify 23 in the fuel during a 67 minute chromatographic run. Several compounds, including 1-methyl-4-n-propylbenzene, n-butylbenzene, 1,3-dimethyl-5-ethylbenzene, 1,2-diethylbenzene, 1,4-dimethyl-2-ethylbenzene and 1,2-dimethyl-4-ethylbenzene were not fully separated. The relative peak areas of each compound were considered to estimate the total aromatic hydrocarbon content of the liquid Jet A-1 fuel. The combined peak area of the identified aromatic content in the liquid fuel was 16.53% of the total area of the chromatogram. The largest constituent was 1,2,4-trimethylbenzene which made up 2.12%. It is not sufficient to compare the peak area of each individual component in a GC/MS chromatogram to determine its relative concentration in a mixture. Some compounds are more easily ionised than others, and thus give greater responses when using the MS
UNCLASSIFIED 31

UNCLASSIFIED DSTO-TN-1059
as a detector. In order to completely quantify the composition of a mixture, calibration curves for each component must be determined experimentally beforehand; such experiments were beyond the scope of this study. However, the peak areas may be used to identify changes in the composition of a mixture analysed under different conditions. Similarly, the n-alkane compounds were characterised in the liquid fuel. The largest constituent was undecane, which made up over 3% of the total chromatogram area. Table 12: Identified n-alkane compounds in Jet A-1 fuel solution
Identified n-alkane
Jet A-1 Retention time (min)
Standard Solution Retention time (min)
Relative Peak Area %
Nonane 2.532 2.522 1.31 Decane 5.976 5.928 3.01
Undecane 13.655 13.599 3.16 Dodecane 21.505 21.459 3.06 Tridecane 28.498 N/A 2.43
Tetradecane 34.89 34.903 1.50 Pentadecane 40.851 N/A 0.60 Hexadecane 46.493 N/A 0.17 Heptadecane 51.839 N/A 0.06
The complex chromatogram was subjectively divided into sections approximately corresponding to seven carbon numbers. In a similar manner to Woodrow (2000), each section was treated as an individual compound and centred about the retention time of the primary family compound (e.g., C11 is centred about undecane). The areas of all peaks within a section were summed to give a peak area for that section. For the GC/MS method employed, the Figure 25 shows that the most significant carbon number in the liquid fuel is C11. This reflects the compositional results (Table 13).
0.00
5.00
10.00
15.00
20.00
25.00
<C10 C10 C11 C12 C13 C14 C15 C16
Subsection Carbon Number
Rel
ativ
e A
rea
(%)
Liquid Jet A-1
Figure 25: Relative peak areas for sections present in liquid Jet A-1 fuel
UNCLASSIFIED 32
UNCLASSIFIED DSTO-TN-1059
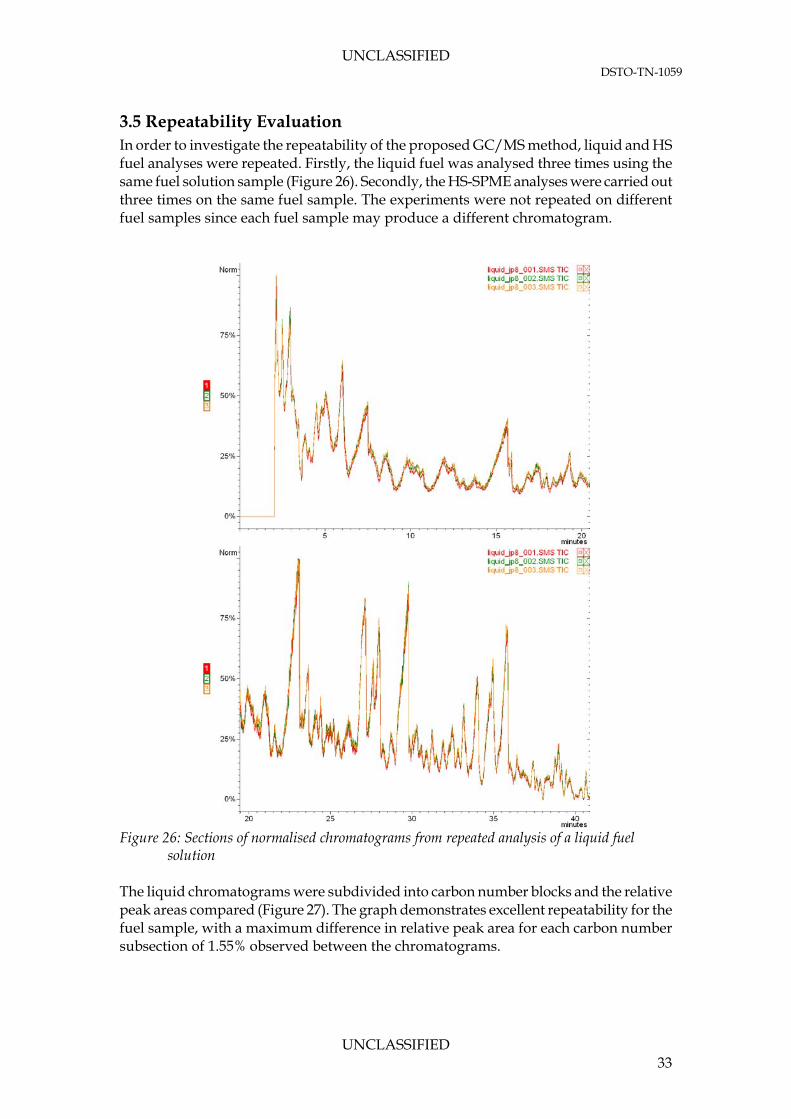
3.5 Repeatability Evaluation In order to investigate the repeatability of the proposed GC/MS method, liquid and HS fuel analyses were repeated. Firstly, the liquid fuel was analysed three times using the same fuel solution sample (Figure 26). Secondly, the HS-SPME analyses were carried out three times on the same fuel sample. The experiments were not repeated on different fuel samples since each fuel sample may produce a different chromatogram.
Figure 26: Sections of normalised chromatograms from repeated analysis of a liquid fuel
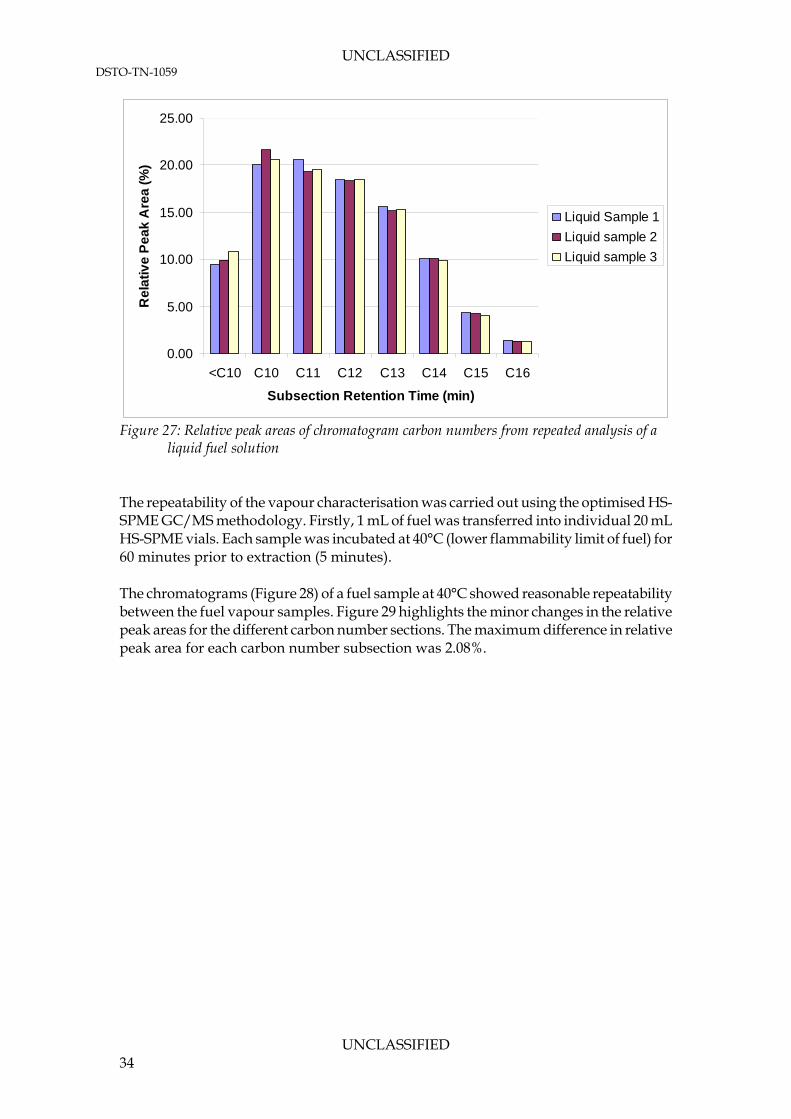
solution The liquid chromatograms were subdivided into carbon number blocks and the relative peak areas compared (Figure 27). The graph demonstrates excellent repeatability for the fuel sample, with a maximum difference in relative peak area for each carbon number subsection of 1.55% observed between the chromatograms.
UNCLASSIFIED 33
UNCLASSIFIED DSTO-TN-1059
0.00
5.00
10.00
15.00
20.00
25.00
<C10 C10 C11 C12 C13 C14 C15 C16
Subsection Retention Time (min)
Re
lati
ve
Pe
ak
Are
a (
%)
Liquid Sample 1
Liquid sample 2
Liquid sample 3
Figure 27: Relative peak areas of chromatogram carbon numbers from repeated analysis of a
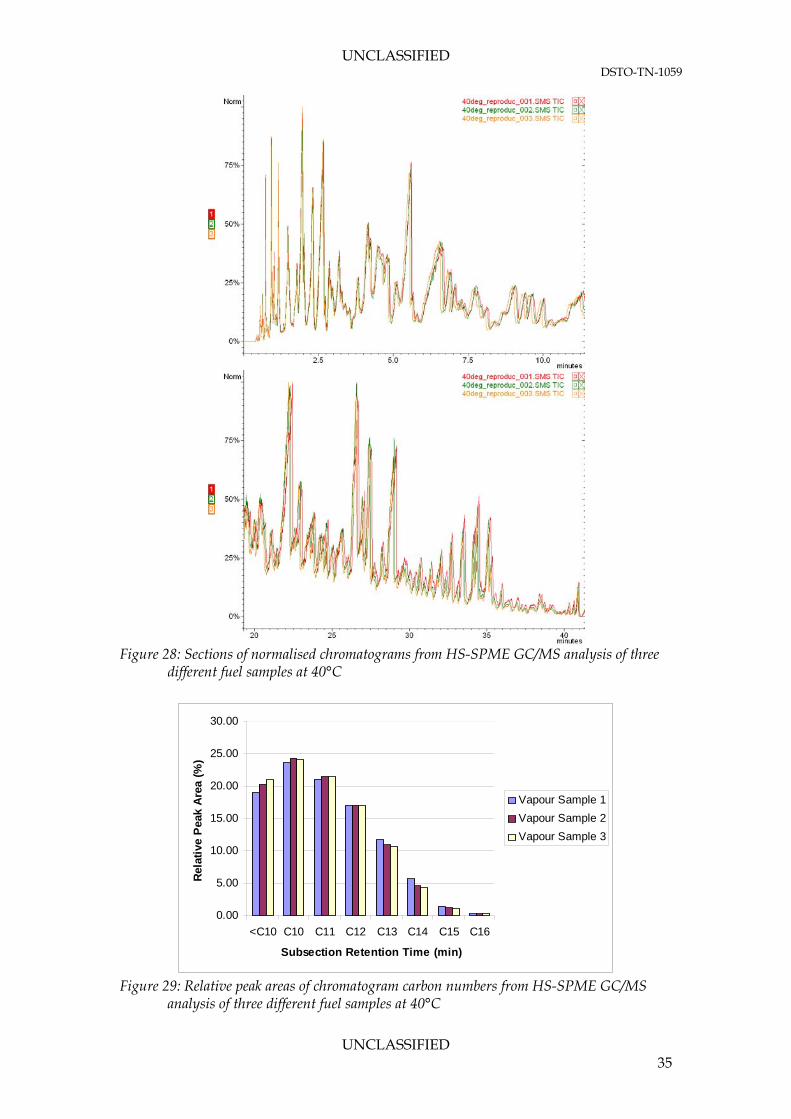
liquid fuel solution The repeatability of the vapour characterisation was carried out using the optimised HS-SPME GC/MS methodology. Firstly, 1 mL of fuel was transferred into individual 20 mL HS-SPME vials. Each sample was incubated at 40°C (lower flammability limit of fuel) for 60 minutes prior to extraction (5 minutes). The chromatograms (Figure 28) of a fuel sample at 40°C showed reasonable repeatability between the fuel vapour samples. Figure 29 highlights the minor changes in the relative peak areas for the different carbon number sections. The maximum difference in relative peak area for each carbon number subsection was 2.08%.
UNCLASSIFIED 34
UNCLASSIFIED DSTO-TN-1059
Figure 28: Sections of normalised chromatograms from HS-SPME GC/MS analysis of three
different fuel samples at 40°C
0.00
5.00
10.00
15.00
20.00
25.00
30.00
<C10 C10 C11 C12 C13 C14 C15 C16
Subsection Retention Time (min)
Rel
ativ
e P
eak
Are
a (%
)
Vapour Sample 1
Vapour Sample 2
Vapour Sample 3
Figure 29: Relative peak areas of chromatogram carbon numbers from HS-SPME GC/MS
analysis of three different fuel samples at 40°C
UNCLASSIFIED 35

UNCLASSIFIED DSTO-TN-1059
4. Conclusions
4.1 Conclusion The proposed sample preparation and GC/MS methods were able to characterise liquid and vapour Jet A-1 fuel. A HS-SPME technique was used since there was a direct transfer of analytes between the vapour and sampling fibre. Therefore, subsequent analyses were contaminant free and repeatable. In addition, the MHE HS-SPME sampling preparation technique allowed for a rapid, solvent-free extraction of the vapour analyte and minimised sample preparation. The liquid and vapour characterisation results showed that 13-21% of the total area of the fuel chromatogram was made up of aromatics. The major constituents included: 1,2,4-trimethylbenzene, 1,3,5-trimethylbenzene and 1-ethyl-3-methylbenzene. Furthermore, the major n-alkane compounds included: decane, undecane and dodecane. These replicate the characterisation results of Sagebiel (1997). Irrespective of the temperature, it was found that the system had achieved liquid-vapour phase-equilibrium after 10 minutes of incubation. A sampling method was developed for determining the composition of Jet A-1 fuel. By considering the extraction time, incubation time, phase equilibrium, agitation and depressurisation an appropriate method was formulated. Prior to extraction, the SPME fibre would be conditioned for 30 minutes at 250°C, while the fuel would be incubated for 60 minutes. An extraction time of 5 minutes was found to be proficient for analyte absorption. The proposed method was found to characterise a considerable portion of the fuel sample with excellent repeatability. Quality control measures established that the gas chromatogram peak areas were within a maximum difference in relative peak area of 1.55% for the liquid sample and 2.08% for the vapour sample after three consecutive analyses.
4.2 Future Work As demonstrated in this study, the HS-SPME technique is suitable for the characterisation of Jet A-1 fuel. However, there are a number of recommendations that would increase the validity of the methodology proposed. Firstly, it is recommended that a smaller quantity of neat liquid fuel (0.1-0.5 μL) and reference standards be injected into the GC. This may allow for a reduction in the detection delay and thus an identification of the highly volatile compounds. Secondly, further laboratory investigations on the other experimental variables, including fuel – air ratio and location of SPME fibre inside test cell is recommended. These would be further developed by field testing of aviation fuel tanks. Finally, to determine the actual compositional concentration of the different species in the ullage, it is recommended that calibration curves be performed for the most dominant species.
UNCLASSIFIED 36

UNCLASSIFIED DSTO-TN-1059
5. Acknowledgements The authors would like to acknowledge and extend their gratitude to the following persons who made the completion of this research possible: Mr John Waschl and Mr Steve Kollias for their continuous support, enthusiasm and advice in the development of the experimental methodology; Mr John Cameron from the School of Chemistry & Physics at The University of Adelaide, for the donation of n-alkane standards.
UNCLASSIFIED 37

UNCLASSIFIED DSTO-TN-1059
6. References Agilent, 2011, Agilent Technologies, viewed on: 20 May 2011, <www.home.agilent.com> American Society of Testing and Materials (ASTM), 2010, ASTM Interational- Standards Worldwide, Philadelphia, USA viewed on: 3 December 2010, <www.astm.org> Bernabei M., Reda R., Galiero R., Bocchinfuso, G., 2003, ‘Determination of total and polycyclic aromatic hydrocarbons in aviation jet fuel’, Journal of Chromatography A, vol. 985, pp. 197-203 Cheng, S., 2009, Development of a headspace solid-phase microextraction (HS-SPME) procedure for the determination of short-chain fatty acids (SCFAs) in activated sludge by GC-FID’, Masters Theses and Doctoral Dissertations, Eastern Michigan University, Michigan Dietzel, K., Campbell, J.L., Barlett, M.G., Witten, M.L., Fisher, J.W., 2005, ‘Validation of gas chromatography/mass spectrometry method for the quantification of aerosolized Jet Propellant 8’, Journal of Chromatography A, vol. 1093, pp. 11-20 Dukek, W.G., 1992, Aviation and Other Gas Turbine Fuels, Kirk-Othmer Encyclopaedia of Chemical Technology, Vol. 3, John Wiley & Sons, New York, pp. 788-812 Federal Aviation Administration (FAA), 1998, ‘A Review of the Flammability Hazard of Jet A Fuel Vapor in Civil Transport Aircraft Fuel Tanks’, Report No. DOT/FAA/AR-98/26, Atlantic City International Airport, New Jersey GMU, 1998, ‘Gas Chromatography-Mass Spectroscopy Background’, George Mason University, Virginia, viewed on 27 May 2011, <http://www.gmu.edu/depts/SRIF/tutorial/gcd/gc-ms2.htm> Gueret, C., 1989, ‘Elaboration d’un modèle cinétique pour l’oxydation de kérosène et d’hydrocarbures représentatif’. Thèse de doctorat, Université d’Orléans Lough, D., Moltagh S., Pawliszyn, J., 1992, ‘Dynamics of organic compound extraction from water using liquid-cooled fused silica fibers’, Analytical Chemistry, vol. 64, pp. 1187-1199 Mayfield H.T., 1996, ‘JP-8 Composition and Variability’, USAF Report AL/EQ-TR-1996-0006, U.S. Air Force Armstrong Laboratory, Tyndall Air Force Base, Florida Michulec, M., Wardencki, W., Partyka, M., Namiesnik, J., 2005, ‘Analytical techniques used in monitoring of atmospheric air pollutants’, Critical Reviews in Analytical Chemistry, vol.35, pp. 117-133 Ochs, R.I., 2009, ‘Vaporization of JP-8 jet fuel in a simulated aircraft fuel tank under varying ambient conditions, FAA, Atlantic City International Airport, New Jersey
UNCLASSIFIED 38
UNCLASSIFIED DSTO-TN-1059
Pawliszyn, J., 1999, Applications of Solid Phase Microextraction, The Royal Society of Chemistry, Cambridge, United Kingdom Pawliszyn, J., 1997, Solid-Phase Microextraction Theory and Practice, The Royal Society of Chemistry, Cambridge, United Kingdom Restek, 2010, Restek, Bellefonte, USA, viewed on: 9 December 2010 < http://www.restek.com> Sagebiel, J.C., 1997, ‘Sampling and Analysis of Vapors from the Center Wing Tank of a Test Boeing 747-100 Aircraft’, Final Report, National Transportation Safety Board, Washington, DC, USA Sochet, I., Gillard, P., 2002, ‘Flammability of kerosene in civil and military aviation’, Journal of Loss Prevention in Process Industries, vol. 15, pp. 335-345 Seto, Y., 1994, ‘Determination of volatile substances in biological headspace gas chromatography’, Journal of Chromatography A, vol. 674, pp. 25-62 Shepherd, J.E, Krok, J.C., Lee, J.J., 1997, ‘Jet A Explosion Experiments: Laboratory Testing’, Californian Institute of Technology, Explosion Dynamics Laboratory, Report FM 97-5, Pasedena, California Sigma-Aldrich, 2010, Sigma-Aldrich, Castle Hill, NSW viewed on: 9 December 2010 <http://www.sigmaaldrich.com/australia.html> Vu D.T., Nicolas, P.E., Erikson, C.M., 2010, ‘Characterisation of Volatiles Using Solid-Phase Microextraction / Gas Chromatography-Mass Spectrometry (SPME/GC-MS)’, U.S Customs and Border Protection, Laboratory Bulletin vol. 10, no. 1, Springfield, Virginia Varian Inc., 1999, ‘CP-3800 GC Getting Started Manual’, Varian Incorporated, Palo Alto, California Wang, G., Karnes, J., Bunker, C.E., Geng, M.L., 2006, ‘Two-dimensional correlation coefficient mapping in gas chromatography: Jet fuel classification for environmental analysis’, Journal of Molecular Structure, vol. 799, pp. 247-252 Woodrow, J.E., Seiber, J.N., 1988, ‘Vapor-pressure measurement of complex mixtures by headspace gas chromatography’, Journal of Chromatography, vol. 445, pp. 53-65 Woodrow, J.E., 2000, ‘The Laboratory Characterization of ARCO Jet Fuel Vapor and Liquid’, Center for Environmental Sciences and Engineering, Reno, Nevada
UNCLASSIFIED 39

UNCLASSIFIED DSTO-TN-1059
Appendix A: GC/MS Results for Liquid Fuel and Reference Samples
A.1. Reference Standards
1
3
13 28 2
4, 5 10, 11
24
16, 17
14 8, 9
26
7 25
15 22 18
19
27 12
23 20 6 21
Figure A1: Identified aromatic hydrocarbons in aromatics reference standard
UNCLASSIFIED 40
UNCLASSIFIED DSTO-TN-1059
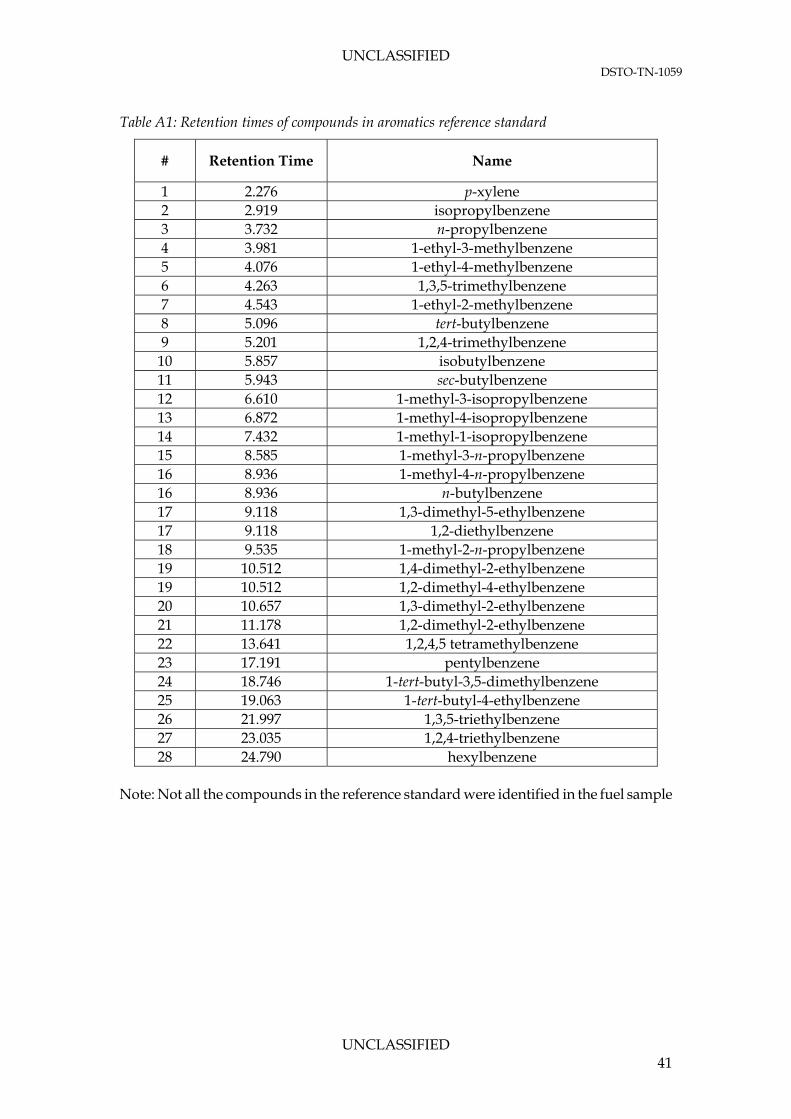
Table A1: Retention times of compounds in aromatics reference standard
# Retention Time Name
1 2.276 p-xylene 2 2.919 isopropylbenzene 3 3.732 n-propylbenzene 4 3.981 1-ethyl-3-methylbenzene 5 4.076 1-ethyl-4-methylbenzene 6 4.263 1,3,5-trimethylbenzene 7 4.543 1-ethyl-2-methylbenzene 8 5.096 tert-butylbenzene 9 5.201 1,2,4-trimethylbenzene
10 5.857 isobutylbenzene 11 5.943 sec-butylbenzene 12 6.610 1-methyl-3-isopropylbenzene 13 6.872 1-methyl-4-isopropylbenzene 14 7.432 1-methyl-1-isopropylbenzene 15 8.585 1-methyl-3-n-propylbenzene 16 8.936 1-methyl-4-n-propylbenzene 16 8.936 n-butylbenzene 17 9.118 1,3-dimethyl-5-ethylbenzene 17 9.118 1,2-diethylbenzene 18 9.535 1-methyl-2-n-propylbenzene 19 10.512 1,4-dimethyl-2-ethylbenzene 19 10.512 1,2-dimethyl-4-ethylbenzene 20 10.657 1,3-dimethyl-2-ethylbenzene 21 11.178 1,2-dimethyl-2-ethylbenzene 22 13.641 1,2,4,5 tetramethylbenzene 23 17.191 pentylbenzene 24 18.746 1-tert-butyl-3,5-dimethylbenzene 25 19.063 1-tert-butyl-4-ethylbenzene 26 21.997 1,3,5-triethylbenzene 27 23.035 1,2,4-triethylbenzene 28 24.790 hexylbenzene
Note: Not all the compounds in the reference standard were identified in the fuel sample
UNCLASSIFIED 41

UNCLASSIFIED DSTO-TN-1059
1
2
4
3 5
Figure A2: Identified n-alkane hydrocarbons in reference sample
UNCLASSIFIED 42

UNCLASSIFIED DSTO-TN-1059
Table A2: Identified compounds in alkane reference standard
# Retention Time
(min) Compound
Name
1 2.522 nonane 2 5.928 decane 3 13.599 undecane 4 21.459 dodecane 5 34.903 tetradecane
A standard solution was made up from neat alkanes obtained from The University of Adelaide (Adelaide, South Australia). The solution contained: hexane (as solvent), heptane, nonane, decane, undecane, dodecane, tetradecane. Of these 7 compounds, 5 were identified. The remaining two (hexane and heptane) were not identified due to the detection delay of 2 minutes. However, their peaks were identified in the experimental characterisation vapour chromatogram (Figure 29) using a selected critical ion search with comparable retention times.
UNCLASSIFIED 43
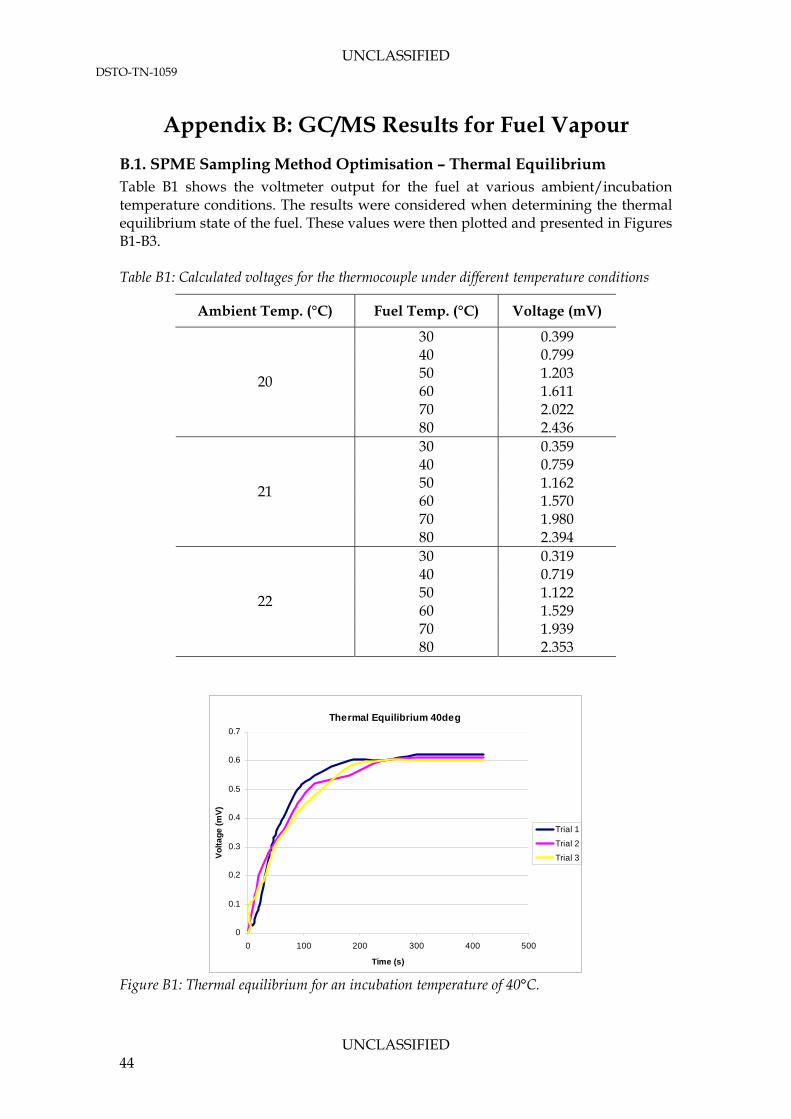
UNCLASSIFIED DSTO-TN-1059
Appendix B: GC/MS Results for Fuel Vapour
B.1. SPME Sampling Method Optimisation – Thermal Equilibrium
Table B1 shows the voltmeter output for the fuel at various ambient/incubation temperature conditions. The results were considered when determining the thermal equilibrium state of the fuel. These values were then plotted and presented in Figures B1-B3. Table B1: Calculated voltages for the thermocouple under different temperature conditions
Ambient Temp. (°C) Fuel Temp. (°C) Voltage (mV)
30 0.399 40 0.799 50 1.203 60 1.611 70 2.022
20
80 2.436 30 0.359 40 0.759 50 1.162 60 1.570 70 1.980
21
80 2.394 30 0.319 40 0.719 50 1.122 60 1.529 70 1.939
22
80 2.353
Thermal Equilibrium 40deg
0
0.1
0.2
0.3
0.4
0.5
0.6
0.7
0 100 200 300 400 500
Time (s)
Vo
lta
ge
(m
V)
Trial 1
Trial 2
Trial 3
Figure B1: Thermal equilibrium for an incubation temperature of 40°C.
UNCLASSIFIED 44
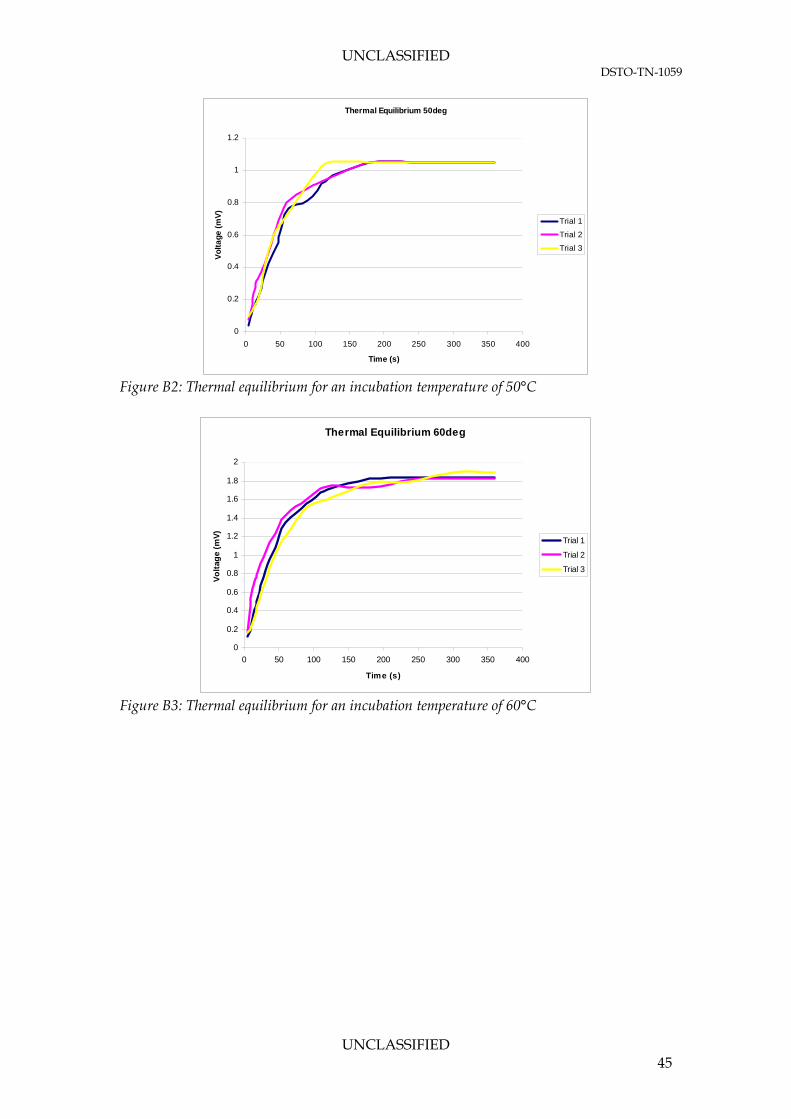
UNCLASSIFIED DSTO-TN-1059
Thermal Equilibrium 50deg
0
0.2
0.4
0.6
0.8
1
1.2
0 50 100 150 200 250 300 350 400
Time (s)
Vo
lta
ge
(m
V)
Trial 1
Trial 2
Trial 3
Figure B2: Thermal equilibrium for an incubation temperature of 50°C
Thermal Equilibrium 60deg
0
0.2
0.4
0.6
0.8
1
1.2
1.4
1.6
1.8
2
0 50 100 150 200 250 300 350 400
Time (s)
Vo
ltag
e (m
V)
Trial 1
Trial 2
Trial 3
Figure B3: Thermal equilibrium for an incubation temperature of 60°C
UNCLASSIFIED 45

UNCLASSIFIED DSTO-TN-1059
UNCLASSIFIED 46
B.2. Fuel Vapour Analysis The change in relative composition of n-alkane and aromatic compounds was graphically presented in Figures B4 and B5 respectively.
0.00
1.00
2.00
3.00
4.00
5.00
6.00
7.00
nona
ne
deca
ne
unde
cane
dode
cane
tride
cane
tetra
deca
ne
penta
deca
ne
hexa
decane
n-Alkane compound
Rel
ativ
e A
rea
(%) Ambient
30°C
40°C
45°C
50°C
60°C
Figure B4: Relative peak areas of n-alkane compounds at various incubation temperatures for
a 5 minute extraction.
0.00
0.50
1.00
1.50
2.00
2.50
3.00
3.50
4.00
p-xy
lene
1-et
hyl-3
-met
hylbe
nzen
e
1,3,
5-trim
ethy
lben
zene
1-et
hyl-2
-met
hylbe
nzen
e
1,2,
4-trim
ethy
lben
zene
1-m
ethy
l-3-n
-pro
pylb
enze
ne
sec-
buty
lbenz
ene
1,2,
4,5 te
tram
ethy
lbenz
ene
Identified Aromatic Compound
Rel
ativ
e A
rea
(%) Ambient
30°C
40°C
45°C
50°C
60°C
Figure B5: Relative peak areas of identified aromatic compounds at various incubation
temperatures for a 5 minute extraction
Page classification: UNCLASSIFIED
DEFENCE SCIENCE AND TECHNOLOGY ORGANISATION
DOCUMENT CONTROL DATA 1. PRIVACY MARKING/CAVEAT (OF DOCUMENT)
2. TITLE Ullage Tank Fuel-Air Mixture Characterisation
3. SECURITY CLASSIFICATION (FOR UNCLASSIFIED REPORTS THAT ARE LIMITED RELEASE USE (L) NEXT TO DOCUMENT CLASSIFICATION) Document (U) Title (U) Abstract (U)
4. AUTHOR(S) Conrad Skibinski and David Armitt
5. CORPORATE AUTHOR DSTO Defence Science and Technology Organisation PO Box 1500 Edinburgh South Australia 5111 Australia
6a. DSTO NUMBER DSTO-TN-1059
6b. AR NUMBER AR-015-192
6c. TYPE OF REPORT Technical Note
7. DOCUMENT DATE December 2011
8. FILE NUMBER 2011/1051172/1
9. TASK NUMBER DMO 07/223
10. TASK SPONSOR DMO
11. NO. OF PAGES 44
12. NO. OF REFERENCES 26
13. DSTO Repository of Publications http://dspace.dsto.defence.gov.au/dspace/
14. RELEASE AUTHORITY Chief, Weapons Systems Division
15. SECONDARY RELEASE STATEMENT OF THIS DOCUMENT
Approved for Public Release OVERSEAS ENQUIRIES OUTSIDE STATED LIMITATIONS SHOULD BE REFERRED THROUGH DOCUMENT EXCHANGE, PO BOX 1500, EDINBURGH, SA 5111
16. DELIBERATE ANNOUNCEMENT No Limitations
17. CITATION IN OTHER DOCUMENTS Yes 18. DSTO RESEARCH LIBRARY THESAURUS Aviation fuel, fuel tank, characterisation 19. ABSTRACT
This technical note discusses method development for the gas chromatography/mass spectrometry (GC/MS) vapour characterisation of Jet A-1 fuel. The vapour characterisation was conducted in the ullage; the void volume above the liquid fuel. A key objective was to determine the relative headspace concentrations, of different compounds at various equilibrium temperatures. This study was conducted to further understand the mechanisms of flame propagation in fuel tank vulnerability tests under experimental conditions that reflect the field environment of aviation fuel tanks used by the Australian Defence Force (ADF). The results showed that the major constituents were 1,2,4-trimethylbenzene, 1,3,5-trimethylbenzene, decane and undecane. Equilibrium was reached in the system after 10 minutes of incubation regardless of the temperature.
Page classification: Error! Reference source not found.