ultrasensitive, visible tunable diode laser detection of no_2
TRANSCRIPT
Ultrasensitive, visible tunablediode laser detection of NO 2
David M. Sonnenfroh and Mark G. Allen
Recent advances in room-temperature visible diode lasers and ultrasensitive detection techniques havebeen exploited to create a highly sensitive tunable diode laser absorption technique for in situmonitoring of NO2 in the lower troposphere. High sensitivity to NO2 is achieved by probing the visibleabsorption band of NO2 with an AlGaInP diode laser at 640 or 670 nm combined with a balancedratiometric electronic detection technique. We have demonstrated a sensitivity of 3.5 3 1010 cm23 forneat NO2 in a 1-m path at 640 nm and have estimated a sensitivity for ambient operation of 5 ppbvm 110ppbv m at 670 nm2, where ppbvm is parts in 109 by volume per meter of absorption path length, frommeasured pressure-broadening coefficients.Key words: Diode laser, absorption, NO2, flux, environmental sensing. r1996 Optical Society of
America
Themeasurement of the flux, or vertical exchange, ofa trace gas between the surface and the boundarylayer of the atmosphere requires sensors that havelow detection limits and fast temporal response.The background concentration of NO2, for example,in the lower troposphere in remote continental andmarine environments is1 ,1 ppbv, where ppbv isparts in 109 by volume. Fast temporal response isrequired for correctly sampling the entire frequencyrange of local vertical wind eddies. A temporalresponse of better than 10 Hz is typically employedfor these measurements.2We are currently developing a highly sensitive
detection technique for NO2 based on visible tunablediode laser absorption spectroscopy coupled with anultrasensitive noise-canceling detector. The tech-nique is being developed for in situ monitoring ofambient NO2 fluxes in the lower troposphere. Tocreate a compact, fieldable instrument withmaximalsensitivity, the technique utilizes a room-tempera-ture, tunableAlGaInP diode laser at 640 nm to probethe red wing of the X 2A1 = A 2B2 visible absorptionband. As we show, the sensitivity of a visible tun-able diode laser absorption spectroscopy instrumentfor NO2 can be similar to that of an instrument
The authors are with Physical Sciences, Inc., 20 New EnglandBusiness Center, Andover, Massachusetts 01810-1077.Received 14 September 1995; revised manuscript received 14
February 1996.0003-6935@96@214053-06$10.00@0r 1996 Optical Society of America
operating in the mid-IR that uses a cryogenic lead-salt laser. These latter instruments achieve sensi-tivities of ,100 pptv, where pptv is parts in 1012 byvolume, by using FM detection techniques and ex-tended optical path lengths.3,4In the present configuration, high sensitivity is
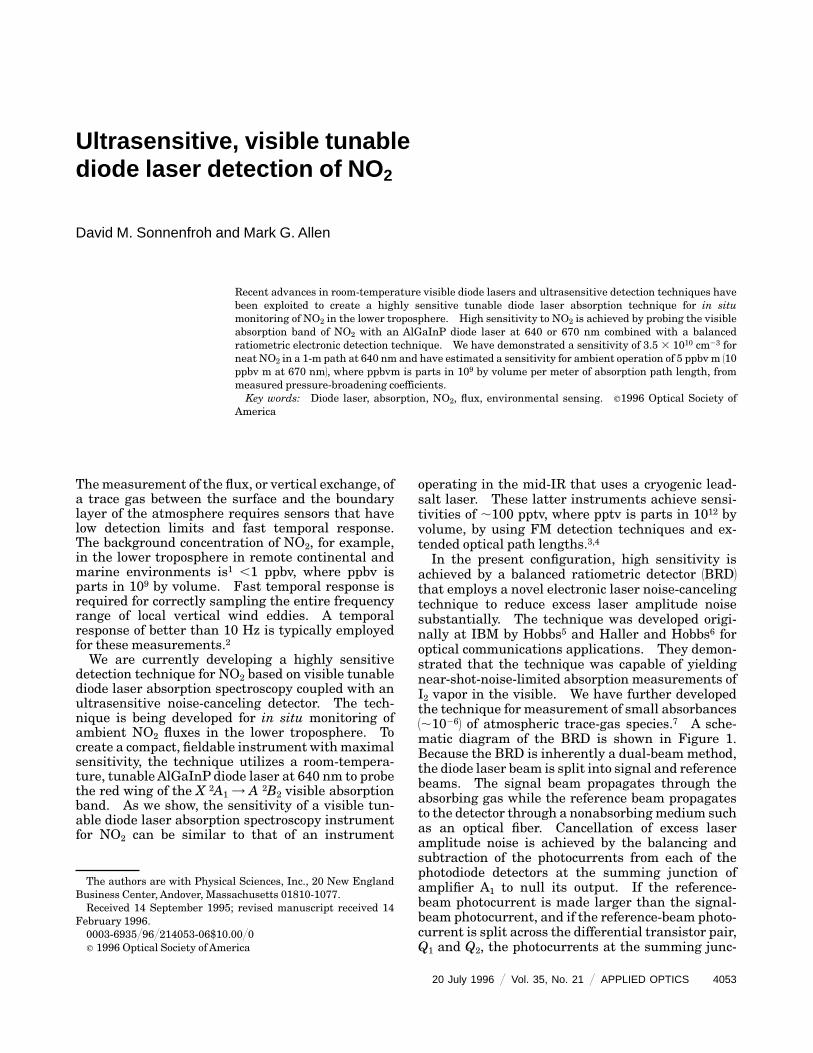
achieved by a balanced ratiometric detector 1BRD2that employs a novel electronic laser noise-cancelingtechnique to reduce excess laser amplitude noisesubstantially. The technique was developed origi-nally at IBM by Hobbs5 and Haller and Hobbs6 foroptical communications applications. They demon-strated that the technique was capable of yieldingnear-shot-noise-limited absorption measurements ofI2 vapor in the visible. We have further developedthe technique for measurement of small absorbances1,10262 of atmospheric trace-gas species.7 A sche-matic diagram of the BRD is shown in Figure 1.Because the BRD is inherently a dual-beam method,the diode laser beam is split into signal and referencebeams. The signal beam propagates through theabsorbing gas while the reference beam propagatesto the detector through a nonabsorbingmedium suchas an optical fiber. Cancellation of excess laseramplitude noise is achieved by the balancing andsubtraction of the photocurrents from each of thephotodiode detectors at the summing junction ofamplifier A1 to null its output. If the reference-beam photocurrent is made larger than the signal-beam photocurrent, and if the reference-beam photo-current is split across the differential transistor pair,Q1 and Q2, the photocurrents at the summing junc-
20 July 1996 @ Vol. 35, No. 21 @ APPLIED OPTICS 4053
tion can be balanced electronically by adjustment ofthe base-emitter voltage of that pair. The result isto create an electronic photocurrent balance, incontrast to the more familiar optical intensity bal-ance of dual-beam spectrometers. Common-modeexcess laser amplitude noise in the signal and thereference channels is reduced by more than 50 dB.We have used the BRD to make near-shot-noise-limited absorption measurements on several speciesin the near-IR.7The BRD has available as outputs voltages that
are proportional to the linear photodiode currents.In addition, the output of the integrating amplifier,V1, is also available. This signal depends on theratio of these currents and is given by
V1 5 2G ln1IrefIsig2 12 , 112
where G is the gain of the integrating amplifier andIref and Isig are the photodiode currents. When theweak absorbance limit is applied to Eq. 112, it is easyto show that V1 is linearly proportional to theabsorbance and therefore to the number density ofthe absorbing species. The laser wavelength isscanned across the absorption feature of interestwhile V1 is measured so that the full absorption lineshape is recorded. When the line shape is directlyrecorded and the result is integrated, temperatureand pressure variations in that line shape are re-moved from the measurement.The detection sensitivity for NO2 of our technique
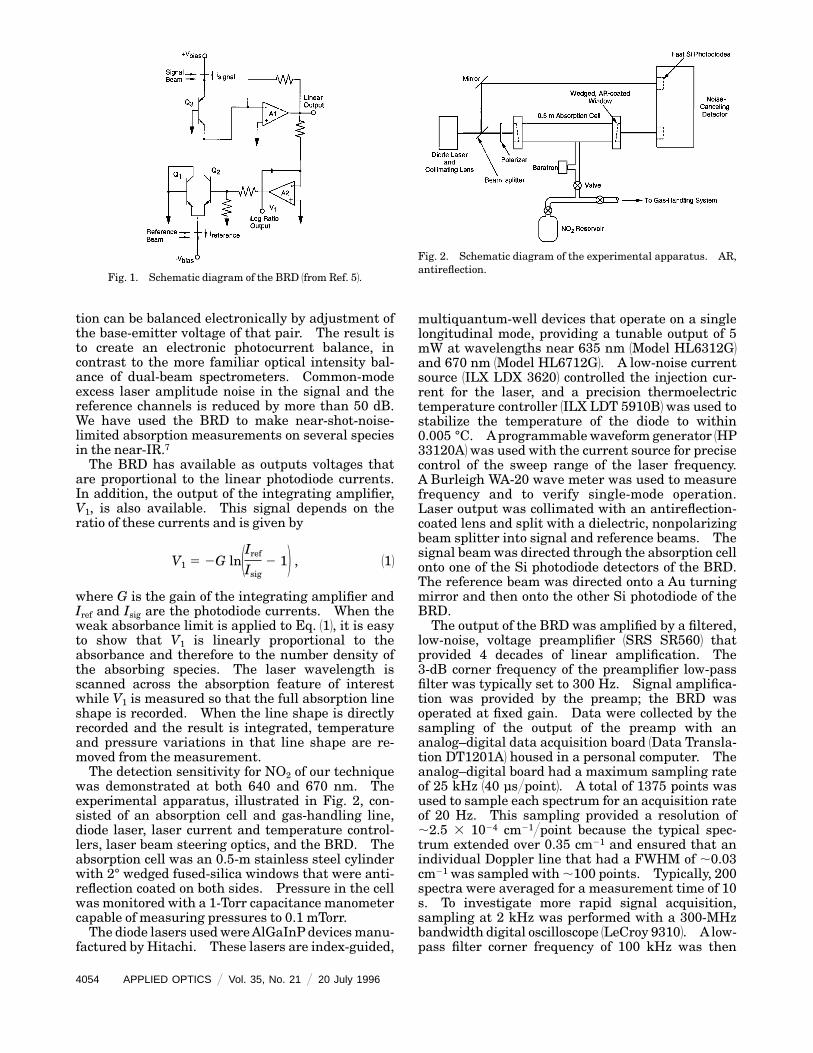
was demonstrated at both 640 and 670 nm. Theexperimental apparatus, illustrated in Fig. 2, con-sisted of an absorption cell and gas-handling line,diode laser, laser current and temperature control-lers, laser beam steering optics, and the BRD. Theabsorption cell was an 0.5-m stainless steel cylinderwith 2° wedged fused-silica windows that were anti-reflection coated on both sides. Pressure in the cellwas monitored with a 1-Torr capacitance manometercapable of measuring pressures to 0.1 mTorr.The diode lasers usedwereAlGaInP devicesmanu-
factured by Hitachi. These lasers are index-guided,
Fig. 1. Schematic diagram of the BRD 1from Ref. 52.
4054 APPLIED OPTICS @ Vol. 35, No. 21 @ 20 July 1996
multiquantum-well devices that operate on a singlelongitudinal mode, providing a tunable output of 5mW at wavelengths near 635 nm 1Model HL6312G2and 670 nm 1Model HL6712G2. A low-noise currentsource 1ILX LDX 36202 controlled the injection cur-rent for the laser, and a precision thermoelectrictemperature controller 1ILX LDT 5910B2 was used tostabilize the temperature of the diode to within0.005 °C. Aprogrammable waveform generator 1HP33120A2was used with the current source for precisecontrol of the sweep range of the laser frequency.A Burleigh WA-20 wave meter was used to measurefrequency and to verify single-mode operation.Laser output was collimated with an antireflection-coated lens and split with a dielectric, nonpolarizingbeam splitter into signal and reference beams. Thesignal beamwas directed through the absorption cellonto one of the Si photodiode detectors of the BRD.The reference beam was directed onto a Au turningmirror and then onto the other Si photodiode of theBRD.The output of the BRD was amplified by a filtered,
low-noise, voltage preamplifier 1SRS SR5602 thatprovided 4 decades of linear amplification. The3-dB corner frequency of the preamplifier low-passfilter was typically set to 300 Hz. Signal amplifica-tion was provided by the preamp; the BRD wasoperated at fixed gain. Data were collected by thesampling of the output of the preamp with ananalog–digital data acquisition board 1Data Transla-tion DT1201A2 housed in a personal computer. Theanalog–digital board had a maximum sampling rateof 25 kHz 140 µs@point2. A total of 1375 points wasused to sample each spectrum for an acquisition rateof 20 Hz. This sampling provided a resolution of,2.5 3 1024 cm21@point because the typical spec-trum extended over 0.35 cm21 and ensured that anindividual Doppler line that had a FWHM of ,0.03cm21 was sampled with ,100 points. Typically, 200spectra were averaged for a measurement time of 10s. To investigate more rapid signal acquisition,sampling at 2 kHz was performed with a 300-MHzbandwidth digital oscilloscope 1LeCroy 93102. A low-pass filter corner frequency of 100 kHz was then
Fig. 2. Schematic diagram of the experimental apparatus. AR,antireflection.

used. A total of 1000 points was used to sampleeach spectrum. Typically, 2000 spectra were lin-early averaged for a measurement time of 1 s.All NO2 samples 1Matheson, 99.5%2 were purified
by a series of three freeze–pump–thaw cycles. NO2was condensed by cooling to 280 °C with a slurry ofC2H5OH and liquid N2. Uncondensed gas waspumped away, and the solid was warmed to allowsublimation back to the gas phase. The cycle wasrepeated until the solid phase was white. PurifiedNO2 was stored in a stainless steel sample cylinder.The purification process was monitored with bothvisible and low-resolution IR absorption spectra.Samples were prepared immediately before use.Absorption spectra were recorded with low-pres-
sure, neat samples of NO2. A typical experimentalmeasurement consisted of filling the absorption cellwith ,1 Torr of NO2. The pressure of NO2 in theabsorption cell was then regulated by the cooling ofan attached cold finger with a slurry of C2H5OH andliquid N2 to temperatures between2112 and260 °C.NO2 condensed to N2O4 in the cold finger and thepressure of NO2 in the cell was determined by theequilibrium vapor pressure at the temperature ofthe cold finger. 1Although the vapor in equilibriumwith the solid N2O4 phase is a mixture of NO2 andN2O4, N2O4 is a minor fraction of the vapor phase atroom temperature for the pressures of interest, giventhe equilibrium constant for this reaction.82 Thetemperature was varied by a change in the composi-tion of the slurry. At each temperature, the cellpressure was recorded and the ratiometric output ofthe BRD was averaged and stored. A baseline,determined by a fit to a third-order polynomial, wassubtracted from each spectrum and the area underthe absorption feature was integrated. In thisman-ner, absorbance versus NO2 concentration was mea-sured.Survey spectra in the region near 640 nm were
obtained to identify isolated strong lines for sensitiv-itymeasurements. Figure 3 presents a survey spec-trum near 15646.5 cm21 1638.929 nm2 for 0.5-TorrNO2 11.6 3 1016 cm232; it is an average of ten spectra.Lines were identified by reference to the spectralatlas of Hsu et al.9 The absorption cross section ofthe transition at 15646.337 cm21 1638.951 nm2 wasmeasured with the linear photodiode outputs of the
Fig. 3. Survey spectrum near 15645.5 cm21 1638.929 nm2.
BRD. These signals are direct outputs from thesignal and the reference photodiodes and are easilyquantified into absolute absorption measurementsfor large absorbances 1a p 10232. The average crosssection was measured to be 1.9 3 10 220 cm2 6 0.5 310220 cm2 at the peak of the transition. This iscomparable with a value of 1.143 10220 cm2 obtainedfrom a low-resolution spectrum of Schneider et al.10The cross section is the product of the line strength,S1T2, and the line-shape function, g1n 2 n02. Here, gis the Doppler line-shape function, gD. We cancalculate S from the measured cross section by usingthe measured linewidth, as gD is directly related tothe absorption linewidth by
gD1n 5 n02 52
DnD1ln 2p 2
1@2. 122
Here n0 is the transition frequency and DnD is theDoppler linewidth 1FWHM2:
DnD 5n0
c 18kT ln 2
m 21@2
, 132
where T is the temperature and m is the molecularmass. We measured the Doppler linewidth to be0.03 cm21 and calculated gD1n 5 n02 5 31 cm and S 56.1 3 10222 cm21@1molecule cm222.The sensitivity of the technique was determined
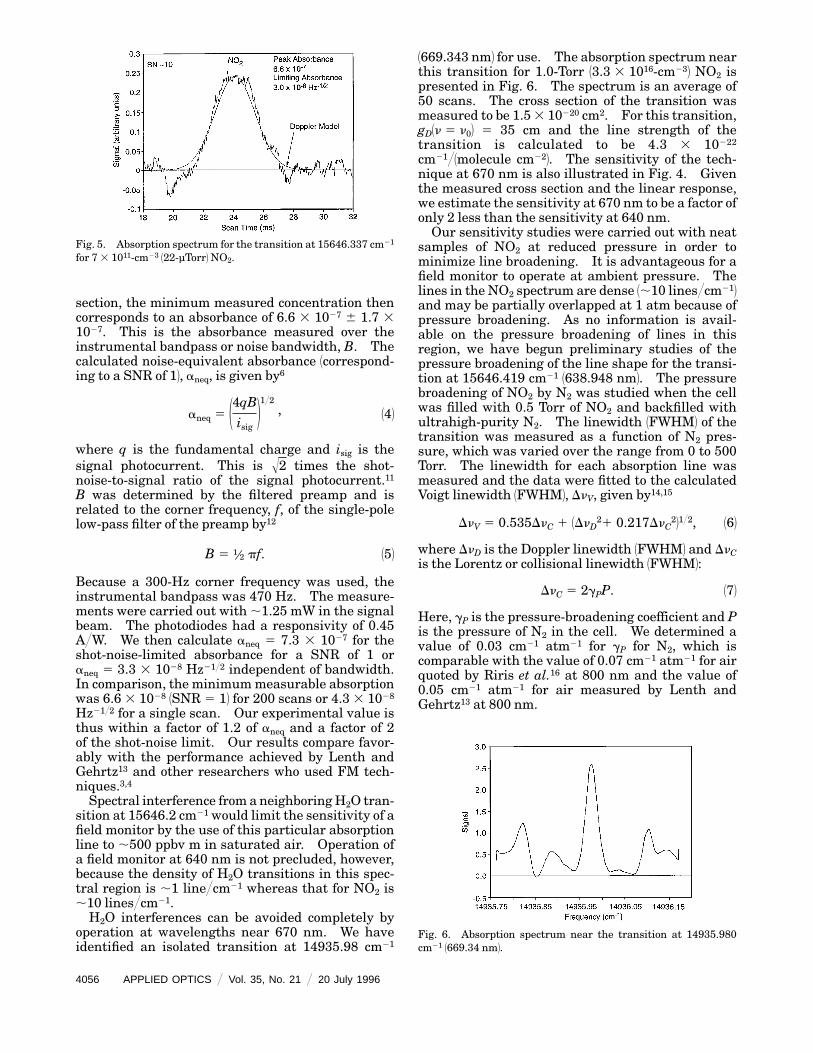
by the measurement of the absorption of the transi-tion at 15646.337 cm21 1638.951 nm2 as a function ofNO2 concentration in the cell. Figure 4 shows theintegrated absorption signal plotted versus mea-sured cell pressure for two different experimentaldata sets. The linearity of the response is excellentand extends over the entire measurement range 14decades2. Theminimum concentrationmeasured inthe experiment was 7 3 1011 cm23. The absorptionspectrum for this concentration is presented in Fig.5. The experimental line shape is well described bya Doppler profile that has a linewidth 1FWHM2 of,0.03 cm21. The calculated Doppler linewidth is0.029 cm21. The spectrum is characterized by asignal-to-noise ratio 1SNR2 of 10 and is an average of200 scans at 20-Hz modulation accumulated over asignal acquisition time of 10 s. The estimated ulti-mate sensitivity is thus 3.53 1010 cm23 in a 1-m pathfor this acquisition time. With the measured cross
Fig. 4. Absorption for the transition at 15646.337 cm21 and forthe transition at 14935.980 cm21 versus NO2 number density.
20 July 1996 @ Vol. 35, No. 21 @ APPLIED OPTICS 4055
section, the minimum measured concentration thencorresponds to an absorbance of 6.6 3 1027 6 1.7 31027. This is the absorbance measured over theinstrumental bandpass or noise bandwidth, B. Thecalculated noise-equivalent absorbance 1correspond-ing to a SNR of 12, aneq, is given by6
aneq 5 14qBisig 21@2
, 142
where q is the fundamental charge and isig is thesignal photocurrent. This is Œ2 times the shot-noise-to-signal ratio of the signal photocurrent.11B was determined by the filtered preamp and isrelated to the corner frequency, f, of the single-polelow-pass filter of the preamp by12
B 5 1⁄2 pf. 152
Because a 300-Hz corner frequency was used, theinstrumental bandpass was 470 Hz. The measure-ments were carried out with ,1.25 mW in the signalbeam. The photodiodes had a responsivity of 0.45A@W. We then calculate aneq 5 7.3 3 1027 for theshot-noise-limited absorbance for a SNR of 1 oraneq 5 3.3 3 1028 Hz21@2 independent of bandwidth.In comparison, the minimummeasurable absorptionwas 6.6 3 1028 1SNR 5 12 for 200 scans or 4.3 3 1028
Hz21@2 for a single scan. Our experimental value isthus within a factor of 1.2 of aneq and a factor of 2of the shot-noise limit. Our results compare favor-ably with the performance achieved by Lenth andGehrtz13 and other researchers who used FM tech-niques.3,4Spectral interference from a neighboringH2O tran-
sition at 15646.2 cm21 would limit the sensitivity of afield monitor by the use of this particular absorptionline to ,500 ppbv m in saturated air. Operation ofa field monitor at 640 nm is not precluded, however,because the density of H2O transitions in this spec-tral region is ,1 line@cm21 whereas that for NO2 is,10 [email protected] interferences can be avoided completely by
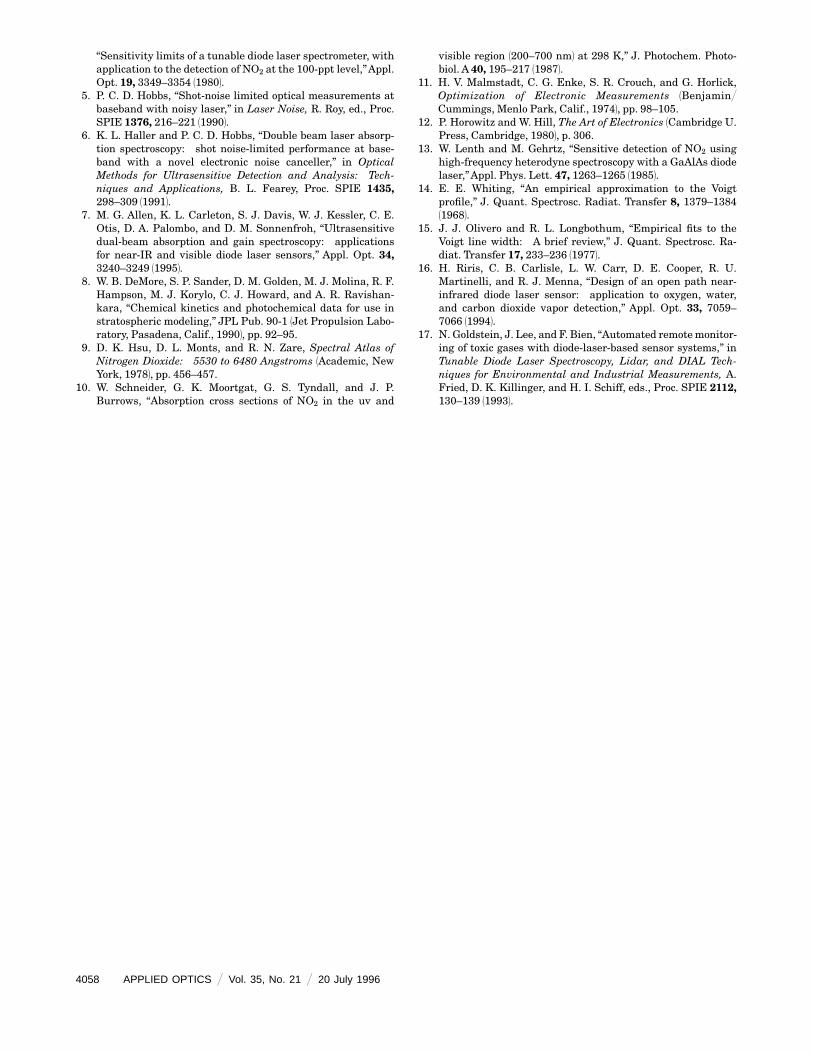
operation at wavelengths near 670 nm. We haveidentified an isolated transition at 14935.98 cm21
Fig. 5. Absorption spectrum for the transition at 15646.337 cm21
for 7 3 1011-cm23 122-µTorr2NO2.
4056 APPLIED OPTICS @ Vol. 35, No. 21 @ 20 July 1996
1669.343 nm2 for use. The absorption spectrum nearthis transition for 1.0-Torr 13.3 3 1016-cm232 NO2 ispresented in Fig. 6. The spectrum is an average of50 scans. The cross section of the transition wasmeasured to be 1.53 10220 cm2. For this transition,gD1n 5 n02 5 35 cm and the line strength of thetransition is calculated to be 4.3 3 10222
cm21@1molecule cm222. The sensitivity of the tech-nique at 670 nm is also illustrated in Fig. 4. Giventhe measured cross section and the linear response,we estimate the sensitivity at 670 nm to be a factor ofonly 2 less than the sensitivity at 640 nm.Our sensitivity studies were carried out with neat
samples of NO2 at reduced pressure in order tominimize line broadening. It is advantageous for afield monitor to operate at ambient pressure. Thelines in the NO2 spectrum are dense 1,10 lines@cm212and may be partially overlapped at 1 atm because ofpressure broadening. As no information is avail-able on the pressure broadening of lines in thisregion, we have begun preliminary studies of thepressure broadening of the line shape for the transi-tion at 15646.419 cm21 1638.948 nm2. The pressurebroadening of NO2 by N2 was studied when the cellwas filled with 0.5 Torr of NO2 and backfilled withultrahigh-purity N2. The linewidth 1FWHM2 of thetransition was measured as a function of N2 pres-sure, which was varied over the range from 0 to 500Torr. The linewidth for each absorption line wasmeasured and the data were fitted to the calculatedVoigt linewidth 1FWHM2, DnV, given by14,15
DnV 5 0.535DnC 1 1DnD21 0.217DnC
221@2, 162
where DnD is the Doppler linewidth 1FWHM2 and DnCis the Lorentz or collisional linewidth 1FWHM2:
DnC 5 2gPP. 172
Here, gP is the pressure-broadening coefficient and Pis the pressure of N2 in the cell. We determined avalue of 0.03 cm21 atm21 for gP for N2, which iscomparable with the value of 0.07 cm21 atm21 for airquoted by Riris et al.16 at 800 nm and the value of0.05 cm21 atm21 for air measured by Lenth andGehrtz13 at 800 nm.
Fig. 6. Absorption spectrum near the transition at 14935.980cm21 1669.34 nm2.

By the use of the measured pressure-broadeningcoefficient and Eq. 162, a Voigt linewidth of 0.073 cm21
can be calculated for the linewidth of a single line atambient 11-atm2 pressure. Given the line density of,10 lines@cm21, lines may be partially overlapped at1 atm because of pressure broadening. However,our work indicates that features remain sufficientlyresolved for practical use at ambient pressure.Figure 7 shows that the line at 15646.419 cm21 doesblend with nearby features for 664-Torr N2 bath gas.These features are much weaker than the mainabsorption line, however, and the blended featureremains relatively isolated from strong neighboringfeatures at ambient pressure. Simplemodelingwithfull Voigt line shapes and the measured pressure-broadening coefficient confirms this observation.In a worst-case example, two lines that have equiva-lent line strengths and are separated by 0.1 cm21 1theaverage separation2 remain resolved to 60% of thepeak absorbance value and are thus resolved accord-ing to the Rayleigh criterion.For practical field use at ambient pressure, an
isolated feature composed of one strong line, such asthe one illustrated in Fig. 7, could be chosen formonitoring NO2. The absorbance of this featureshould be measured as a function of temperatureand pressure to provide a calibrated direct measureof ambient concentration. It should be noted thatthe absorption spectrum of NO2 in this region iscomposed of both a discrete component and anapparent effective continuum component. The up-per state responsible for the continuum absorptionhas not yet been identified. Ourmeasurement tech-nique is sensitive only to the differential absorptionrepresented by the discrete component.Calculations of the absorption line shape with a
Voigt profile and the measured pressure-broadeningcoefficient were performed to determine the effect onsensitivity for operation at atmospheric pressure.Operation at ambient pressure would result in anincrease of a factor of ,3 in the linewidth with acorresponding decrease by a factor of ,3 in the peakabsorption. In this case, the sensitivity at 639 nmwould decrease to 1011 cm23 15 ppbv2 in a 1-m path,even though the entire line shape is measured. Wecompare our estimated sensitivity with the results of
Fig. 7. Absorption spectrum for the transition at 15646.419 cm21
for 0.5-Torr NO2 and 0 and 664-Torr N2.
other workers in Table 1. The other studies listedused FM techniques for signal detection.Given our sensitivity at 640 nm of 5 ppbv for a 1-m
path 1which corresponds to an absorbance of6.6 3 10272, a field version of this instrument mightachieve a sensitivity of 76 pptv 1,150 pptv at 670 nm2with an optical path length of 100 m afforded by amultipass Herriott cell and assuming a practicalabsorbance attainable in the field of 1026.3,4,16 Thissensitivity is equivalent to the field-demonstratedperformance of a mid-IR cryogenic lead-salt diodelaser spectrometer when FM detection techniquesand an extended path length are used. Etalonfringes occurring from use of a multipass cell canpotentially limit the performance of any highly sensi-tive optical absorbance detection technique. How-ever, several techniques have been developed tominimize these effects, including dithering 1piezoelec-tric modulation2 of an optical element as well asseveral others, all of which are independent ofdetection technology and have been demonstrated inthe field. Because the diode lasers used in thiswork can be scanned across absorption features veryrapidly, the time response of our technique is limitedby the bandwidth of the BRD, which can be as highas ,100 kHz. Data collection rates exceeding 10Hz are possible, evenwith appropriate signal averag-ing. Thus this technique appears to afford both thesensitivity and temporal response for ground-levelflux monitoring or airborne point sampling of NO2.
The authors gratefully acknowledge discussionswithWinston Luke and support from theU.S. Depart-ment of Commerce, National Oceanic and Atmo-spheric Administration under contract 50-DNKA-4-00094.
References1. B. J. Finlayson-Pitts and J. N. Pitts Jr., Atmospheric Chemis-
try 1Wiley, NewYork, 19862, pp. 368–369.2. A. C. Delany, ‘‘Fast-response chemical sensors used for eddy
correlation flux measurements,’’ in Measurement Challengesin Atmospheric Chemistry, L. Newman, ed. 1American Chemi-cal Society, Washington, D.C., 19932, Chap. 3, pp. 91–100.
3. C. R. Webster, R. D. May, C. A. Trimble, R. G. Chave, and J.Kendall, ‘‘Aircraft 1ER-22 laser infrared absorption spectrom-eter 1ALIAS2 for in-situ stratospheric measurements of HCl,N2O, CH4, NO2, HNO3,’’Appl. Opt. 33, 454–472 119942.
4. J. Reid, M. El-Sherbiny, B. K. Garside, and E. A. Ballik,
Table 1. Comparison of Sensitivity versus Wavelength
Wave-length1nm2
Sensitivity
Comment Reference1cm2321parts in 106
by volume2
640 3.5 3 1010 Neat Present work640 1.1 3 1011 0.005 1 atm Present work670 2.2 3 1011 0.010 1 atm Present work760 5.0 3 1013 2 1 atm Goldstein et al.17
800 4.5 3 1013 1.8 1 atm Riris et al.16
835 2.9 3 1011 Neat Lenth and Gehrtz13
6200 9.9 3 1010 0.004 1 atm Reid et al.4
20 July 1996 @ Vol. 35, No. 21 @ APPLIED OPTICS 4057
‘‘Sensitivity limits of a tunable diode laser spectrometer, withapplication to the detection of NO2 at the 100-ppt level,’’Appl.Opt. 19, 3349–3354 119802.
5. P. C. D. Hobbs, ‘‘Shot-noise limited optical measurements atbaseband with noisy laser,’’ in Laser Noise, R. Roy, ed., Proc.SPIE 1376, 216–221 119902.
6. K. L. Haller and P. C. D. Hobbs, ‘‘Double beam laser absorp-tion spectroscopy: shot noise-limited performance at base-band with a novel electronic noise canceller,’’ in OpticalMethods for Ultrasensitive Detection and Analysis: Tech-niques and Applications, B. L. Fearey, Proc. SPIE 1435,298–309 119912.
7. M. G. Allen, K. L. Carleton, S. J. Davis, W. J. Kessler, C. E.Otis, D. A. Palombo, and D. M. Sonnenfroh, ‘‘Ultrasensitivedual-beam absorption and gain spectroscopy: applicationsfor near-IR and visible diode laser sensors,’’ Appl. Opt. 34,3240–3249 119952.
8. W. B. DeMore, S. P. Sander, D. M. Golden, M. J. Molina, R. F.Hampson, M. J. Korylo, C. J. Howard, and A. R. Ravishan-kara, ‘‘Chemical kinetics and photochemical data for use instratospheric modeling,’’ JPL Pub. 90-1 1Jet Propulsion Labo-ratory, Pasadena, Calif., 19902, pp. 92–95.
9. D. K. Hsu, D. L. Monts, and R. N. Zare, Spectral Atlas ofNitrogen Dioxide: 5530 to 6480 Angstroms 1Academic, NewYork, 19782, pp. 456–457.
10. W. Schneider, G. K. Moortgat, G. S. Tyndall, and J. P.Burrows, ‘‘Absorption cross sections of NO2 in the uv and
4058 APPLIED OPTICS @ Vol. 35, No. 21 @ 20 July 1996
visible region 1200–700 nm2 at 298 K,’’ J. Photochem. Photo-biol. A 40, 195–217 119872.
11. H. V. Malmstadt, C. G. Enke, S. R. Crouch, and G. Horlick,Optimization of Electronic Measurements 1Benjamin@Cummings, Menlo Park, Calif., 19742, pp. 98–105.
12. P. Horowitz and W. Hill, The Art of Electronics 1Cambridge U.Press, Cambridge, 19802, p. 306.
13. W. Lenth and M. Gehrtz, ‘‘Sensitive detection of NO2 usinghigh-frequency heterodyne spectroscopy with a GaAlAs diodelaser,’’Appl. Phys. Lett. 47, 1263–1265 119852.
14. E. E. Whiting, ‘‘An empirical approximation to the Voigtprofile,’’ J. Quant. Spectrosc. Radiat. Transfer 8, 1379–1384119682.
15. J. J. Olivero and R. L. Longbothum, ‘‘Empirical fits to theVoigt line width: A brief review,’’ J. Quant. Spectrosc. Ra-diat. Transfer 17, 233–236 119772.
16. H. Riris, C. B. Carlisle, L. W. Carr, D. E. Cooper, R. U.Martinelli, and R. J. Menna, ‘‘Design of an open path near-infrared diode laser sensor: application to oxygen, water,and carbon dioxide vapor detection,’’ Appl. Opt. 33, 7059–7066 119942.
17. N. Goldstein, J. Lee, and F. Bien, ‘‘Automated remotemonitor-ing of toxic gases with diode-laser-based sensor systems,’’ inTunable Diode Laser Spectroscopy, Lidar, and DIAL Tech-niques for Environmental and Industrial Measurements, A.Fried, D. K. Killinger, and H. I. Schiff, eds., Proc. SPIE 2112,130–139 119932.