ultrasonic inspection technique possibilities for crack ... · ultrasonic inspection techniques...
TRANSCRIPT

Cast Stainless Steel
Ultrasonic Inspection Techniques Possibilities for Crack Detection in Centrifugal Cast Stainless
Steel L. Zhang, M Avioli, J. Van Velsor, J. L. Rose, FBS Inc., USA, B. Lu, J. Lindberg, EPRI, USA
ABSTRACT
Modelling was used to assist the development of guided wave and bulk wave techniques for inspecting
centrifugally cast stainless steel (CCSS). Some bulk wave techniques are effective for specific but not
all CCSS structures. Guided waves can be used to determine grain structure as it varies around the
circumference of a pipe, and then to determine the appropriate bulk wave and/or guided wave
technique for inspecting specific regions of the pipe. Finite-element modelling of bulk wave and
guided wave propagation in anisotropic media (e.g. CCSS) also provided the basis for probe design
along with the appropriate ultrasonic parameters for CCSS inspection. This work was extended to
include studies on the inspection of large weldments (OD ~ 30” or greater) composed of dissimilar
metals such as Inconel 82, Inconel 82/182, and cast austenitic stainless steel (CASS). The results of
these studies are discussed in this paper.
INTRODUCTION
There is currently no reliable method for inspecting centrifugally cast stainless steel (CCSS). CCSS
piping wall thicknesses are on the order of 3 ½ “ and columnar-dendritic grain structures present a
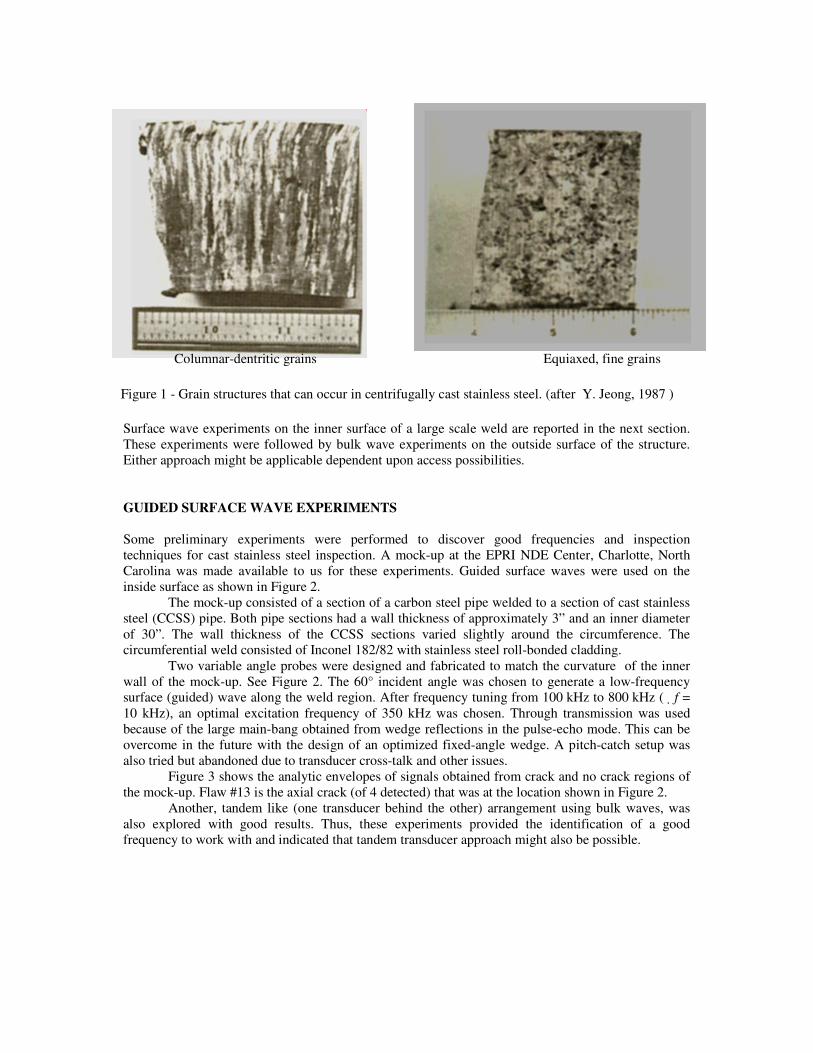
technical inspection challenge regarding present day ultrasonic approaches. See Figure 1. Columnar
grains tend to be near the outside of a pipe and equiaxed grains tend to be near the inside of a pipe.
Modeling provides the understanding necessary to move toward the development of sensors with
appropriate ultrasonic parameters for grain determination and CCSS inspection. Determining the grain
structure prior to examination should provide the understanding necessary to improve the examination
of CCSS.
Finite-element models of CCSS piping were created for studying bulk wave and guided wave
propagation. Modeling results were used as a design basis for sensors for the CCSS inspection and for
characterization of CCSS grain structures as they vary around a pipe’s circumference. Modeling was
supplemented with experimental exercises on the CCSS specimens available at the EPRI NDE Center
in Charlotte, North Carolina. After some preliminary study, two techniques were demonstrated.
Surface wave experiments on the inner surface of a large scale weld are reported in the next section.
These experiments were followed by bulk wave experiments on the outside surface of the structure.
Either approach might be applicable dependent upon access possibilities.
GUIDED SURFACE WAVE EXPERIMENTS
Some preliminary experiments were performed to discover good frequencies and inspection
techniques for cast stainless steel inspection. A mock-up at the EPRI NDE Center, Charlotte, North
Carolina was made available to us for these experiments. Guided surface waves were used on the
inside surface as shown in Figure 2.
The mock-up consisted of a section of a carbon steel pipe welded to a section of cast stainless
steel (CCSS) pipe. Both pipe sections had a wall thickness of approximately 3” and an inner diameter
of 30”. The wall thickness of the CCSS sections varied slightly around the circumference. The
circumferential weld consisted of Inconel 182/82 with stainless steel roll-bonded cladding.
Two variable angle probes were designed and fabricated to match the curvature of the inner
wall of the mock-up. See Figure 2. The 60° incident angle was chosen to generate a low-frequency
surface (guided) wave along the weld region. After frequency tuning from 100 kHz to 800 kHz (��f =
10 kHz), an optimal excitation frequency of 350 kHz was chosen. Through transmission was used
because of the large main-bang obtained from wedge reflections in the pulse-echo mode. This can be
overcome in the future with the design of an optimized fixed-angle wedge. A pitch-catch setup was
also tried but abandoned due to transducer cross-talk and other issues.
Figure 3 shows the analytic envelopes of signals obtained from crack and no crack regions of
the mock-up. Flaw #13 is the axial crack (of 4 detected) that was at the location shown in Figure 2.
Another, tandem like (one transducer behind the other) arrangement using bulk waves, was
also explored with good results. Thus, these experiments provided the identification of a good
frequency to work with and indicated that tandem transducer approach might also be possible.
Figure 1 - Grain structures that can occur in centrifugally cast stainless steel. (after Y. Jeong, 1987 )
Columnar-dentritic grains Equiaxed, fine grains

BULK WAVE EXPERIMENTS FROM THE OUTSIDE SURFACE
Modeling
Centrifugally cast stainless steel (CCSS) pipes can be considered as transversely isotropic media for
low frequency ultrasonic guided waves [1, 2], which are isotropic in the θ-z plane. See Figure 4.
Our studies have shown that the commercial FEM software product, ABAQUS, has excellent
accuracy for simulating ultrasonic wave behavior in arbitrary structures, including anisotropic
materials.
Based on the results of experiments conducted at the EPRI NDE Center, tandem and/or dual element
transducer arrangements were identified as a possibility for assessing local grain structure. Figure 5
Figure 2 - Experimental configuration for detecting an axial crack in
a circumferential large weldment mock-up. Surface waves were
used to detect the axial crack
Figure 3 - Analytic Envelopes of RF signals taken in regions with axial flaws and
without axial flaws. The amplitudes of the singals taken in the axial flaw regions show
a reduction in amplitude. Flaw No13 was the axial crack that was detected

shows the tandem transducer arrangement. The need for a dual element transducer configuration, if
possible for certain angle selections, can improve the S/N ratio by working in a forward scatter mode.
Figure 6 shows the transducer design parameters that must be found.
The key parameters for probe design are the incident (transmitter) angle, �1, receiver angle
�4, and transducer spacing D being a function of �
1, �
2,��
3, and �
4.
The finite-element package ABAQUS was used to generate refracted angle and reflected angle data
based on a sequence of incidence angles. The assumed excitation frequency was 350 kHz. Figure 7
provides an example of the modeling sequence used to acquire the refracted angles for a 3” thick
model of centrifugally cast stainless steel (CCSS). The parameters of Figure 6 were used for the
model. A similar sequence was calculated for obtaining reflected angles.
The results for both cases are shown in Figures 8a. and 8b.. In Figure 8a., a least squares
power function provided an excellent fit to the data save one point. [Sinusoidal segment]
RESULTS
Figure 9 shows the result of combining these data into a form amenable for transducer design. Table 1
shows selected design parameters.
Note in Table 1, the 55o incident angle case, that the distance between the transducer and receiver is
negligible. This means that the transducers must be side-by-side and will need a “roof” angle that
provides a path from the transmitter to the receiver. Figure 10 shows photographs of a tandem probe
(45o incident, 55
o receive) and a dual element probe (55
o incident, 5
o roof angle), both fabricated
according to the design values in Table 1.
EXPERIMENTAL RESULTS
Initial experiments on a CCSS large weldment with these types of transducers showed the
complications of dealing with CCSS and tandem probe design. The purpose of these experiments was
not the end use, grain characterization, but rather for an evaluation of the transducer design approach.
Grain characterization is considered as future work at this time.
[ ]
=
3131
3131
2323
333322331133
223322221122
113311221111
00000
00000
00000
000
000
000
C
C
C
CCC
CCC
CCC
C
GPaCCC
GPaC
GPaC
GPaCC
GPaCC
GPaCC
5.802/)(
205
5.88
125
5.249
133
223333332323
1111
2233
31311212
33332222
11331122
=−=
=
=
==
==
==
Figure 4 - Reference directions for cylindrical coordinates
and the stress tensor for Hooke’s law as used for modeling.

Figure 11 shows one of the complications, crosstalk between transducers, and how it was handled.
Figure 11a. shows the unprocessed results in a region of a 78% through wall crack. The 45o/55
o was
placed outside of the flaw region and is then walked toward the crack region. Figure 11a. and 11b.
were taken outside of the flaw region. The signals were comprised mostly of coherent noise from
transducer crosstalk. The overall character of the signals did not change with position In Figure 11c.
there is a large echo from the 78% through-wall crack along with some coherent noise. The flaw echo
was verified by rastering the probe back and forth and watching the echo move in time.
To minimize the coherent noise in the signals and to improve the signal-to-noise ratio of the
flaw echo, a spatial averaging technique was employed. Essentially, the signals seen in Figure 11a.
and Figure 11b. were averaged together to produce a characteristic signal. Since the majority of
signals do not contain a flaw, the average will be representative of the coherent noise signal. The
average signal was then subtracted from all collected signals and the ones containing spurious echoes
(such as flaw echoes) showed an increase in signal-to-noise ratio, such as seen in Figure 11d. for the
78% through-wall crack.
CCSS
Axial crack
Transmitter
Receiver
Transmitter
Receiver
CCSS Circumferential crack
Figure 5 - Modeling of guided wave propagation in CCSS suggests
that a “tandem” transducer arrangement may be effective for
detecting cracks in CCSS. Note that Snell’s law no longer holds for
the columnar grain structure.

Figure 7 - Modelling results of finite-element simulations for refracted angle �2
versa input angle �1
when the material is CCSS
Figure 6 - Schematic showing the definitions of the various angles used to characterize wave
interactions with a planar defect and to provide tandem angle beam transducer design
parameters, angles φ and φ 4 and D
φ2 = 9o
φ1 = 30o
φ2 = 12o
φ1 = 35o

φ1 = 40o
φ2 = 18o
φ1 = 45o
φ2 = 25o
φ2 = 50o
φ1 = 55o
φ2 = 47o
φ1 = 50o

φ2 = 50o
φ1 = 55o
φ2 = 60o
φ1 = 60o
Figure 7 (continued) - Modeling results of finite-element simulations for
refracted angle φ2 versa input angle φ
1 when the material is CCSS
φ2 = 90o φ1 =70
o Surface wave
Figure 7 (continued) - Modelling results of finite-element simulations for
refracted angle φ2 versa input angle φ
1 when the material is CCSS
φ2 = 70o
φ1 = 65o

CONCLUDING REMARKS
An experimental / numerical modelling method was developed to act as a basis for transducer design
for an CCSS anisotropic material.
Guided surface waves
Experiments on a large scale CCSS weldment mock-up showed that, with careful attention to incident
angles and excitation frequencies, guided surface waves can be used to effectively defect cracks in
CCSS. Variable angle probes and frequency scanning facilitated the discovery of a good angle and
frequency for CCSS crack detection. Eleven of eleven defects in the mock-up were detected.
Bulk waves
Bulk wave experiments on the exterior surface of mock-up prior to modeling indicated that 350 kHz as
a particularly good frequency for the CCSS specimens at hand. The Hooke’s law stress tensor [2] for
CCSS was formulated with the ABAQUS finite-element modeling package to obtain design criteria
for transducer angle separation distances. These angles and transducer separation distances were based
on 350 kHz excitation and a 3” CCSS wall thickness.
Two sets of bulk wave transducers were designed and fabricated; one tandem, one dual
element. For evaluation purchases, the transducers were used on the previously mentioned mock-up.
Crosstalk between transducers was encountered when evaluating the transducers. Spatial averaging
was used to reduce the crosstalk (or coherent noise) from signals.
Figure 8 - (a.) Comparison between raw (FE model) refraction data and a least squares power
law fit. The correlation between the power law and the data is extremely high. R2 =
coefficient of determination or the square of the correlation coefficient; R = 0.991
(b.) The estimated relationship between incident angle, φ1, and reflected angle, φ
3, based on
finite element modelling
a. b.

Future work
Future work will involve well characterized specimens, in terms of grain structure, and the cataloguing
of those transducer designs most effective for penetrating those structures while exhibiting good S/N
ratios prior to carrying this sensor design data and data acquisition concept to the field. Crosstalk
reduction via hardware (e.g. damping material) and via signal processing will also be implemented.
One possible signal processing technique would be split-spectrum processing [See 3, 4].
Figure 9 - The graphic shows the empirical relationship between
angles. The table shows the relationships between all angles and
the wedge separation distances. The highlighted items are presently
being fabricated
y = 1.8009e0.0595x
R2 = 0.9719
0
10
20
30
40
50
60
70
0 10 20 30 40 50 60 70
φ1, φ4
φ 2,
φ 3
φ1
φ2
φ3
φ4
( )
−=
0595.0
8009.1lnln yx

φ1 φ 2 φ 3 φ 4 D (inches)
35 13.4 35.2 50.0 1.4
40 19.6 43.7 53.6 1.8
45 26.3 47.6 55.0 1.8
50 41.2 48.1 55.2 0.72
55 48.9 48.2 55.2 -0.08*
60 56.8 47.7 55.1 -1.29*
Table 1 - The relationship between all angles and wedge separation
distance. “*” indicates the receiver is ahead of the transmitter
45o – 55
o Tandem probe

55o Duel element probe [5º roof angle]
Figure 10 - Photographs of prototype probes for
CCSS

Figure 11 - Waveforms gathered from a 3” thick CCSS specimen. a. and b.
acquired at different positions away from the defect region. c. was acquired
within the defect region. Waveforms a. and b. were averaged and the result
and subtracted from waveform c. to produce waveform d. which exhibited an
improved S/N ratio. The defect was a 78% through wall circumferential crack

REFERENCES
1) You, Z. et al., “Numerical modeling of elastic wave propagation in
anisotropic materials”, Review of Progress in Quantitative Nondestructive
Evaluation, vol. 7A, pp 23-30, 1988
2) Y. Jeong, An ultrasonic material state classifier for elastically anisotropic
materials, PH.D thesis at Drexel Univ., 1987
3) P. Karpur, P.M. Shankar, J.L. Rose and V.L. Newhouse. “Split spectrum
processing: optimizing the processing parameters using minimization.“
Ultrasonics(1987) 25 204-208
4) Shankar, P. Mohana; Newhouse, Vernon L.; Rose, Joseph L.;
Karpur, Prasanna, “Split-spectrum processing - Analysis of polarity
thresholding algorithm for improvement of signal-to-noise ratio and
detectability in ultrasonic signals,” IEEE Transactions on Ultrasonics,
Ferroelectrics, and Frequency Control (ISSN 0885-3010), vol. 36, Jan.
1989, p. 101-108